A Post by Ovi at peakoilbarrel
All of the oil production data for the US states comes from the EIAʼs Petroleum Supply Monthly. In addition, information from other EIA offices is provided to project future US output. At the end, an analysis of a few different EIA reports is undertaken.
The charts below are updated to November 2019 for the 10 largest US oil producing states (>100 kb/d).
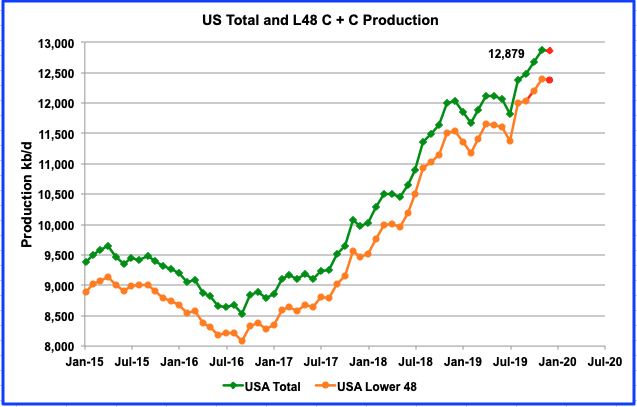
The latest data from the January EIA report shows that US production surged by 203 kb/d in November to reach a new high of 12,879 kb/d. Since June the US has increased output by an average of 164 kb/d/mth. Looking forward to December production, the January Monthly Energy Review (MER) estimates US production for December to be 12,861 kb/d, down 14 kb/d from November and shown in red as the last data point.
If the MER is correct for December at 12,861 kb/d, that means that the January 2020 STEO is too high in their output prediction. They estimate December output to be 12,967 kb/d, 106 kb/d too high.
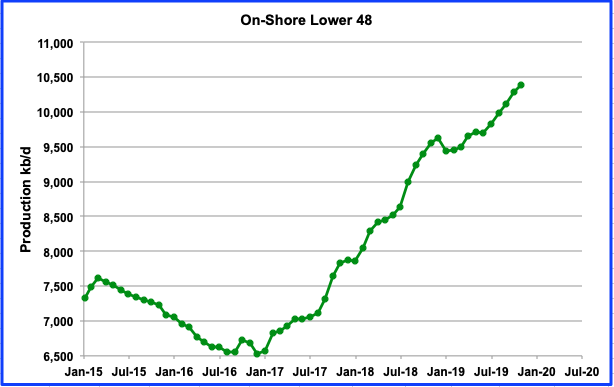
This chart shows the onshore L48 production. What is of interest here is the November increment. It is only 101 kb/d higher than October, 50% of the total US November increment.
US Oil Production by State
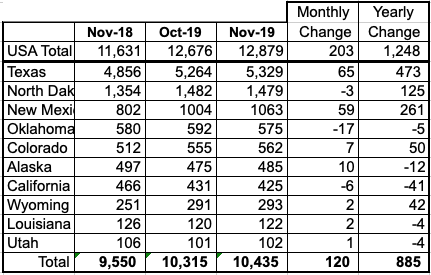
Listed above are the 10 states with production greater than 100 kb/d. These 10 account for 10,435 kb/d (81%) of total US production of 12,879 kb/d in November. Note that the October output was revised up from 12,655 kb/d last month to 12,676 kb/d. The main difference between the US total increment of 203 kb/d and the top 10 increment of 120 kb/d, is an output increase of 91 kb/d from the GOM.
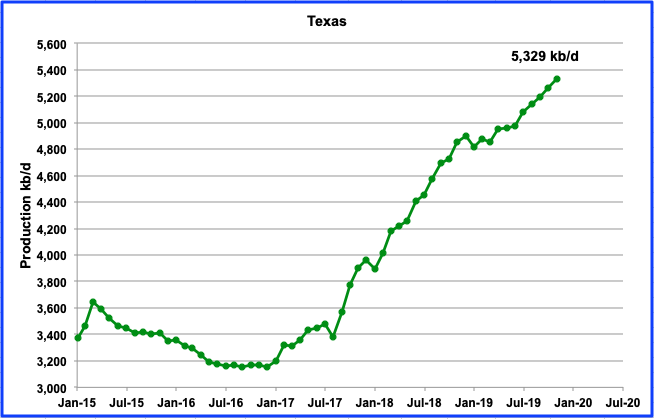
Texas production grew in November by 65 kb/d to 5,329 kb/d. Note that Texas production is now larger than OPEC’s second largest producer, Iraq.
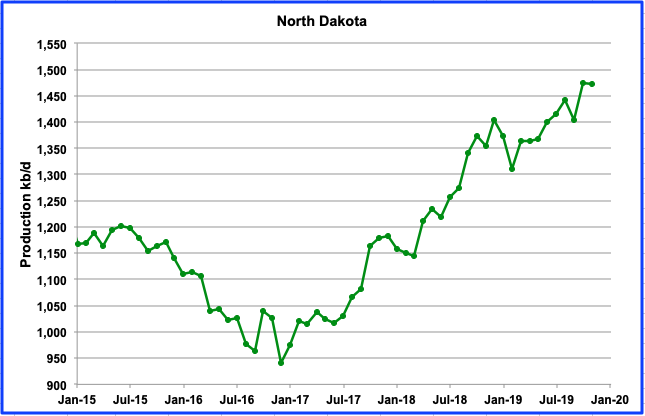
North Dakota oil production was marginally down by 3 kb/d in November to 1,479 kb/d. From the low of December 2016 to November 2019, production has increased by 539 kb/d for an average increase of 15 kb/d/mth. There are no signs of plateauing in North Dakota output at this time. Since August the number of wells completed each month has almost remained constant as it wandered between 97 and 104, with 100 completed in November.
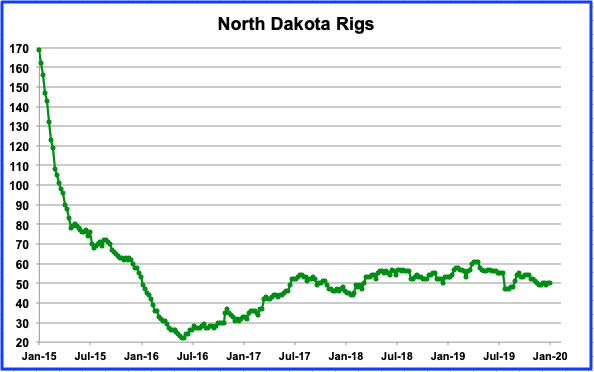
This chart shows the rig count for North Dakota. Note how the minimum rig count occurred in May 2016 while the low in production occurred in December 2016 in the previous chart. At the same time the increase in rig count which started in May 2016 saw increasing output starting seven months later.
From July 2016 to November 2019, the average number of operating rigs was 52.74 with the majority each month being within +/- 5. The maximum was 60 and the minimum 45 for a limited time. Note that starting in December 2016, production rose fairly steadily even though the weekly rig count was fairly steady at 52.74. Using the North Dakota well count from November 2016 to 2019 and using 52.74 for the average number of rigs, gives a rig average productivity of 1.3 wells per rig per month.
Note that over the same time frame, Shale Profile shows an increase of 3,007 wells for the Bakken while the North Dakota data shows 2,592 producing wells. However, it needs to be noted that the Bakken extends into Montana.
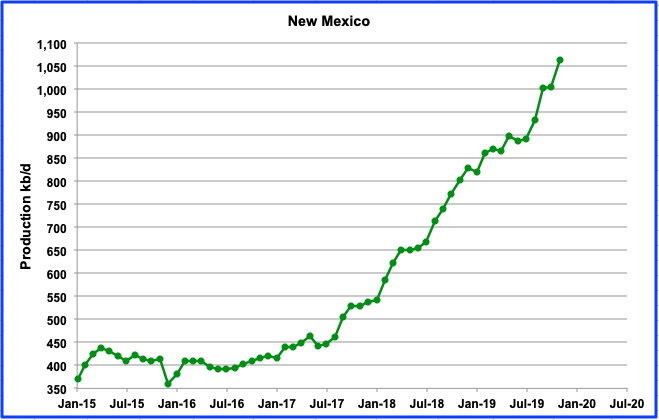
Output in New Mexico continues to make new highs to 1,063 kb/d in November, an increase of 59 kb/d from October. The gain probably comes from the Wolfcamp and Spraberry basins which are part of the Permian and situated in both NM and Texas. The combined output of these two basins in November was 63 kb/d according to the LTO report.
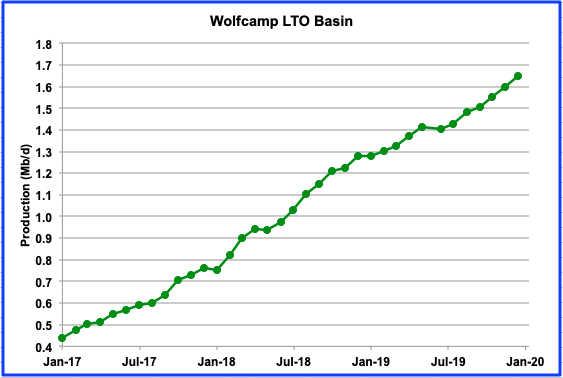
This chart shows the steady rise in output from the Wolfcamp basin. The November gain was 47 kb/d to 1,599 kb/d. The January LTO report projects December output to reach 1,648 kb/d.
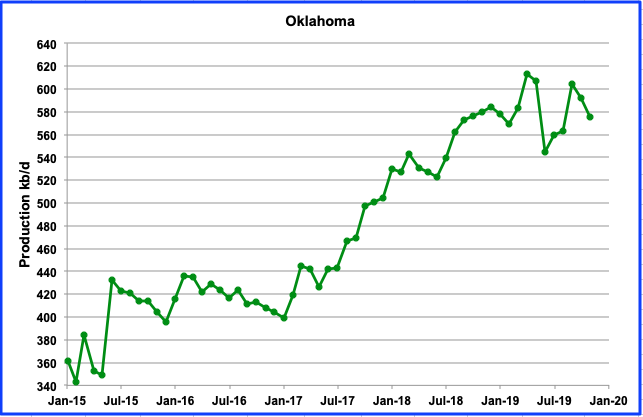
November production was down by 17 kb/d to 575 kb/d. The graph shows indications of peaking or plateauing in Oklahoma. The high occurred in April 2019 at a rate of 619 kb/d. There has been a loss of drilling interest in Oklahoma due to the complex geology that stymied hopes for a “Permian Jr”.
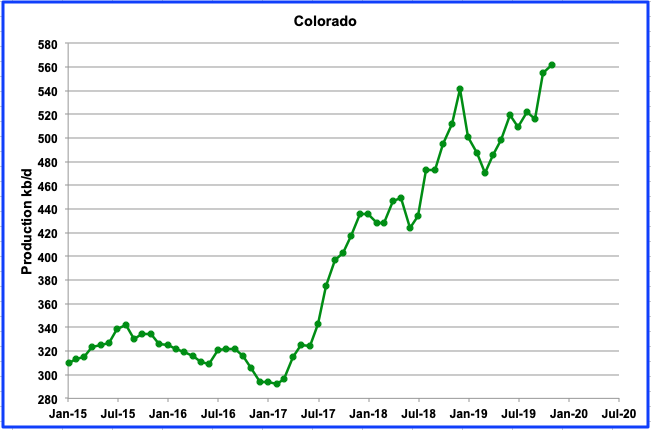
Colorado production was up by 7 kb/d in November to 562 kb/d. This slowing could be the result of new environmental regulations. It may take a few more months to see if the regulations have slowed drilling and output.
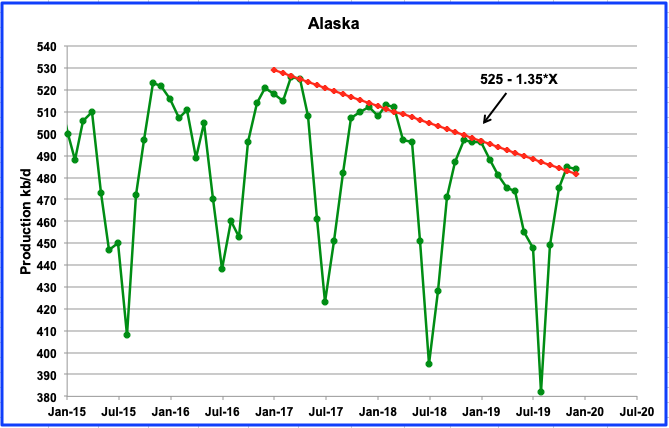
Alaska output increased by 10 kb/d in November to 485 kb/d and reached the down trend line, which is showing decline rate of 1.35 kb/d/mth or 16.2 kb/d/yr. Note that the last data point shown is for December and was taken from the January MER. The down trend is expected to slow in 2020 and 2021. Going forward, two new projects are scheduled for 2020 and 2021 which will add 20 kb/d and 40 kb/d, respectively according to the Frontiersman. Both of these increments will be offset by the yearly decline noted above. A more recent article in the Frontiersman states that increased development spending will add significantly to Alaska’s output in 2022 and 2026.
“A final investment decision in Pikka is expected in late 2020, which means spending for this project will be in the $3.38 billion estimate, but most will come in following years. Pikka will see initial production beginning in 2022 and full production at 120,000 b/d in 2024. Willow’s investment decision will come later, with production beginning in 2025 or 2026, ConocoPhillips has said.”
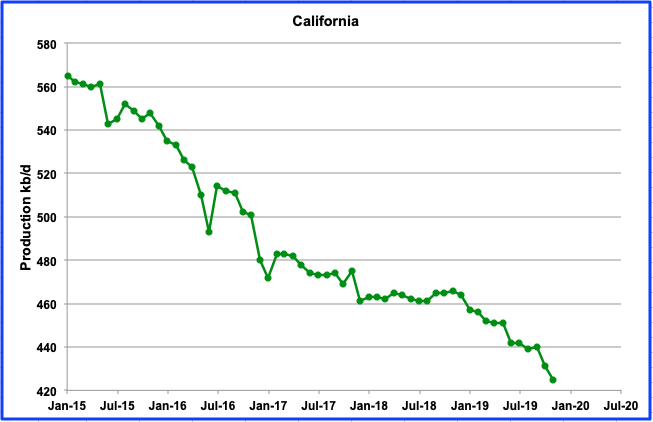
California continues its steady decline. It was down another another 6 kb/d in November to 425 kb/d.
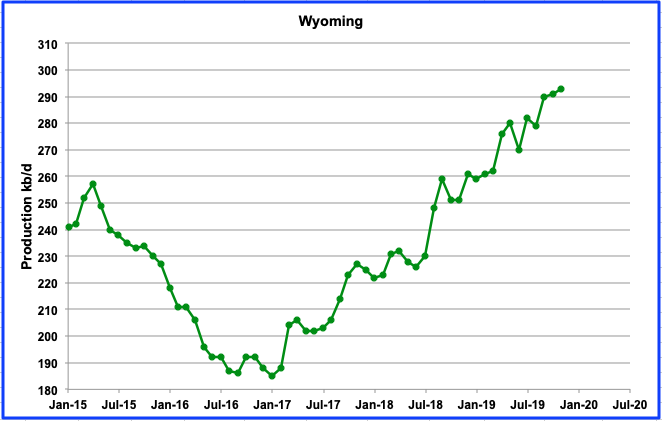
Wyoming continues to increase its output and reached a new high of 293 kb/d in October with a minimal increase of 2 kb/d. It continues to benefit from the northern portion of the Niobrara LTO basin being situated in Wyoming.
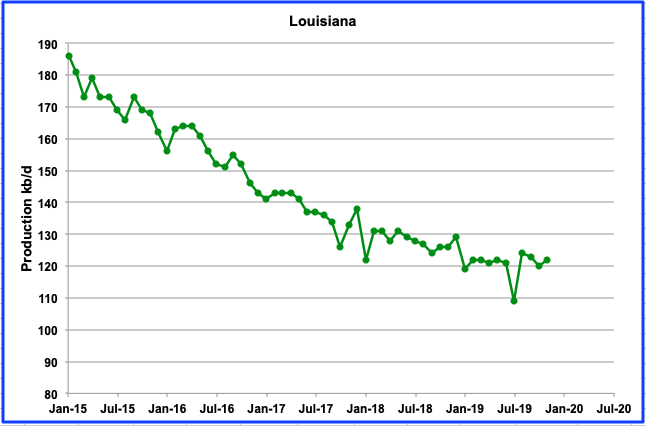
There was little change in Louisiana output for November, up by 2 kb/d, and no indication of a change in trend. Production has been essentially flat at slightly over 120 kb/d since January 2019.
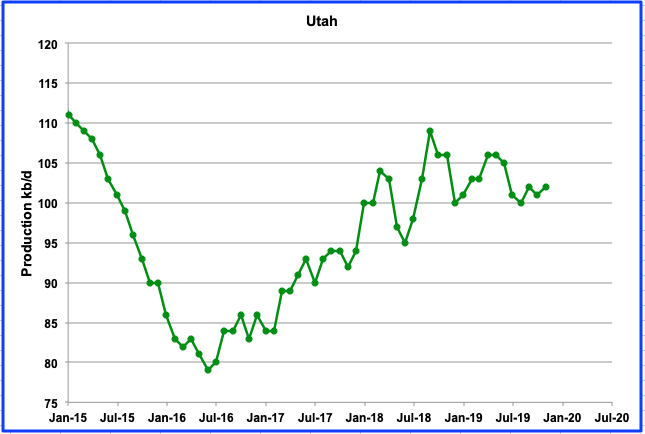
Utah’s output is holding steady at slightly over 100 kb/d due to its new conventional field but is giving indications of starting a new slow decline.
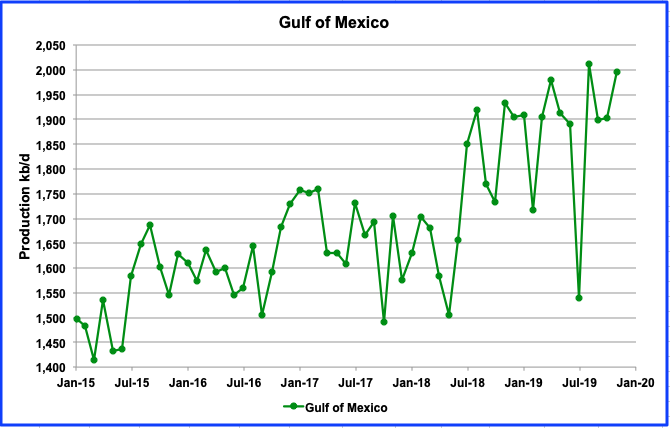
The GOM increased its output in November by 91 kb/d from 1,904 kb/d to 1,995 kb/d. For 2020, the STEO is projecting steady output close to 2,000 kb/d.
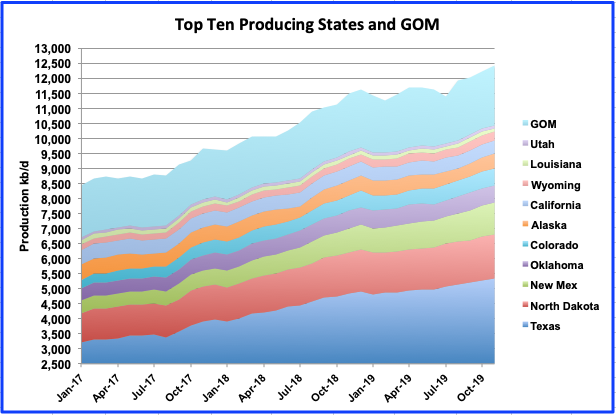
Above are the top 10 US oil producing states along with GOM plotted on the same scale to show the relevance of the GOM. Note the chart starts at 2500 kb/d and Texas output is 5,329 kb/d. The GOM output is 1,995 kb/d or 37.5% of Texas.
DUCs
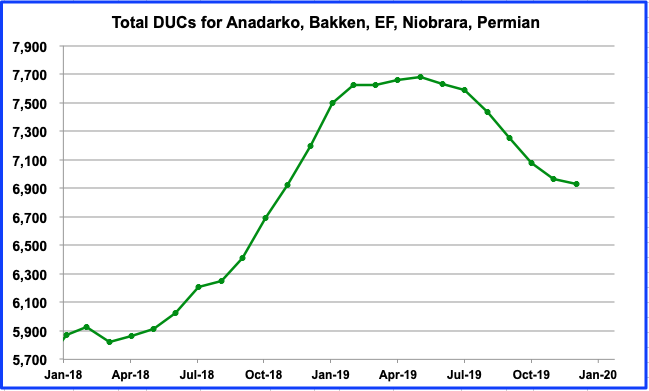
This chart shows the number of DUCs in the five primary oil producing basins. For December, the number of DUCs declining slowed to 35 to 6,932. Does the slowing in decline imply that there are not many more worthwhile DUCs to complete? The DUCs peaked in May 2019 and have been slowly declining. The largest decline in DUCs occurred in the Anadarko basin, 54 while Permian and Bakken DUCs increased by 14 and by 18 respectively in December.
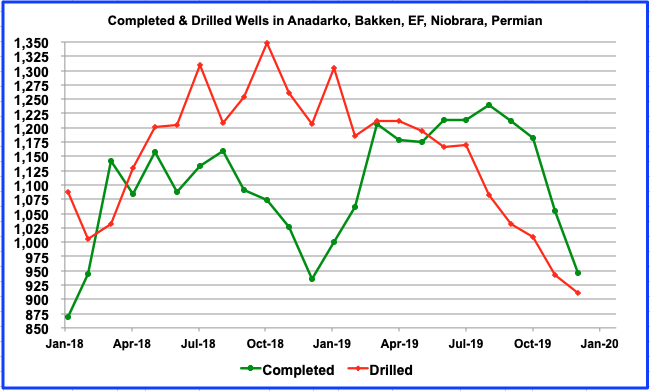
The number of wells drilled in the five major oil producing basins peaked in October 2018 at 1349 and then began a slow decline. However the decline in the drilled wells accelerated starting in August 2019 to an average rate of 52 wells per month. In the meantime, completions began to recover in December 2018 and peaked in August 2019, 10 months later, before beginning to roll over. The gap between drilled and completed wells was 35 in December.
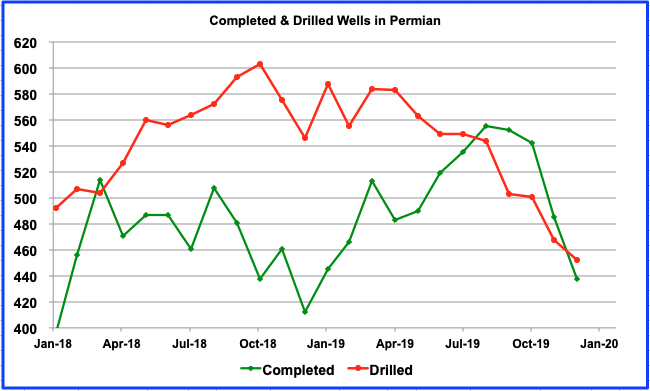
This chart shows the completed and drilled wells in the Permian. The trend is similar to the one shown in the above chart. The Permian drilled wells also peaked in October 2018 and the completions peaked 10 months later and then began to drop. Note that in December more wells were drilled than completed.
UPDATING EIA’S DIFFERENT OIL GROWTH PERSPECTIVES
Last month, reports from three different EIA offices that collect and publish extensive data on the U.S. oil producing industry were compared since they estimate future output. These three differing future perspectives are updated to their latest reporting dates.
1) DRILLING PRODUCTIVITY REPORT (DPR)
The Drilling Productivity Report (DPR) uses recent data on the total number of drilling rigs in operation along with estimates of drilling productivity and estimated changes in production from existing oil wells to provide estimated changes in oil production for the five key tight oil regions.
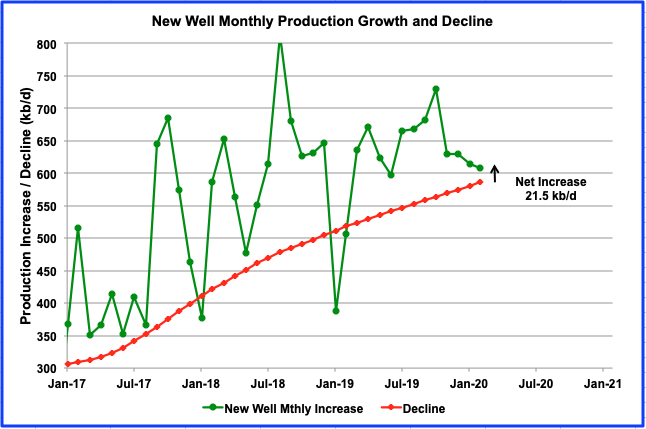
The projected output increase for all tight oil basins for February 2020 is 21.5 kb/d. Also note that the DPR’s projected monthly net increase has been getting smaller and less volatile since August 2019.
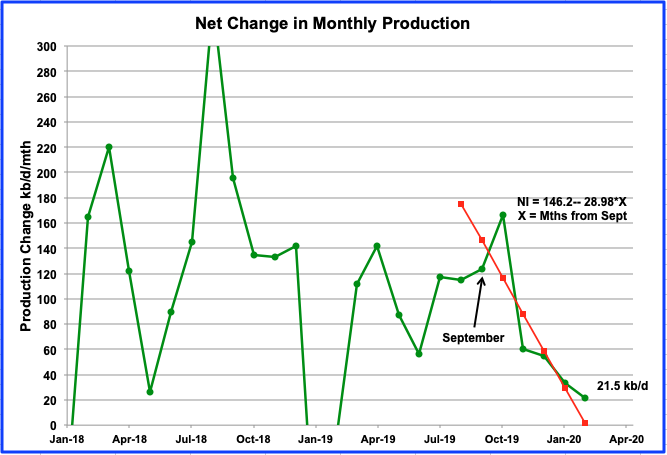
This chart shows the difference between the monthly production growth and the monthly decline in the first chart of this section. A linear fit was modelled through the September 2019 to February 2020 data since there has been a steady decline in net monthly production since October 2019. As occurred last month, the January data point fell on the trend line but the February 2020 data point has diverged from the line and is indicating a longer time to get to a point where production and decline are balanced.
If the decrease in the Net Change were to continue at the rate indicted by the difference between January and February, there would be no net increase in production from the LTO basins by mid April 2020.
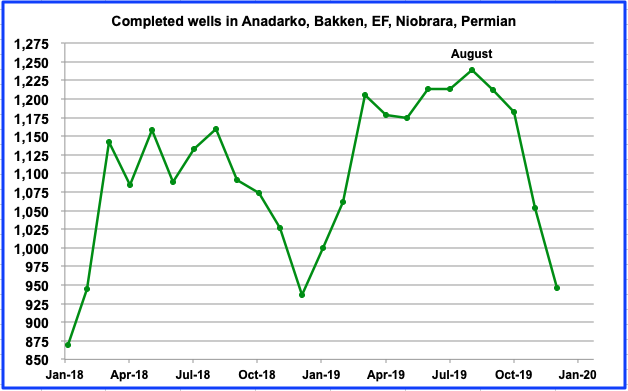
When comparing the above chart with the previous completed wells chart, note the similarity in the pattern and changes in direction, especially after January 2019. The total number of well completions in the five major LTO oil basins is shown with the maximum number occurring in August. Two months later, October, the net change in monthly production peaked as reported in the DPR and then began to fall. This time gap appears to vanish in November. There was a drop of 236 completions from October to December, from 1182 to 946. Notice how there is a similar large drop in the net change in production from October to December. While the majority appeared in November, this could be revised. Is this a coincidence or is there some logic to explain the seeming connection between completions and net production. To provide more insight for the answer, the correlation between completions and net change in production will continue to be tracked in future posts.
Another feature to notice is the number of completions from March to September was roughly constant at close to 1,200 per month. Over that same time period, the net monthly increase in output wandered around 115 kb/d. The 946 completions in December are yielding a net increase in production of 55 kb/d according to the DPR. This indicates that close to 900 completions per month will be required to maintain constant output. This assumes the quality of the wells stays the same. Also, as more wells are drilled, an increase in completions would be required to offset the decline from the newer well.
There is some logic in thinking that well completions and net changes in production should be correlated since a completed well adds new production. If correct, the DPR may be getting planned completion/frac schedules from fracking companies for the next few months ahead and are making their projections based on that information. Fracking companies must have work schedules to plan how to deploy their resources for upcoming months.
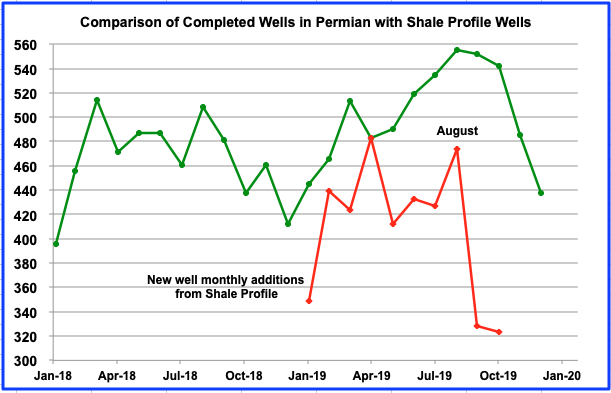
To further look into the question of completions and production, above is a chart comparing monthly well completions in the Permian with the monthly new well additions from Shale Profile. Shale Profile data is updated to October. What is striking is how there are fewer new monthly producing wells than completions. The difference between the two ranges from zero to 220, with 80 being a more typical difference. Why are there fewer new well additions than completions? Is the difference due to old wells being shut down? Are some completed wells of such low quality that they are not tied into the pipe gathering system and just added to the DUC count? Puzzling and looking for some answers or clarification.
In the previous post, delonghorn provided the following info on well completions.
“After a well is fracked, there are number of things that happen before you get much oil or gas. First, any other wells on the same pad are usually fracked, sometimes they also wait on neighboring wells. The well site has to be cleared, and production facilities, installed. A gas line may have to be laid and tied in. Finally when they are ready to go, they open the well up and produce lots of frack fluids. There is not a lot of oil or gas until the big part of the frack flows back, and different operators have their own procedures. It can take up to a couple of months flow back before the well comes in strong.”
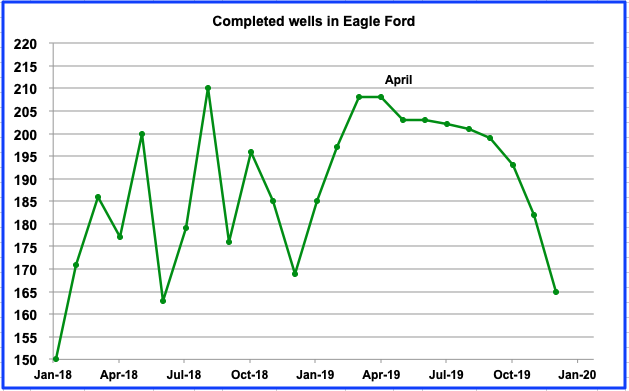
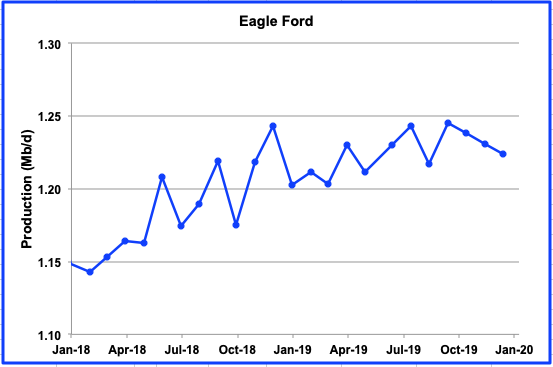
As a final comparison, above are charts for completed EF wells and EF production. On average, the completion of close to 185 wells per month after July 2018 has kept EF output slightly above 1.2 Mb/d and essentially no net growth in 2019.
So in summary, there apears to be a close relationship between completed wells and monthly production change. Further, it is speculated/possible that the DPR has access to the fracking companies completion/frac plans and uses this information to make projections for a couple of future months. Also we need some explanation for the difference in well completions and new well additions as shown in the Permian chart above.
2) LIGHT TIGHT OIL (LTO) REPORT
The LTO database provides information only on LTO production from seven tight oil basins and a few smaller ones.
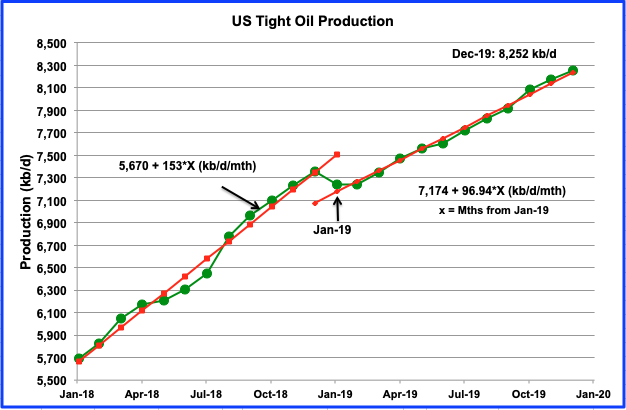
Output from all LTO basins in December was 8,252 kb/d, an increase of 81 kb/d from 8,171 kb/d in November. The average monthly increase from January 2019 to December 2019 is 96.94 kb/d/mth and is 37% lower than 2018. However, the average rate over the last two months has slowed to 83.3 kb/d/mth.
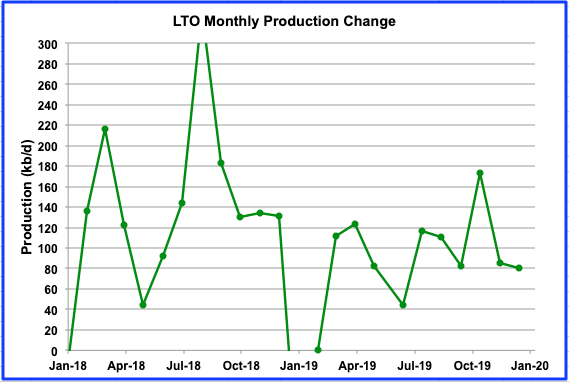
This chart shows the monthly addition to LTO output and is similar to the DPR chart above. Production in December was little changed from November. The current December LTO report confirms the DPR trend up to December 2019.
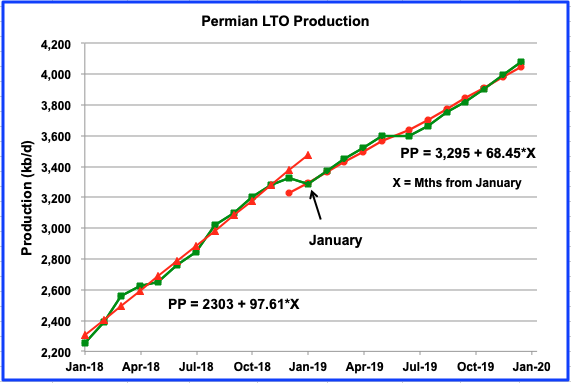
The Permian is the largest contributor to US tight oil growth. As can be seen in this chart, the average growth rate for 2019 is lower than 2018, While the average monthly growth rate for 2018 was 97.61 kb/d/mth, the average rate for 2019 is lower at 68.45 kb/d/mth. However in this case, averages are deceptive. In last month’s post, the Permian LTO data indicated that, starting in September, the Permian output growth was 100 kb/d/mth. However, the December report provides updated data that indicates the average growth rate over the last three months of 2019 slowed to 88 kb/d/mth.
3) SHORT TERM ENERGY OUTLOOK (STEO) REPORT
The STEO provides projections for the next 13–24 months for C + C and NGPLs production. The January report presents EIA’s first oil output projections out to December 2021.
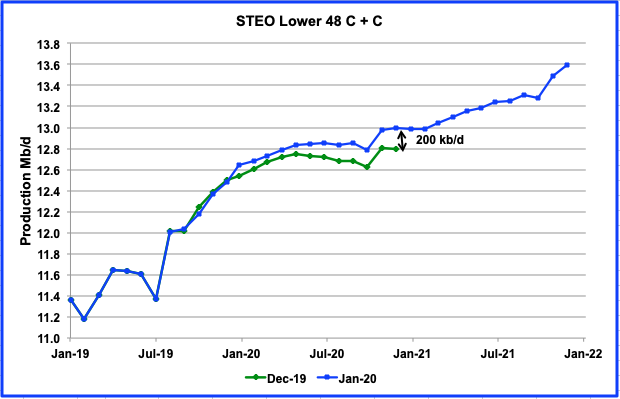
This chart compares the December 2019 STEO projection with January 2020. While the October to December 2019 STEO projections were showing successively lower output for 2020, the January 2020 reverses that trend by showing a significant increase in production for 2020 relative to the December STEO. However, overall there are indications of slowing.
Below are the yearly increases for C + C starting with 2019, i.e. December 2018 to December 2019.
- 2019 increase: 940 kb/d
- 2020 increase: 520 kb/d
- 2021 increase: 540 kb/d
So the 2020 and 2021 output increases are slightly more than half of the 2019 increase. What is even more surprising are the production increments for January 2020 and December 2020 that were added to the December 2019 STEO estimates shown in the chart. The increments are 100 kb/d and 200 kb/d for January 2020 and December 2020 respectively. The question that arises is “What information was provided to the STEO/EIA between December 2019 and January 2020 that generated these significant increases in output for 2020.
In a Financial Times article in August 2019, the following statements were made by executives of Chevron and Exxon.
“Chevron achieved record output of 3.08m barrels of oil equivalent per day in second quarter, 9 per cent higher than the same quarter a year ago. Its Permian oil production increased 50 per cent to 421,000 b/d and should reach 900,000 b/d by 2023, said Jay Johnson, executive vice-president of upstream for the California-based company.
While Exxon’s total production rose 7 per cent year-on-year to 3.9m boe/d, its Permian production grew by nearly 90 per cent to an average of 274,000 boe/d, said Neil Hansen, vice-president of investor relations. He predicted Exxon’s volume from the basin was on its way to 1m b/d by 2024.”
Essentially Chevron plans on adding 100 kb/d/yr over the next four years. If Exxon does the same or more, that is a possible explanation for the big output jump in the January STEO over December. It needs to be noted that in the comments portion of the previous OPEC post, there were many views on the performance of the currently drilled wells of these two companies.
So was the EIA/STEO able to confirm or update the plans of these two companies over the holidays to enable them to make such a significant change to their 2020 forecast? If true, will we start to see an increase in the rig counts for these two companies in the Permian in 2020 or will there be some other explanation?
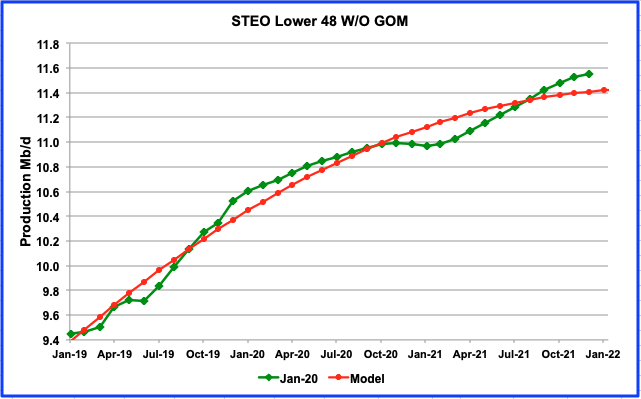
In this chart, the GOM output was removed from the previous chart to obtain a better idea of what is projected to be happen to onshore oil production in the L48 states. The 2020 and 2021 increments in C + C are 460 kb/d and 560 kb/d respectively. Comparing these onshore numbers with those above, 2020 is lower by 60 kb/d and 2021 higher 20 kb/d. In essence the STEO is projecting higher drilling activity going into 2021.
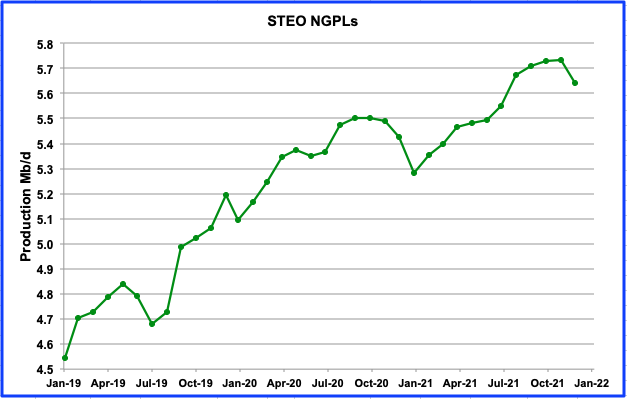
While this post is focussed on C + C output, we should look at NGPLs to see what is happening in that sector since both OPEC and the IEA base their US production outlook on C + C + NGPLs. The annual NGPL increments for 2020 and 2021 are 230 kb/yr and 210 kb/yr.
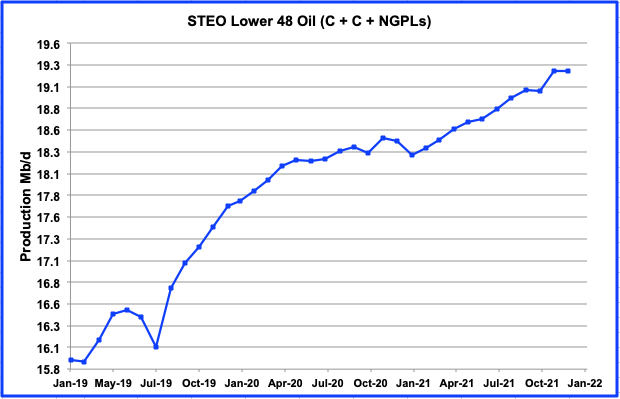
This chart shows total oil output from the L48 states. For 2020 and 2021, it shows that output will increase by 750 kb/d and 800 kb/d respectively. Alaska has virtually no impact on these increments.
It is interesting to compare the EIA 2020 oil output increment with the increment that OPEC and the IEA are reporting. The January OPEC report shows on increase of 1,100 kb/d from Q4-19 to Q4-20. The November IEA Oil Market Report shows an increase of 1,240 kb/d from Q2-19 to Q2-20. The OPEC and IEA output increments are 350 kb/d and 490 kb/d higher than the EIA increments respectively. This discrepancy should result in either higher OPEC output to meet demand or a larger world inventory draw or a combination of both.
180 responses to “US Production Growth Surges”
Great work Ovi,
ExxonMobil had a small fall, about 4%, in Permian/Bakken oil equivalent production from Q3 to Q4 as on page 20 of https://corporate.exxonmobil.com/-/media/Global/Files/investor-relations/quarterly-earnings/presentation-materials/2019-presentation-materials/earnings-presentation-4q.pdf
If the XOM shale crude oil fall is assumed to be 4%, then it looks like a peak US shale crude oil plateau has begun. This would also mean that US crude oil plateau has started. Once more shale oil company quarterlies are released then the peak plateau should become more noticeable.
Here is XOM Q3 to Q4 small 4% fall
Here is XOM small 1% fall in Permian oil from Sep to Oct from shaleprofile.com
Here is big XOM fall in Bakken from 99 kbd oil in Jul to 72 kbd in Nov from shaleprofile.com
Tony
In your chart, XOM is showing production of roughly 180 kb/d near the end of the second quarter. In the post above under chart for STEO Lower 48, XOM, it claims that:
“While Exxon’s total production rose 7 per cent year-on-year to 3.9m boe/d, its Permian production grew by nearly 90 per cent to an average of 274,000 boe/d, said Neil Hansen, vice-president of investor relations.”
Can you explain the difference?
Ovi,
The 274,000 boe/d number is from XOM 2019Q2 Permian production which includes crude, NGL and gas.
https://corporate.exxonmobil.com/-/media/Global/Files/investor-relations/quarterly-earnings/presentation-materials/2019-presentation-materials/earnings-presentation-2q.pdf
XOM 2019Q4 Permian production is now 294,000 boe/d.
https://corporate.exxonmobil.com/-/media/Global/Files/investor-relations/quarterly-earnings/presentation-materials/2019-presentation-materials/earnings-presentation-4q.pdf
Shaleprofile.com states that XOM Permian crude oil production for Oct 2019 was 202 kbd which is less than 294 kboed because the difference of 92 kboed should be NGLs and gas.
I place importance on the trends in Permian XOM production from XOM report and from Shaleprofile.com as the trend is down. If Permian XOM production is down then it is likely that the whole of Permian production will struggle to increase.
This is also shown by EIA DPR Permian growth from Jan to Feb 2020 of only 45 kbd, or 1% month on month.
https://www.eia.gov/petroleum/drilling/#tabs-summary-2
That XOM 2025 forecast chart above in green was taken from XOM March 2019 Investor Day presentation, page 40
https://corporate.exxonmobil.com/-/media/Global/Files/investor-relations/analyst-meetings/2019-ExxonMobil-Investor-Day.pdf
That chart is below and also shows XOM 2018 Permian and Bakken outlook. The note below the chart says “Potential production” so maybe it’s not a forecast and XOM Permian production might stall this year.
Tony
Thanks for the detailed explanation. Your info on tracking XOM and CVX gives good insight into what is happening. I hope that at some point they decide that drilling for a loss is not a good idea.
Tony,
Keep in mind the shaleprofile Permian data gets revised as RRC data becomes more complete, the most recent 6 months are likely underreported. In the case of North Dakota, note the scale of the chart, we are talking about 20 to 30 kbo/d od decrease in the North Dakota chart.
So far output has been up, perhaps if oil prices remain low there will be a temporary plateau.
So, if we include NGPLs is the US a net liquids exporter?
Nick
Here are a few ways to look at it using this weeks inventory report.
Production
Crude ——– 13,000
NGPLs ——– 5,022
Ethanol ———–1,098
Refinery Gains — 1,038
Total ———20,158
Product supplied
Motor Gasoline —–8,793
Jet Fuel ——— 1,670
Distillate Fuel Oil —- 3,901
Residual Fuel Oil —– 286
Propane ————– 1,377
Other Oils ——— 3,611
Total ———–19,638
So total crude plus other is greater than product supplied
Looking at exports and imports, exports are bigger than imports.
—— Export Import
Crude 3,509 6,660
NGPLs 5,851 1,847
Total 9,360 8,507
So for this past week, the US was a net exporter. However recall that the US exports a lot of NGPLs which are not good for making gasoline. You need WTI grade crude and heavies to make diesel. Note above that the US imported 6,660 kb/d of crude.
It would be interesting to do two different analyses: imports and exports adjusted for energy density; and the same thing except adjusting for sales price.
The US imports a fair amount of crude at one price, and then refines it and exports it at a higher price, so the adjustment by sales price might be revealing. I remember an analysis here for Mexico that found that it’s net exports went to zero faster, when the export/import components were adjusted by price. In the case of the US, the point where net imports went to zero might also be accelerated from this POV.
Here’s a chart of historical US imports:
Hello Ovi,
I have a few questions regarding the weekly EIA report that maybe you can answer.
At what point is the product supplied counted ? From the refiner to the wholesaler, wholesaler to retailer or retailer to end user.
Are there exports in the product supplied?
I have also noticed this year the product supplied is down significantly more than can be explained by normal random variances verses last year. Gasoline, diesel and jet fuel inventories have been raising abnormally fast since the first of the year. The weekly reporting has a major effect oil prices and refinery margins. Could the numbers be manipulated to lower prices and simulate the economy ?
HuntingBeach
Here is the answer to your first question, straight from the horses mouth:
Product supplied
Product supplied: Approximately represents consumption of petroleum products because it measures the disappearance of these products from primary sources, i.e., refineries, natural gas-processing plants, blending plants, pipelines, and bulk terminals. In general, product supplied of each product in any given period is computed as follows field production, plus refinery production, plus imports, plus unaccounted-for crude oil (plus net receipts when calculated on a PAD District basis) minus stock change, minus crude oil losses, minus refinery inputs, and minus exports.
From reading above, I think refiner to wholesaler is the closest answer. Essential leaving the plant gate.
Product supplied is strictly for US consumption. Not sure if it would include imported gasoline.
From what I can gather there are two reasons for higher diesel and gasoline inventory. First is that the NE east US has been warmer and as a result heating oil (very close cousin of Diesel) demand is down. The second reason has to do with the lower than expected Ultra low Sulphur Diesel (ULSD) associated with the new IMO rules requiring the use of ULSD ocean going vessels. Apparently there is a higher use of scrubbers than expected.
Refiners made extra ULSD in anticipation of higher demand from ships. This also created extra gasoline because 3 barrels of crude make one barrel of diesel and two of gasoline, roughly.
Thank you Ovi,
I think it means refiner to wholesaler too. Which makes sense.
If product supplied is for U.S. only. Than it must mean imported refined included. U.S. doesn’t have 20 million plus refinery capacity. 3-2-1 has been my understanding of the marginal break down. But know output can be tweaked and input effects output margin.
Thanks again. I could never find the answer to my product supplied question on the EIA website.
I asked Safari to find the answer and it went straight to the EIA.
Well that makes to much sense. I guess I took the scenic route and got lost.
Nick
Yes
https://www.worldoil.com/news/2020/1/31/equinor-and-shell-partner-on-vaca-muerta-acreage-buy
Excellent work.
What’s also interesting recent news is that the climate change people are up in arms over projections of FF usage that may have been exaggerated. This is a commentary in Nature co-written by a climate scientist (Hausenfather) and an energy analyst (Peters) that discusses the BAU forecasts for FF usage.
“Emissions – the ‘business as usual’ story is misleading — Stop using the worst-case scenario for climate warming as the most likely outcome — more-realistic baselines make for better policy.”
Part of the problem may be in this:
The EIA is a faceless arm of the government and is not accountable, requiring no scientific peer-review process before they present their results. This makes it different than NASA and NOAA, who actually have had public faces such as Gavin Schmidt and countless other scientists to defend and publish their findings in scientific journals. Independent energy analysts that have followed bureaucratic organizations such as EIA have frequently wondered why their forecasts for energy usage have always followed the same trends as those for economic growth projected by other bureaucratic agencies such as the Commerce Department.
Moreover, most people don’t realize that there is really no required accounting of oil production by the USA gov’t. The closest they have is something called the “Railroad Commission of Texas”. At one time a person would have to formally request data from their librarian, but now they have an online presence http://webapps.rrc.state.tx.us/PDQ/generalReportAction.do. The same goes for North Dakota who have a Dept of Mineral Resources https://www.dmr.nd.gov/oilgas/. The USGS provides a list of the state-run accounting organizations https://www.usgs.gov/core-science-systems/nggdp/core-research-center/links-state-well-data.
So the grass-roots energy analysts such as on POB are the ones that are providing a counter dose of reality by data-mining from the various information sources. This was not even possible several years ago.
Then why trust their production numbers?
ed says:
Remember, this is really about long-range forecasts and not about how well they do in reporting current production numbers.
If the climate community has been using old EIA production forecasts that were overly optimistic, then their climate warming models will also be over-optimistic, which is why the Nature commentary was written, and now why there is also a backlash from some news outlets, such as this from the BBC:
Climate change: Worst emissions scenario ‘exceedingly unlikely’
Compare all forecasts to actual. When they are wrong ignore and defund all future forecasts.
The data is in the BP bible published every June. World Statistical Review. Downloadable spreadsheet. If you are going to study oil, start there. Their sources are many. If they are lied to, those numbers appear.
But they have evolved to be the bible.
Watcher,
Dumb idea. No forecast is ever correct.
So you suggest no forecast it seems.
The climate scientists are chasing a moving target if they depend on this kind of forecast:
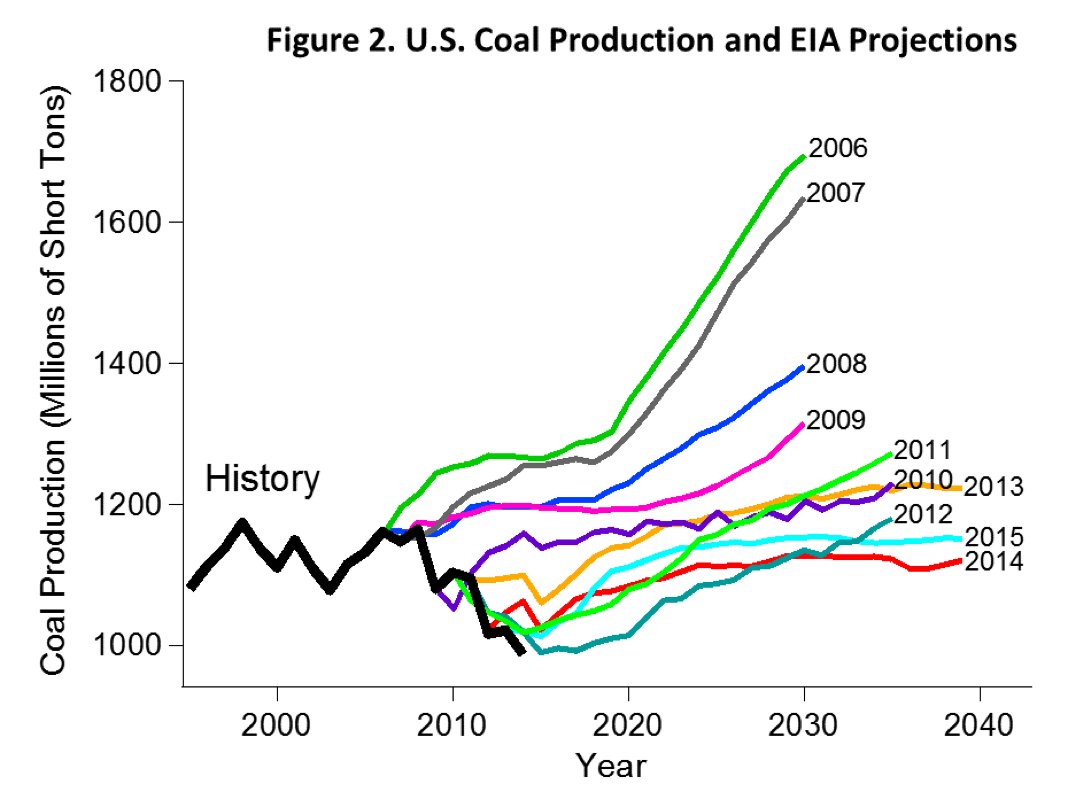
Granted that this may have a lot to do with replacement of coal with natural gas, but they do need to watch for obviously exaggerated forecasts.
That’s a great chart. Where is it from, and is there an updated version?
This site:
http://cleanenergyaction.org/2016/10/05/u-s-energy-information-administration-projections-far-from-accurate/
Thanks!
it’s Zeke Hausfather, no “…en…” in there.
Zeke is more of an energy modeler, though he has done some papers on data and climate models.
While he may have a point about people claiming RCP8.5 is BAU,
most climate scientists don’t make that claim.
They use RCP 8.5 a lot because they’re limited in time/money to run their models,
and RCP8.5 passes though the data of the other RCPs.
Most people I’ve heard of using RCP8.5 as “BAU” or “most likely” are random bloggers or alarmists hawking some doomer book.
My beef with Hausfather is that he says that MODELED fossil fuel reserves won’t allow RCP8.5 to happen, and thus we shouldn’t even consider it.
But (1) he ignores non fossil fuel forceings:
methane from the melting arctic, greenhouse gases and black carbon from wildfires, deforestation, etc., and
(2) he assumes that if we drop the RCP8.5 scenario, that the obstructionists will cease their obstruction and we can actually implement policy.
“It is difficult to get a man to understand something, when his salary depends upon his not understanding it.”
https://quoteinvestigator.com/2017/11/30/salary/
see also:
http://www.realclimate.org/index.php/archives/2020/01/bau-wow-wow/
https://andthentheresphysics.wordpress.com/2019/10/06/worst-case-scenarios-or-not/
I think he is an actual climate scientist, and gained his credentials working with Richard Mueller on the Berkeley Earth Surface Temperature (“BEST”) project at University of California, Berkeley.
My opinion is that reaching RCP8.5 levels hinges on how much we exploit the low EROEI FF resources such as oil shale.
I agree that the great unknown is the non-FF forcings. Excess water vapor itself falls in that category as it is a huge contributor to the equilibrium warming of the earth and is only created by CO2 acting as a catalyst to provide a positive feedback with increasing temperature. (if there was no CO2, many scientist believe that the earth would be locked in a frozen snowball state,
see this paper by Lacis & Hansen of NASA https://www.tandfonline.com/doi/full/10.3402/tellusb.v65i0.19734)
Nice work.
I follow the PSM each month, and I wasn’t surprised with this end of the year surge, as it already happened in 2017 and 2018. Seems like a seasonal effect. The difference in 2019 is that it is not as strong as previous years.
Something that surprised me in the PSM is the trend in the US oil consumption. It’s slightly lower in 2019 than in 2018, which would be the first time since 2012. It’s still quite early to have a good view on this. But if we use oil consumption as a meter for economic health (and growth) there is quite a bit of discrepancy between this figure and market indexes.
Some may be eager to say that EVs are the reason for the reduced oil consumption. This will probably be a thing in the future if the progression continue, but currently EV represent 0.5% of total vehicles on the US roads, so the impact is still quite insignificant.
Just a thought so far…
Tita
In a reply further up I wrote mostly this this but slightly modified
From what I can gather there are two reasons for lower diesel and gasoline consumption. First is that the NE US has been warmer and as a result heating oil (very close cousin of Diesel) demand is down. The second reason has to do with the lower than expected demand for Ultra low Sulphur Diesel (ULSD) associated with the new IMO rules requiring the use of ULSD in ocean going vessels. Apparently there is a higher use of scrubbers than expected.
Refiners made extra ULSD in anticipation of higher demand from ships. This also created extra gasoline because 3 barrels of crude make one barrel of diesel and two of gasoline, roughly.
@Ovi
The heating oil consumption in the US is quite low… Somewhere around 200-300 kb/d on average. Of course, consumption is seasonal. 3 decades ago, heating oil was much more used and resulted in wilder swings in seasonal consumption. Warmer winters do have an effect, but most consumption of diesel is elsewhere nowadays.
And the fuel mix of ships doesn’t change their consumption. Scrubbers may even increase their fuel consumption.
What you wrote was about inventories, not consumption.
Ovi,
As I have pointed out in the past, the most recent 4 months of the DPR will always be less volatile as they are model based. Why not do your trendline from March 2019? The change from Oct to Nov was larger than any monthly change from March through Oct. In addition the EIA’s LTO estimates would be a better basis for this type of estimate looking at the trend in the change in tight oil output. For March 2019 to Dec 2019 we get the chart below. Food for thought. It is far from clear that the DPR estimates have been improving, seems there is little basis for such an assumption. Also keep in mind the recent 3 to 6 months of shale profile Permian estimates are preliminary, they will change as RRC data becomes more complete, also the DPR completion data is likely model based as there is no very up to data completion data for the Permian basin, the best data available is shaleprofile through about March 2019, any data beyond that is a guess.
Dennis
In the LTO section above are plotted two years of LTO data “LTO Monthly Production Change”, same as yours above but over a longer time period. There is the same chart in the DPR section, “Net Change in Monthly Production”, again over two years. The two charts are almost identical up to December. Two much volatility to draw a straight over two years.
The first chance to make sense of that data was when the December data first appeared in the DPR. I thought that the volatility in the DPR data changed significantly in April 2019 and as mentioned at the time, a linear fit was made through the last four points with a lot of risk. Also bear in mind that many of our soul mates on this board were telling us that LTO production was dropping. So combining physical facts with data made sense and the line over four data was created. So now we wait with baited breathe to see if it will hit zero in the next few months. At this point, the trend is my friend.
Looking further down the board, Tony has posted a chart that shows how the DPR and LTO graphs parallel each other. From this I gather that the LTO is confirming the DPR trend out for two months.
There are signs that many of LTO plays are slowing and the only two plays that seem to be increasing output at a steady rate are Wolfcamp and Spraberry. For December they contributed 73 kb/d of the total LTO increment of 81 kb/d. See chart.
Ovi,
Agree most of recent increase is from Permian basin, I would include Bonespring as well.
If we see a change since April 2019, why not use LTO data from May to Dec 2019, DPR data for past 4 months not very good imo.
Dennis
Here are my two choices. Note the DPR now has six points
Chart 2
Thanks Ovi
If one has more faith in data vs model output as I do.
Using the trend from chart 2 makes more sense.
Also trends can change and often do so assuming any trend will continue may be problematic.
Ovi
In your discussion comparing new well additions and completions at shale profile, it is not clear what you mean.
Is first flow wells as reported by shaleprofile the completion number you mean?
Is new well additions the monthly change in producing wells?
If so, the difference is wells that are offline for maintenance or repair. Also some wells get plugged at end of life.
Dennis
You ask:
“Is new well additions the monthly change in producing wells?” Yes
Attached is a chart which shows the difference between completed monthly wells and new additions by Shale Profile. What was surprising is the almost constant difference between January and August of between 80 and 100 FF SP wells and completions, except for those two months, February and April.
This doesn’t seem to tie into your comment “If so, the difference is wells that are offline for maintenance or repair. Also some wells get plugged at end of life.” Makes me think there is some other explanation that is not obvious. I will continue to keep track of this difference.
Ovi,
Completed wells=first flow wells.
The number of producing wells depends on both wells down for maintenance or repair and new wells (aka first flow or completed wells).
Where does your “completed Permian well” estimate come from? Are you using the DUC spreadsheet? Those numbers are not very good, especially most recent 6 months or so, those numbers are simply model based and the DPR model is nor very good imo.
The shale profile numbers do not include conventional wells, the DPR does, so that might be part of the difference if you are using the DUC spreadsheet for Permian completion data.
Dennis
DUCs.
Got it. Thanks Ovi.
The shale profile data is very good through May 2019, then incomete data from RRC due to late reporting by oil companies makes it less accurate. The discrepancy may be conventional completions which are not included at shaleprofile
Also shaleprofile.com does not include vertical oil well completions, only horizontal well completions are tracked so that might explain some of the difference.
In fact, I believe it explains all of the difference up to the most recent 2 months reported by shaleprofile, the difference in those months (added to the vertical wells) is due to incomplete data at shale profile compared to an EIA model.
Ovi,
I agree, my initial guess was probably wrong as I misunderstood your use of “completed wells” from DUC spreadsheet and “new wells” from shale profile (where the term “first flow” wells is used rather than “new wells”.
Comment linked below has better explanation for the difference in your chart.
http://peakoilbarrel.com/us-production-growth-surges/#comment-696803
Ovi,
Your comparison of DPR and LTO inspired me to create the attached chart. It’s interesting that the EIA production estimates for 2019Q4 show the same growth since 2019Q1. My estimate is that 2019Q4 will be about 250 kbd less than EIA.
Tony
Your company data is great. We seem to be in this critical period where production is slowing and we are waiting for some consistent data between the EIA and company reports.
Ovi,
An obvious problem with using only large companies that represent maybe 40% of total tight oil output is that one needs to assume they are representative of the other 60% of tight oil production. That assumption may prove false. Generally EIA tight oil production estimates by play have been pretty good, not perfect, but typically within +/- 1%.
Dennis,
EIA LTO and EIA DPR crude oil production show a 99.99% correlation in the above chart. Both are good except that DPR included 919 kbd conventional crude production for 2019Q4 which was a small drop for 923 kbd in 2019Q3.
The company data derived crude oil production shows a 99.74% correlation with the EIA LTO production. The chart below is based mainly on audited company data and some unaudited shaleprofile data (eg XOM & CVX). The chart below is based on 38 shale oil companies representing 60% of all US shale crude oil and also probably 60% of all US shale crude oil wells.
There are 10 large companies, the 1st Occidental 500 kbd shale crude oil and the 10th being Ovintiv at 115 kbd. The 20th is a private company Mewbourne 82 kbd, based on shaleprofile because private don’t have to disclose their production through quarterly reports. The 30th is Centennial 42 kbd and 38th Surge Energy 17 kbd.
A sample size of 60% of the US shale crude oil production can be divided by 0.6 to be a strong indicator of total US shale oil production as shown by the almost perfect correlation of 99.74% with EIA LTO since 2016Q1. I was surprised at that high correlation and also that the blue and red lines in the above chart superimpose each other from 2016Q1 to 2017Q3.
I am estimating that total 2019Q4 US shale crude oil production based mainly on company data will be about 7.92 mbd instead of the EIA LTO estimate of 8.17 mbd. My estimate mainly uses the midpoint of 2019Q4 guidance given by companies in their 2019Q3 quarterly reports.
My chart below also includes 2019Q4 report data from XOM and CVX. XOM showed a surprise drop in Permian/Bakken production of 4% from Q3 to Q4.
Occidental, being the largest US shale oil company, lodges its quarterly on Feb 27 which could be a strong indicator of US shale oil production growth.
https://www.oxy.com/News/Pages/Article.aspx?Article=6205.html
Tony,
Interesting. The only problem is that company forecasts of future production are often incorrect, rather than a 60% sample the EIA LTO “official estimate” probably has a sample of 80% to 90% of shale producers. So for estimates through Dec 2019, the EIA’s official tight oil estimates are probably best, the shaleprofile estimates are probably also very good through June 2019 (though the Oklahoma output is only available from the premium service.)
The problem with future output comes down to not knowing future completion rates. If the completion rate decreases significantly, your forecast may be correct, also low oil prices make the low completion rate scenarios more likely.
I wonder if oil prices will remain low, if US tight oil has a temporary peak in 2020, my guess is no.
Dennis,
Keep in mind and please remember that these company forecasts are officially called guidance as they are a very short term view, usually only 6 to 8 weeks. Please remember that guidance has a range of low to high production and are usually correct around 90% of the time, due to the short term of 6 to 8 weeks.
Here is an example to clarify company guidance. Pioneer (PXD) released their 2019Q2 results on Aug 6 2019.
http://investors.pxd.com/news-releases/news-release-details/pioneer-natural-resources-company-reports-second-quarter-2019
PXD, focused on the Permian, gave guidance that 2019Q3 crude oil production would be between 206 and 216 kbd. Please note that this guidance range is only for Q3 to end of Sep 30, about 8 week time horizon. PXD released their 2019Q3 results on Nov 4, 2019 and reported that Q3 production was 215 kbd, within the guidance range albeit at the top end.
http://investors.pxd.com/news-releases/news-release-details/pioneer-natural-resources-company-reports-third-quarter-2019
Pioneer Q3 results gave guidance for Q4 of between 210 to 220 kbd. I have assumed that to take the midpoint of 215 kbd for my estimate of Q4 production. Actual Q4 production will be released on Feb 19.
http://investors.pxd.com/news-releases/news-release-details/pioneer-natural-resources-announces-fourth-quarter-2019-earnings
XOM 4% drop in Permian/Bakken barrels of oil equivalent production from 2019Q3 to 2019Q4 was a surprise and EIA probably assumed that it would increase by 10% qtr on qtr as it did in previous quarters. This 4% drop, if applicable to crude oil, is significant because XOM production for Q4 was expected to be around 337 kbd. Instead it was about 294 kbd, a difference of 42 kbd. Please see attached chart from page 20 of https://corporate.exxonmobil.com/-/media/Global/Files/investor-relations/quarterly-earnings/presentation-materials/2019-presentation-materials/earnings-presentation-4q.pdf
Shaleprofile XOM oil and gas production to Nov 2019 reflects this 4% drop.
Is the guidance in barrels of oil or barrels of oil equivalent?
Often they do not break these out in their projections so one would need to assume future ratios of oil, NGL, and NG are similar to the past, this might be a good assumption or not.
Also there has been a flattening of tight oil output in many cases in the first quarter in the past, that is not unusual.
Often that has been followed by increased output in Q2 and Q3 (with 2016 as a recent exception due to very low oil prices). A period of WTI at sub $50/bo might lead to less tight oil output, if it lasts for 6 months or more.
Tony,
Also remember the shale profile data for the most recent few months is incomplete as the state data is incomplete for the most recent months, the EIA probably uses statistical sampling for the most recent months from survey data from large companies, shale profile does not use that method as far as I know. The sample used by the EIA typically covers about 80% to 90% of total output.
From the Last Post ……. ? There is no oil without investment ?
More Love for Jim-Cramer?:
“He finished up. “They’re tobacco. I think they’re tobacco. We’re in a new world,” he concluded, leaving the CNBC anchor at a loss for words.”
and
“We expect the market reaction to be negative to this set of results today,” RBC analyst Biraj Borkhataria said in a note to clients. “This leaves the company’s dividend completely uncovered by organic cash flow for another quarter.” “Something has to give.” Soooo How Long can/will this Train stay on this Track?
https://oilprice.com/Energy/Energy-General/Jim-Cramer-Fossil-Fuels-Are-Done.html
Here is the Cramer video
https://youtu.be/fBAPJg_FAfI
We have known oil and tobacco have been killing us for more than half a century. Oil consumption has yet to peak and everyone is addicted. Oil runs the economy and tobacco is like kissing an ash tray. Cramer likes to hear himself and the fat lady has yet to sing.
Excess shale inventory is 99 percent of the oil industry equities pain. The market place can turn over night. It’s to early to for last call.
Tobacco. I guess that’s it for oil so….
Talked to a relative who is pretty high up with an upstream service company at Christmas.
He made the “oil is tobacco” comment too.
Also had my first relative buy a Tesla Model 3 and spoke to him over Christmas as well. He said he loves it. His family lives in a large urban area. Their other vehicle is an ICE SUV.
Maybe XOM is just trying to get as much out as they can, seeing the end is near?
I still don’t see many Tesla’s where I live, or even in the metro areas near me. But I hear you see a lot of them in CA and other warmer areas.
And we see lots of plug-in hybrids, and other kinds of EV’s like Nissan leaf, Chevy Bolt, Fiat 500 e, VW Golf e, here in the SF bay area. Coming to your state in higher numbers the next 5 years or so.
But still, the petrol stations are busy as heck.
I have been speculating for at least several years that people within the majors will quietly get as much of their money out as they can while there are still ways to cash in.
From an investment point of view, there is no compelling reason to stay involved in gas and oil if there are better deals elsewhere. And I suspect the industry insiders know more about the future than they want to let on until they can cash out.
Wake me up when all the diesel trucks are electric delivering food to the supermarkets, and all the amazon packages to their customers. Not to mention electric jets, diesel trains, all of the coal, nuclear, & NatGas power plants are all wind & solar.
Oil is more like the blood of the economy keeping it alive.
For Stocks, all major companies are borderline junk. Few have any positive cash flow growth. Most companies use debt to finance stock buybacks as profits are flat or declining. Most companies are in cost cutting mode to squeeze out the last few pennies they can.
Global interest are also junk (either negative, or slightly above zero). The global economy is floating just above a long term global depression, using debt expansion to kick the can.
On the gov’t side, The US is insolvent, The Federal Nat’l debt tops $23T and there are about $70T in unfunded liabilities (Social Security\Medicare\Pensions,etc). Most US states are in bad shape as either they have grossly underfunded their pension plans, or loaded up on Junk debt reaching for 7% returns for pension. Several States are now planning on a Federal Bailout for their failing pension plans. Lots of people are leaving the high tax states as they pile on more taxes trying to float their pay-as-you-go pension systems (ie NY, IL, CA, NJ, etc). With falling tax revenues they jack up taxes even more, fuel more people to leave. They are in a death spiral.
Delivery trucks are probably going to switch to electric before private vehicles. Oil is not heavily used in electricity generation, because it is much too expensive.
What Cramer is saying is that capital is abandoning oil, not that demand has changed. but demand will change when gas guzzling goes out of style. You don’t need to burn a gallon of gas to go down to the store to buy a sixpack of beer. It’s just the fashionable thing to do, like those kids who walk around with their pants falling down.
Raising taxes doesn’t drive people off. Germany raised its taxes and has been running a budget surplus for years, paying off national debt. It has become a magnet for immigrants from all over the world.
alimbiquated Wrote:
“Oil is not heavily used in electricity generation, because it is much too expensive.”
Not Oil, but a heck of lot of NatGas which is also a fossil fuel.
“You don’t need to burn a gallon of gas to go down to the store to buy a sixpack of beer.”
That depends on where you are, In rural locations it can take more than 20 miles to the local store (40 miles round trip). Most people in Suburbia drive to grocery stores since no one is going to walk 10 to 20 miles (round trip) while carry a load of groceries. You simply are cherry picking points that fit your argument. Most people also drive to work, including the truck drivers & grocery store employees.
Regarding Germany you are cherry picking as every major industrialize nation has soaring Debt, and When Deutsche bank fails it going to need a massive bailout by the German gov’t & you see Germany debt soar faster than it did from 2008 to 2012. Taxes can go up on so far “Laffer curve” before revenue fall. Already this is happening in many US States as residents are fleeing the soaring taxes (NY, NJ, CT, IL, etc).
Cherry picking the very best does apply to the real world. If an overweight person jumps up while standing on a scale, Does cherry pick the lowest reading on the scale solve their overweight problem?
I don’t need tobacco to live. Until there is an alternative to FF to feed, clothe,house and transport 5 billion people, then it is NOT tobacco. Just a stupid comment from Cramer.
This type of surface analysis from the Financial commentators usually gets rightly criticized on here.
I don’t disagree, but in the view of many investors, oil is looked upon unfavorably.
I have owned oil working interests for a very long time. Sentiment in the upstream industry is bad. There is a lot of uncertainty, maybe more than ever.
The issue is demand. When demand growth stops permanently, the industry will be a bankruptcy fest. Many will not be reorganizations.
Are we two years or thirty years from the permanent end of demand growth?
I am in the business too. Sentiment is horrible. My opinion is that this is the result of the money pushing the business into resource plays that are uneconomic and the realization that his does not work. Now the money is leaving as fast as it can. In my opinion,I think that once this shakes out, the small producers/operators are going to be in the best position possible.
But there is no replacement for FF right now. And I do not want to live in a world that gets rid of FF without a replacement. Oil company bankruptcies will be the least of our problems.
Reno. Normally, I would be very optimistic for the future. The interests I own cash flow very well in the $55-65 WTI price band. Clearly shale doesn’t work financially below that price, and most doesn’t work within that price.
Compare to the late 1980s and the 1990s, when we were trying to keep above water with $10-15 operating expenses, with oil prices of $8-25 per barrel. The majors and large independents were performing better than us financially back then, now they are doing worse, at least in their US upstream segments.
So it would seem we are well positioned. However, I see the following problems:
1. The industry workforce. Very few young adults are willing to work in this industry, at least where I am. We have one employee under the age of 50, and he is 46. Every young person we have hired in the past has either left to work in a different industry, or was not a good worker. More of the former. We had to lay people off in Q1, 2016. Job stability is an issue. Also, the work can be physically difficult and outside. We are in the Mid-continent. It can be 100 F in the summer and below 0 F in the winter at the extremes. We have lost employees to factories, an auto mechanic, and a county highway department. I suspect part of the reason shale is not economic is that the companies must pay very high wages to attract good employees. I am all for workers making good wages, and I feel ours do well, but none are making six figures, so it isn’t an easy life, even with living in a low cost of living, very rural area. Also, the rural workforce is shrinking as most younger people move to urban areas.
2. Public sentiment is more anti-oil than ever in the history of the United States. I am not going to get into the arguments about this, but in my view this is a fact. Major candidates for President are very anti-oil. This is only possible because a large segment of the US population is very anti-oil.
3. For the first time, there is a real threat from alternative energy sources. This is a real wildcard. We are a long way from mass transformation, but few deny it will eventually happen. This was not even thought to be a possibility by most less than ten years ago.
I still think it will take at least a decade to see oil demand begin to permanently shrink. But once that happens, a lot of companies will fail. Commodities can be a very tough business when demand heads lower. US production is high cost, despite what the public companies espouse. I have read enough 10K and 10Q to know the facts.
It is a bummer. I was hoping for $55-65, and maybe even prices rising into the $70s. But the majors are going to drill shale regardless of price, and although I think they are foolish for doing so, I suspect their production growth forecasts are accurate.
The leadership in the majors cannot change their ingrained thinking, that they are impervious to price, and they can just “drill through it” as they always have.
Shale is foreign to them. It is very price sensitive and each well has such a short duration within which the well will be or won’t be a financial success.
Sorry for all the random thoughts. Just not many here who own oil. Ten years ago I would have scoffed at us selling anything, and that was just after the financial crisis. Now, it wouldn’t take much for us to get out.
Thank you shallow sand.
Your perspective is appreciated, and I agree with all of it.
🙂
Related to this is projections for energy demand growth globally. Here is one perspective that indicates much higher overall energy demand over the next decades. For instance, the UN projects the world population growth over the next 20 years will be the equivalent of adding a new China.
http://www.anthropocenemagazine.org/howmuchenergy/
Of course, demand is one thing, and supply is not necessarily the same. If these projections are anywhere close to being correct, I don’t see supply keeping up.
shallow sand wrote:
” Very few young adults are willing to work in this industry, at least where I am. We have one employee under the age of 50, and he is 46. Every young person we have hired in the past has either left to work in a different industry, or was not a good worker.”
That’s pretty much the same in any technical or physically demand jobs. Should get real interesting in the next 5 to 7 years as older tradesmen retire or pass away leaving very few available. AC or Furnace goes out: Good luck on finding a competent service tech. Ditto for Auto Mechanics, Roofers, Physicians, Engineers, Electrician\linemen, etc.
Its like the West has sudden given up and decided to go skid-row. My advice, if you need a new boiler or AC unit get it replaced soon. Ditto for roof, or any major home projects you need. It would also be a good idea to become an DIY expert as most likely you need to Do it yourself because you won’t be able to find anyone.
The crew who did my roof last spring were Hispanic. Professional, fast and very skilled. We seem to be in the process of cutting ourselves off from this vast labor pool for not very well hidden reasons.
shallow sand,
My guess is that we are about 15 to 20 years from the point where oil consumption decreases at a faster rate than the rate of decrease of oil production.
Demand growth will stop because supply growth stops in 5 to 10 years, due to resource depletion. Oil prices will rise and your oil interests should be quite profitable for about 10 years, eventually the transition to other forms of energy to power land transport may lead oil consumption to fall faster than output in the 2035 to 2040 time frame, that is a good time to sell your oil interests (perhaps at the early end in 2035 or so) as oil prices will fall to perhaps $40/bo as OPEC falls apart and middle east producers fight for market share and make many other oil resources unprofitable to produce. Some claim in that situation we might see oil prices fall to $20/bo in constant 2019$, my guess is no less than $30/bo.
Hi Dennis,
Rumsfeld stated:
“Reports that say that something hasn’t happened are always interesting to me, because as we know, there are known knowns; there are things we know we know. We also know there are known unknowns; that is to say we know there are some things we do not know. But there are also unknown unknowns—the ones we don’t know we don’t know. And if one looks throughout the history of our country and other free countries, it is the latter category that tend to be the difficult ones.”
I appreciate your forecast and it may turn out similar to your theory. But, with the speed of today’s technical advances. 15 to 20 years from now is just a little to far out on the limb for me.
I have a portfolio that is currently over exposed to oil from over 10 years ago with the idea there is little replacement for oil. I’m already looking for opportunities when they come alone to diversify away from oil. I would be surprised if the future didn’t offer an opportunity better than today to sell out. Because, I don’t believe the world can transform before the tightening of supply and the market will sooner or later reflect a price of the additional cost of the next marginal barrel.
“It’s to early for last call and fat lady has yet to sing.” But I don’t want to be around and go home with the last bar fly.
Huntingtonbeach,
These are just my guesses for how things might play out, there are many unknowns including those that we have not even considered.
I agree oil prices are likely to rise, perhaps to very high levels and oil investments may look good during that time, in my view that would be the time to sell and invest in wind, solar, EVs, batteries, and fuel cells, essentially the energy sources and new transport power sources that will supplant fossil fuel.
A gradual move from one type of investment to the other might be prudent, as well as diversified bets. Investments in single sectors are inherently risky, I buy the market using Vanguard total stock market index and simply hold. Much safer long term imo.
China Oil Demand Has Plunged 20% Because of the Virus Lockdown
Chinese oil demand has dropped by about three million barrels a day, or 20% of total consumption, as the coronavirus squeezes the economy, according to people with inside knowledge of the country’s energy industry.
This explains the lower oil prices.
Chinese demand will drop a whole lot more as more cities get put on lockdown. Buckle up because this is going to get really ugly.
Brent futures opened at around 55.75 this week. OPEC better hurry the hell up and cut and cut drastically.
Why should they?
Let it crash for a short time, and let Shale and big offshore burn a lot of money. So they will be crippled for the next years.
Eulenspiegel,
The reason they should cut is self interest, they shoot themselves in the foot with low oil prices.
And shale doesn’t?
No, their CEOs earn money by shooting themselves into the foot.
They get an extra bonus by using .50th caliber over .38s – meaning coupling bonus on growth, pure growth. It’s all about growth and smoke and mirrors – getting the bonus before the company is insolvent.
No evidence those people with inside knowledge 1) exist or 2) know anything.
April 2015. $41/barrel. No virus.
That price did not stop shale production growth. The price is higher now than it was then. This did not stop consumption growth.
There is no law of the universe that says any of this is correlated. Many instances of evidence we have suggests it is not, and a hypothesis only has to have one failed experiment to be discarded.
Watcher.
$41 oil in 4/15 led to production dropping US in 2016.
I wonder if that would happen now given the majors are drilling shale. XOM seems perfectly content to lose money drilling shale and borrowing 100% of its dividend and then some.
The majors think they are bulletproof. I think they are wrong.
The majors should be purchasing heavily discounted assets as they become available. XOM might have jumped the gun somewhat, but they may also be depending upon the cyclic nature of the system. Low prices force less discovery and production, bringing higher prices. That may work one more time.
To whom would they sell their assets, versus taking loans?
The worst case would be a bluff, taking loans looks like they have a plan.
shallow sand Wrote:
“The majors think they are bulletproof. I think they are wrong.”
Thats not the thought process in the executive halls. The plan, just like every major US company is to keep stock prices up so they can cash out their stock option before the smelly stuff hits the fan. They there is zero interest in long term company stability as they all know the global economy is on borrowed time. All they are working to do is cash out before it all starts to fall apart.
I firmly believe it will all come part this decade. There is no way to kick the can another ten more years now that large numbers of boomers are moving into retirement, with no money saved for pensions, entitlements, and younger generations content on living at home with their parents & working minimum retail jobs.
I think that is what the majors are doing. Make it look like the companies have a future in order to prop up stock prices while they quietly cash out as much as they can.
It’s very correlated, but there are several other factors all discussed here.
In 2015 there was still big supplies of money for drillers, even with red ink. This is gone now, money supply is more tight.
And CEO payment was bound to increasing production. So the easy money was taken and the production was increased. Some companies got bancrupt – other took over with fresh money to waste.
This all is runnung out now in the USA, many more companies have to look at the money. Only some majors left with bottomless lending capacity.
Other price sensitivity is more indirect. Oil countries can go bancrupt on too low prices. Most propably Venezuela would have stayed producing more if priced have kept high, being able to channel some of the profit into maintance. So they hat to channel everything into more important stuff – Secret Service, Army and keeping their corrupt regime members happy. 41$ oil killed them, they are at ruin now.
Other gulf states, too. Iraqu is the first to fall when they get not enough money to keep their multi ethnic country together.
April 2015. $41/barrel. No virus.
That price did not stop shale production growth. The price is higher now than it was then.
Now wait just a cotton-picking minute here Watcher. Let us not get reeeee-diculous. That price did stop shale growth. April of 2015 US production was 9,655,000 barrels per day. Production started to drop the very next month, in May. By September of 2016 US production stood at 8,534,000 bpd, a drop of 1,121,000 barrels per day. Oil production turned up after that because the price turned up. The fact that oil production is much higher today is a direct result of the price of oil increasing.
This is one of the few places that Dennis and I agree. 😉 The price of oil affects the production of oil. The higher the price, the more oil will be produced. The lower the price the less oil will be produced. In fact, it was the price of oil increasing that made shale oil production economical. The price of oil is now so low that shale production is no longer economical.
Ovi,
Your post is on Seeking Alpha, courtesy of Ron Patterson
https://seekingalpha.com/article/4320827-u-s-production-growth-surges
Tony
Ron owns the peakoilbarrel site and they check every so often to see what’s new.
This has been quite a day. WTI temporarily dropped below $50 today. Last time it was bel0w 50 was in early January 2019. Tesla shares rose $129 today (19.89%). Greta Thunberg, the 17-year-old Swedish climate activist, has been nominated for the 2020 Nobel Peace Prize by two lawmakers in Sweden.
Sounds like everybody is going to rush out tomorrow and by an EV, mostly Teslas. We won’t need any more oil in about 6 months and Greta is going to bring Peace to the whole world.
A day to remember, Feb 3 2020. Further Iowa speaks tonight.
Switching to 100% EV would require a doubling of electric power production. Where is that going to come from? If it is a rapid ramp up then it is going to be natural gas. The economics of burning natural gas in your car as CNG will be better than burning it in a turbine with the transmission losses.
PV is growing faster than EV’s. However EV’s like humans are flawed and can’t leave the plantation. Most can not be charged directly from a PV Array. It’s like having a car you can’t put gas in. Hello… Most charging standards also make sure you can’t get energy out. WTF FGump! Each PV Panel is worth 3 miles a day Average.
Switching to 100% EV would require a doubling of electric power production.
How did you come up with that number?
Actually, it would require an increase of 20-25%. Over 20 years that’s 1% per year, or less than the 2% annual growth that utilities used to rely upon before LEDs screwed things up for them.
And, yes, that means that utilities are very excited about EVs.
The Tesla action is an epic short squeeze – Tesla is (was) one of the most shorted stocks. When the price crossed a long year resistance, this is normal.
Some hedge fonds are bleeding a lot of money, other squeeze them. This has not much to do with Tesla itself.
HHH could explain better what happens there, I think he has access to more stock data like short interrest.
Tesla has a lot of money invested in China currently. Last night after the PBOC eased monetary policy. Something equaled to around $200 billion US dollars. Yen traders ramped future markets. USD/JPY levitated US stock markets. Doesn’t mean they have anything under control over there regarding the virus. They just eased monetary policy. Which sent stock markets soaring globally. Oil didn’t get bought as you can see.
Stock markets don’t reflect reality. Haven’t for awhile. Anytime anything happens central banks flood markets with liquidity. Valuations are only real on paper.
I can’t tell you when it ends but i got a good idea about how it ends. One day central banks easing fails to do what it has done since 2009. And we get real and true price discovery.
Global oil supply has a lot to do with when that day they fail arrives. That’s why i read this blog. Might not agree with everyone’s point of view on certain things like price. But over all this is a very useful site. And i enjoy reading it.
I do think that there is more down side coming to global stock markets and this ramp that the PBOC gave the markets will get sold. That is also based on chart technicals.
HHH,
I agree there will a big correction for World stock markets. Not sure about the when.
What other sites do you find useful?
Resilience.org gives the EIA’s opinion on when US crude oil will peak. Understand this is just the EIA’s opinion. It is definitely not mine.
Peak Oil Review: 3 February 2020
The US shale oil boom will not burn out but will spend the next 20 years fading away, the US Energy Information Administration said Wednesday in its latest Annual Energy Outlook. Annual US crude oil output is expected to climb to 14 million b/d by 2022, an increase of nearly 7.6 million b/d in a decade. But domestic production will then level off, increasing by less than 400,000 b/d over the next decade as operators move to less productive plays and well productivity declines, according to the report. US oil output will begin a slow decline in the mid-2030s, falling another 500,000 b/d over the next decade and declining below 12 million b/d by 2050, EIA said.
In its reference case, EIA forecasts production in the Lower 48 to account for 70 percent of cumulative domestic output, peaking at 13.84 million b/d in 2032, accounting for 96 percent of total US output that year. Oil production in Alaska will climb from 480,000 b/d in 2019 to a peak of 910,000 b/d in 2041, due mainly to the development of fields in the National Petroleum Reserve in Alaska before 2030.
A good read on tier 1 areas in the Permian.
This is an interesting comment:
Another warning from a former Schlumberger executive noted that Permian performance results were misleading, because satellite data had revealed that a thousand wells that had been fracked had not been reported, skewing the basin’s overall performance to look better than it is.
https://www.desmogblog.com/2020/02/03/peak-permian-oil-production-schlumberger
COP released their Q4 results a few days ago and it contains this statement:
“Executed successful exploration program in Alaska and started drilling in Louisiana Austin Chalk.”
http://www.conocophillips.com/news-media/story/conocophillips-reports-fourth-quarter-and-full-year-2018-results-announces-preliminary-2018-year-end-reserves/
Meanwhile, back in November this article appeared and stated:
“Drillers find more water than oil in Louisiana Austin Chalk so far”; and
“In late September, Houston-based ConocoPhillips decided to “discontinue exploration activities” in the Louisiana Austin Chalk, then put its 234,000 leased acres up for a mid-October auction — for which results are confidential.
The company had spent $120 million pretax during third-quarter this year related to its operations. Its portfolio included leases in Avoyelles, East Baton Rouge, East Feliciana, Livingston, Pointe Coupee, St. Helena, St. Landry, West Baton Rouge and West Feliciana parishes.”
https://www.theadvocate.com/baton_rouge/news/business/article_8ffa607e-f736-11e9-83da-9760ee808305.html
Scratching my head to figure this one out.
Ovi,
Your first COP link is from Jan 31 2019.
COP crude oil production for lower 48 incl GoM went down from 277 kbd in Q3 to 274 kbd in Q4. No reference to Austin Chalk in 8-K.
https://conocophillips.gcs-web.com/static-files/159cfa93-f4d9-45b6-8662-e783deab283e
For 2018, 85% of this production was shale crude oil from Eagle Ford, Bakken, Permian, Anadarko and Niobrara.
https://static.conocophillips.com/files/resources/19-0043-fact-sheets-19q1-lower48.pdf
Tony
Thanks for waking me up. I saw January and stooped there.
I can now stop scratching my head.
Tony
I had seen clip on COP production was down and I grabbed the wrong article. I just went through the COP conference call and clipped the following from it.
Phil Gresh, JP Morgan Chase & Co, Research Division – Senior Equity Research Analyst [22]
Q: A couple of quick questions. First, just looking at the quarter, in the Lower 48, we saw some declines in the oil production quarter-over-quarter, NGLs and gas were up. I presume that was mostly mix effects. And the Big 3 was with Bakken and the Eagle Ford down. But just any thoughts you could share around that as well as we look out to 2020 and your guidance for 410,000 barrels a day there. Just any color you could provide around rig count and production cadence specifically for the Big 3?
Matt Fox, ConocoPhillips Company – Executive VP & COO [23]
A: Yes. Phil, it’s Matt here. The — yes, so I think you probably saw our numbers for the production individually for the Big 3. In aggregate, it was relatively flat. There was a — Eagle Ford was down a little bit just because of the timing for when we’re bringing wells on, and there was growth in the Permian, and the Permian production is a bit gassier than the Eagle Ford production. So that’s why there was that slight mix shift. In terms of the activity, the — we averaged 12-and-a-half rigs in the last year across the Big 3: seven in Eagle Ford, three in Bakken and two-and-a-half in the Permian. And that was — those were supported by six frac crews. You’ll have seen in our capital that as we go into 2020, it’s pretty much the same level of activity in aggregate to the same capital cost for the Lower 48 last year.
Q: I think first question maybe is for Matt. Matt, in Permian, the fourth quarter, we see a big jump sequentially. Should we look at it just the normal lumpiness because of the wells coming on stream? Or that this is signaling a beginning of a accelerating development pace and that we should assume the growth
starting in this year will be accelerating compared to the last couple of years?
A: Matt Fox, ConocoPhillips Company – Executive VP & COO
Yes. Thanks, Paul. Yes, we did have very strong growth quarter-on-quarter in the Permian. It was about 23% growth. But that is, as you sort of implied, there’s real lumpiness as we bring on new pads there. So we actually expect Permian to be relatively flat in the first quarter and then growth will resume again through the rest of the year. We had an unusually lumpy fourth-quarter
production.
So they just ramp it up and up and up, regardless of price and rock quality … not even mention it, they don’t care – short breaks in growth are only related to extending the infrastructure.
Are we still in the “we can even make money at 30$ a barrel” age ?
I think just about everybody here will want to read this thru, so I’m not posting excerpts.
https://www.vice.com/en_us/article/8848g5/government-agency-warns-global-oil-industry-is-on-the-brink-of-a-meltdown
OK, so the article says,
“The plateauing of conventional crude oil production in January 2005 was one of the triggers of events leading to the 2008 global financial crash, according to the report”
which many here on this board say is utter bullshit. I’m agnostic myself.
Not to mention the author has a history as a “truther”:
https://carboncounter.wordpress.com/2014/03/17/missing-links/
Yes indeed, the article is very interesting.
“This means that although the oil industry can’t cope with the lower prices, the global economy can’t cope with high prices. “I now see peak oil as being defined by a contracting window between an oil price high enough to keep producers in business and a price low enough for consumers to access oil derived goods and services,” said Michaux. ”
“Growth in GDP therefore amounts to a “debt fueled mirage,” according to the report. As we have not properly planned for the possible phasing out of fossil fuel energy, it is entirely possible that as energy systems, oil in particular, come to contract, we could witness “the peak of industrial output per capita sometime in the next few years.”
From the link above:
The role of QE in propping up the oil industry and wider global economy was not anticipated in traditional peak oil theory, which failed to predict the low oil prices endangering profitability.
Continuing:
The report offers the first independent public government assessment concluding that Saudi Arabia, once the world’s largest oil producer, is now probably approaching (and may already have passed) a production peak.
And:
While the productivity of shale oil wells has increased at first glance, the report says this has come at the expense of “observable decreases in real productivity.” Increasing production “has come at a cost of increased lateral drilling per hole and the increase of water, chemical, and proppant.”
So while average production from fracked US shale wells increased between 2010 and 2018 by 28 percent, in the same period water injection, chemical and proppant use increased by 118 percent. The report says this indicates the huge spike in extraction costs.
And again, if there’s even 1 experiment that fails to confirm a hypothesis, then the hypothesis must be discarded. Of course, if there’s heavily vested interest in the hypothesis then there will be handwaving to decry the experiment.
You guys jumped on 2016 dip without proving that was a shale dip vs some other oil fields.
But this doesn’t really matter. I only have to find one example. And I won’t even break a sweat. How about this one: July 2008 price $150/b. Production 5 million bpd. Price is now 1/3 of that. Production over double.
Y’all know this is true. There’s the number right there. Game over. I didn’t even have to play 1 month or 1 year games. It’s a compelling reality, oh and don’t think you can play an inflation card. 2% compounded over 12 years is 1.25. Not 3.0.
Besides which, it’s consumption that is more definitive. Price got down to $37 in 2016. It’s now 32% higher. The data trails about a year but the price last year was significantly above $37. Consumption globally . . . up 3%, laughing at the price.
As for this disaster stuff — which is more important to survival of civilization? Banks or oil? Banks got saved. Does anyone really think Bank of America or Citibank are in business today because of capitalism? Banks were saved with whimsical money. A few paragraphs of obfuscation and you can get money flow to oil, too.
Indeed. Everyone always knew that the oil in the shale was there. That oil in the tar sands was there. We just thought that oil needed to reach a price where its extraction was profitable. But that was pre-2008 thinking. What the financial crisis taught the frackers was that there is no bottom to the bailout bucket. When it comes to “U.S. Energy Independence” the sky’s the limit, there will always be someone else to hold the bag and then in the end the same folks who held the bag for Citi bank and BOA will hold the bag for the SUV and the American way of life.
Oil Prices Already Reflect Huge Demand Destruction
BP’s CFO Brian Gilvary said that the coronavirus could shave off 300,000 to 500,000 bpd from demand growth this year. “We will see how it plays out, but that will soften (demand). If OPEC roll their cuts through the end of year, that should sweep up any excess of supply and re-balance the market,” he told Reuters.
Dollar is setting up for a move higher. Dollar index is setting up for a move higher but i don’t just look at it. I look at all they other major currencies and what they are doing against the dollar. Our interest rate may be low but the rest of the developed world has lower interest rates than we do. So monetary flows end up going into US markets. Dollar gets stronger as markets go up. If Dow Jones can get above last month intraday high it’s no longer a bearish looking market. USD/JPY is sitting right up under a 4 year long trendline. Which if it breaks above it. It would be extremely bullish for all global stock markets. Break above 110.40 ish on USD/JPY opens door for Yen to go back to 125.00 which equals 1500 points. Which is a huge move.
GBP/ USD is on trendline support looking to break lower. This looks like a broad based move where dollar gains on everything else that is a currency. It creates a feedback loop where dollar strength leads to more dollar strength as the higher it goes the more liquidity it sucks in from abroad into US markets.
I’m looking forward to seeing the outcome and how it will manifest itself in commodity prices. Oil in particular. Jobs data comes out first friday of every month. If it beats expectations the dollar is going to pop and so will stock markets.
Keep in mind that dollar strength leads to real inflation for the rest of the world. Europe and Japan can’t raise interest rates to combat inflation.
Strong dollar blows up China too because they are pegged to the dollar.
Have you examined a trend line of your own accuracy?
I’m particularly impressed by how horizontal it is for your repeated projection over the past 6 months of an imminent 3+% 10-year Treasury rate.
Horizontal at 0.
Watch the dollar Watcher. GBP/USD broke it’s trendline. USD/JPY pulled back a bit from it’s trendline because stocks pulled back on Friday. BOJ already stated it’s ready to act. Virus = more QE= higher markets = stronger dollar. Treasurys are getting some of the flow too keeping a lid on interest rates. Heck ECB wants to use monetary policy to fund the green energy transition in Europe. ECB Green energy ambitions = stronger dollar.
I can keep going country by country. Central bank by central bank.
Maybe you’ll be Watching the dollar index when it hits 112.00 and let me know where price of oil is when it does. Currently the index is at 98.70 so a little over 1300 points above where it is at now.
A friend sent me jpgs of a major Chinese highway intersections in Wuhan with only 3 vehicles visible on 6+ lane roads. Another of just one pedestrian walking across what would be equivalent to I-95. If this is not some sort of spam photo and the authorities there are shutting down cities, will that not have an effect on the rest of the world markets? Less business, money flow into safe havens from afflicted areas, businesses here looking for local supply replacement instead of from China, etc. Will that not mask some of the dynamics of what you are talking about with the strengthening of the dollar?
US crude oil production peaked in 2019Q4 because US shale crude oil peaked in 2019Q4. XOM and COP both had production declines from 2019Q3 to 2019Q4. Occidental, which bought Anadarko, is the number 1 US shale oil producer at 500 kbd, reports 2019Q4 on Feb 28. If Oxy reports a production decline then this will confirm US crude oil production peak in 2019Q4.
https://www.oxy.com/Investors/Pages/default.aspx
Is that “peak” with a small p?
Or Peak?
Michael,
Any such peak is very likely to be temporary, probability about 80%.
Probability of US Peak 80% in 2019Q4.
Companies have been drilling the sweet spots or Tier 1 acreage for several years. Goehring has just released Q4 report which discusses high grading meaning drill sweet spots first.
http://gorozen.com/ bold is mine
“As we progress through 2020, the retrenchment of drilling activity, combined with the inability for drilling productivity to rise because of “high grading” will produce the potential for a significant disappointment in oil production. If rig counts turn much lower or if productivity continues to disappoint, US shale production growth might even start to turn negative as we reach the end of 2020.”
XOM and COP decreased shale crude oil production from Q3 to Q4. What is also a surprise is that many private companies’ production rates are struggling, according to Shaleprofile. For example, Endeavor, which is one of the biggest US shale crude oil companies, appears to have peaked as attached in the chart. Mewbourne, another large private company also appears to have peaked at 82 kbd, according to Shaleprofile.
US shale crude oil production grew by 3.65% from Q2 to Q3; 4.47% from Q3 to Q4, according to EIA LTO monthly report.
https://www.eia.gov/energyexplained/oil-and-petroleum-products/data/US-tight-oil-production.xlsx
My chart data shows a similar 3.67% growth from Q2 to Q3 but a much lower 0.78% from Q3 to Q4. The EIA LTO report was released on Jan 24, prior to quarterly company reports being released. There have been downward production surprises from the majors and also from private companies since Jan 24.
Occidental fourth quarter report is due on Feb 28. Oxy is the largest US shale crude oil producer at about 500 kbd. If Oxy announces Q4 downward production then that could confirm a Q4 Peak.
https://seekingalpha.com/article/4320841-occidental-petroleum-become-attractive-around-14-year-lows
If we consider all the tight oil data (excluding Oklahoma, Ohio, and W. Virginia) we have the data below from shaleprofile.com and the data for the most recent month will likely be revised higher by about 100 kb/d according to Mr. Peters.
If one looks closely at the chart below there have been many temporary peaks in tight oil output (2012, 2014, 2015, 2017, and 2018). Perhaps there will be others in the future, the final peak is likely to be between 2024 and 2028, with 2025 to 2027 a better guess (higher probability).
Tony
The weekly production number for Jan 31 was revised down by 100 kb/d. I wonder if this means the STEO projection coming next week will be lowered. Note that the Novemeber weekly number was bang on with the latest EIA monthly data.
Ovi,
I agree that EIA STEO projection will be lowered.
Tony, Ovi,
Yes the lower oil prices should lead to a lower estimate for future oil output.
The Jan 2020 STEO oil price forecast for WTI in chart below, the Feb 2020 report will likely have lower oil prices and lower output forecast.
As of 4:58 pm on Feb 7, 2020 WTI is at about $50/bo.
Looking at those numbers, one can only scratch their head and wonder: “How on earth did they ever arrive at those numbers?” The current price is $10 a barrel below their projection. But then, I guess the coronavirus explains a lot. No one counted on that.
But then, there is always one damn thing or another that no one counted on.
Ron,
Yes the extent of the impact of the corona virus was not apparent when that oil price forecast was made. A drop in consumption by China of 3 Mb/d has had a big impact on the price of oil.
A new variation of an oil shock?
Paul,
Perhaps an unnatural disaster, if rumors prove correct. In this case it would be a disruption of demand, rather than supply as in previous shocks.
Direct attention north.
New oil sands facility proposed that’ll generate 260K bpd for 40 yrs.
Trudeau has to give a yay or nay by the end of this month and the climate wackos are applying pressure. Ordinarily 260k would not justify focus in the context of precedent establishment, but to date activities in Alberta have been maneuvered around politically in such a way that no one decision has suggested policy.
For this new facility, it will be very difficult to make a decision that does not announce climate policy adherence versus oil, jobs, tax revenue. A recent pipeline decision maneuvered by allocating tax revenue from that pipeline to green this or green that. That’s a maneuver probably unavailable for this privately owned facility.
Note that Teck, the owner of this resource needs $75 oil to make the project profitable.
“According to estimates by Teck, which were dissected in a recent Twitter thread by energy analyst Andrew Leach, the company would need prices in the US$75 range to make a viable return on investment, and would require prices to continue rising from there”
Full details at:
https://nationalpost.com/news/canada/everything-you-need-to-know-about-the-20b-frontier-oilsands-mine-as-liberal-decision-looms
“Coronavirus Triggers “Biggest Shock” To Oil Markets Since Lehman Crisis”
“Evans-Pritchard said the plunge in consumption could be between three to four million barrels per day, adding that this amount is twice UK’s North Sea oil output.”
This consumption didn’t exist just over a decade ago
https://www.zerohedge.com/markets/opec-committee-fails-agree-proposed-production-cuts
Maybe their consumption will go up. Hauling a lot of medical stuff to and fro that was not hauled in the past.
Watcher
Have you seen the videos of Wuhan? Streets are deserted, much less oil consumption than normal, as that spreads to other major Chinese cities, consumption decreases even more.
Or increases. Maybe the information is bogus.
Maybe those videos were at 7 a.m. Or 6 a.m.
Maybe they’re faked.
If everyone is locked in their apartment they can’t go get food in their car. Maybe the food supplier now has to drive to every apartment, since there’s no point in taking it to a single store. No one can go to that store. The food supplier has to go from where he has food, back and forth back and forth.
And come to think of it, the military has deployed. They don’t worry too very much about miles per gallon when the PLA purchases vehicles. And those vehicles are going to drive a whole lot more than they are in normal times.
No idea. No one else has any idea either. They just won’t say so.
https://oilprice.com/Energy/Oil-Prices/Peak-Shale-Will-Send-Oil-Prices-Sky-High.html
510 page oil report from Finland Geological Survey
http://tupa.gtk.fi/raportti/arkisto/70_2019.pdf
page 155
“The recent boom in US tight oil (considered to be a market bubble by many analysts, is fuelled by low interest rates and record oil industry debt) has been responsible for most additional supply since the peak in conventional oil in 2005.
The date of peak oil production in the tight oil sector is very difficult to estimate due to the nature of modelling life cycles of shale oil deposits, it is likely to be in terminal decline within the next 5 to 10 years, with the possibility that it has already peaked due to contraction of upstream capital investment.
This means that Tight Oil while a short term investment bonanza, is not a long term solution to maintaining oil supply to meet global demand. Underneath Tight Oil supply, conventional oil still declines. Tight Oil does not invalidate peak oil, it merely postpones it for a few years.”
Nick has been posting the same paraphrased article for the past 5 years on oilprice.com. Maybe eventually he will be “correct”.
Updated chart below to include shale crude oil production from 58 companies including many private companies. My estimate is that 2019Q4 is about 290 kbd less than EIA.
The difference between the red and blue lines since 2019Q1 is mainly due to production excluded from prior acquisitions. I have backdated production from some acquisitions. For example, backdated acquisition production from Occidental acquiring Anadarko; Callon acquiring Carrizo; and Parsley acquiring Jagged are included since 2019Q1.
Great stuff Tony, thank you for your excellent contributions.
I have updated my US tight oil scenario using the AEO 2020 reference oil price scenario up until June 2045 when US wellhead oil prices reach about $93/bo in 2019$, then I assume oil prices remain flat until June 2047 and then start to decline to $86/b by April 2053. US tight oil is on a plateau from Jan 2024 to Dec 2028 at an average output of about 9750 kb/d. A lower oil price scenario with maximum prices at about $65/b (assumed Brent/US wellhead price spread of $5/bo) is also presented, along with the AEO 2020 tight oil reference case.
Clearly we do not know future oil prices or future well cost. I have assumed average well cost in each basin remains constant in 2019$ as new well EUR gradually decreases after 2021 in most tight oil plays and that the oil price follows the AEO 2020 reference case through mid 2045. After that point I expect oil consumption will begin to decrease at a faster rate than the decrease in oil production, leading to lower oil prices, I also expect oil prices are likely to be higher than the EIA assumes in the AEO 2020 reference case. The $93/b scenario has a URR of 96 Gb, the lower oil price scenario has a URR of 58 Gb. The EIA’s AEO 2020 reference tight oil scenario has cumulative output of 125 Gb through Dec 2050, the $93/b scenario has cumulative output of 95 Gb over the same period.
Note that many in the oil business believe the USGS mean TRR estimates are much too optimistic and those estimates are part of the basis of the $93/b scenario, so that scenario might be on the optimistic side.
The conclusion one would draw would be that the EIA’s AEO 2020 tight oil scenario is exceedingly optimistic.
Oil output on left axis units are kb/d, oil price on right axis is $/bo, either in 2018$ (for Brent low oil price case) or 2019$ (AEO oil price with maximum price of $93/b in 2019$).
STEO Jan 2020, about 1000 kb/d increase from Dec 2019 to Dec 2021. That does not seem unreasonable.
Below is an alternative model with a slower ramp up of Permian completions after the current slow down due to low oil prices. Under this scenario one could envision an undulating plateau in US tight oil output from 2020 to 2033 with tight oil output between 8000 and 8400 kb/d and an average rate of output of about 8200 kb/d. AEO 2020 and a low price scenario included for comparison, the new $93/bo price scenario has a URR of about 91 Gb (5 Gb less than the first model presented above).
The Primary Vision Frac Spread Count is down to 310 for the week ending February 7th, 2020
https://twitter.com/PrimaryVision/status/1225882410203668480
Tony,
Recent low was 275 on Jan 10, 2020, down 5 from last week after a rise of 40 from Jan 10.
The frac spread count is now only back to where it was pre christmas – historically spreads have increased from here but it looks as though spreads will fall further from here.
Jack,
Probably correct given the fall in oil prices which will make more new wells cash flow negative.
A new non petroleum post is up:
EIA’s Electric Power Monthly – January 2020 Edition with data for November 2019
Discussions relating to oil and gas production should continue under this post (US Production Growth Surges).
Global oil consumption is likely to be down significantly for 1Q 2020 because of the coronavirus. Simultaneously, oil is losing control of the narrative on Wall Street and other financial markets. Take a look at Tesla’s stock price over the last week, and compare that with your average shale oil company. And then of course there was Jim Kramer equating oil to tobacco.
Taken together, this makes a 2018 world peak look more and more likely. Remember, 2020 is the year that the shale oil industry both needed to show it could make a profit while also trying to scale the foothills of the debt mountain it created over the last decade and that is coming due over the next four years. Likely not possible at $70 oil, certainly not possible at $50.
Investment in oil is going to wither over the next decade, folks have completely lost interest in it. There may be a few brief revivals as supply outages hit and prices spike and collapse, but the dominant narrative is towards EVs and AVs. Look at Trump’s attempt to revive the coal industry, blaming it on regulations, only to have it continue to wither away under his presidency. This is actually helping the narrative more than anything the Democrats could do, because the continuation of fossil fuels no longer seems like a policy decision, but has the air of inevitability.
Other things to consider –
ICE car purchases are collapsing, down 4% in 2019 after peaking in 2017.
https://www.cnn.com/2020/01/20/business/global-auto-recession/index.html
US DOT approves first self-driving delivery vehicle last week.
https://www.cnn.com/2020/02/06/tech/nuro-self-driving-vehicle-houston-dot/index.html
Will coronavirus be contained or spread? This buzzfeed article is one of the best summations I’ve read –
https://www.buzzfeednews.com/article/danvergano/coronavirus-spread-flu-pandemic?ref=bfnsplash
Stephen
A drop of 4%, so only 88 million gas guzzling vehicles sold last year
EV sales down 26% from same time last year, that makes 4 months in a row where sales of electric cars were less than the precious year. Hardly a nail in the coffin for oil prospects
https://insideevs.com/news/389990/global-ev-sales-in-november-2019/
Wayne, a drop of 4% global auto sales is a big deal (especially if you are in the industry). This is in a year that there is no global recession.
If global sales decline in 2020 again, you may want to start to consider it writing on the wall for a big trend.
And yet true as you say, its not the end of the oil industry. There are over a billion ICE light passenger vehicles on the road in the world today. Thats not going to just disappear in a decade.
Hickory, it is a bigger deal in China where a large production oversupply has occurred in the last few years.
http://www.oica.net/category/sales-statistics/
Europe has been moving along nicely at 17 million sales per year for 15 years. Look at the growth in China, growing from 4 million to 24 million sales in the same time.
A few companies need to go bust so the rest will become profitable, it has happened all over the world in the last hundred years.
https://www.titlemax.com/discovery-center/planes-trains-and-automobiles/defunct-car-brands/
Anyway car companies are destroying the planet they deserve to go bust
Ovi,
In the post you have:
To further look into the question of completions and production, above is a chart comparing monthly well completions in the Permian with the monthly new well additions from Shale Profile. Shale Profile data is updated to October. What is striking is how there are fewer new monthly producing wells than completions. The difference between the two ranges from zero to 220, with 80 being a more typical difference. Why are there fewer new well additions than completions? Is the difference due to old wells being shut down? Are some completed wells of such low quality that they are not tied into the pipe gathering system and just added to the DUC count? Puzzling and looking for some answers or clarification.
At the EIA they have some documentation on the DUC spreadsheet at
https://www.eia.gov/petroleum/drilling/pdf/duc_supplement.pdf
They start with:
In its September 2016 monthly Drilling Productivity Report (DPR), the U.S. Energy Information Administration (EIA) introduced a supplement that provides monthly estimates of the number of drilled but uncompleted wells (DUCs) in the seven DPR regions.
Note that the drilling completion data is for all wells drilled in the Permian region and would include vertical and conventional wells. The shale profile data at
https://shaleprofile.com/blog/permian-monthly-update/permian-update-through-october-2019/
says the following in the text:
These interactive presentations contain the latest oil & gas production data from all 24,837 horizontal wells in the Permian (Texas & New Mexico) that started producing from 2008/2009 onward, through October 2019.
Note only horizontal wells are included at shaleprofile and in the EIA’s DUC spreadsheet both horizontal and vertical wells are included, the difference between the two sets of completion data is the vertical completions.
The jump in the difference for the most recent 2 or 3 months is simply due to incomplete data, the EIA guesses at what the complete data set will look like and shaleprofile just uses the actual completion data available.
At the end of the DUC supplement we have:
With the combination of continuous enhancement of data sources and model methodologies, the DPR strives to provide high-quality forecasts and actual historical settlement of DUC counts.
Note the “model methodologies” in the EIA “data”, I am confident Mr Peter uses limited modelling (and perhaps none) in his “first flow” well estimates.
Should have been “Mr Peters” in my comment above.
I asked Enno Peters about first flow wells for the most recent Permian Basin update through Oct 2019.
See
https://shaleprofile.com/blog/permian-monthly-update/permian-update-through-october-2019/
Here is the exchange:
Dennis CoyneFEB 09, 2020
Enno,
The sharp drop in first flow wells from August to September from 474 to 328, is likely due to incomplete data, and will likely be revised higher in the future. Do you do any modelling to fill in this missing data or do you just publish the data from frac focus and state agencies (TX and NM in the case of the Permian basin)?
REPLY
Enno PetersFEB 10, 2020
Dennis,
At this moment we do not model missing data.
Thank you, Mr. Peters.
It seems that at https://shaleprofile.com they do not use models to fill in missing data from state agencies, but simply report what they find from the Texas and New Mexico State agencies up to the date of the update, as well as data at fracfocus.org. The sharp difference between the estimates reported in the EIA’s DUC spreadsheet for completions and the completions (first flow wells) reported at shaleprofile is likely due to EIA’s statistical models being used to estimate the missing completions that have not yet been reported by state agencies. Currently this sharp difference is only evident in the most recent two months of the shale profile data (September and October 2019). The difference between the EIA’s completion estimate (DUC spreadsheet) and the first flow well estimate from shaleprofile from Jan 2017 to June 2019 is about 45 wells per month on average over that 18 month period. That 45 well difference reflects the average number of vertical well completions in the Permian basin over that period.
This time of year some attempts are made to get a measurement in India of oil consumption. Much of the timing (clearly before BP’s June release) is because India’s financial calendar is March to March and a previous political goal set to increase Indian oil production and thus reduce the proportion imported.
There is a measurement out of diesel consumption growth at 3-4% y/y. Diesel’s growth last year was 4.4%. The article suggested the measurement came from sampling.
India’s overall profile of consumption is Diesel 33%, gasoline 12% and “Other” (which includes their big item of LPG) at 41%. This measurement is not as large a decline as expected. (and probably too early a measure to reflect any virus issues (though India has few cases)). Useful to note that gasoline at 12% of total profile is not an aberration. It is typical for India, which is the #3 oil consumer in the world.
Some of the most up to date research on the current and near future state of oil production is embodied in the report “Oil from a Critical Raw Material Perspective” produced by the Geological Survey of Finland and published on 12/22/2019. I don’t know whether the reason I cannot find any discussion of the report on these forums/fora because I am a poor site searcher or because no one has had the time to plow through a 510 page pdf which you can download here: http://tupa.gtk.fi/raportti/arkisto/70_2019.pdf
However, you can find a concise review-cum-summary of the report at this site:
https://www.vice.com/en_us/article/8848g5/government-agency-warns-global-oil-industry-is-on-the-brink-of-a-meltdown
The Finnish report takes a few potshots at the peak oil community, yet at the same time confirms that its forecasts were essentially correct.
Quotes from the review: The report was produced as an internal research exercise for the Finnish government, which until 2019 held the Presidency of the Council of the European Union.
SNIP
The peer-reviewed report calls for the European Commission to consider oil as the world’s most important “critical raw material.” Despite offering a scathing critique of conventional peak oil theory, the report arrives at the shock conclusion that the economic viability of the entire global oil market could come undone within the next few years.
SNIP
As a result of this combination of geological challenges and above-ground market constraints, Michaux’s government study warns that a global peak in total oil production is either “imminent” over the next few years, or may already have happened, possibly in November 2018. But we will only be able to fully confirm the peak around five years after the fact.
SNIP
By 2040, this means the world would need to replace over four times the current crude oil output of Saudi Arabia, just to keep output consistently flat.
SNIP
Currently, the bulk of continued expansion in global supply is dependent on the United States. With the US shale sector on the verge of breakdown, the report warns that the “window of oil market viability is closing, which suggests the resumption of the 2008 correction will be soon.”
SNIP
Levels of global debt are now thoroughly out of control, the report says—finding that US government debt creation has been approximately twice the rate of economic growth over the last 40 years. By increasing the volume of debt, countries were able to maintain growth as costs of energy went up. As a result, most national economies now have debt to GDP ratio exceeding 90 percent, which means that they need to go further into debt just to keep their economies functioning while maintaining debt repayments.
Growth in GDP therefore amounts to a “debt fueled mirage,” according to the report. As we have not properly planned for the possible phasing out of fossil fuel energy, it is entirely possible that as energy systems, oil in particular, come to contract, we could witness “the peak of industrial output per capita sometime in the next few years.”
Daniel,
Further up the page I provided a link and a quote
510 page oil report from Finland Geological Survey
http://tupa.gtk.fi/raportti/arkisto/70_2019.pdf
page 155
“The recent boom in US tight oil (considered to be a market bubble by many analysts, is fuelled by low interest rates and record oil industry debt) has been responsible for most additional supply since the peak in conventional oil in 2005.
The date of peak oil production in the tight oil sector is very difficult to estimate due to the nature of modelling life cycles of shale oil deposits, it is likely to be in terminal decline within the next 5 to 10 years, with the possibility that it has already peaked due to contraction of upstream capital investment.
This means that Tight Oil while a short term investment bonanza, is not a long term solution to maintaining oil supply to meet global demand. Underneath Tight Oil supply, conventional oil still declines. Tight Oil does not invalidate peak oil, it merely postpones it for a few years.”
A key issue with the report is that it doesn’t do its own oil production forecast. For example, it talks about US shale oil starting of page 138 but no independent forecast.
https://en.mercopress.com/2019/06/12/exxon-mobil-begins-long-term-development-of-oil-and-gas-in-argentina-s-vaca-muerta-shale-deposits
6 mos old and not new, but buried in there is a mention of Qatar Petroleum. Is this new? Never heard of them. QP website talks only of local-to-Qatar oil/associated gas. Branching out?
Peripherally:
https://www.wsws.org/en/articles/2020/02/01/arge-f01.html
Some kind of world socialist website, the focus is a vote in Argentina to invite US troops in. Vague concept of securing oil in VM. Very vague.
Latest STEO shows US production stalling as I see practically no difference in production between February 2020 and December 2020.
Very little increase from March 2020 to Dec 2020 (30 kb/d increase, so close to nil). From Dec 2020 to Dec 2021, oil output increases by 780 kb/d, so the stall is temporary.
Latest EIA STEO crude production for 2020Q1 is estimated to be 13.25 mbd. My forecast is 12.85 mbd, 0.40 mbd less than EIA. My forecast is derived by extrapolating the production of 73 US shale oil companies and assuming no growth from Alaska or Gulf of Mexico. https://www.eia.gov/outlooks/steo/data/browser/#/?v=9&f=Q&s=0&start=201601&end=202104&id=&maptype=0&ctype=linechart&linechart=PAPRPGLF~PAPR48NGOM~COPRPUS&map=
However, latest EIA estimate for week ending 31 Jan 2020 is 12.90 mbd.
https://www.eia.gov/dnav/pet/pet_sum_sndw_dcus_nus_w.htm
Tony,
Your forecast might be correct, if oil prices remain at about $50/bo for WTI for the first quarter. Typically the EIA’s LTO estimate is pretty good. If we assume non-tight oil is unchanged from Nov to Dec we would have 2019Q4 at 12838 kb/d and Dec 2019 output at 12959 kb/d for US C+C output. The STEO forecast for Dec 2020 looks pretty reasonable at 13290 kb/d, an annual increase in output of only 331 kb/d. 2020Q1 for STEO is 13.16 kb/d, perhaps a bit too high, it will depend on oil prices and many other factors.
See
https://www.eia.gov/outlooks/steo/
Some interesting comments from the ND government about the peaking of the state’s oil production came out today.
Officials: North Dakota Oil Output May Peak Within 5 Years
BISMARCK, N.D. (AP) — North Dakota’s oil production may peak within five years as companies finish drilling the most prolific portions of the state’s oil patch, state and industry officials told lawmakers Tuesday.
Mineral Resources Director Lynn Helms, the state’s top oil regulator, said about 20% of drilling activity is now outside of the “core” areas of the western North Dakota’s oil producing region.
“The end of (core area-drilling) is on the horizon; we can see it from here,” Helms told the Legislature’s interim Government Finance Committee.
State and Industry officials. That’s interesting. One wonders what industry officials stood up to tell their lenders not to lend anymore.
shallow sand, Ovi
My Bakken Model based on https://shaleprofile.com well data used to create well profiles, reasonable economic assumptions, and the AEO 2020 oil price forecast. I assume new well EUR starts to decrease in August 2019, the average well profile in July 2019 was assumed to have an EUR of 396 kbo and well cost is assumed to be $9 million (full cycle). Peak in 2021 or 2022 for this oil price scenario, it is possible that higher oil prices might extend the plateau a bit, if it occurs by 2022. I expect a lot of capital will migrate to the Permian basin and higher prices may just affect the shape of the tail after 2025 or so.
Chart title mislabelled, the ERR of 8.7 Gb is cumulative output through 2050 for this scenario rather than 2040 as indicated in title. Cumulative output through Dec 2020 is about 3.8 Gb, Note also this scenario is for North Dakota Bakken/Three Forks tight oil only, Montana Bakken is not included.
Link to article:
https://billingsgazette.com/news/state-and-regional/officials-north-dakota-oil-output-may-peak-within-years/article_9b6f7b47-036b-5116-8b18-bbac902c2d5c.html
The state of North Dakota’s forecast is highly unrealistic, they expect at peak of about 1.8 Mb/d of C+C output. In addition, the following is expected after the peak:
Helms said the outlook now is for oil production to “plateau” for about a dozen years after a peak, then slowly decline by the end of the century to 1980 and 1990 levels of less than 150,000 barrels daily.
Let’s do some simple math with 1.65 Mb/d for 13 years and then a decline (linear) to 150 kb/d in 2100. Currently about 3.8 Gb of C+C have been produced by the Bakken/Three Forks play.
So we have 1.65*365/1000*13+1.635*365/1000*67/2=28 Gb. Then we add the roughly 4 Gb that have already been produced and we have a URR=32 Gb. The USGS F5 estimate for North Dakota Bakken/Three Forks is about 13 Gb for a TRR, ERR (resources that are profitable to produce) are always less than or equal to TRR and the F5 estimate has only a 5% chance that resources will be equal to or higher than this level.
My model uses the USGS mean estimate of TRR=10 Gb and then applies economic assumptions to arrive at an ERR of about 8.7 Gb.
Helms estimate is about 3 times higher than is likely, the man is blowing smoke. 🙂
Dennis. NDIC has always been very bullish. So to me, admiring Peak Bakken is a big deal for them.
shallow sand,
I agree. Just pointing out to anyone who read the article I linked that the NDIC expectations for URR are almost 4 times larger than a more realistic estimate based on the USGS mean TRR estimate, which many in the oil industry believe is already too optimistic. In other words, knowledgeable oil men would consider my 8.7 Gb URR estimate to be optimistic, not quite sure what they would say about an estimate that is 3.7 times higher. Perhaps they would use the term horse dooky in Texas. 🙂
“Our February US oil production figures are diverging materially from the EIA STEO (forecasted) figure of 13.22 mb/d.”
@HFI_Research
https://twitter.com/HFI_Research/status/1227311241284276224
Tony,
If we look at the HFI composite index after Nov 2019, it simply follows the leading indicator, if we look at the past the leading indicator is sometimes quite far off, such as Dec 2018 where it was about 225 kb/d too low. Not sure that leading indicator tells us much. As I have suggested recently, your 2020Q1 estimate may be pretty close given the low oil prices, in the past I have expected falling oil prices to have more of an impact than has been the reality (I would guess a fall of 200 kb/d and it would be 100 kb/d). Perhaps an average of your estimate and the Feb 2020 STEO will prove correct, or roughly 13 Mb/d for 2020Q1 (note the STEO 2020Q1 estimate is 13.16 Mb/d).
Tony
The February STEO has reduced their “January” estimate from the January report from 13,150 kb/d to 13,010 kb/d, a reduction of 140 kb/d. As I had mentioned earlier, the clues were there for downward revisions in the weekly numbers. Attached is a chart which shows how much the January estimates were lowered in February. The chart also shows an initial peak in the L48 in April/May before rising again in 2021, I am not sure what happens in 2021. The data shows a bump in GOM. However the GOM has a high decline rate and we need to ask how much will the decline reduce the expected new production.
Ovi,
I’m guessing that the March STEO will further revise Jan 2020 down by 50 kbd.
The 2021 production increase is EIA overoptimism. There is a Nov 2020 presidential election so EIA can’t show a 2021 decrease as that would imply peak US oil production.
That GoM bump is strange. GoM Sep 2020 was 1.93 mbd; Oct 2020 down to 1.83 mbd; and Nov 2020 back up to 2.01 mbd.
I agree with John Hess who said “key U.S. shale fields are starting to plateau, calling shale important but not the next Saudi Arabia.”
https://finance.yahoo.com/news/peak-shale-could-spark-offshore-210000497.html
Ovi, Tony,
The future oil price forecast was changed to reflect current market, that in part explains the new STEO forecast for Feb 2020.
The EIA STEO is very reasonable, given their guess at future oil prices. Obviously nobody knows the future price of oil, not tomorrow, and certainly not 22 months in the future. Output of C+C depends, in part, on the price of oil.
Chart below shows how the STEO monthly changed from Jan 2020 to Feb 2020.
I would also note that SouthLaGeo has suggested that the GOM could maintain a 2 Mb/d plateau for a couple of years given the new oil that has been sanctioned. In a few weeks George Kaplan might give us his views on GOM future output and perhaps other offshore areas as well. I have not seen his work yet, but some time in the second half of March he may have a post ready.
The forecast for L48 excluding GOM C+C output for the Feb 2020 STEO seems reasonable imo. Output increases by 960 kb/d from Dec 2019 to Dec 2021, if oil prices rise as forecast in the comment above the temporary peak in 2020 for US tight oil output of 8.54 Mb/d in Oct 2020 may be surpassed by April 2021.
I would put the probability that US tight oil output is as high as 8.6 Mb/d or more in April 2021 at about 75%, if the price of WTI is as high as the EIA has forecast over the Feb 2020 to April 2021 period or higher.
Forgot chart
Marathon Oil just released their 2019Q4 results. US crude oil production fell from 201 kbd in 2019Q3 to 196 kbd in 2019Q4. This fall is mainly due to Bakken falling from 92 kbd to 86 kbd.
https://ir.marathonoil.com/2020-02-12-Marathon-Oil-Announces-2-2-Billion-2020-Development-Capital-Budget-and-Reports-Fourth-Quarter-and-Full-Year-2019-Results?_ga=2.26659965.1114448062.1581557000-1306969802.1578783285
Marathon guidance for US crude oil in 2020Q1 is between 192 and 202 kbd. I use the midpoint of 197 kbd as my estimate which is only 1 kbd greater than 2019Q4 196 kbd.
ShaleProfile.com is also showing the beginning of a plateau for Marathon US crude oil production. It’s higher than company production numbers because ShaleProfile is probably including some wells which have been divested by Marathon.
https://shaleprofile.com/blog/us-monthly-update/us-update-through-october-2019/
Tony for all producers shaleprofile has the following, using all data seems the best approach, and note the last few months are likely to be revised higher as data becomes more complete from state agencies where the data is collected.
Dennis.
Based on what NDIC reported, it would appear best case scenario is slightly up there for 2020.
It doesn’t look like Eagle Ford will add significantly either.
OK, CO and WY aren’t substantial enough to move the needle significantly either.
It is now all about the Permian, as we have discussed before. Looks like it can still grow significantly for 3-4 more years. Despite this, long dated futures are flat.
There is a lot of complacency, similar to what we saw in the late 1990s, and early 2000’s when $25 per barrel was considered a high oil price.
Thanks Shallow sand.
I agree, for tight oil, it will mostly be the Permian basin that increases output and after 2023 it will need to offset decline from other tight oil basins.
Also agree most of the oil industry does not seem to be aware that a peak in oil supply is likely in the next 3 to 10 years, depending on the path of oil prices going forward.