A post by Ovi at peakoilbarrel
All of the oil (C + C) production data for the US states comes from the EIAʼs Petroleum Supply Monthly (PSM). At the end, an analysis of three different EIA monthly reports is provided. The charts below are updated to March 2020 for the 10 largest US oil producing states, (Production > or close to 100 kb/d).
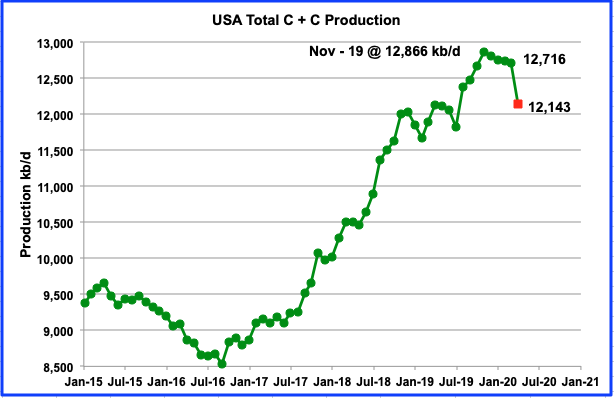
Today’s June 1 update shows the continuous slow decline in oil output from US oil fields from November 2019 to March 2020. March output was 12,716 kb/d, down by 28 kb/d from February’s 12,744 kb/d. Also it should be noted that February’s output estimate from the EIA’s earlier May report, 12,833 kb/d, has been revised to 12,744 kb/d, a downward revision of 89 kb/d. The Red dot is the projected April output from the May Monthly Energy Review.
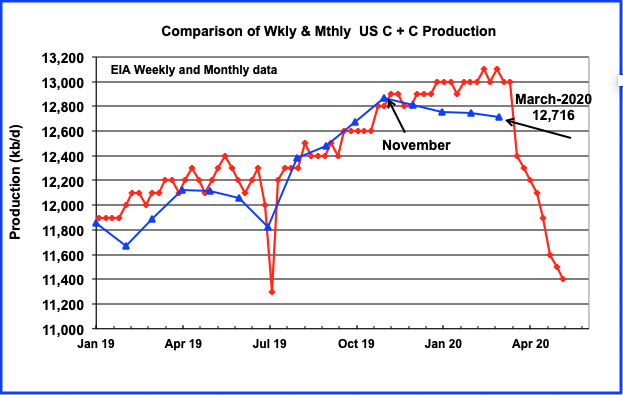
Above is a comparison of the EIA’s weekly production report with the EIA’s monthly report. Whenever this chart is posted, it receives many comments saying that they are just wild ass guesstimates. It looks like those comments have been correct since January.
However it should be noted that February’s output estimate from the EIA’s May report, 12,833 kb/d, has also been revised to 12,744 kb/d, a downward revision of 89 kb/d. Even the EIA’s MER which came out on Tuesday 26th, four days before the EIA 914 report, had March’s output at 12,926 kb/d, a full 210 kb/d higher than this months output of 12,716 kb/d.
When comparing the estimates from the various EIA offices, the EIA PSM has the smallest error.
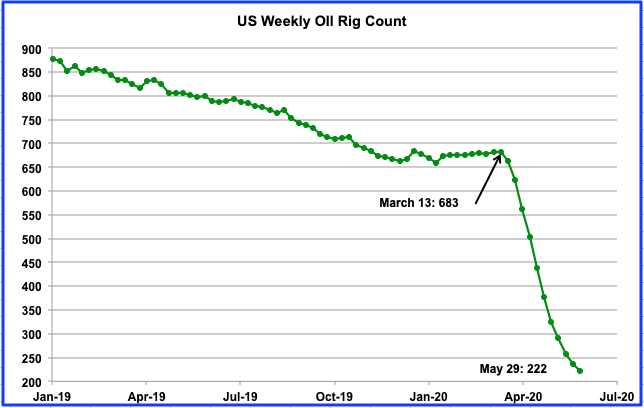
An indication of where US oil production is headed can be gleaned from the US weekly oil rig count. Data is provided by the weekly Baker Hughes rotary rig count report. From March 13 to May 29, 461 rigs were taken out of service, a drop of 67.5%. While in the last weeks of March and the first few weeks of April, the rig down was dropping by 50 to 60 each week, the drop in the week of May 29 had slowed to 15.
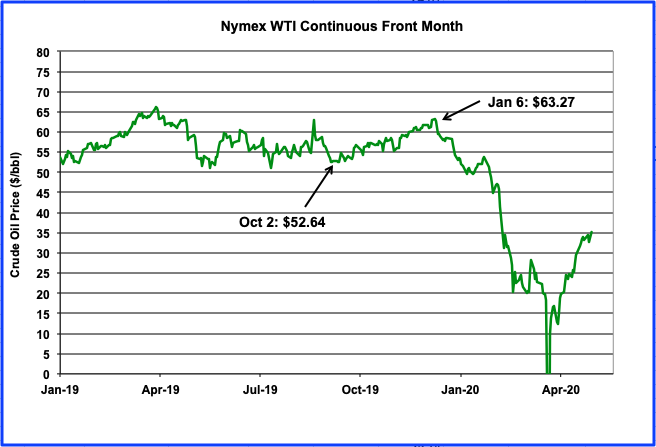
Prices for a barrel of WTI were reasonably stable for most of 2019 until early October. From early October to January, the price climbed from $52.64/b to its high on Jan 6 to $63.27. Prices began their precipitous drop after that and output slowly followed. While the price of WTI hit an official one day low of (negative) $- 37.63/b on April 20th, a more market realistic low of $10.01/b was reached the next day. As of May 29, 2020, the price of WTI had recovered to $35.23. Also the front month contango is currently in a more common range of 30¢ to 50¢ as opposed to the $3 and $4 when it collapsing in March.
The 64k question now is: When will US production reach its low point? At what price will US production begin to recover from its steep plunge?
RANKING PRODUCTION FROM US OIL STATES
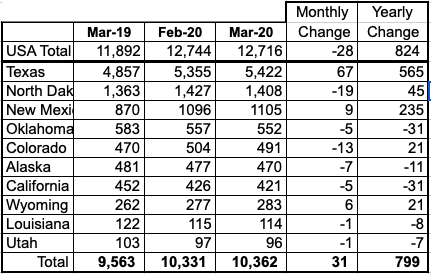
Listed above are the 10 states with production previously greater than 100 kb/d. This month Utah fell below 100 kb/d again but will be retained for continuity. These 10 accounted for 10,362 kb/d (81.5%) of production out of a total US production of 12,716 kb/d in March 2020. US year over year production was less than 1,000 kb/d and will be like that going forward for many months. Note that of these 10 states, three still had gains in March, Texas, New Mexico and Wyoming. Only the top three had YOY gains.
Not shown in the table is the GOM which produced 1,932 kb/d in March and would rank between Texas and North Dakota.
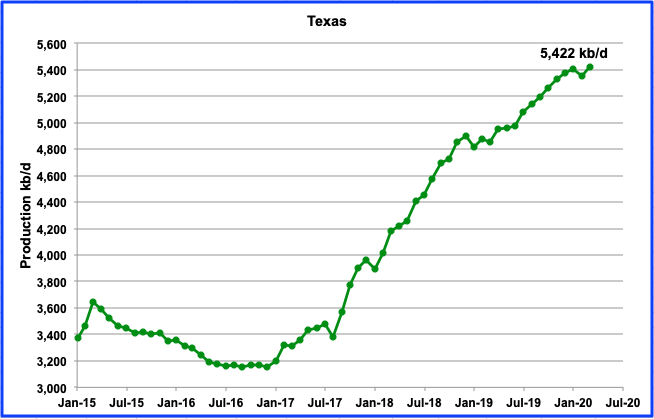
Production in Texas increased by 67 kb/d to 5,422 kb/d in March. Note that the February estimate of 5400 kb/d from the April EIA report was revised down by 45 kb/d to 5,355 kb/d in the May report.
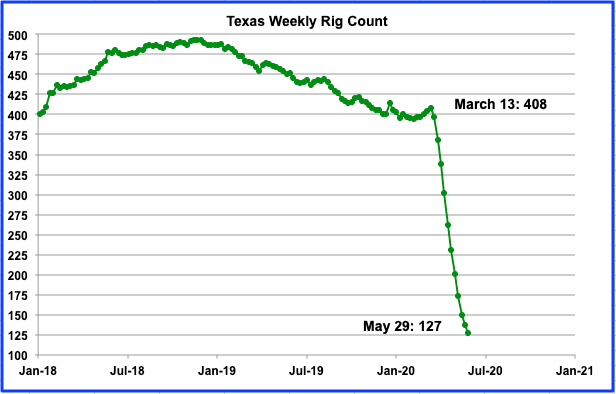
From March 13 to May 29, the Texas rig count dropped by 281 or 69%. An output drop will follow in April.
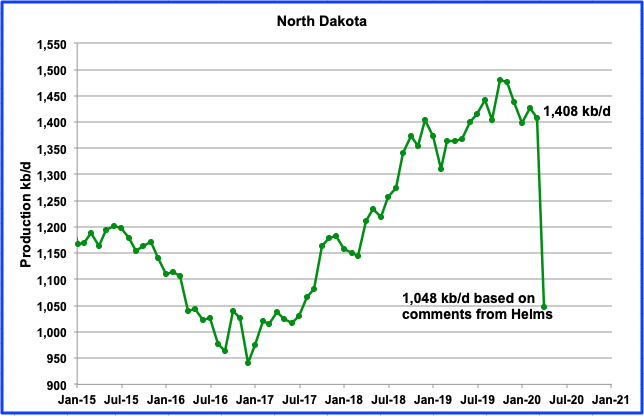
North Dakota’s oil production began dropping in October 2019 after peaking at 1,480 kb/d. However it increased for one month in February only to decline again in March to 1,408 kb/d. The April estimate is based on Helms’ comments below.
According to this April 21 report “State Mineral Resources Director Lynn Helms told the North Dakota Industrial Commission some 5,000 wells have been shut down in recent weeks, accounting for about 300,000 barrels of lost oil daily. Helms estimated the state has lost up to 60,000 barrels of oil production in “the last 24 hours” as oil prices crashed and in what Gov. Doug Burgum has called a potential “economic Armageddon for North Dakota.”
Below is an interesting statement from that report. Can anyone verify the stated cost to restart a well?
“We know operators are going to have limited capital,” Burgum said. Helms said a well could cost $50,000 or more to bring it back online and producing.
5,000 x 50,000 = $250,000,000 is a lot of capex.
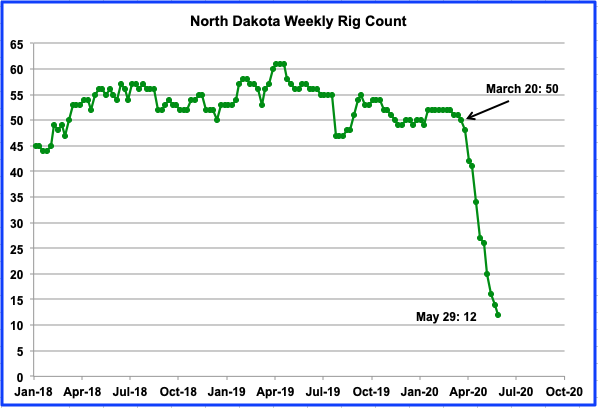
From the week of March 20 to May 29, the North Dakota rig count dropped by 38 or 76% to 12.
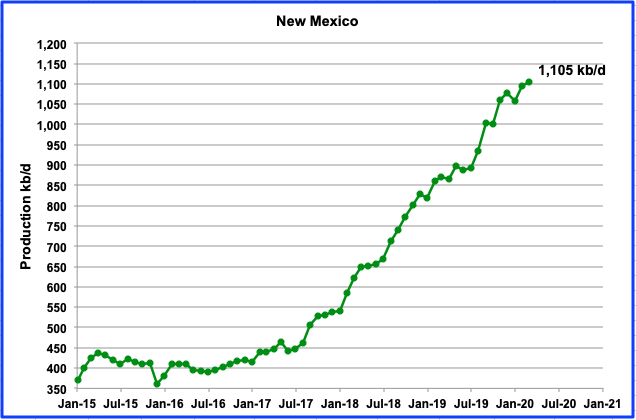
New Mexico was one of only three states to increase its production in March. Production was up by 9 kb/d to 1,105 kb/d.
In April the State land office issued an emergency rule allowing oil and gas companies to voluntarily shut in, or close, their wells without penalty, and regulators said many companies are doing so because they can’t ship their oil anywhere.
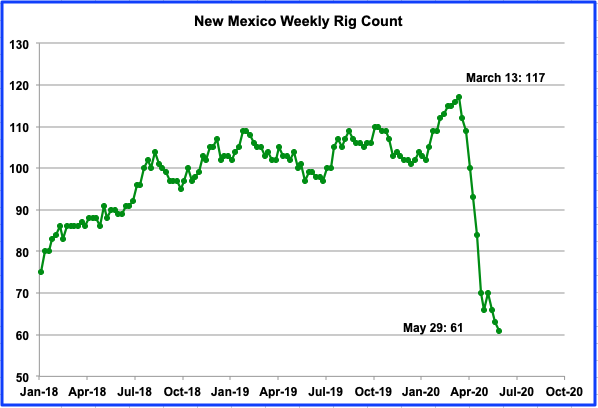
From March 13 to May 29, the New Mexico rig count dropped by 56 or 48%.
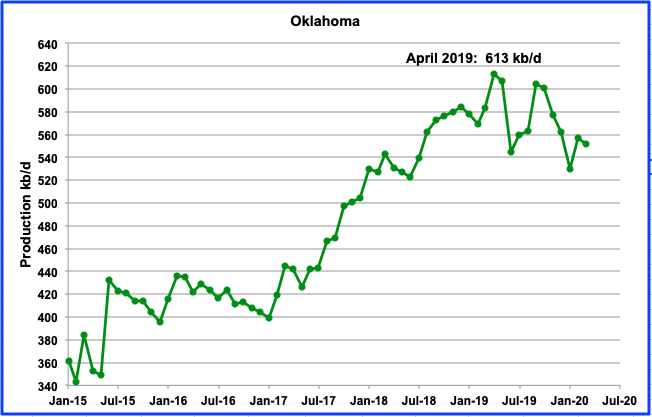
Oklahoma output rebounded in February after declining for four months in a row but resumed its decline in March. Output dropped by 5 kb/d to 552 kb/d. Peak output occurred in April 2019 at 613 kb/d.
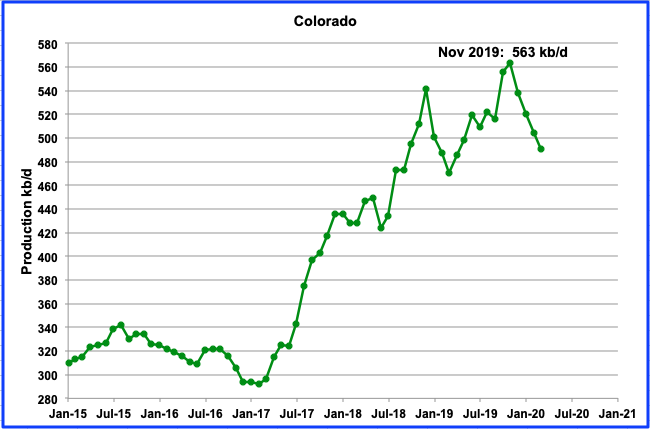
Colorado production declined by 13 kb/d in March to 491 kb/d from 504 kb/d in February. Colorado production has dropped steadily since November 2019. The new environmental regulations are taking their toll on drilling activity and oil output.
Over the period November to March, the number of operating rigs dropped from 21 to 19. See chart below. However over that same time, output fell by 72 kb/d or 12.8%. Seems like a large drop for such a small reduction in rigs.
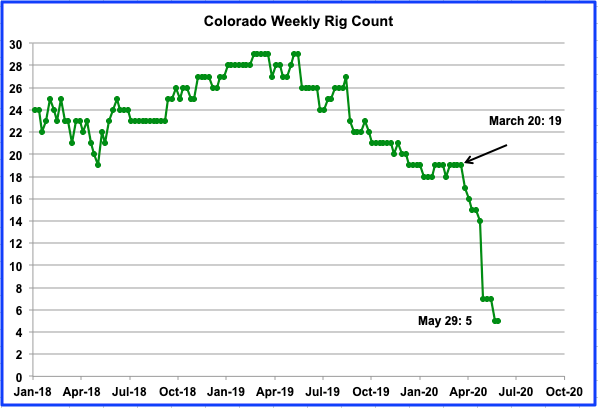
From March 13 to May 29, the Colorado rig count dropped by 14 or 74% from 19 to 5.
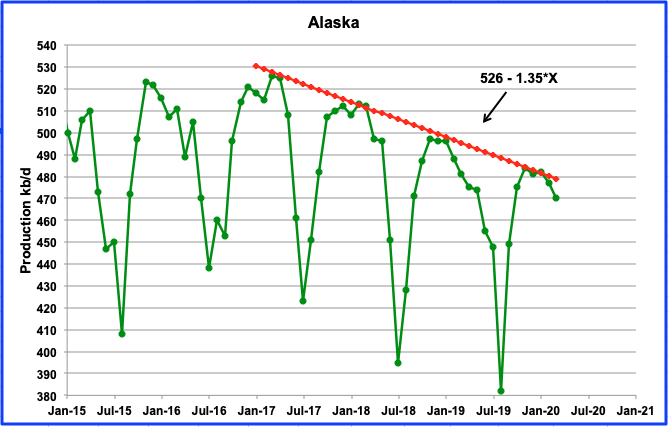
Alaska production has started its annual summer decline. In March production dropped 7 kb/d to 470 kb/d.
The Arctic Today is reporting that “ConocoPhillips, the state’s top oil producer, announced last week that it will cut North Slope production by 100,000 barrels per day, starting in late May”. Exploration well drilling is also being cut back due to CV-19.
The article contains this statement: “Production averaged 502,250 barrels per day in March and slipped to an average 490,252 barrels per day in April, according to the Alaska Department of Revenue.” This implies that NGPLs in March were 32 kb/d or 6.4% of all liquids.
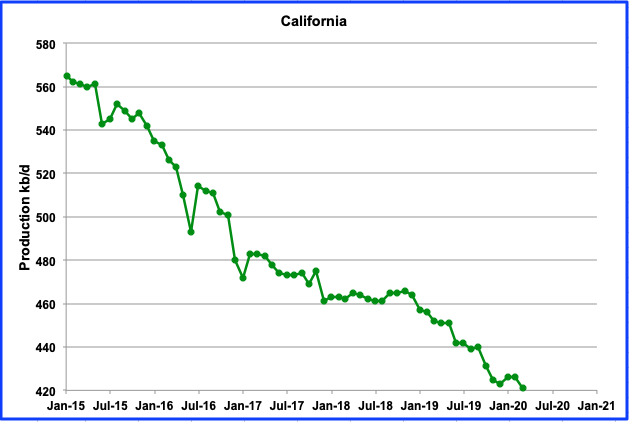
California’s slow output decline has resumed. March production was down by 5 kb/d to 421 kb/d. Over the last three years, the average decline rate has been close to 21 kb/yr.
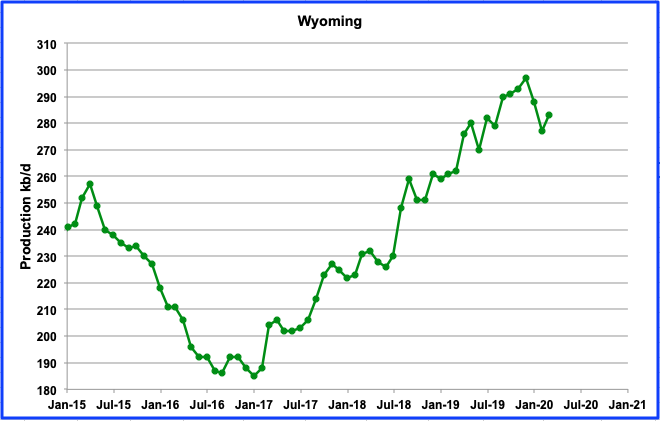
Wyoming increased production by 6 kb/d to 283 kb/d in March. During the week ending May 29, Wyoming had 2 oil rigs in operation, down from a high of 20 in January 2020.
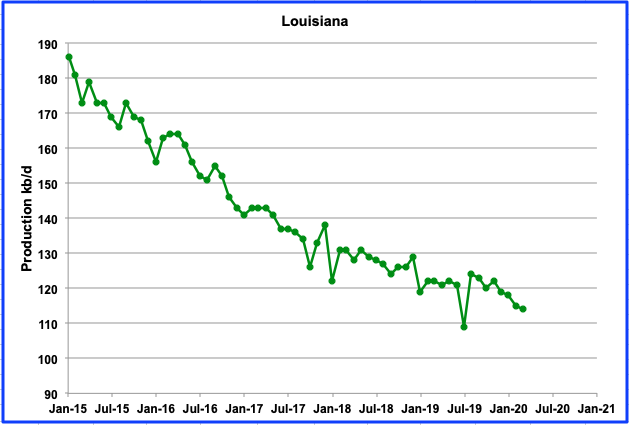
Louisiana’s output has been in decline since August 2019. In March production was down by 1 kb/d to 114 kb/d. In January 2020, on average 22 rigs were operating while there were 13 in the week of May 29.
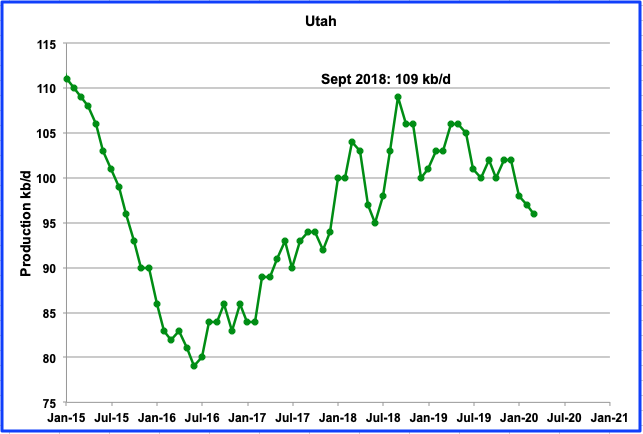
After the low in June 2016, Utah production peaked in Sept 2018 at 109 kb/d. Since then, there has been an overall decline of 13 kb/d. March production was down by 1 kb/d to 96 kb/d.

GOM output keeps bumping up a production ceiling of 2,000 kb/d. In March output dropped by 42 kb/d to 1,932 kb/d.
UPDATING EIA’S DIFFERENT OIL GROWTH PERSPECTIVE
1) DRILLING PRODUCTIVITY REPORT
The Drilling Productivity Report (DPR) uses recent data on the total number of drilling rigs in operation along with estimates of drilling productivity and estimated changes in production from existing oil wells to provide estimated changes in oil production for the five key tight oil regions.
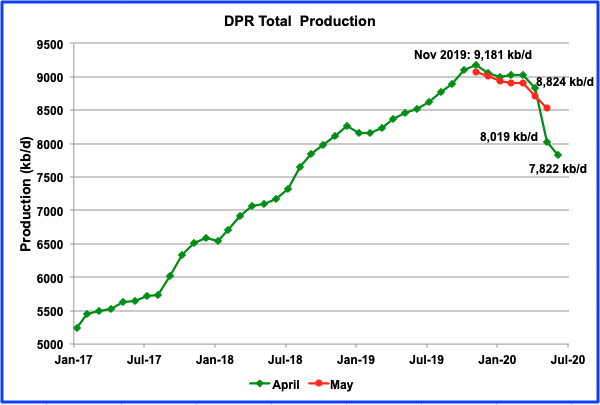
Above is the total oil production from the 7 basins that the DPR tracks. Note that the DPR production includes both LTO oil and oil from conventional wells. Comparing the April and May projections, one can see that the estimates before May were revised up while May had a very large downward revision.
According to the May DPR report, LTO oil and conventional oil output peaked in November 2019 at 9,181 kb/d, revised up from the 9,062 kb/d estimate in the April report. The largest revision occurred to May’s output. May output is now expected to decline by 805 kb/d to 8,019 kb/d. The projected output in June is 7,822 kb/d. The contributions to the output decline from three major basins are shown below.
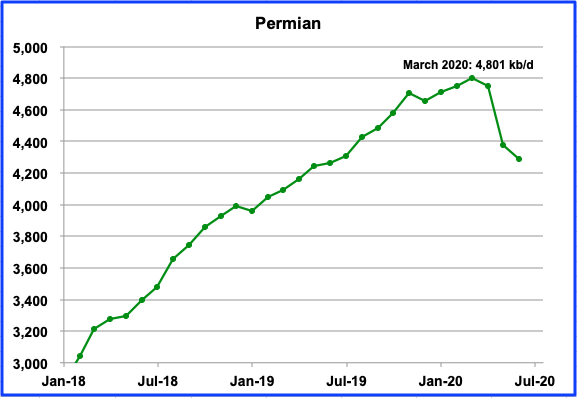
The Permian is expected to drop by 372 kb/d in May and a smaller drop of 87 kb/d is projected for June.
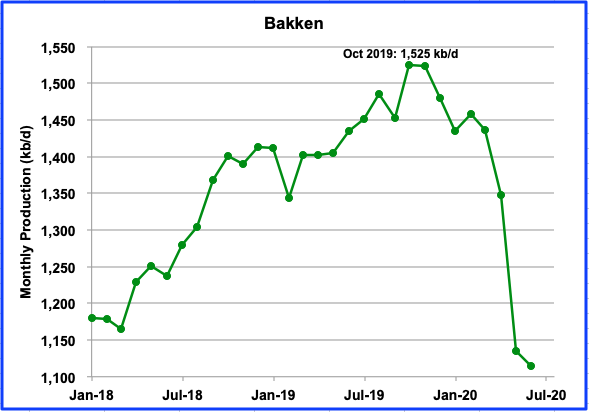
Bakken output dropped by 213 kb/d in May to 1,135 kb/d. June output is expected to be down by a smaller 21 kb/d to 1,114.
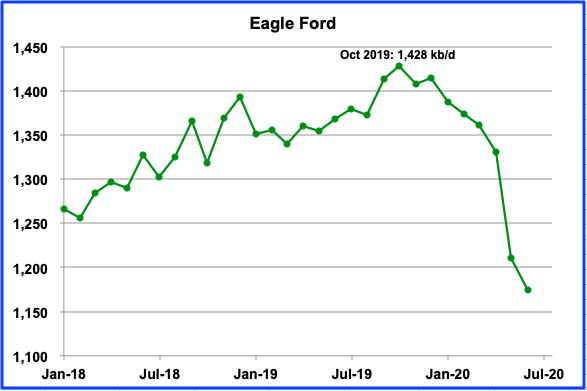
Eagle Ford’s May drop was 121 kb/d and June’s drop is projected to be 36 kb/d to 1,174 kb/d.
2) LIGHT TIGHT OIL (LTO) REPORT
The LTO database only provides information on LTO production from seven tight oil basins and a few smaller ones
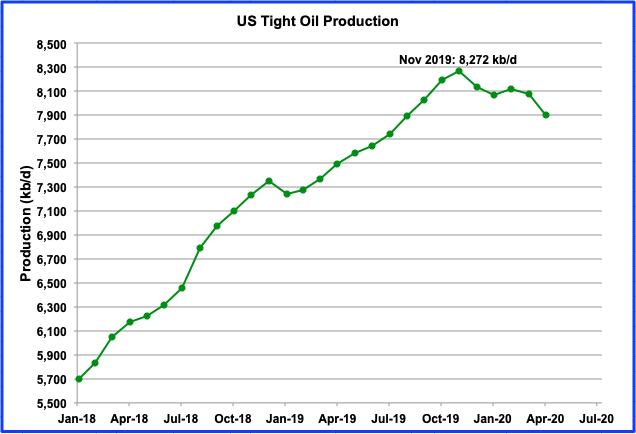
The LTO only projects output to April 2020. Overall LTO output is only expected to drop by 176 kb/d from March to 7,904 kb/d in April.

Clearly the almost linear increase in LTO output from the Permian basin has stopped. Production was flat in March and dropped by 45 kb/d in April to 4,084 kb/d.
3) SHORT TERM ENERGY OUTLOOK (STEO)
The STEO provides projections for the next 13–24 months for US C + C and NGPLs production. The May 2020 report presents EIA’s oil output projections out to December 2021.
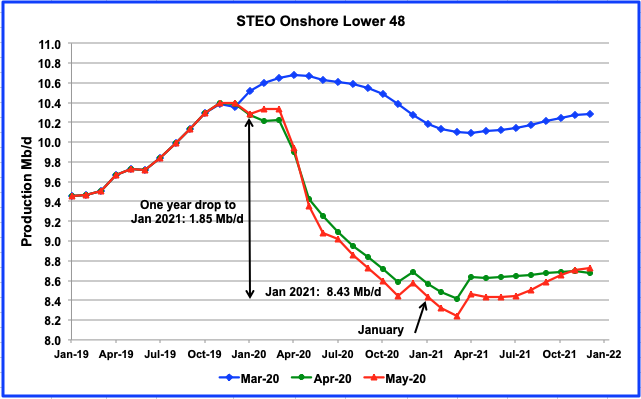
The May STEO report has revised their April output projection down slightly from the earlier April report. The biggest revision is to March 2021 when output is revised down by a further 0.18 Mb/d and marks the end of the decline. The overall drop from January 2020 to January 2021 is projected to be 1.85 Mb/d.
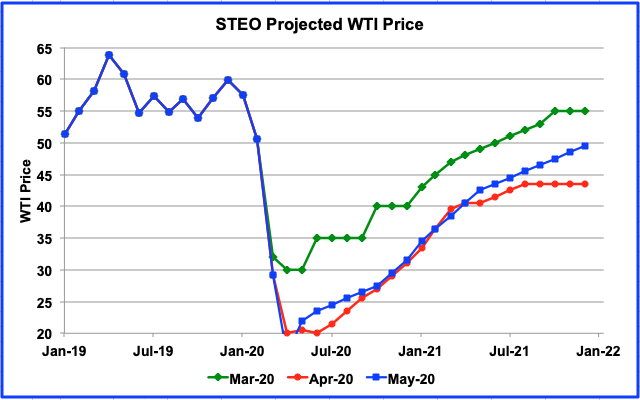
Now that the price of WTI has moved closer to $35/b, it appears that the STEO March projection is closer to the late May price of $35/b than their May estimate, which was issued on May 12th when oil was $25.78/b.
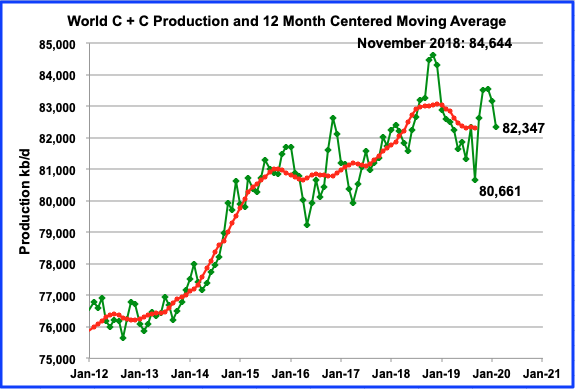
World oil output dropped by 810 kb/d from 83,157 kb/d to 82,347 kb/d In February. Biggest decliners were Libya (630), Brazil (196) and Saudi Arabia (100). Biggest gainers were Norway (107), Iraq (100), Iran (55) and Guyana (52).
Since we have been staying home a lot more these days due to the pandemic, we have been doing more shelf cleaning. I came across this June 2004 National Geographic, which I distinctly remember keeping. Thought it contrasted perfectly with the situation we are in these days, supply glut and cheap gasoline. Stay safe everyone.
147 responses to “US Oil Output Continues its Steady Decline”
I am reposting this comment from yesterday because I think it deserves more attention.
Nate Hagans says the peak in world production was October 2018. Nate states that it would have been in October 2018 had Covid-19 never happened and he explains why. I agree with him on this point.
The State of The Species 2020 – Nate Hagens
His peak oil statement starts at about the 15-minute mark.
Nate Hagens, Director of EnergyandOurFuture.org, covers the state of the economy, environment and human cultural situation in the face of the recent Coronavirus. Lecture is 1 hour 8 minutes followed by 45 minutes of question/answer (link: https://youtu.be/EXu4wdrl3NY ) (there were a few bandwidth issues were the sound briefly flanges).
Ron,
Nate’s talk was excellent. His guess is that the World economy never recovers from the current crash,
if he is correct, then 2018 will be the peak. I like many of his suggestions, but it is unclear that they will be implemented in the near term (say over the next 15 to 20 years). (I am thinking of the US becoming more like Canada or Sweden in it’s social policies, or nationalizing the Oil industry, etc).
A scenario with 2800 Gb of conventional World C C URR and about 130 Gb of extra heavy oil from Venezuela and Canadian oil sands combined and a conservative tight oil World URR of 27 Gb could potentially see a scenario like the one below where extraction rates increase to 7.8% for conventional C C (from producing proved reserves) by 2041. Just an alternative possiblity to a peak in 2018 (peak in this scenario is 2033 at 84.5 Mb/d), where it is assumed the World economy does eventually recover from the current economic crisis.
Ovi,
From MER Petroleum section notes on Table 3.1
https://www.eia.gov/totalenergy/data/monthly/pdf/sec3_n.pdf
Table 3.1 Sources
1949–1975: Bureau of Mines, Mineral Industry Surveys, Petroleum Statement, Annual, annual reports.
86 U. S. Energy Information Administration / Monthly Energy Review May 2020
1976–1980: U.S. Energy Information Administration (EIA), Energy Data Reports, Petroleum Statement, Annual, annual
reports.
1981–2001: EIA, Petroleum Supply Annual (PSA), annual reports.
2002 forward: EIA, PSA, annual reports, and unpublished revisions; Petroleum Supply Monthly, monthly reports;
revisions to crude oil production, total field production, and adjustments (based on crude oil production data from:
Form EIA‐914, “Monthly Crude Oil, Lease Condensate, and Natural Gas Production Report”; state government agencies;
U.S. Department of the Interior, Bureau of Safety and Environmental Enforcement, and predecessor agencies; and Form
EIA‐182, “Domestic Crude Oil First Purchase Report”); and, for the current two months, Weekly Petroleum Status Report
data system and Monthly Energy Review data system calculations.
Bold added by me. For the MER the most recent 2 months are based on an interpolation of the Weekly Petroleum Status Report (as I have shown in the past, the Weekly output numbers are based on STEO estimates). Using the most recent Weekly report I get
March 2020, US C C =12945 kb/d
April 2020, US C C =12160 kb/d
I get these estimates by taking weekly output for each full week and multiplying each by 7 to get total barrels of output, for partial weeks, I multiply weekly output by number of days that week, I take monthly total and divide by number of days that month (31 days in March and 30 days in April).
For comparison the MER has
March 2020, US C C=12926 kb/d
April 2020, US C C=12143 kb/d
This is a bit different from my calculation, but the EIA may use some other method in their “Monthly Energy Review system calculations.”
In any case this is the reason for the difference between the MER and PSM, the PSM data is tightly held until the data is released because it affects the oil market. The players in that market know the MER recent 2 months of data is model based (in other words they give it little weight) and the the PSM is the real deal based on industry survey data totaling 90 to 95% of total C C output (only large oil companies are required to participate in these these surveys). The market players also realize the most recent few months of the PSM are often revised later as State level output data becomes more complete over time (typically 12 to 18 months after initial data release for the data to become 99.9% complete.)
Dennis
Thanks for this info.
For the weekly petroleum status report see page 37-38 at link below
https://www.eia.gov/petroleum/supply/weekly/pdf/wpsrall.pdf
An excerpt:
Data Obtained Through Models
Domestic Crude Oil Production (Tables 1 and 9)
EIA estimates weekly domestic crude oil production using a combination of short-term forecasts and the latest available production estimates from Alaska. The four data elements contributing to the estimate are:
• the most recent Short-Term Energy Outlook (STEO) model estimate (including interim estimates) for average daily production for the lower 48 States and the Federal Gulf of Mexico (GOM) (STEO table 4a: http://www.eia.gov/forecasts/steo/data.cfm?type=tables);
• daily production volumes delivered from the North Slope of Alaska to the Trans-Alaska Pipeline System (TAPS) (reported to EIA by the Alyeska Pipeline Service Company);
• daily volumes of natural gas plant liquids produced on the North Slope delivered to TAPS (reported to EIA by BP); and
• daily production for South Alaska estimated from monthly production reports (lagged by two
months) from the Alaska Oil and Gas Conservation Commission (AOGCC).
Most of the uncertainty in the weekly estimate is associated with the STEO forecast for lower 48 and GOM production. For example, when lower 48 crude oil production is either increasing or decreasing rapidly, the accuracy of the estimate for any particular month is likely to be reduced. During tropical storms or hurricanes that affect Gulf of Mexico oil production, near real-time daily shut-in volumes reported by the Bureau of Safety and Environmental Enforcement (BSEE) are subtracted from the daily lower 48 estimate. See Previous STEO Forecasts at http://www.eia.gov/forecasts/steo/data.cfm?type=tables
for comparisons of current and previous monthly STEO forecasts for lower 48 oil production and percent changes for STEO quarterly forecasts.
The weekly estimates of domestic crude oil production are reviewed monthly when the Short-Term Energy Outlook (STEO) is released to identify differences with recent trends in survey-based domestic production reported in the Petroleum Supply Monthly (PSM) and other current data. If a large difference between the two series is observed, the weekly production estimate may be re-benchmarked on weeks when the STEO is released.
I would note that it is not so much a rapidly changing rate of production that causes the weekly estimates to be incorrect (say production increasing by 1.2 Mb/d per year), it is a change in the rate of change that is the problem. So if the second derivative is close to zero, the forecast may prove correct. In many (probably most) cases the slope of the output curve changes (second derivative is positive or negative) and forecasts typically assume a continued linear rate of increase which proves incorrect. The most recent 4 to 8 weeks of the weekly petroleum status report are based on the STEO forecast for US L48 C C output and in many cases these forecasts are not very accurate, when that is the case the weekly output data will also be inaccurate.
https://rigcount.bakerhughes.com/na-rig-count
Focus in chart below on US total oil rig count and horizontal oil rig count. Note that historically there has been about a 2 month lag between changes in rig counts and changes in oil output. So the steep drop in rig count since the end of March (trailing 4 week average of 663 oil rigs) to the week ending May 29 (trailing 4 week average of 252 oil rigs) is likely to be seen in June (April average about 415) and July (May average oil rig count about 250), if history is an accurate guide. Note the shut in of a lot of stripper well output in April and May, might shorten the historical lag as such a widespread stoppage of output due to the oil price crash in April is unusual.
Holy dilbit Batman, Freefall from ~700 to 200 in days.
So.. 100% of US wells are Unconventional in May?
Long timber,
Probably the May rig count will be reflected in July output, but probably not a lot of conventional wells drilled in May.
For May the average directional plus verical oil rig count was about 23 oil rigs, for horizontal oil rigs it was 230. The split between directional and vertical rigs was 19/4.
I am not sure of the cost to re-start an unconventional well.
I would note than many of the older unconventional wells on artificial rod lift were pumped intermittently. This is because the fluid level is so low that the down hole pump ends up sitting above the fluid level, and has to be shut down until the fluid level in the well naturally rises to a level back above the pump.
Most of these older unconventional wells have equipment that automatically shuts them down when the well bore fluid level becomes too low, and that restarts them again when the fluid level rises above the pump sufficiently.
We have vertical wells that experience the same thing. We don’t spend the money on the equipment to automatically shut them down. We instead watch these low fluid volume wells closely, and through some trial and error determine the best approach for how long they should pump.
We shut down all but a handful of our wells in April, some before 4/20 and many more after 4/20.
We reactivated most of the wells from 5/16 to 5/22. The most marginal ones are still down. The few failures from before April are still down, except for two key wells we worked over last week. Those were the first two work overs since early March. We do not incur much additional cost when we restart wells that have just been down for 4-8 weeks in warm weather.
The majority of the wells in our little field are still down. Q1 2020 was the first quarter where field wide production was under 2,000 BOPD, since discovery in 1905. The second quarter will be much, much worse.
It will be interesting to see April, May and June production for USA and Canada in the upcoming months. It will also be interesting to see the 2nd quarter 10Q from the various US majors and independent E & P’s. Without a doubt the worst quarter I can recall.
SS,
The discovery date of the field you work of 1905 caught my eye,, I gather from your comments the field has been on continuous production since then? I suspect the recent producing wells produce at a pretty high water cut? Any idea what kind of recovery factor you’re currently at – that is, total oil recovery to date / original oil in place? I gather that your producing wells don’t qualify as stripper wells, right? but it is all conventional production?
What is the level of subsurface work that is done to support the field? Ever had a 3D seismic survey shot over the field? Has the field ever had anything more than conventional, primary production such as water flood, etc?
SouthLa Geo.
Yes. Continuous production since 1905. Probably 100 BW +/- for every BO, although wells vary greatly.
I should know recovery factor but don’t. 270+ million BO recovered, Field is approximately 20K acres.
All wells producing are stripper wells. All 2,500 +/- are under 15 BOPD. Very little gas, very rare to see a well that can burn a flare. One I can think of burns a flare that is maybe 6” high.
Primary producing zone is a sandstone that ranges in depth from 850’-1,100’, with most wells around 950’. Thickness averages about 15’, some as much as 30’ or more. Gravity generally 31-36 API, low sulfur. Some is in 20s.
There are deeper zones up to about 4,100’, not as explored as shallow sandstone. All deeper zones are higher decline, but not always. A 2,700’ Devonian well offsets is that has produced over 100,000 BO and is still at 5-6 BOPD 40 years later.
Last large Independent shot seismic over its acreage in mid-1980s and initially retained deep rights (from base of the primary producing sandstone). This company has since sold deep rights to private company. That company has only drilled 2 wells to date, but probably has at least 10K acres HBP.
Field was on primary until early 1920’s, when accidental floods occurred by disposing of produced water down abandoned production wells. Operators noticed production increases as a result. At that time no well permitting was required, however, there was a plan as wells were generally drilled on 220’ spacing.
After WW2 through the early 1960s, large waterflood projects were initiated. Some of those continue today.
Production reached a low in the early 1970s due to low oil prices compared to LOE.
The Arab oil embargo, etc changed that. Lots of activity in late 1970s through 1985. Lots of old leases plugged and re-drilled in five spot pattern on 330’ spacing, with each production well taking up 10 acres.
Another drilling boom occurred from 2004-14, old leases that had not been re-drilled in 1980s boom were plugged and re-drilled. Some very good new leases, usually more economic than shale.
Field is very old and more tired each year. Six + years of average or below oil prices has taken a toll, and decline from 2018 to 2019 caught me off guard. Will be even worse this year with shut ins.
Have to think this is happening throughout conventional fields all over the world, which still supply a large amount of world crude supply.
SS,
Thanks for very much for your comments.
My interest in recovery factor is associated with the notion that after conventional, primary production, only about 30% of the oil in place has been produced. The remaining oil is split between residual oil, and mobile oil that is either in distinct conventional accumulations (such as an undrilled fault segment) or just dispersed within the portion of the reservoir that has been swept by the aquifer. If you keep producing wells updip of this dispersed oil, you produce more and more of it (increase your recovery factor), but, as operator, have to deal with all of that produced water. I’ve even wondered if, as you sweep more and more water through the “swept” portion of the reservoir, do you even start releasing some of the residual oil? I would suspect that the recovery factors in parts of your field are almost to the point where you have produced virtually all of the mobile dispersed oil, and maybe even you’re starting to produce some of the residual oil? (And I’m not even considering the uplift provided by water flooding.) I wouldn’t be surprised if you had recovery factors as high as 70-80% in parts of the field.
“I’ve even wondered if, as you sweep more and more water through the “swept” portion of the reservoir, do you even start releasing some of the residual oil?”
I produce from very strong, natural water driven reservoirs; after 70 plus years my BHP’s are virtually the same as they were at discovery. My oil water contacts are tilted and are associated with hydrodynamic sweep along faults and fault related structures. You will find this difficult to believe but some of my recovery rates are approaching 3,000 bbls. per acre foot. Not kidding. I actually cannot explain that given volumetrics.
I agree with you; because of wettability issues I now think I am simply “rinsing” interstitial oil left behind in pore spaces and this rinsing affect goes on and on and on. I have wells that have had virtually the same OWR the past 25 years. Which brings up numerous questions for the geology department when I get to heaven. For instance, is there actually replenishment occuring and if so, how does that happen from underlying source beds. I tend to believe it is fault plane migration but often get in big to-dos with geologists about that.
I believe there are numerous water driven reservoirs around the world with 80% RR of OOIP.
Mike.
Our best leases in terms of economics and decline are not water floods either.
One small group consist of wells with a low water cut. Less than 1 BW for every BO. We wish we just had these, along with a good water truck driver and a couple good SWD wells. We have to shut these in during cold weather because the stove pipe gun barrels freeze. When we start them up there is a decent oil flush, they almost catch up the lost production.
The second group are wells with strong natural water drive, like yours. We dispose of a lot of water in a zone below the producing zone, at around 200 psi. Almost all of the producers are over 100 years old, the disposal wells are not anywhere near that old, 5 to 35 years old, modern completions.
SouthLaGeo.
We aren’t geologists. Really not very strong science backgrounds among any of us. However, we are aware that wells that are still economic and over 100 years old (the oldest will be 115 in early December) are very rare. We aren’t entirely sure why these wells are still producing, but they are. We shut them in for about 3-4 weeks after 4/20. When we reactivated them, the natural water drive wells had a big oil flush the first 24 hours. We were very scared to shut them all in, they had not been for any significant time in over 40 years. So far things seem ok. Seems production is averaging what it was before the ridiculousness of 4/20/20.
I did have a geologist one time say all we are doing is washing oil off the rocks.
A friend of mine in this field is probably the best I have seen at finding oil that has been pushed into areas without wells by decades long water floods. He looks at countless maps and tries to drill along the outside edges of these floods. The best he did was during the last boom less than ten years ago. He drilled 4 producers and one injection well on a 40 acre tract that was on the edge of a 70 year old flood. Those four wells produced over 6K barrels in the first 30 days and have passed 70K BO in 9 years. He believes the oil had been pushed over there. He kept on going around the edges, but had nothing even close to the initial success. I estimate that project cost $400K at the most.
Would be interested what you and Mike think about this stuff.
Thank you Shallow sand, SouthLaGeo, and Mike for the intersting discussion. Great stuff!
Dennis.
Since shale drives the US market, conventional issues are rarely discussed.
I assume most of the world’s oil production is still conventional. Given what I am observing in our small conventional field, and the fields around it, I suspect a day of reckoning is coming.
Lack of investment plus very old fields means a shortage could be right around the corner.
Who knows. I don’t think the weekly numbers tell us much. I do note retail gasoline prices are up almost 50 cents from the lows where I am.
shallow sand,
I agree, there is likely too much focus on tight oil output. The interest may be because 10 years ago not many expected tight oil output would rise to the levels of output attained in 2019. Much of the continued increase in World output has been due to tight oil output and many (including me) thought the peak in World output might coincide with the peak in tight oil output.
In the grand scheme of historical World oil output, tight oil is a tiny part with URR somewhere between 25 and 100 Gb of a World URR for C+C of about 3000 to 3500 Gb (depending on one’s assumptions), my assumption is that conventional oil URR is roughly 2800 Gb.
If tight oil is unable to recover, it will be a struggle to meet demand when the World economy recovers to the 2019 level of real GDP (probably will not be reached before 2022). When that point is reached oil prices might return to the high levels of 2010-2014, my guess would be in the 2023-2025 time frame.
If chart too small click on it for larger chart.
Shallow, I’ve seen that idea work before, providing on the flank there is another trap, or “re-trap” mechanism, like a sealing fault, a structural high or a facies change. Otherwise constant water injection is simply disbursing oil into the vast unknown.
Thanks Mike. Makes sense.
Mike,
~3000 bl/acre*ft points to a super high recovery factor – suggesting either migration from another fault block or reservoir, production of residual oil, or oil replenishment.
Oil replenishment ideas get a lot of bad press because people start talking about abiogenic/unlimited oil sources, etc, but, I don’t see why some fields could not see slow rates of replenishment – these fields are currently seeing the final trickles of migration from the source beds into the reservoir. I’ve seen some literature where some stripper oil well operators think their wells could just keep producing, almost indefinitely, because they believe the fields are being recharged at about the same rate as they are producing.
Also, for me to suggest that you could produce residual oil without some hi-tech EOR process would not be received too well by some of my very intelligent reservoir engineer colleagues.
As per Schlumberger Oil dictionary – Residual oil saturation quantity is the saturation achieved after an infinite number of pore volumes of the displacing fluid have flowed through a particular portion of reservoir rock.
If you’ve had a whole core taken, and a portion of that whole core has had a residual oil saturation test, and that test says the residual oil saturation is 20%, then, the only way that oil can be produced is via some EOR technique designed to mobilize that residual oil.
But, I wonder if 20-30-40-50 years of exposing that residual oil zone to aquifer water, or injection water, starts to mobilize some of that oil. Just like an oil stain in your tidy whities.
Shallow sand and Mike, I wonder if that’s what some of your experiences would suggest?
Thanks, LA. I must say up front I am not a geologist but I have made it my life’s passion and have to pretend like I am one every day or I starve to death.
I am absolutely not a abiogenic believer; I am, however, thoroughly convinced replenishment can continue to occur from underlying source beds. What would Mama Nature have done in Her mind to decide to turn the tap off in the life cycle of lowly humans? She would have not. I struggle with how this replenishment might occur, often, and here is an interesting debate on LinkedIn that might interest you: https://www.linkedin.com/feed/update/urn:li:activity:6673762701870796800/?commentUrn=urn:li:comment:(activity:6673207047854665728,6673762605317931009)
I have read lots about wettability and mobility of residual oil in very permeable reservoirs like you and I might deal with. Its fascinating and might actually change over time for a host of reasons, like oxidation, and miniscule changes in BHT from say, surface recharge. In the Maverick Basin of S. Texas, in deep Cretaceous Glen Rose (9000 ft. TMVD) there is, amazingly, fresh water associated with hydrocarbons that we believe was charged, and perhaps continues to be recharged updip, in Mexico. This water is drinkable, literally. At 9,000 ft.! These rare oil accumulations in the GR will ultimately decline to low OWR’s that never change…another indication that water moving all around down yonder can do amazing things to hydrocarbon mobility.
We have recovery factors approaching 1,000 Bl/acre*ft, but we also do not have accurate lease by lease production data for our field for the time period prior to World War 2.
The field has produced almost 280 million BO from approximately 20,000 acres with average pay thickness of about 15’. The 280 million is from all pays, however, as the field has deeper productive pays (up to a little over 4,000’).
The deeper pays haven’t been heavily exploited and I assume a lot of the oil has migrated over the decades from the deeper pays to the shallow one, which has a fairly thick caprock.
The reason the deeper pays haven’t been heavily exploited is because they aren’t always easy to find and well productivity varies quite a bit. They also tend to come in strong and then peter out.
But not all do, as I am aware of some Devonian and Trenton wells that have produced close to 100K BO since first production in the 1970s-1980s.
I suspect hz wells in the deeper pays might be the way to go. There have been successful hz wells drilled in the deeper zones of fields near by. Not necessarily big frac as they aren’t as tight as the “shale” wells.
“because people start talking about abiogenic/unlimited oil sources”
The discussion only happened because Russian geologists without any clue in respect to biochemistry analysis of natural products started talking, doing their homework would have been better:
1) In oil many optically active compounds only appear as one enatiomer, clear indication of biological origin.
2) Chain length of hydrocarbons can easily be explained with degradation of larger natural compounds, not with expected distribution in an abiotic synthesis.
3) Stable isotopes (2H, 13C) are distributed ina way that indicated a kinetic isotope effect, very likely in a biological system.
Hi Shallow
May was an interesting month for ANS with a very weak finish.
http://tax.alaska.gov/programs/oil/production/ans.aspx?5/1/2020
Very original : in Texas, as there is no more space, apparently, to store the oil which is still extracted today, the producers get the possibility to store oil in underground cavities other than salt caverns and with less public control. Why they are not stopping producing oil ?!?! And how do they hope to see the oil prices climbing in the future with all the oil stored everywhere?https://www.manufacturing.net/energy/news/21132066/texas-eases-underground-oil-storage-rules
I’d say that some people are very interested to buy oil today at low prices and store it to sell a few months (or even a year) later as they expect oil prices will be much higher. In short, speculation.
(out of curiosity, do you come from Switzerland?)
No, France and I live in it.
Supply projection from shale profile
https://shaleprofile.com/us-tight-oil-gas-projection/
Chose only DJ Niobrara, Eagle Ford, Permian, Scoop, Stack, and Williston basins. Completion rate falls from 800 wells in April 2020 to 291 wells completed after June 2020.
A variety of assumptions are possible at shaleprofile, this is an excellent tool.
Tight oil output for the chosen basins falls to 5365 kb/d by December 2021 and to 4685 kb/d by Dec 2025, if rig count remains where it is at the end of May 2020 and rig productivity is unchanged and average well productivity also does not change from May 2020 to Dec 2025. Both assumptions are likely to prove false over that period.
Russian oil production fell by 1,943,000 barrels per day in May to 9,350,000 barrels per day. This is according to the Russian Oil Minister using 7.3 barrels per ton.
Ministry of Energy
So they kept their word. At least they have no problems with freezing pipelines during the summer months.
Any messages from Iraq if they keep their promise this time?
Rumor has it that Iraq and Nigeria are both producing well above their cut agreement.
See my comment below: “OPEC Output fell by 5,840,000 barrels per day in May. From Bloomberg”
For those interested, COVID 19 is an excellent opportunity for
us to test our oil price model. Our model says that when oil production is
not a constraint on economic production, one expects the price to be a
decreasing function of extraction rates. However when oil becomes a
constraint on economic production, our model says the price of oil will be
an increasing function of extraction rates. That is, to raise prices,
extraction rates will have to increase. In other words our model says that
oil prices will remain low until supply drops. When supply drops
sufficiently for oil to become a constraint on economic production, the
price will kick higher temporarily, but then extraction rates will have to
rise in order for prices to rise again.
The latest version of our working paper can be found here:
https://www.math.univ-toulouse.fr/~schindle/articles/2020_oil_cycle_notes.pdf.
Schinzy,
For a systems type model, everything is both cause and effect (in other words, everything is interconnected so causal relationships become difficult to untangle). So it is not clear whether extraction rates increase because price increases or the reverse, in a sense it is both, the arrow goes in both directions. In a system there are no independent variables, each depends on many others, it makes analysis difficult, but is probably a more realistic analysis.
I agree Dennis. I am just relating what the model says. Energy was the
worst performing investment sector between 2009 and 2019
https://www.rt.com/business/467366-energy-worst-performing-sector/.
Our model says that the next decade will be worse. Predictions are hard,
especially about the future. We will see.
Schinzy,
I don’t question the conclusion that other sectors are likely to perform better than oil in the next decade, if: 1) extraction costs increase faster than the market price as demand for high price oil is insufficient b/o the marginal consumer can’t afford “expensive” oil and 2) private oil companies are unable to invest in low cost oil production. These assumptions seems valid.
However, oil investments could still outperform in the next few years to the mid of this decade. The current lack of investment in not only new extraction capacity (LTO) but also in projects targeting old field, i.e. those that are supposed to combat decline, signals to me that a price spike is likely (note not a phase shift to higher prices but a rapid increase followed by decline). Remember that in the last 10 y decline rates were lower than expected. One Paris based agency concluded that this indicate low future decline rates too. Higher decline rates seems more likely to me as the low hanging fruit has been picked.
Schinzy,
I agree fossil fuel energy investments are not a good long term bet. Other sources of energy such as wind, solar, and supporting infrastructure like electricity transmission and distribution and EV production may fare better over the next 25 years.
At some point permaculture may become more widespread, though not everyone is fond of labor intensive production and though food is clearly important, people also need transport, clothes, shelter, healthcare, and perhaps culture and entertainment (the list is obviously incomplete). It is unclear how we get from here to there, my preference is for incremental change.
Start with widespread opportunity for post secondary education for women world wide and equal rights for women world wide(reduces total fertility rate and population growth rate). Guaranteed minimum income for all, highly progressive taxation to reduce wealth disparity (akin to pre-1965 US Federal income tax rates), a carbon tax worldwide, criminal justice reform (especially in the US). This list is just a start, it should probably have included cradle to grave manufacturing required by law. There are a whole host of environmental reforms that might be enacted such as requiring pesticides and herbicides to prove their safety, rather than others needing to prove they cause harm, this might reduce unintended consequences from the chemical industry. Tight control over genetic manipulation as this seems a pandora’s box of potential future pandemics and likely a box that should be kept shut.
Back in 2009 central banks did QE and look what oil price did the next 5 years. Then they exited QE and oil price fell in 2014. This is QE on steroids compared to that. And it is more central banks this time around. I look for oil to return to $100 within a year and stay there for 3-4 maybe 5-6 years before central banks attempt to exit again. It really is that simple. Interest rates are at zero so in order to stimulate economy central banks have to create money and government has to spend money. And with unemployment where it is that is not going to change anytime soon.
HHH,
From my perspective (being a Viking), you tout just a small portion of the picture.
Now the oil price collapsed from the effects of a collapse in demand; in other words, it may take years before world supplies and demand are brought into balance to support a higher oil price.
QE’s and operation TWIST actually (and for some time) devalued the USD (lowered the DXY) or caused the USD to remain low.
What most misses is that the USD index (DXY and it does not make much difference if the Fed’s broader USD trade-weighted index is used) moved from about 80 to about 100 from mid-2014 to early 2015. The DXY is not a linear function, but a geometric one.
In 2014 US LTO extraction grew at a healthy pace, and later OPEC increased supplies turbocharging the collapse in the oil price.
The outlook now for the near term is for a stronger USD, higher DXY, which provides headwinds for any growth in the oil price.
The world economy started slowing down in 2018, and this continued in 2019, resulting in lower petroleum consumption in the OECD of about 1% (from 2018 to 2019).
The world credit impulse predicted this, and for 2020 (and before the Covid-19), the forecasts were for a continued weakening in the world economy.
What is less focused on is if we are entering a period of (world) debt deflation which the central banks are trying to mitigate through expansive monetary policies. For a QE 4 policy to become successful, it needs to monetize government debt, which is about the supply of US Treasuries (for the US). This is what now has the chairman of the US Fed worried.
HHH, good luck with going long (hopefully you threw in the kitchen sink as well) on the oil price reaching $100/Bo within a year.
Thanks Rune,
Interesting data that backs up my suspicions. I also believe central banks are fighting ambient deflation with expansive monetary policies.
Great analysis Rune, thanks.
What do you think of IMF’s base case analysis?
https://www.imf.org/en/Publications/WEO/Issues/2020/04/14/weo-april-2020
Tis my opinion that their 2021 projections are absurd beyond belief. I went to the site and they have every nation doubling 2019 output on everything everywhere. South Africa for instance:
2019 .. 2020 .. 2021
.2 …….. -5.5 … 4.0
From .2 in 2019 to 4.0 in 2021 and the rest of the world was almost as absurd. What miracle is going to happen in in late 2020 or early 2021 that will enable that to happen. I am sure they are planning on a virus vaccination by November and worldwide distribution by December of this year.
I just saw on CNN that they expect the US may take 10 years to recover from this disaster. I don’t know if it will take that long but expecting 2021 to bounce back to double 2019 output is unbelievable.
Ron,
Let’s just take the World economy as a whole as it is simpler.
Typical growth rate for World real GDP is about 3% per year during normal times (2010-2019). The pandemic shuts down economic activity (Real GDP falls by 3% in 2020), then in 2021 there is pent up demand and a bunch of people get rehired etc and the economy bounces back quickly with unemployment rate going from 20% in 2020 to 4% in 2021, that is a huge boost in income which translates to higher GDP.
The base case scenario is an optimistic one where economies gradually reopen over the June 2020 to Jan 2021 period and it is assumed there is no second wave of COVID19. In essence the “base case” is really a “best case” scenario, with perhaps 1 in 4 odds (or less) of being correct.
There are several less optimistic scenarios by the IMF that are probably more realistic.
See pages 15-16 pf Chapter 1 at link below
https://www.imf.org/~/media/Files/Publications/WEO/2020/April/English/Ch1.ashx?la=en
Chart below summarizes World GDP growth outlook for 4 cases explored by IMF, the base case is the most optimistic case already presented.
Ron,
For GFC World GDP growth was 5.4% in 2010 and 3% in 2008.
So there is a precedent for a bounce back. The thinking is the farther the fall, the bigger the bounce, I think.
Dennis, there is no president for a hit to the economy such as we are experiencing today because there has never been such an event. Not even the 2019 epidemic because the world was still basically an agrarian economy then. And the 2008 hit was a picnic compared to what is happening today.
The new cases of Covid-19 are increasing every day. Every day since May 27 has seen over 100,000 new cases. Deaths, which had seen a declining trend is starting to spike again. It is way too early to talk about another wave because this wave has not yet crested. And because of the opening up of the economy plus all the massive demonstrating crowds, expect a new spike in the US in a couple of weeks.
But we know that airline travel, and travel in general, will not return for at least two years. And many businesses that have closed down will never reopen. Many jobs lost will be lost forever.
Bounce back my ass, we are a long way from hitting bottom right now. We must hit bottom before we can even contemplate a bounce back.
Ron,
At some point we will get past the pandemic and social unrest due to racism. The IMF forecast was from April (released on April 15), before social unrest in response to George Floyd’s murder on May 25.
I agree the current crisis is unprecedented and we do not know what will happen. I think it more likely that it will take a few years to return to at least the 2019 level for World GDP, my guess is 2023. Highly speculative obviously.
Of course we have not hit bottom yet. The forecast calls for a bottom in 2020 and a bounce back in 2021. If we take the middle two cases from the IMF we have about a 4.5% decrease in World real GDP in 2020 and about a 2% increase in World GDP (from the reduced level of 2020) in 2021. That estimate seems more reasonable to me, but still highly speculative. If World real GDP growth continues at 2% in both 2022 and 2023, then 2019 real GDP is surpassed in 2023.
FWIIW,
Below a chart from Atlanta Fed on GDP Now as of late May-20 which expects a decline in YoY US GDP of about 50% for Q2 20.
I have never seen such a decline in GDP.
Also, note that China is now not forecasting GDP growth numbers.
One of the reasons Hedgeye is one of my favorite “water holes” for good financial, and macro information, and interviews is that the interviews are great and are focused facts, logic, math, and statistics.
No policy biases and no-nonsense, just “LOOK AT THE NUMBERS! Apply LOGIC and understand FINANCIALS!”
Below a chart from one of Hedgeye’s recent presentations and they have some different numbers than GDP Now but note their forecast that goes to Q1 21.
https://www.youtube.com/watch?v=U5Sggag4vDU
I believe Hedgeye is close, but they now expect some US GDP “worsening” in Q4 20. There is some logic for this as some things still have to work through the various systems, so-called time lags.
Thanks Rune.
Other forecasts
https://www.cbo.gov/publication/56335
and
https://tradingeconomics.com/united-states/forecast
Thanks!
I am still more in the Hedgeye and RealVision (+ many more) camps.
I cannot recall any time (post-Covid-19) where some analyses become outdated so fast.
Several years ago, I took notice of the term “embrace uncertainty” or “embrace the suck” as some put it.
Few ventures now to put numbers to their forecasts that look more than 3 or 4 quarters into the future. The mechanisms in play and their likely outcomes appear well understood by applying a probabilistic/Bayesian approach. Again this is an unprecedented event, so looking at history may not be relevant.
I will continue to focus on fundamentals, like developments in (un)employment numbers, households disposable incomes, household, corporate and sovereign balance sheet stresses (solvency issues), which can take a long time to play out, and not least changes in consumers’ behavior post-Covid-19.
Focus on all of the above for the big world economies like the US, EU, UK, Japan, India, China, Brazil, etc.
The credit impulse will still be relevant to understand future trajectories of economic developments and, thus, in oil (or energy) consumption and the DXY for oil price developments as oil, like most commodities, are priced in USD.
The two factors above have been (and likely will continue to be) more relevant than supply agreements by some oil suppliers (who has no control of the amount of USD in circulation or developments in global non-finacial credit/debt.
I keep monitoring the US 10 Year Treasury rate as a continued low rate signal low expectations of future inflation (more likely disinflation/deflation) due to moderate (or negative) economic growth.
Rune,
Thank you. I looked at the Hedgeeye video, but it seemed a subsciption was needed for more information. Do you have an opinion on Mark Rossano who does videos on the Primary vision Frac spread count? His analysis seems cogent to me, but you know the industry far better than me, so your perspective may be different.
Link to several of his videos below
https://www.youtube.com/results?search_query=primary vision network
two recent videos at
https://www.youtube.com/watch?v=2rRa3i4dZzs
https://www.youtube.com/watch?v=H38G8TZJVeo
the link above has his recent comments on May 29 frac spread count
In a recent video from June 2, 2020
https://www.youtube.com/watch?v=TJ7btQe3yCM
the two analysts expect oil will remain below $50/bo long term (5 to 10 years) and tight oil output will remain low with US C C output falling to about 7 Mb/d long term.
Hedgeye has some material available on YouTube (full access requires a subscription same goes for RealVision)
https://www.youtube.com/channel/UCkDxvN-bcxsKkvJ3yyiGSVQ
With time there has been a growth in the number of good sites, Primary Vision has good potential
Rune,
Saw the Felder interview on Hedgeye Channel, excellent stuff. Thank you.
First of all, I think it is too early to make reasonable (GDP) projections for 2020 and later.
I believe the IMF growth projections (in one of the charts above) to be on the optimistic side.
There will be crosscurrents, which I believe will be hard to quantify in real-time (and difficult to predict), meaning it may take months or quarters before we have useful data (not perfect) to make any assessments from.
Monetary and fiscal policies will offset some of the downdraft caused by the slowdown and likely debt deflation (ref bankruptcies). Wrt debt deflation, I think we are early in this game following the measures to contain Covid-19.
One of the most critical factors here will be consumers and their (changed?) behavior. Some recent analysis/reports show that consumers have increased their savings rate, and one particular showed that consumers’ savings rate increased as the US 10 Year Treasury went below 4%, which took many by surprise as the mantra has been that lower interest rates would stimulate consumption.
Consumers are likely worried about their pensions following low-interest policies.
I think the “normalization” will gain some speed at first and later slow, and some expect it may take a decade before the US Economy is back to “normal” (US CBO?), meaning an output level like 2019.
[added later]
With consumers is included at what pace laid-off workers are reentering the workforce and how these are paid (there could be some wage deflation).
I would monitor the credit impulse and the DXY (or the Fed’s broader trade-weighted US Dollar index). A stronger USD acts as a global deflationary impulse as it reduces the credit stock in many local currencies and makes it harder to service USD denominated debts. Then add in effects of lower stock of currencies (or capital or money) from bankruptcies.
Thanks Rune,
Again your analysis seems very reasonable.
Rune,
From your comment : “it may take years before world supplies and demand are brought into balance to support a higher oil price.” you seem to believe that it will take years for demand and supply to match.
Doesn’t supply and demand automatically match if there is no more storage left? That is, if there is no storage then automatically the suppliers will have to cut production to what can be absorbed by the market, i.e. supply will be whatever demand will be. Therefore, supply and demand probably have already balanced (probably in the month of May) and not in a few years time.
Does anyone have any comments on that argument?
I understand one of the pushbacks to that will be that hey they can start storing oil in pots and pans and underground (non-salt) caverns as was approved in Texas recently. However, not everyone will have access to that kind of storage and it might not be economical as well (apart from all the environmental issues etc which are being disregarded currently). It might just be easier and cheaper for suppliers to just plug the well.
In that case, we will see
(a) demand supply balanced very quickly if not already done. and..
(b) it will take a very long time for supply to come back up to previous levels, if ever
As to how long the overhang of stored crude will last – I guess that depends on how long the voluntary (from OPEC plus and Canada, Norway etc) will last and how large the involuntary cuts are going to be. The current expecations are that crude in storage will go from 35 days of supply to 60-65 days of supply. The major brokers (Goldman, Citi etc) expect the overhang to be gone within 12 months i.e. by middle of next year. I don’t think they are very far off the mark.
Any comments?
Ancientarcher,
One reflection: Consumption and production (or rather extraction) will match when storage space is full but demand and consumption is not the same as demand is dependent on the price. Economy 101 says that producers, in the short term, will extract if marketprice is > opex (this is far from the eq.). Some producers will extract even if the lifting cost is above the market price if they expect the price to increase. It may (will) still take time before the market gets back to balance (“equilibrium”) if this is interpreted as an average price that is similar to the extraction cost (including CAPEX and perhaps also replacement cost).
If Covid19 responses and low economic activity depress oil demand long enough, the market may “balance” at a volume that is lower than what it was pre Covid19 as depletion never sleeps. This seems plausible to me.
What expectations (guesses) do the said organisations have for oil consumption this fall?
Jeff, good points.
I think the best analogy to the current situation is to think of a bucket of water where there is a pipe supplying water (supply) and a pipe emptying the bucket (demand). Think of storage as the total capacity of the bucket. Also add in the condition that the bucket doesn’t/won’t overflow (or environmentalists will cry or something like that)
Price doesn’t enter into the equation at all. When the bucket is full, i.e. the storage is full, demand has to equate to supply. Think of some oil producer in Timbucktoo who has run out of pots and pans to store the oil and no one is buying it off him. He has to shut down production. What else is he (or a she, mostly hypothetical he though) going to do with the oil if he can’t store it and he can’t sell it.
*** Price doesn’t enter into the equation ***
So, the balance between supply and demand will not happen over time, instead it will be ** immediate **.
As you have said, most of them are guessing. But a lot of organisations are using big data (measuring traffic density etc) to measure the level of consumption and April seems to be down at 65mmbpd or down 35%. Again, that is just a guess (but backed by analysis of a lot of data). May would be better – I would think probably down 20mmbpd (so, a consumption of around 80mmbpd). June will probably be between 85-90mmbpd.
The number are basically arranged like this:
6mmbpd is from consumption of jet fuel from planes carrying passengers. This will be close to 1mmbpd (or even lower) currently. This part of demand is not expected to jump back up anytime soon. But then, it is a small part of the total demand matrix.
25% or 25mmbpd is from road traffic from passenger vehicles (as opposed to trucking goods which is higher). Trucking hasn’t suffered much since people still need to eat and it is going to recover quickly. But travel by road has suffered but it is expected to recover next year at higher than pre-covid levels because people are going to use their own cars more and avoid mass transport.
Overall, the commodity analysts at the big banks (the few I have read) expect demand to reach 100mmbpd by the 3rd quarter 2021. I suspect the average expectation for the market would be close to that number.
I agree output and consumption of oil must match if all storage is full. Full storage is not a normal situation however, a “balanced” oil market is one where storage level of crude is at roughly the 5 year average level and remains close to that level for an extended period (say 12 months).
I believe that the level of consumption, which depends crucially on the level of World economic output (these correlate very closely over the long term) is what Mr Likvern is referring to, oil prices will only rise when consumption of crude is higher than output of crude so that crude storage levels start to fall below the 5 year average. That is unlikely to happen until World real GDP returns to the 2019 level or higher, unless output falls due to a lack of oil industry investment from 2018-2022.
Price has some effect on consumption but price has a tremendous effect on production. Shale oil was never economical at low prices but when prices rose to over$100 a barrel then shale drillers came out of the woodwork.
Deepwater oil is not economical at current prices and will continue to decline. But if prices get high enough then deepwater oil becomes economical. Ditto for shale oil but for both the price will have to rise far higher than it is today.
I should have been more specific; with supplies, I intended to say “available supply capacities” or “supply overhang”. Presently supply and demand are being balanced by voluntarily and involuntarily curtailing some available supply capacities.
Some would refer to the situation in the oil market now as there is a supply overhang (the potential for supply is higher than demand). This supply overhang is now by some estimates as high as 15 Mbo/d.
It is this situation with the supply overhang I was referring to.
This supply overhang will gradually be reduced from the top from natural depletion and wells/fields being permanently shut down (due to economics).
From the bottom, as demand picks up.
I believe it will take years (if this is 2 years or 4 years is still an open question) before demand starts to test total world supply (primarily extraction) potential.
Rune,
And your conclusion is where I disagree. Demand had a very sharp shock in April (down ~35mmbpd) and somewhat less in May. But June/July onwards global oil consumption is expected to reach 90mmbpd.
Production was 100mmbopd pre-covid. So, we will build up roughly 2-2.5bn barrels of oil in the inventory (seems there is space for no more). But supply is already at around 85mmbpd – Opec plus cutting 10mmbpd and rest of the world 5mmbpd. Say all the Opec plus output cuts are going to come back, but not all the output cuts (much of which has been involuntary) will come back. Secondly, Opec plus will keep some level of cuts till the end of the year to reduce inventories.
Basic maths tells us that it will take between 9 months to 1 year for the excess inventories built up during the covid crisis to be completely consumed.
I believe all excess inventories built up over the last 3 months will be used up in the next one year. So, middle of next year, you will be staring at a supply capacity of 95mmbpd (assuming all of opec plus cuts are back) and demand of close to 100mmbpd.
Why do I expect supply to be 95mmbpd? Well, Shale for one will give up a bit more than 2mmbpd. Also remember that capex has crashed massively, expected to be $200bn this year down from $800bn in 2014/15. Will that cover natural depletion? Doubtful. But then you have to think about all the stripper wells that are being shut down – that production is gone for ever. It will just be too expensive to re-drill to get the single digit bopd that was the case before. Maybe Shallow Sand and the others can weigh in. Also, what about the off-shore shut-ins. Surely there will be a few. And those will, most probably, be gone for ever.
I think mid-2021, the world will be staring at a situation where production capacity is ~95mmbpd (or lower) and demand is close to 100mmbpd and all the excess inventory built up over the last few months completely wiped out. What will happen to the oil price then?
Where am I wrong?
Please comment
ancient archer
The issue I see in the conventional onshore fields is not so much the shut in’s that occurred over the past two months. If oil prices keep rising, most will be reactivated.
The issue in the conventional onshore fields is the lack of infill drilling since 2015.
Unlike shale, conventional wells in the US almost completely stopped being drilled in 2015 and never resumed. Not enough cash flow from existing production to justify drilling and there were not and still aren’t capital markets willing to fund same. All the capital was sucked away by shale.
Therefore, going on 6 years now the conventional fields have been slowly declining, and I bet in 2019 that decline rate picked up.
Meanwhile, all of the eggs have been put in the shale basket, which has very high decline rates and requires tremendous amounts of continuous capital.
If the capital to shale is turned off, like it has been to conventional onshore, and if prices don’t get high enough to justify a lot of drilling out of cash flow ($75+) I suspect the oil market might “balance” much quicker than most imagine it will.
But shale is not only financial, it is political. So money might get thrown at it before long with 2020 elections approaching and there being a strong desire to keep gasoline prices low.
The 2-2,5 Billion barrel inventory figure is that total petroleum added to the world’s inventories, or is it total world inventories of petroleum?
How does the inventory drawdown look like in your model?
As I mentioned further up, the key to how fast also petroleum consumption picks up is about consumers’ and corporations’ balance sheets and likely consumers’ likely behavioral changes, like less air travel, more telecommuting, stressed balance sheets, and more.
This situation with Covid-19 is unprecedented, and we (at least I) have not seen all the fallouts from it.
We have barely started to see the effects of the grinding solvency issues on consumers’ and corporations’ balance sheets from the events since Feb/Mar-20.
These effects take months to materialize.
As you are aware of those factors above are very basic.
2-2.5bn barrels are incremental inventory – the expected increase in inventory that occurred due to the covid crisis. I am given to understand that the steady-state inventory of crude is around 3bn barrels. At the end of May, I would expect total global inventories to be 5-5.5bn barrels.
Dennis, Rune
You guys might be right. It might take the world 3 years to reach 95mmbpd. But looking at the trends across the world – traffic intensity etc, it looks like it will be next year. Air traffic will take much longer to recover but that is only about 6mmbpd. But then we are assuming many things including no second wave of coronavirus.
Shallow Sand,
Thanks for your reply. I have believed for the last couple of years that the lack of investment in all kinds of oil E&P and development (apart from shale) will lead to a massive negative supply shock at some p0int of time. Global capex halved from 2014 to 2018/9 (from $800bn to $400bn) and then halved again in 2020 (to $200bn). All that has got to have an impact – especially when you take into account the vast amount of money that shale took in and pissed away that is included in the total capex numbers.
In my opinion, consumption of petroleum + biofuels liquids will not return t0 95 Mb/d as quickly as you believe, Rune’s 2 to 4 year estimate seems much more reasonable. Most estimates are for a potential vaccine in 12 to 18 months, then another 12 months at least for most people receiving the vaccination and there are plenty of other potential problems that may interfere with getting the global economy back to the level of 2019. My guess is 2023 for a return to 2019 level or higher for World real GDP.
https://energywatch.eu/EnergyNews/Oil___Gas/article12182948.ece
Seadrill to delist from NYSE after loosing $1.2 billion . End of shale and end of offshore is a double whammy .
Oil Frac Spread count, using oil and gas horizontal rig count to estimate split between oil and gas focused frac spreads. Frac Spread data from Primary Vision and rig count data from Baker Hughes.
My guess is that there is a one to two month lag between changes in frac spread count and changes in the completion rate, again based on relative horizontal oil rig counts in various tight oil basins I estimate the Oil focused frac spread counts for May were Permian=12, Bakken=1, Eagle Ford=1, Niobrara=0, other US=1.
Using the frac spread count for tight oil estimate above, I did a new supply projection assuming the May 2020 estimate for frac spreads remains constant until Dec 2024. See chart below.
Dec 2020=5.23 Mb/d, Dec 2021=3.73 Mb/d, Dec 2022=3.09 Mb/d, Dec 2023=2.72 Mb/d, Dec 2024=2.46 Mb/d for US tight oil output. EIA estimates April 2020=7.9 Mb/d for US tight oil output. This scenario has April 2020 tight oil output at 7.8 Mb/d.
So this scenario suggests about a 4.1 Mb/d decrease in tight oil output over the next 20 months.
OPEC Output fell by 5,840,000 barrels per day in May. From Bloomberg
OPEC plus Russia fell by 7,783,000 barrels per day in May.
OPEC’s Strong Start to New Oil Cuts Marred by Usual Suspects
By Grant Smith
June 1, 2020, 7:16 AM MDT
• Output fell by 5.84m b/d in May to lowest since 2002: survey
• Compliance with cuts was 77%, undermined by Iraq and Nigeria
OPEC’s delivery of its latest oil-production cutbacks, while strong overall, was undermined by its habitual laggards.
The Organization of Petroleum Exporting Countries implemented three-quarters of the cuts pledged in May to re-balance a global market upended by the coronavirus, according to a Bloomberg survey. Yet performance was marred by Iraq and Nigeria, who executed less than half of their agreed reduction.
The cartel and its partners, who make up a 23-nation alliance known as OPEC , promised to collectively curb output by a record 9.7 million barrels a day in May and June amid an unprecedented collapse in fuel demand. The coalition will meet this week or next to consider its next step.
OPEC will discuss maintaining that level of cuts for another couple of months to disperse a billion-barrel glut that’s accumulated during the pandemic, and the high compliance rate so far may encourage ministers they can keep it going. At the same time, the laggards may be in for criticism for diluting the impact of the strategy.
OPEC reduced production by 5.84 million barrels a day to 24.6 million a day in May, the lowest since 2002, according to the survey.
Saudi Arabia, the organization’s biggest producer, the United Arab Emirates and Algeria — countries with a strong track record of adhering to OPEC agreements — made almost all the reductions they promised. The Saudis slashed output by 2.89 million barrels a day to 8.7 million.
SNIP
Lagging Behind
Iraq and Nigeria, however, didn’t perform anywhere near as well.
While their cutbacks in May marked better-than-usual compliance from the two exporters — who often disregard their commitment to cut entirely — they were still well short of requirements. Iraq’s compliance was at 42%, and Nigeria’s just 34%.
The pair have been rebuked in the past by OPEC’s leading members for their errant behavior, which could be an issue again at the group’s upcoming gathering.
Where is the oil coming from out of Iraq in the context of what region is violating commitment to cut. Is it up in the Kurdish area? Or elsewhere? The answer determines which company doesn’t get to collect their split.
Worth mentioning an item from somebody above talking about dxy and trends of the dollar.
This cannot be meaningful any longer and this has been true for well over a decade. If the Federal Reserve is doing QE and this is supposed to affect the value of the dollar, then you’re going to have to measure that with a yardstick that does not change. The ECB has done its share of QE, as has the entire array of acronyms across the world BOE, PBOC and the poster child of QE, the BOJ. So DXY tells you nothing about QE.
You have to understand the change from decades past. Central banks used to function for the benefit of their own country. But the crisis of 2008/9 put Central Bankers on telephones talking to each other about global systemic risk. This eventually got interpreted to mean if we do things for our benefit we can destroy the rest of the world and then that will take us down too so we should all coordinate everything we do and forget about ever functioning in a competitive way. The BOJ has really taken advantage of this.
No idea why anyone talks about the price of oil anymore. It went negative and it went negative big. That is a reality. That is forever. The duration has no impact on that reality, because duration is not measured in time. It’s measured in transactions. There were thousands of trades executed in the marketplace at a negative price. It revealed the truth of price. Only the self deluded can pretend otherwise.
It was an artificial relict of this one oil stock exchange. Expiring futures and traders without storage not getting rid of them. All wanted through the same narrow exit.
This can happen at every future roll over – only this this the price was low and lots of inexperienced traders have bought futures. More experienced roll them days before time is out – or have storage.
Watcher
Those were paper barrels that traded at negative prices. Not convinced that those trades were very meaningful for the longer term. The next day price of $10 is the real low and more meaningful.
Below is this morning’s Weekly Wild Ass Guess.
At this point my main interest is to see when their guess hits bottom, goes flat and then starts to turn up. This morning’s drop was another 200 kb/d. Alaska was down another 42 kb/d.
Ovi,
In this case the weekly estimate for US L48 output is about 300 kb/d less than we would expect by looking at the May 12, 2020 STEO, the 10800 kb/d estimate for week ending May 29, 2020 for L48 crude output is a level not expected until August 2020. The expected number for L48 output based on STEO is about 11100 kb/d. The 4 week average for US crude output was 11.4 Mb/d, which implies roughly that same monthly output for May 2020 and suggests a drop of 1.3 Mb/d over the March to May period or roughly 650 kb/d each month for the two month average decrease. So perhaps 12.1 Mb/d for April and 11.4 Mb/d for May as a very rough guess. With frack spread counts so low, we could see a sharp drop in tight oil output in May and June and perhaps July as well.
Dennis
Sort of follow what you are saying so here is what I see.
STEO output for May 2020
US Total: 11,660 kb/d
Lower 48 11,200 kb/d
Weekly to May 29 and using an estimate close to May 29 for last two days
US Total: 11,450 kb/d
Lower 48 11,000 kb/d
Both of the weekly estimates are about 200 kb/d lower than the STEO
What surprises me is that the STEO WTI price projection for May 2020 is pretty far out (too low) from the real price in May. This implies to me that they will be raising their projected price and output for May in their June report, which will put them more at odds with the May weekly data. Its not clear to me who will get May right.
Ovi,
It is far from clear how the STEO is done, they probably use some of the other EIA reports such as PSM, tight oil official estimate, and perhaps the DPR to inform their forecast, but that is a guess on my part, perhaps they even use the weekly petroleum status reports as recent weekly data seems not to reflect the STEO (unless there are early versions of the STEO available to the office that does the weekly reports prior to release. Every time I think I have the convoluted EIA reports figured out, in fact I do not. It seems it will remain a mystery. Note that for my May estimate for US output I simply took the 4 week average reported on May 29 ( those 4 weeks were most of May). I would agree that method is imperfect, then I used the STEO estimate for June, which may be revised lower due to the change in the March estimate from the PSM. Note frac spread count below.
slightly longer period for frac spreads and horizontal oil rig count. My guess is a one month lag between frac spread count changes and tight oil completions and about a 2 month lag between rig count changes and completions. Also note that, some of the frac spreads are for shale gas wells. Based on the relative change in horizontal oil rigs and horizontal gas rigs and assuming the frac spread counts for oil and gas focused spreads have changed in similar proportions, my estimate is that the oil focused frac spreads may have fallen to under 20 for the past 5 weeks, so if my estimate of a 1 month lag is correct, June tight oil output may fall significantly due to a very low completion rate.
Dennis
Thanks. In the Frac spread chart above (Dennis Coyne06/02/2020 AT 1:21 PM), it shows 16 Frac spreads for May 29. The chart above shows 53 and climbing. Surprising to see it turning up so early. What is the difference? Is the one on June 2, just for oil.
Ovi,
Correct, the June 2, 2020 comment has my estimate for the trailing 4 week average of oil focused frac spreads, as I said above my estimate is that about 30 out of 50 frac spreads for weekending May 29 are shale gas focused, based on the fact that the horizontal gas rig count has changed by a much smaller amount than the horizontal oil rig count (on a percentage basis from March 13 to May 29, horizontal oil rig count decreased by 67.4% and horizontal gas rig count by 25.8%).
Before the big decrease in horizontal oil rigs (beginning in week ending March 13) I use the rig count split over the Feb 7 to March 13 period to split up the frac spreads between oil and gas.
Then I assume the gas focused frac spreads decrease from 42 for week ending March 13 to 31 gas focused frac spreads (26% lower) for week ending May 29. The oil focused frac spread is just the difference of total frac spreads minus gas focused frac spreads. Those are the assumptions behind the June 2 chart.
I use the 4 week trailing average to try to get a monthly estimate as that is how both my models, those of Enno Peters and others are structured.
Link below has spreadsheet with data
https://drive.google.com/file/d/10elKuWbWc-F2HCqRiRwUuBj68Cwba-Oo/view?usp=sharing
Chart with data from spreadsheet in comment above
Frac spreads now at 58
Horizontal Oil Rig count fell from 202 to 186, horizontal gas rig count from 69 to 67 for week ending 6/5/2020.
Update for Oil Frac spread count trailing 4 week average. A different estimation method used where frac spreads are assumed to match the proportion of horizontal oil rigs to total horizontal rigs for all dates.
Estimate for Monthly average Oil frac spread count (2020).
Feb-276
Mar-236
Apr-115
May-37
Note that I expect there is a one month lag between changes in frac spread count and changes in output, so the big drop in April and May will hit May and June tight oil output respectively, with completion rate cut in half in May (from the April rate), and cut by a factor of 3 in June (from the May rate).
Using my comment from June 6, 7:58 AM for frac spread estimate and shale profile supply estimate with a 0 month lead time from spud to production, and a 40% decrease in June and July rig counts and then no change in rig counts from Aug 2020 to Dec 2020 and then an increase in rig count of 2% per month from Jan 2021 to Jan 2026 with a 0.5% decrease each month in average well productivity over the same period (annual decrease in well productivity of 5.9% due to running out room to drill in sweet spots), we get the scenario in chart below.
tight oil output in Mb/d for January of years below:
2020=8
2021=5.4
2022=4.1
2023=3.6
2024=3.4
2025=3.4
2026=3.5
Completion rate for Aug to Dec 2020 is 110 new wells per month and rises to 377 new wells per month in Dec 2025, model has 1025 new wells completed in March 2020, 599 wells in April, 354 wells in May 2020, and 319 wells in June 2020, July 2020=184 new wells and August 2020 to Jan 2021 the completion rate is 110 new wells per month.
See link below for supply projection (this feature is free for now, but will soon become proprietary so don’t wait if you want to try it, it is awesome!)
https://shaleprofile.com/us-tight-oil-gas-projection/
slightly clearer image by clicking on chart.
Note in horizontal oil rig and frac spread chart that in February the ratio of horizontal oil rigs to frac spreads was about 2 rigs per spread, but by May the ratio was roughly 4 to 1.
CHK is not too big to fail?
https://www.ft.com/content/bf230420-a570-4fcb-a2cf-3c38b5429b6f
Following article is not behind paywall
https://investorplace.com/2020/06/investors-wondering-if-chesapeake-energy-can-survive-through-june/
So it seems, no, Chesapeake is not too big to fail, based on piece linked above.
Dennis,
If a company does a 1-4 reverse split, that’s usually a sign that the company is in trouble. Whiting Petroleum did a 1-4 reverse split back in 2017 and has since gone bankrupt.
However, Chesapeake OUT DID Whiting by doing a 1-200 Reverse Split, 50 times more than Whiting… LOL.
The second-largest shale gas producer in the United States did a 1-200 reverse split.
Steve
Steve,
I agree Chesapeake is likely to fail.
These fools agree. “Producers and suppliers in the oil market are trying to cut costs and adjust finances as quickly as possible, but not everyone will survive. And Occidental Petroleum (NYSE:OXY), Chesapeake Energy (NYSE:CHK), and Transocean (NYSE:RIG) are three that I think might be considering bankruptcy by the end of the year.” What’s not to like? Everyone knows that investors can afford your losses, Investment capital is money for nothin.
https://www.fool.com/investing/2020/06/05/3-oil-stocks-that-could-go-bankrupt-in-2020.aspx
Orders of magnitude reverse split indeed. Now the second-largest shale gas producer? When they lose the crown? Did I see a list of top 10 with volumes posted in your XOM Article while back? Expect that list to rearrange. When NG price normalizes it’s going to be a different world in the US. Cheap NG/Hot Water is a right,.. sarc. Expect the return of Solar Hot water but with PV.
“CHK is not too big to fail?”
No. If CHK can’t face debt maturities they’ll file a Chapter 11. They already told in their SEC filing that if the market doesn’t improve in 2020, they won’t be able to meet financial obligations in Q4, and are actively exploring various possibilites of restructuring.
Don’t forget that natural gas prices didn’t fell as much as oil prices. The question is also how the plunge in oil activity (drilling and fracturing) will affect gas supply? I guess that oil wells in the Permian also produces gas that end up on the markets, is that significant?
Tita,
Yes the Permian Basin produces a lot of gas, some of it (perhaps 20 to 30%) is flared, the rest is sold, lack of gas pipeline capacity is part of the problem as well as a poor job done by the RRC at enforcing regulations and fulfilling their mandate (part of which is conservation of resources).
Of the total shale gas produced in the US in April, about 32% came from the Marcellus (largest single play) and 16% came from Permian Basin.
When we consider the increase from Dec 2017 to April 2020 in US Shale gas output, 92% of the increased output was from 4 plays, Marcellus, Permian, Haynesville, and Utica. At least through April 2020 the decrease in Permian basin shale gas output has been fairly small (similar to the other 4 big shale gas plays).
Data from link below
https://www.eia.gov/naturalgas/weekly/img/shale_gas_202004.xlsx
Denis,
As I understand, Natural Gas production in the Permian is mostly a byproduct of the oil production. Basically, they don’t drill specifically for gas. Correct me if I’m wrong.
So, it would be quite astonishing that gas production in the Permian wasn’t affected with the decrease of oil production. Of course, one can also think that gas previously flared would find a way as pipeline capacity is freed.
Tita,
You are correct afaik for Permian gas production.
We only have data through April 2020 (I ignore DPR projections) for permian tight oil and shale gas. So far (through April) Permian tight oil output has not decreased very much. I expect April output may be revised lower in the future and I expect output from May to August to fall significantly, probably by at least 1 Mb/d over that 4 month period. (about a 25% drop from the April level reported currently) shale gas output is likely to drop by a similar amount (25% from currently reported April 2020 level). A WAG by me (typically these prove incorrect).
So, they are preparing for Chapter 11.
“https://seekingalpha.com/news/3581320-chesapeake-preparing-for-bankruptcy-bloomberg”
Just a little bit of chat about the crazy things happening in the markets (I’d call it euphoria). And CHK is one of the most astonishing. Last Thursday, the stock was worth basically not much. CHK was already in difficulties before March, and those difficulties increased which led investors to even sell more of the stock as a Chapter 11 became more and more likely. The impairments on their last financial statements was another hint. But last Friday and yesterday, the stock just skyrocketed, 500% increase in two sessions.
But the Chapter 11 was still on the table, and now is certain (the stock plunged after hours). The bonds market just plunged. But thoughts on vague “too big to fail” or “government will save CHK”, and the news of OPEC extending their cuts and the thoughts that things are improving, led investors to put money in something that was incredibely thin to return anything. The equity is most likely to be wiped out.
WTF is happening? The very same crazyness is also happening with Hertz (sorry nothing to do with oil).
I have heard some smart analysts with some experience poke fun at millenials with less experience. The comments (by millenials) are along the lines that you can’t fight the Fed and that earnings don’t matter, sounds a bit like what new investors in the dot com bubble of 1999 were saying.
Eventually these “investors” will realize that this time was not in fact different (earnings do, in fact matter), though probably only when shirtless. 🙂
Global Oil Demand To Fall To Levels Not Seen Since 2014
“World oil demand growth in 2020 is expected to drop by a staggering 9.07 mb/d, with the worst impact seen in this quarter. We expect demand for the year to be around 90.59 mb/d – back to levels last seen before the 2014-2016 market downturn,” the top official said.
Peak Oil Again?
Crude has spent the majority of the past 12 years inside of falling channel (1). The collapse in crude oil prices in April saw it hit the bottom of the channel at (2), where it created a large bullish reversal pattern. Since hitting the bottom of the channel, crude is up over 200%.
The strong rally has crude currently testing the underside of 17-year support/resistance line (3), at (4). Despite the massive rally over the past 30 days, the long-term trend for crude oil remains down.
What crude oil does at (4) will most likely send an important global message to the commodities sector and the stock market as well.
Russia declares state of emergency over Arctic Circle oil spill caused by melting permafrost
Melting permafrost caused a fuel tank holding 21,000 tons of diesel oil to collapse in Russia’s Arctic Circle, leading to a 135-square mile oil spill.
According to Rosprirodnadzor, the Federal Service for Supervision of Natural Resources, 6,000 tons spilled onto the ground, another 15,000 tons into the water. Oil products got into the Ambarnaya and Daldykan rivers and in almost all their tributaries.
The spill occurred in the city of Norilsk, Russia, at a power plant operated by Norilsk-Taimyr Energy Co., a subsidiary of Nornickel. The town is located above the Arctic Circle in Russia’s far North.
An emergency situation has been declared, the company said on its website. Russian President Vladimir Putin agreed to introduce a federal-level emergency regime because of the spill after the Minister of Emergency Situations Yevgeny Zinichev suggested it.
Greenpeace has already called the spill the first accident of such a large scale in the Arctic. The organization believes that damage to water bodies alone from a diesel spill in Norilsk could amount to more than $85 million.
A diesel fuel storage tank failed when the permafrost it was built on began to soften. As a result of damage to the tank, fuel spilled onto the roadway and a passing car caught fire.
“The accident was caused by a sudden sinking of supporting posts in the basement of the storage tank,” the company said in a statement.
The leaking diesel oil had extended as far as 7 miles from the accident site and turned long stretches of the Ambarnaya bright red.
How amusing. And predictable one supposes. Those 100s or 1000s of transactions we saw that happened at negative price, well, they don’t fit beliefs.
So son of a gun, they must not have happened. That simply just didn’t ever happen. We might even be able to pass some legislation ordering all such records to be destroyed. We’ll make damn sure it didn’t happen.
The German bonds have been trading at negative yield for millions of transactions. But, of course, that is completely absurd and thus, that hasn’t happened either.
It is time to take a stand and make it a crime to possess any records showing negative price for anything.
Watcher. Most sell oil on a monthly average. There are many different pricing mechanisms, however, and some also sell based on the closing price of the date the oil is hauled away from the lease. That used to be the more common method, back before oil prices became so volatile.
Of course, there were a few operators that were on daily pricing that sold on 4/20/20. They had called in the oil to be hauled after the Friday pricing deadline, so it was hauled early Monday morning, before the operator could have gotten it stopped. Or maybe operators just weren’t following what was happening. I’m any event, the oil was hauled on a day oil closed below -$37. Add in the basis spread and these operators should have had to pay the crude purchaser over $40 per barrel.
In the Basin we operate in, nobody paid the crude purchasers, as it turned out. First, after the fact, three of the four purchasers adjusted the negative price to a $0 posting. Second, after the fact, all four purchasers allowed the operators to elect monthly average for those tanks sold on 4/20/20.
Keep in mind, however, that this all happened in May after the dust had settled. On 4/20/20 and through the rest of April, we were told we were looking at having to pay the purchasers. We were also told they thought prices in May would be negative or at best, single digits. So almost all of our Basin was shut in, and what wasn’t was held and not sold till June.
Further, the one crude purchased that didn’t raise 4/20/20 to $0 also lowered its May posting by $6. The other three didn’t follow suit. After some consternation, the one that lowered in May matched the others in June. Competition. I guess by late May it was no longer the “end of the world.”
In hindsight, maybe supply demand worked a little. I still think the price is driven by a lot of other factors, and I am in the HHH camp that it’s about to go sky high, shortly after November, 2020. Too much QE. Way too much.
Crazy stuff, no doubt.
Shallow sand,
There are some analysts that believe that OPEC nations and Russia see the writing on the wall for a potential peak in oil demand and they do not want to be stuck with billions of barrels of oil in the ground that cannot be produced at a profit. They believe that OPEC may choose to keep the market supplied at a level that keeps oil prices at $50-60 per barrel and that they may choose to ramp up their spare capacity as oil prices approach this level (say at $60/bo).
Essentially their thesis is that oil prices will remain at $50/bo or lower. I have changed my thinking a bit on oil prices, based on this thesis (which I think may only be partially correct). My current guess is that oil prices increase as you have suggested, but rise to no mare than $70/bo (you may think such a price is “sky high”, you didn’t give a number). For me “sky high” is $115/bo, I doubt we approach that price level for Brent (which is now considered the World benchmark) in 2020 US$, before 2025, and if the peak demand thesis (for say 2018 as the peak demand year) is correct (I don’t believe that arrives until 2035) we never reach an average Brent oil price of $100/bo in 2020$ for any 12 month period in the future.
Will be interesting to see how it all plays out.
Note that with all the QE we need to look at relative levels in various nations, if all our major trading partners do QE at a similar level (money supply divided by GDP basis) to the US, then exchange rates might be relatively unchanged, if the QE ends up being inflationary, then nominal oil prices will rise but prices in constant dollars would be unchanged.
Much of the QE may simply go to increased stock market prices and be just another hand out to the wealthy, at some point the lower and middle income voters get pissed at the continued increases in income inequality and perhaps they vote for change.
Dennis.
My thesis is the Democrats win the White House and Congress. Shale drilling slows considerably. There is then a perceived supply shortage in the US, where the bulk of paper contracts are traded.
Alternatives do not fill the void as quickly as hoped. COVID 19 demand destruction resolves itself and pent up demand is unleashed.
Heck, it’s just a guess.
Lack of trust in the system over lying about what happened @ Chernobyl was a factor in the Soviet collapse. Party officials could not even acknowledge the obvious internally. We see parallels in the US now as this site illustrates. This EROI thingy may get real once oil prices normalize.
From the article in Ron’s post above. “The region’s governor, Alexander Uss, had told Putin that he became aware of the oil spill on Sunday only after “alarming information appeared in social media”.” Time to take inventory and make a plan for all else is built on permafrost?
From economic and environmental feasibility, it would be right to burn the leaked fuel on the spot. There are swamps, few roads, not navigable small rivers. But ecologists were against it. For political reasons, they decided to do what hkologists / green people want. It is impossible to collect this fuel in water. They will collect soil and water from the river into plastic reservoirs and take them out in winter and bury them. The cost of the work has been funded at least $ 150,000,000. Probably a lot more. But the fact is that the area is deserted and it was right to burn and bury it in place. This is a personal opinion .
$50 – $60/Bo (Brent), as a near term target range, makes a lot of sense.
At around $70/Bo it starts to affect consumers who begin to protest in some countries, ref India, Ecuador? in 2019. This was much about USD strength.
Still awaiting data for how consumption developed from 2018 to 2019 for those countries that had their currencies depreciate significantly versus the USD. Brent averaged about $65/Bo in 2019.
During the last three weeks, the DXY has dropped from 100,5 to 96,7. It would be interesting to see how the 15, 30, and 50 DMA correlations (oil and DXY) for these have developed.
The run-up in the S&P 500 and the oil price appears driven by increased liquidity from the various fiscal stimulus programs. Gradually these programs are planned to be tapered down, and the Treasury (and other governments) will start issuing bonds in late June and July soaking up liquidity. Keep an eye on the rate of expansion of the Fed’s balance sheet from now.
Late July/early August comes Q2-20 reporting, which will be interesting.
How much of the recent oil price increase is driven by this liquidity impulse (speculative movements), and what happens as the bond market starts to soak up this liquidity surplus?
Rune. What you post makes a lot of sense to me.
Unfortunately, for some time the oil market has been dominated by paper barrels that outnumber physical barrels, sometimes over 1,000 to 1.
My prediction is high volatility unless the oil trading system is reformed.
I could see oil trading for below $30 and above $100 WTI between now and 12/31/2021.
If you are referring to an average price, I understand and agree.
Unfortunately, operators have to figure out how to deal with the volatility. We now wish we never shut in.
But we were told if the average for a month was negative that we’d have to pay and every person we rely on for pricing advise said we’d be lucky to get $10 well head in May.
None of them were correct, of course.
Maybe the extreme volatility will cause reform of oil paper barrel trading?
Shallow. Maybe what you need is a co-operative with a decent amount of storage.
Rune,
Again great analysis. The increased money supply might weaken the dollar and reduce the price of oil in the local currencies of nations besides the US. To actually get employment up will require fiscal stimulus, monetary stimulus is likely to simply flow into the bank accounts of the wealthy and drive up asset prices, for the common man they will simply fall further behind the wealthy as most of the assets are in the hands of the top 0.1%.
At some point, without significant fiscal stimulus from nations worldwide (WW2 level stimulus) the wheels fall off this bus in my opinion. So far much of the stimulus has been monetary in nature, though there has been fiscal stimulus as well, it is unclear what happens as the fiscal stimulus wanes. So far about 2.8 trillion in fiscal stimulus has been enacted, a large chunk of this 1.2 trillion was stimulus checks and extra unemployment benefits, which will end in July without new legislation.
There is another 3 trillion fiscal stimulus which passed in the House of Representatives, but is unlikely to be passed by the Senate. It will be interesting to see how much backbone the Democrats have as a failure to act by the Senate might ensure a turnover in power in the November election. It will be interesting to watch.
Rune,
Can you define what you mean by near term? Different people have different definitions of this term. For me that would mean the next 12 months. I believe Mark Rossano is expecting Brent oil is unlikely to average above $60/bo in 2020 US$ for any 12 month period in the future as he expects OPEC will be decreasing their R/P ratio going forward to keep oil prices low and delay the moment of peak oil demand.
It is an interesting thesis, it has changed my thinking on future oil price and the viability of tight oil going forward. If the thesis is correct (my guess is even odds of it being correct) US tight oil URR might be well under 50 Gb, possibly under 30 Gb.
Near term for me is the next 6 – 12 months.
(sorry for the belated and short reply, it is quite hectic around me these days.)
Thanks Rune.
OPEC+ extends oil cuts in deal that hinges on end of cheating
OPEC+ agreed to a one-month extension of its record output cuts and adopted a stricter approach to ensuring members don’t break their production pledges.
The deal will underpin the oil market recovery, easing the financial pain felt by resource-dependent emerging economies, shale explorers in Texas, and blue-chip companies like Royal Dutch Shell Plc.
It’s a victory for Saudi Arabia and Russia, who put a destructive price war behind them to successfully cajole Iraq, Nigeria and other laggards to fulfill their promises to cut production. The two leaders of OPEC+ showed that they intend to keep a close watch on the oil market, meeting every month to assess the balance between supply and demand amid an uncertain economic recovery from the global pandemic.
https://www.bnnbloomberg.ca/opec-agrees-to-extend-output-cuts-as-quota-cheats-offer-penance-1.1446558
Ovi,
At some point the rest of OPEC gets pissed at Iraq and Nigeria and they just produce all out, at some point these nations could simply leave OPEC, but then the cartel could fall apart. The cheating problem is one of the reasons that cartels tend to fall apart, it is surprising OPEC has maintained market power for nearly 50 years, its time may be nearing its end.
“In 1916 the Standard Oil Company of California was looking for places to drill for oil and leased the bluff area at west Newport Beach but decided not to drill in that area. In the employ of the Company was a young Geologist who was studying the coastline and advised the Company that the high mesa in Huntington Beach might have possibilities. After some persuasion on his part it was decided that a wildcat well would be drilled in the area.
Standard leased part of the 1400 acres of land owned by the Huntington Beach Company and prepared to drill. The location picked by the geologist Mr. S.M.Gester was west of the City water reservoir”
“This was to be the first time in the history of the oil business that an oil field was to located using the talents of a Petroleum Engineer.”
“By 1939 a great number of wells had been shut down or were small producers called “strippers” and were being sold off to small operators called “Poor Boy Companies” who could operate them alone or help each other to cut down on labor cost and were able to keep the wells on production and recover much of the oil left in the ground.”
“From 1920 to December 1957 the cumulative producdtion of the Huntington Beach Oil Field was 613,723,624 barrels of oil and 570,574,590 million cubic feet of gas and the reserves still in the ground at that time were estimated to be 47,807,161 cubic feet of gas.”
https://www.huntingtonbeachca.gov/files/users/library/complete/070811-2.pdf
“At least 65 Gulf of Mexico offshore oil platforms have shuttered operations, resulting in a decline of 500,000 barrels per day (BPD) of oil production. Gulf of Mexico oil platforms represents about 15% of total daily US production. ”
https://www.zerohedge.com/commodities/tracking-tropics-tropical-storm-cristobal-strike-gulf-coast-sunday
SS, your description above sounds like business was transacted in the April time frame in a manner arbitrarily departing from the way you folks normally do business. Why? Because y’all could not accept the numbers. And I could phrase that, y’all could not accept reality. And — this should be repeated over and over, that was indeed reality.
Politics? How’s this? This moment, no one knows what issue will decide the November election. Odds are very high the deciding issue doesn’t even exist right now.
Odds are similarly high the spectacular jobs report of Friday derived from the PPP. IRS was consumed with workload demands for the $1,200 checks and only got around to distributing PPP money long about the second or third week of May. Companies could anticipate it with plans to hire before the money arrived, and companies might even outright hire in anticipation of the money, but the vast majority didn’t risk it. They hired when they got the check.
The checks came out the third week of May, and the unemployment report for every month samples their measurement in the third week of that month. Because no one knew how long the IRS would take with the $1,200 checks, it’s very unlikely that was all orchestrated so the President could make the announcement of spectacular results.
This can go on as long as the PPP money flows. If you don’t have to sell products to pay salaries, then you’ll probably go ahead and pay salaries. The whole prime the pump theory is that the stimulus money paid to employees gets spent on stuff and is, in fact, consumer consumption.
Back-of-the-envelope says the PPP will not run out until about October. The jobs report for October, as it does for all months, takes place on the first Friday of the month. That Friday in November will be after election day.
My local GDP observation says roads are about 2/3 normal full. And this state is not locked down. I would guess with that much activity plus the remaining PPP money, there should not be an economic smash prior to election day. It would take a Captain Tripps magnitude mutation to create one.
BP plans to cut workforce by 15%, accelerate transition to renewable energy because of Coronavirus:
“It was always part of the plan to make BP a leaner, faster-moving and lower-carbon company,” Looney said.
The spokesman said that the coronavirus crisis “amplified and accelerated” BP’s transition plans.
https://www.reuters.com/article/us-bp-jobs-exclusive/exclusive-oil-major-bp-to-cut-15-of-workforce-idUSKBN23F1D9
Some more updated comments on the demand situation.
The most recently updated estimate is for an average of a bit more than 10mmbpd excess supply from March-May 2020, leading to an inventory build of just in excess of 1bn barrels (seems a bit low to me, but that’s what was reported). It seems that the market moved to a deficit (slight) at the beginning of June which has started the slow (very) process of draining the excess supplies off the market.
As I mentioned earlier, the current expectation is that the excess inventory will be wiped out by the middle of next year depending of course on the pace of demand coming back and the supply cuts staying on (primarily from OPEC plus).
ancientarcher
I get roughly 962 million barrels of crude plus petroleum product stocks at the end of May (assumes 10 Mb/d excess supply in May over consumption) above the 5 year average for OECD stocks. Let’s assume consumption recovers to 2 Mb/d more than World output on average for 2020 and 2021. That suggests about 481 days or 1.31 years for such a scenario to return to the 5 year average stock level.
Of course there is no guarantee the output cuts will remain in place that long or that demand will increase as fast as this scenario assumes. There is also the risk that Libyan oil will return to the market and that a potential change in US administration might lead to reduced sanctions on Iran, clearly there is much uncertainty, but demand may be lower in the future (EIA does not expect US demand to return to the 2019 level by 2021 in the most recent STEO) and supply may be higher than you anticipate. I think OPEC+ may turn on the taps when Brent oil returns to $55/bo, that will keep oil prices under $60/b0 until 2025 and perhaps beyond.
GOT TO LOVE WALL STREET
Chesapeake Energy’s stock triples today to nearly $70 with 22 trading halts:
https://www.marketwatch.com/story/chesapeake-energys-stock-nearly-triples-after-22-trading-halts-2020-06-08
Then, after close, Chesapeake announces “Ready To File Bankrupcty”
https://www.marketwatch.com/story/chesapeake-energy-readying-bankruptcy-filing-report-2020-06-08
Even with Chesapeake’s stock price surging 181% today, if we remove the 1-200 reverse split, the stock is only worth 35 cents a share… LOL.
steve
June STEO released today.
https://www.eia.gov/outlooks/steo/
Output drops about 2.2 Mb/d from November 2019 peak to March 2021. Most of the drop (1.96 Mb/d) occurs from March 2020 to October 2020.
The EIA’s STEO projection for World Petroleum and Other liquids consumption and production and OECD stock levels, quarterly. Consumption reaches more than 100 Mb/d in quarter 3 of 2021 and OECD stock levels return to 2019Q4 level in 2021Q4.
STEO Oil Prices
Brent Oil (nominal price) rises from 36 to 39 $/bo from June 2020 to Dec 2020 and to $54/bo in Dec 2021.
https://markets.businessinsider.com/commodities/news/china-oil-demand-almost-back-coronavirus-levels-2020-5-1029214304?op=1
Gist is china energy people not authorized to say anything for some reason said things to Bloomberg. 13 mbpd. Nearly 2019 levels.
Interesting blurb, people are choosing to drive rather than use public transport. No mention of virus incentive in that, but in the US there certainly would be.
1.24 million mile battery already available from CATL for any interested carmakers:
https://www.greencarreports.com/news/1128429_battery-giant-catl-million-mile-batteries-tesla
EVs are already 4-5 times as efficient as ICEs. In a few years they will also last 4-5 times as long as ICEs. That means that over its lifetime, the purchase of one EV will displace the purchase of four or five ICE cars.
Expect more announcements like BP’s above. With massive amounts of spare capacity, oil will not breach $50 barrel for at least five years, possibly ever again. Global investment is switching in a massive way towards renewables. The amount of awesome battery tech in the pipeline will draw away all the $$.
Looks like the EIA and IEA is counting on a rather quick recovery from Covid-19. But an Australian think tank says it just ain’t gonna happen.
The U.S. shale-oil industry may collapse, new report says, after Goldman warns crude is set for a fall
The U.S. shale-oil industry may collapse due to the sharp fall in oil prices because of the coronavirus pandemic, a new influential report predicts.
The demand for and price of oil tumbled due to the economic slowdown and have since begun to recover, but Australian think tank the Institute for Economics and Peace warns that a low price will affect political regimes in the Middle East, especially in Saudi Arabia, Iraq and Iran.
IEP’s annual Global Peace Index, published Wednesday, analyzes tension around the world and compiles an index of the most peaceful countries. It suggests the effects of the pandemic may “result in the collapse of the shale-oil industry in the U.S., unless oil prices return to their prior levels.”
While the price of oil US:CL has begun to recover from its nadir — having crashed into negative territory in April — analysts at Goldman Sachs warned in a Tuesday note that the rise in the oil price has been overdone and forecast a drop in Brent crude prices UK:BRNQ20 to $35 a barrel, from around $43 a barrel, within weeks.
Shale oil is produced through fracking, the controversial process of pumping high-pressure water and sand underground to fracture rock and release valuable new energy reserves known as shale.
The IEP report says that the combined weakness in commercial, travel and industrial activity led to a plunge in oil prices in global markets. “These markets were already affected by an oversupply, emanating from Russia and Saudi Arabia who could not agree on production curbs,” it says.
The below graphs are from the EIA’s latest STEO.
Question: Why does the EIA expect Non-OPEC liquids production to start recovery in July and be back to mid 2019 levels by the end of 2021?
But not the USA?
Ron the first chart is all liquids, the second is C C only, so perhaps they expect NGL output to rise, here is US liquids and non-OPEC liquids from STEO.
Part of the explanation is that non-OPEC output drops by quite a bit more than US production so it has more to make up, also Russia and other non-OPEC producers that are part of OPEC may increase production along with Brazil, Canada, and Norway as oil prices improve.
From STEO World Petroleum table, non-OPEC minus US all liquids (Mb/d)
Ron they expect oil prices will gradually rise from $35/b in June 2020 to $53/b in Dec 2021. If the price forecast proves correct, I doubt we will see tight oil output recover, other non-OPEC output might recover somewhat as oil prices rise, but typically the STEO does not get their forecast right, if non-OPEC output does not recover, perhaps OPEC output will grow to fill the gap, if not oil prices rise if supply is short.
Although rig count was still falling as of last report, frac spreads are up slightly.
Maybe many of the DUC’s will be completed?
shallow sand,
The ratio of horizontal oil rigs to oil focused frac spreads has risen from Feb 7 to June 5 from 2.3 to 4.3, so it would seem there are plenty of rigs for keeping frac spreads busy as of June 5, 2020.
Ron,
On your non-OPEC chart, I would put the projections starting at March 2020.
They are not my projections Dennis, they are those of the EIA. They have bold for data and non-bold for projections. That is the only reason my charts look the way they do.
Hi Ron,
Got it. The only real data in my opinion is in the EIA’s international statistics, which has as its latest data point Feb 2020, so the March 2020 to May 2020 “data” are simply estimates, essentially I would consider them projections.
I use the STEO data browser, so I did not realize there was a bold non bold distinction as at link below.
https://www.eia.gov/outlooks/steo/xls/STEO_m.xlsx
I use a different area of the EIA website, link below
https://www.eia.gov/outlooks/steo/data/browser/#/?v=29&f=M&s=0&start=201601&end=202112&ctype=linechart&maptype=0&linechart=T3B_PAPR_R01
Sorry about that.
What is strange about the spreadsheet at the first link for the table 3b tab is the note below the spreadsheet:
Notes: The approximate break between historical and forecast values is shown with historical data printed in bold; estimates and forecasts in italics.
Supply includes production of crude oil (including lease condensates), natural gas plant liquids, biofuels, other liquids, and refinery processing gains.
Not all countries are shown in each region and sum of reported country volumes may not equal regional volumes.
Historical data: Latest data available from Energy Information Administration international energy statistics.
Minor discrepancies with published historical data are due to independent rounding.
Projections: EIA Regional Short-Term Energy Model.
Bold added by me.
If one looks at the EIA’s International Energy Statistics for Non-OPEC Petroleum liquids today, the last data point is February 2020.
So basically their note is inconsistent, the historical data actually end in February 2020 and the March 2020 to May 2020 “historical data” must come from the EIA Short term regional model and is in fact simply a projection.
Dennis
There is this note at this week’s inventory report:
Crude Oil Production Re-benchmarking Notice: When we release the Short-Term Energy Outlook (STEO) each month, the weekly estimates of domestic crude oil production are reviewed to identify any differences between recent trends in survey-based domestic production reported in the Petroleum Supply Monthly (PSM) and other current data. If we find a large difference between the two series, we may re-benchmark the weekly production estimate on weeks when we release STEO. This week’s domestic crude oil production estimate incorporates a re-benchmarking that lowered estimated volumes by 77,000 barrels per day, which is about 0.7% of this week’s estimated production total.
They have a certain amount of data for April and May from the weekly data and possibly other sources. So for them, June would be their first projection.
Fed just announced $80B/mo bond purchases indefinitely. Hard to see how that’s not re-election supportive. About $1T yearly. It’s not monetizing if we say it’s not monetizing, remember?
May’s CPI clocked in a few days ago at -0.1%, because printing money is inflationary, in the minds of bozos who insist it all has to make sense. Oil didn’t undo that. Even more deflationary y/y.
“US Crude Oil Stockpile Reaches Record High, Production Hits 20-Month Lows”
would normally avoid posting from ZH, this article seems to summerize the latest from the usual sources
https://www.zerohedge.com/energy/wti-holds-losses-after-crude-distillates-builds
George Kaplan,
Please check your e-mail if you see this.
Thanks,
Dennis
New Posts are up.
http://peakoilbarrel.com/norway-summary/
and
http://peakoilbarrel.com/open-thread-non-petroleum-june-11-2020/