A Guest Post by George Kaplan
Exploration, Discoveries and Development
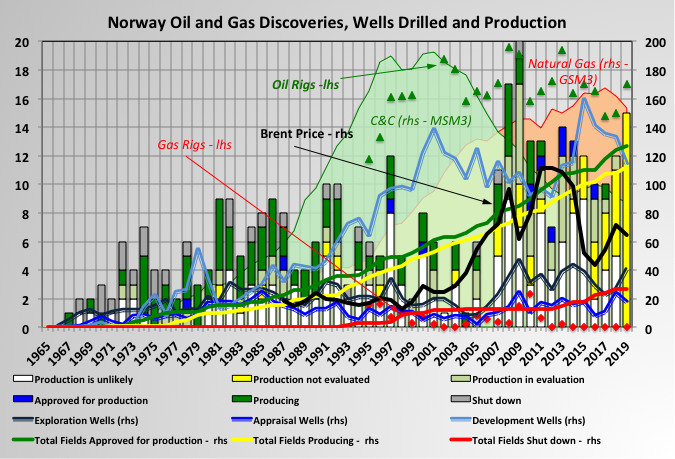
Drilling and development activity off shore Norway has been fairly steady through the life of the basin. This has been partly from government policy, through tax relief or direct action, but also through opening up of new areas as technology becomes available. It has moved from mainly producing oil to now being dominated by gas, although there is little direct gas exploration now (note that converting gas to o.e. is simple in S.I. units and is just a factor of 1000).
Drilling activity has been high in the 2000’s for development wells (including a lot of in fill drilling and some major redevelopments) and exploration (I think there is very favourable tax arrangements that encourage drilling in even fairly low prospective areas). Appraisal drilling has been more flat and there has been some reports that some discoveries have proved disappointing after start up, possibly because of insufficient drilling before development was approved.
There are twelve projects “approved for production” (i.e. in development) with average reserves of 26.5 MSm3 and average discovery year 2001; nineteen projects “production in clarification phase” (i.e. in FEED or pre-FEED) with average resources of 25 MSm3 and average discovery year also 2001; twenty nine projects “production likely but unclarified” (i.e. in conceptual design) with average resources of 10 MSm3 and average discovery year also 2003; and twenty eight projects “production not evaluated” with resources of 8.5 MSm3 and average discovery year also 2010.
The number of “hydrocarbon shows” has been large recently but they have mostly been small with “production unlikely” or “not yet evaluated” (and present prices mean most of these are likely to be deferred at best).
The number of development projects per year has, if anything, been increasing slightly, although the size has been generally decreasing. The number of shut down fields is increasing slowly but the have been a number that have had their life times extended beyond their original shut-down date (through improved reservoir performance and/or major redevelopments).
The oil price may have influenced activity but I can’t really see it much, maybe the effect of the current crash will be more obvious.

Discovery size has been slowly declining although recent results were a bit skewed by the Johan Sverdrup discovery in 2010, which was a bit of a fluke being a large discovery in a well-explored region. The size of the field is not as obvious as it might be in the chart as a number of small fields were found in the same year, which lowers the yearly average and, more so, the five year running average shown.
Reserves Growth
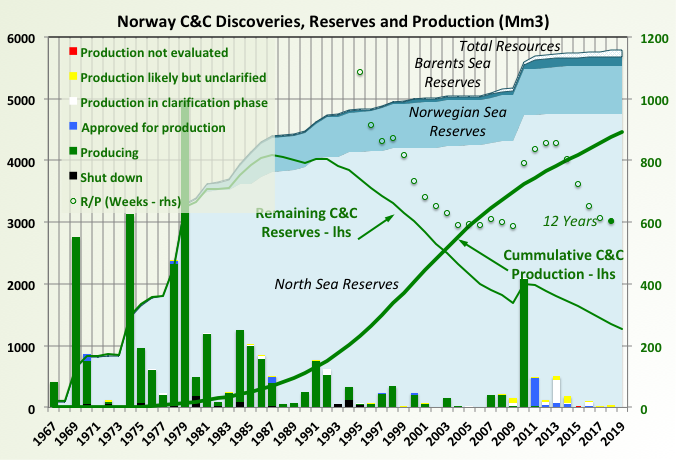
R/P has been coming down steadily except for the bump caused by the Johan Sverdrup discovery (note this is shown in weeks so that it fits on the right hand axis)
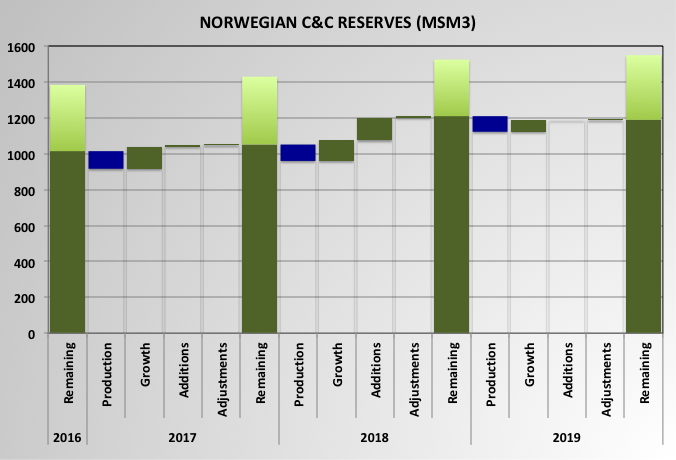
Oil reserves have grown over the last four years, mainly from growth in the Johan Sverdrup reserves. There has been a small growth in resources, although with current prices these may take some time before they get approved for production. There are a number of projects undergoing redevelopment: Njorn, Tor, Yme, Snorre; but I think any reserves growth due to the redevelopments has already been included in the 2019 estimates.
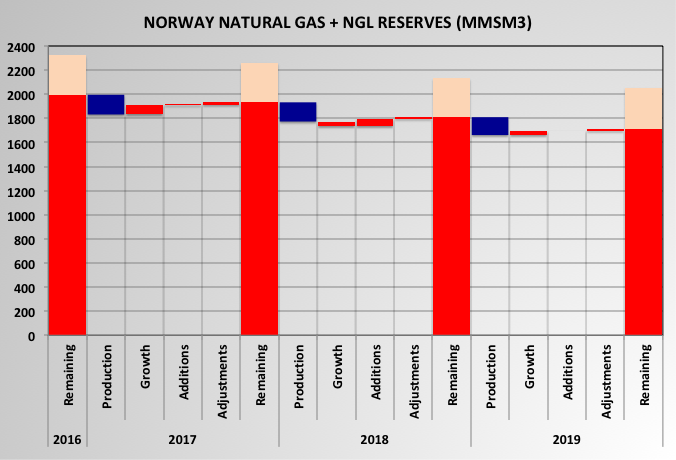
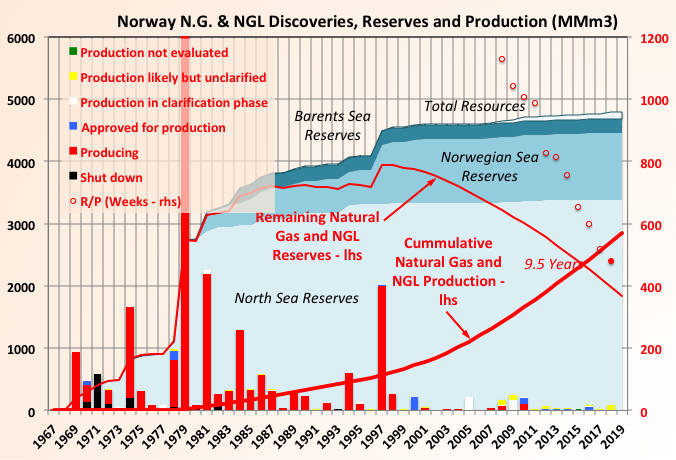
Gas reserves have been declining with few operating gas rigs and few discoveries and relatively low growth in existing reserves.
Field Recovery
The NPD is the only government body that I know of that issues estimates for original in-place hydrocarbons. The highest recoveries are seen in the largest fields. There are 15 fields with above one billion barrels recoverable oil and gas, which have dominated production to date – these mostly have dedicated drill rigs that allow for a lot of work overs and in-fill drilling.
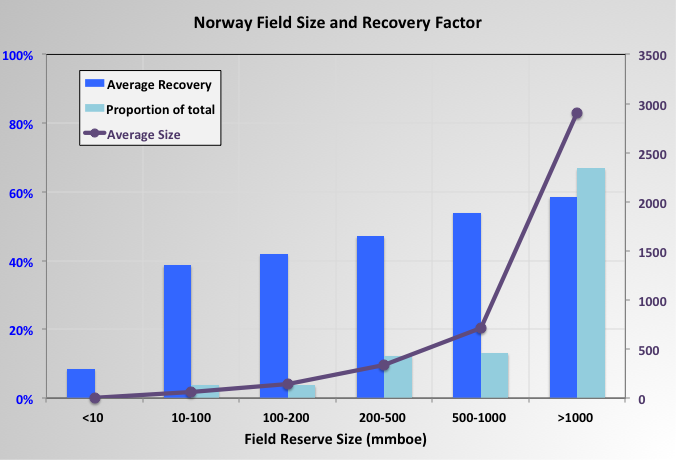
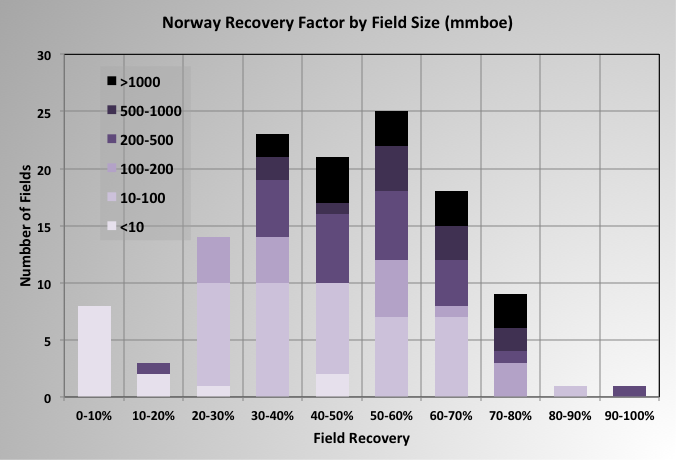
Average recovery is around 50%, which is pretty good for offshore fields, though it may decline as smaller fields are brought on line now (note I have changed units to boe as this is generally how field sizes are usually differentiated).
Overall Production Profiles
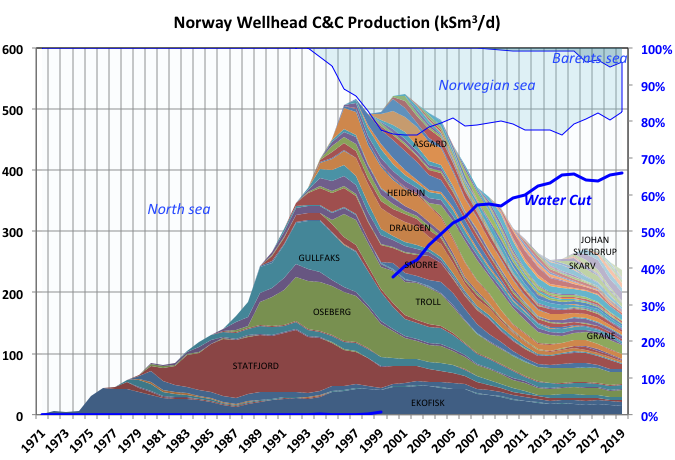
Overall C&C production peaked in 2001. There was a secondary peak in 2016, probably related to high oil prices in 2011 to 2013 resulting in high development activity, and there will be a new peak in the next few years because of Johan Sverdrup production.
NPD production forecast from 2019 has a peak in 2024 at 321 kSm3/d (2022 kbpd), two years after phase II of Johan Sverdrup is started and after Johan Castberg at 16 kSm3/d (100 kbpd) due in 2022 and a number of redevelopments come on stream. This is a 41% above 2019 but 37% below the global peak. This will of course depend on how demand recovers following the COVID-19 recession/depression, and how the delays from this year affect the timing of new greenfield and brownfield projects and decline in older fields.
Troll oil production will decline in the meantime; it is over 95% depleted but still producing over 120 kbpd (20 kSm3/d) and has to be exhausted before Troll Phase 3 gas production can start in 2021.
Because of the price crash the Norwegian government has announced that production will be curtailed this year, to 160.9 kbpd in June and 172.5 through the remainder of the year (25.6 and 27.4 kSm3/d respectively) and a number of start-ups delayed to next. Though given that May and June are the turn around months the June cut may not actually represent much deferral at all. This may result in an earlier and higher secondary peak if the demand recovers rapidly.
80% of the C&C production still comes from the North Sea. The Barents Sea has been a bit disappointing so far and the Norwegian Sea is more gas prone (as may be the Barents, but if so it will need very high prices and some very large discoveries before the reserves can be developed).
Water Cut has been held steady recently as new production has come on-line and may reduce a bit in coming years as a larger proportion of production comes from Johan Sverdrup. The Johan Sverdrup production started only late in 2019 so does not show much in the annual average but is clearer in the monthly chart below.
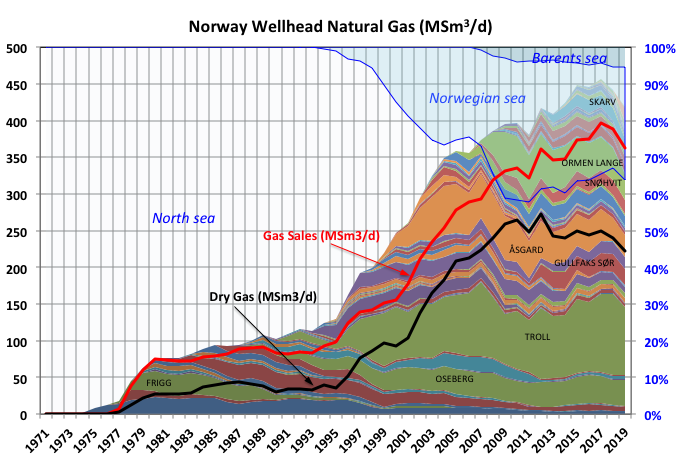
NPD natural gas production forecast indicates a bumpy plateau (±5%) between 2015 and beyond 2024 with an overall peak in 2022 (subject to effects of the lockdown). Followed by decline unless Norway is prepared to allow a large increase in Troll production or some major new discoveries.
This may be bad news for Europe, especially UK. The Orman Lange field is over 75% depleted and in decline, although sub-sea compression is planned to give a short-term boost and a bit of reserve growth. Orman Lange feeds the Nyhamna gas plant which exclusively provides gas to the UK via the Langeled pipeline, as it declines other fields have been bought on line through the same gas plant (four associated with Aasta Hanseen and Dvalin in development).
The difference between gas sales and wellhead gas is mainly gas injection with some used as fuel (though nowadays many platforms are powered from hydro dams onshore via subsea cables) and a small amount from flaring (again less now as many flares are closed and only emergency flaring is used – a result of Norway’s early adoption of carbon pricing).
Recent Production Changes
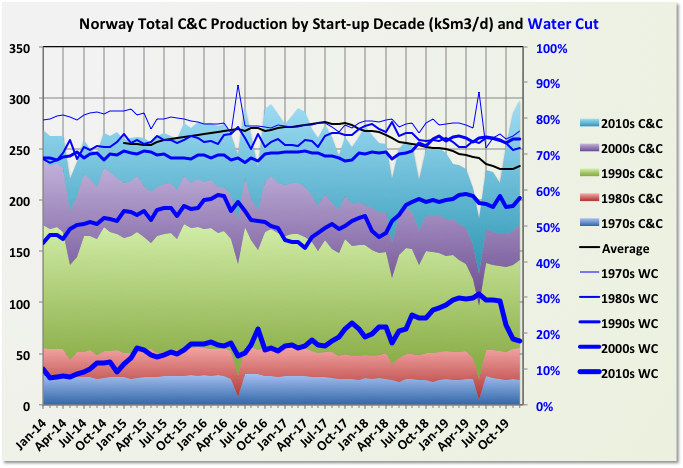
The largest fraction of production comes from fields started in the 1990s, which includes Troll Oil. This probably reflects a balance between the size of the original reserves (i.e. larger fields tend to be developed earlier) and the periods of depletion and decline. Average water cuts seem to flatten out around 70 to 80%. Fields started before 2000 are mostly there already (but some of these fields are undergoing redevelopment which usually will reduce water cuts). Newer fields are rapidly catching up, but Johan Sverdrup will make a significant change to the 2010s’ and overall averages.
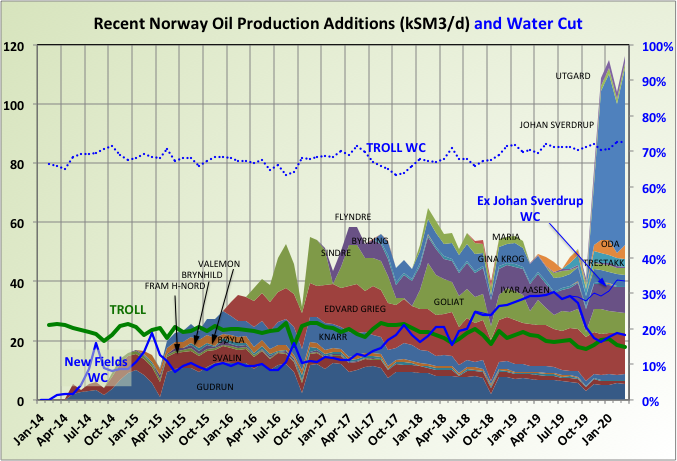
Most recent additions have been small to medium sized fields, which had relatively short plateaus and rapid declines. They are swamped by Johan Sverdrup, which had predrilled wells and a very rapid ramp-up. It reached 350 kbpd (56 kSm3/d) in 2019 and was due to increase some in 2020 but that may be delayed, and is due to reach 640 kbpd (101 kSm3/d) after phase II start-up in 2022. It is a large field but even so these are quite high design flows and imply a relatively short plateau and may indicate NPD and/or Equinor are a bit concerned about near to medium term decline in other fields (or maybe leaving stranded assets). I’ve only labeled the larger fields.
I have included Troll for comparison; it was the largest producing field before Johan Sverdrup. The production has been declining in recent months as the water cut has increased. Production has been kept high by continuous drilling of horizontal wells away from the water interface but they now seem to be losing the battle and the oil production is due to end (or be severely curtailed) in 2021 before the gas cap is produced.
The water cut of the new fields started before Johan Sverdrup has been accelerating recently and overall is approaching a point where the production equipment may be limiting on maximum production of these fields, not just well performance, so oil production may begin to fall slightly faster.
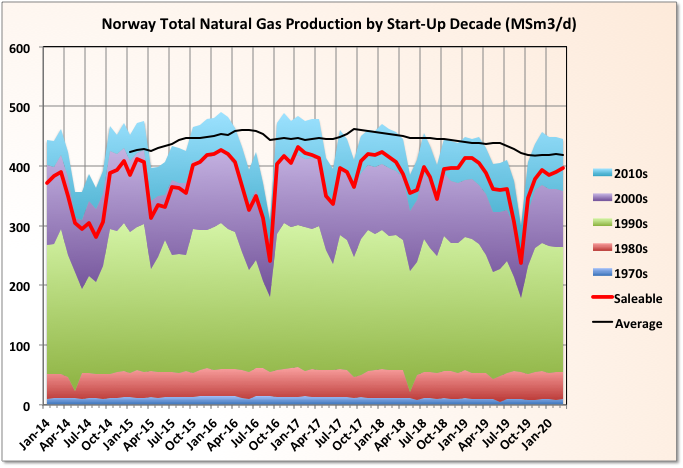
Troll, in the 1990s, is the largest contributor by far and its total production and, more so, its proportion of the total will increase once the next phase there is brought on-line.
Off Topic Finish: FAO Food Price Index
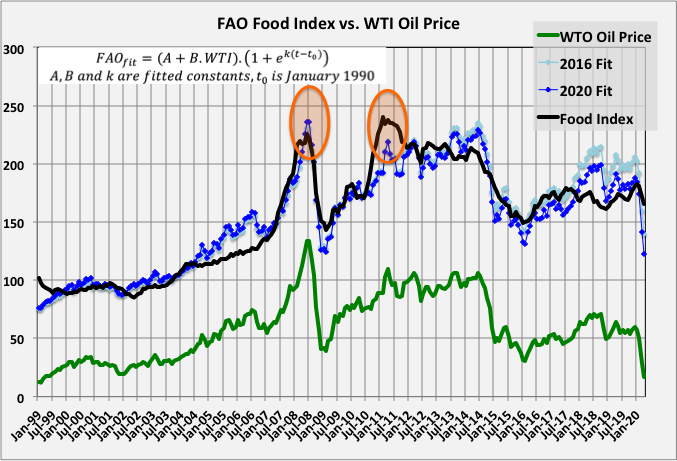
The correlation between the FAO food prices with the oil price remains close, although recent volatility of the WTI price, even on monthly averages, has shown quite a large divergence. I made a first pass least squares curve fit in 2016 and updated it in January. Both are reasonably close as shown below. The index in 2017 to 2019 has been lower than the correlations predict – that could indicate good harvests but it’s possible to read too much into these things. It will be interesting to see what happens this year given low oil prices are expected but food shortages and famines are predicted. It could mean that effects will be highly localized and affected by supply chain issues or, as in the great depression, food is cheap but, even so, no one can afford it. The highlighted point shows where previous high food prices caused outbreaks of social unrest (e.g. the Arab Spring).
Thanks George, great post, as always.
Agreed. Was so impressed I sent a copy (the link) to my “Norway Niece”, a reservoir engineer who works on these very same oil fields. Thanks George.
Thanks Doug,
It would be interesting to hear her perspective if you feel like sharing it.
Dennis —
Nicole works for Equinor (formerly Statoil) based in Stavanger and isn’t really supposed to comment on Blogs. The only time she did, via me, one of your (former?) know-it-all commenters suggested she didn’t know enough yet to be commenting here (or words to that effect) which didn’t go over well. Niki does read your Blog from time-to-time and enjoys hearing the “American perspective” on oil stuff.
Doug,
Ok thanks. Forgot she couldn’t comment, makes sense.
You could pass along what she tells you and not attribute it to anyone (I have heard that…). Or not.
Food comes from oil. Price alignment can’t be surprising.
Pretty severe hog kill in China last year due to disease and they imported to offset. But oil price was low and so was the imported hog price.
The virus is a wild card, but farming doesn’t have a lot of closely packed people involved. If it can be delivered to Walmart curbside pickup, there will be demand and so it will be produced.
Grain production (which is where the calories come from) should continue to follow oil prices both in terms of fertilizer (from oil and natural gas) and in terms of diesel. No closely packed people until the grain is converted to packaged goods. That can probably be controlled until later in the distribution chain.
Vegetables, fruit, and nuts will follow fertilizer and fuel costs but also water. The pickers have a closely packed people problem in farm worker housing and cross border concerns. Changes will be necessary there.
Lastly, meat follows grain prices and fuel costs. The packing lines will take a lot of space and staggered arrival/departure times to get people separated. Fortunately, packing lines aren’t in big cities.
The very circumstances that make profitable ag possible also make solar/wind power possible. Farmers will be able to adapt their machinery rapidly to electricity. They have a culture of “make-do” and “do-over”. This means that every time crude oil pops on price, farmers will convert and they will have no need to go back.
fertilizer (from oil and natural gas)
Is there a significant amount of fertilizer derived from oil? I thought it was all from methane…
Only the ammonia is derived from methane. The potash as potassium chloride and the phosphate as rock phosphate are mining operations which are currently dependent on diesel.
Okay, so you’re thinking that if diesel prices go up then the cost of mining of potassium and phosphorus will go up as well, and those cost increases will drive up the overall cost of N-P-K fertilizer?
Have you happened to run across any information about how much diesel is needed to produce those two components?
The diesel component may be very low. For instance, one major area of phosphate mining is in Florida:
“ Draglines, the current mining tool, came into use with the dawn of electricity and diesel power in the 1920s and 1930s. By 1930 these electrically driven draglines were adopted as the most economical way to mine land pebble. They also were put to use in the hard rock region.
The dragline significantly changed the mining operation. In 1900 it took a year to mine a 15-acre mine site with picks and shovels. Today one dragline mines 15 acres in a month.”
http://www.fipr.state.fl.us/about-us/phosphate-primer/florida-phosphate-mining-history/
The impact of the new tax regime in Norway in support of the oil industry should be very interesting to watch.
From the little I know, Norway’s reserves are among the most economic in the world.
Yet, if the chart I am looking at is accurate, Equinor shares are at lows not seen since 2004.
Shale was a big mistake for the company formerly known as Statoil.
US shale, the gift that keeps on giving.
It looks like COVID isn’t going to relent anytime soon. Not sure how US based E & P’s are going to make it if we crash back into WTI $20s or below again. We have never been more down in the dumps. We started most wells back up in the second half of May and won’t have any oil income this month from May sales. The Q2 public numbers will be the worst ever for the industry, or at least the worst since the Great Depression.
Not sure central banks can keep this whole deal afloat.
Yes, Equinor lost about 20 billion dollars on shale (including very poorly run business / office start in the US).
DHP lost 40 Billion + in the Shale scam. Much in the Fayetteville
https://www.abc.net.au/news/2017-08-23/bhp-billion-dollar-shale-oil-blunder/8832698#:~:text=Energy%20analysts%20value%20BHP%20shale,fields%2C%20oil%20price%20collapsed%2075pc
North Dakota oil production was down 211,021 barrels per day in April to 1,219,086 barrels per day.
ND Monthly Oil Production Stastics
Ron,
That will likely lead to a revision of the EIA official tight oil estimate for April to 125 kb/d lower with a decrease of 492 kb/d from the Nov 2019 peak to April 2020. April 2020 output at 7780 kb/d, unless other basins also get revised lower. Bakken gets revised about 10% lower, if all tight oil output gets revised a similar amount, then April output falls to 7114 kb/d, a decrease in tight oil output of 967 Kb/d form March to April 2020. It would be a big deal.
George,
There would be two things that might be interesting for the food vs oil analysis. First, adjusting both for inflation (about 55% in the US over the last 20 years) would show that both oil and food prices are about the same as they were 20 years ago; and 2nd, one could investigate whether the correlation between food and oil prices is due to both being related to overall economic conditions and the business cycle: we could look at the correlation between oil and other commodities such as copper – here’s an analysis that found an r squared of .94 between oil and copper: https://www.admiralmetals.com/admiral-metals/copper-oil-prices-a-look-at-the-correlation/
George,
Thanks for the great post. I have a few questions/comments.
On the “Norway C&C Discoveries, Reserves and Production” chart – the cum C&C production is about 4.5 billion cubic meters, which would convert to about 27-28 billion barrels. Do you know the cum production from the biggest individual fields?
To date, how does the North Sea compare in cum oil production to other offshore basins? The northern GOM is at about 15BBO.
Aren’t all North Sea fields waterflooded? I heard somewhere that is a mandate? At least in the British North Sea, not sure about the Norwegian North Sea.
On the chart “Norwegian Recovery Factor by Field Size (mmboe)” – some of the recovery factors are really high, like over 80%. Do you think that legit, or do you think the NPD estimates of OOIP for those fields is too low?
In my early days in the industry I heard a story about the reservoir compaction associated with Ekofisk field – because of the high porosity of the chalk reservoir, the compaction is in the order of feet, and it has resulted in seafloor subsidence around the platform legs. It’s been a fairly big deal for the operator, I think Phillips?, at least at the time,, to manage this.
SLG – I haven’t worked in Norway this century and I’m not a geologist so treat any answers accordingly. There are 2 or 3 posters here who have more recent and, probably, more relevant experience so they may give better answers.
The top fields are below in MSM3 o.e.; Norway has more large fields and production from them than UK. UK overall production is less than UK and daily production is now a lot less as the gas was used up much earlier than Norway’s. I only know GoM, Canada and a bit of Africa first hand so I don’t know much about other production but I’ll do posts on Mexico, UK and Brazil this year in which I’ll include cumulative data.
TROLL 1768.224 Gas
EKOFISK 733.274
STATFJORD 703.806
OSEBERG 545.54 Oil/Gas
JOHAN SVERDRUP 425.38
ÅSGARD 423.988 Oil/Gas
GULLFAKS 415.517
SNORRE 327.084
ORMEN LANGE 319.62 Gas
SNØHVIT 256.365 Gas
Ekofisk had to be jacked up as it subsided, it was quite an engineering feat I think, something similar is being done now with the main Danish gas hub (a smaller platform) and I seem to remember Norway did something similar on another field (maybe Frigg?).
I don’t think WI is mandated but like the UK they are expected to show that maximum commercial recovery is made. I think all but the smallest fields have some form of pressure support – some is GI, including bought from other fields, don’t know if there is any natural aquifer action, but there is a big one there (probably at different depth to the oil) that is used for some produced water disposal. Recent small tie-backs definitely don’t have injection – they are single wells, often just using the exploration completion. I can’t find injection data for Norway, there is some for GoM and UK but there’s only about a fifth as many injection completions as development producing wells.
I think Saudi is aiming for 75% recovery on some fields so 80% might be possible – like Saudi Norway have very detailed reservoir models (pretty much from the start) and drill a lot of wells, especially on the platforms with permanent rigs and dry trees. I’ll have a look a bit more next week. today.
Bloomberg late May announced China oil burn at 13 mbpd. About 0.5 mbpd below late 2019. This was a sharp recovery from Feb.
India snippets are emerging. Deepest lockdown consumption loss was down to 30% 2019. It has now recovered to 70% 2019, with hand waving about requiring a year or two to recover the remaining 30%. Indian refineries see 85% of 2019 by end of year.
India had the most severe lockdown in the world. As it emerges from lockdown, you will quickly see that oil demand will touch previous levels within a few months. I don’t expect India oil demand at the end of 2020 to be less than at the end of 2019.
Another thing is that unlike in other countries, the Indian govt has increased taxes on oil – to fund the covid stimulus. So, surprisingly for the common man at the gas station, a gallon of gas costs more than it did before the covid crash. This will tend to reduce the pace of recovery for sure.
Overall, all EM countries are expected to touch previous consumption levels within this year.
Ancient, you are incorrect . Reporting from the ground level . India has re opened but will not restart . Number of unemployed is anything between 400-450 million . No jobs in the urban centres . Millions of migrant workers did a reverse migration from the towns to the villages . Govt is bankrupt .Has not paid doctors and nurses since last 3months . Has no money even to buy wheat from the farmers at the minimum support price promised . Maruti Suzuki sold 197 cars in May . A disaster in the making . Look for increased suicide rates especially farmers in the future .
This looks like revolution – conditions like this normally cause a revolution of some kind. Not decided if right or left wing, but normally nothing good.
No revolution in India . Public is too divided along religious ,caste lines,language,cultural divide to take a call . India has been ripe for a revolution from a long time . Sometimes I wonder how did Gandhi manage to get the public behind him during the freedom movement . Truly astonishing . Hats off to him .
The EIA’s Drilling Productivity Report has production from all shale seven basins combined at 7,633,548 in July. That is down 1,528 thousand barrels per day from the peak in November.
Mexico Is Prepared To Sell Venezuelan Oil
https://oilprice.com/Latest-Energy-News/World-News/Mexico-Is-Prepared-To-Sell-Venezuelan-Oil.html?
Anyone know of a reference (totals or % of national extraction) on distillates/diesel extracted in the US? not including Canada. Seems like this will be important in terms of the stability of the petrodollar.
Longtimber,
distillates are refined rather than extracted, so not that clear what you are asking for. The refinery inputs are a combination of imported (mostly from Canada) and domestic crude.
The EIA inventory report this morning shows a weekly drop of 600 kb/d to 10,500 kb/d in C C. The drop is the same as reported in the last week of March. Not clear what recent info they collected to make them estimate such a big drop. Chart attached.
Also attached is a weekly chart for NGPLs. Interestingly it is still climbing.
NGPLs
Something very wrong here I think. Gas ricks have been down since starting of the year, so no production growth from this side.
Oil is down, too. OK, less flaring but still pipeline constrained at least. So I can’t imagine where the NGPL increase comes from.
Ah, and the gas midstream companies are preparing for lowered throughput since March – so no growth from this side, too.
I think there are some statistical artifacts. Hard numbers are available months later – so statistic is needed to create current numbers. When using the wrong model, something like this happens.
And with all this corona stuff, models from the past won’t work very good at the moment. And you need a lot of data to create a statistical model – it’s not the same as a theoretical model you create on paper and verify it later with hard data.
Here is a speculative suggestion on why the EIA reported such big drop in US production for this week after reporting much smaller drops in previous weeks. I did an inventory balance with the numbers supplied by the EIA. (See picture) Note that in doing the balance, the EIA assumes that the inventory numbers they receive are accurate.
I then redid the balance assuming a 200 kb/d drop in production, i.e. 10,900 kb/d, vs their 600 kb/d drop to get to 10,500 kb/d. To make the inventory numbers balance with a production drop of 200 kb/d, the Adjustment factor then has to go up from -659 kb/d to -1059 kb/d. Having an adjustment factor of over -1000 kb/d is too large, IMO, since it means that the production number is out by over 1000 kb/d. So by dropping the production number to 10,500 kb/d gives a smaller and slightly more plausible Adjustment factor or “Daily Production” error of -659 kb/d.
Curious to hear your thoughts and possibly better suggestions.
Great post George, thanks so much.
New posts are up. OPEC May production as well as a new non-petroleum open thread.