by Dennis Coyne
I have updated my scenarios for US LTO output, based on both EIA tight oil output data and average well profile data from Enno Peters’ shaleprofile.com. I have also created a scenario for the Niobrara shale oil play and for “other US LTO” which excludes the Permian Basin LTO, Eagle Ford, North Dakota Bakken/Three Forks, and the Niobrara.
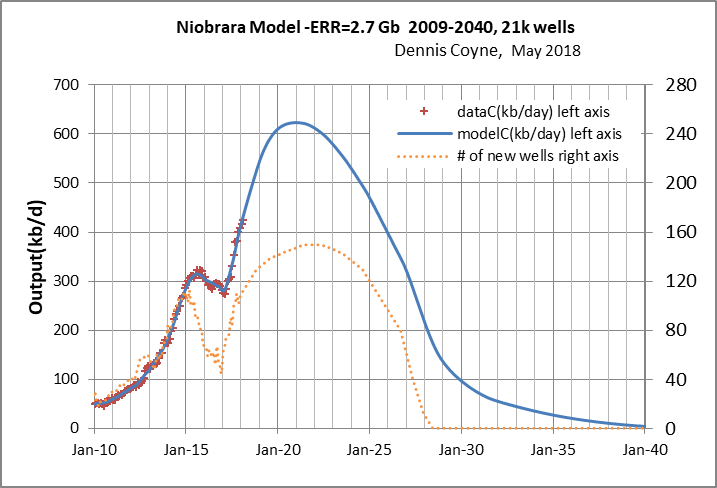
Niobrara Play
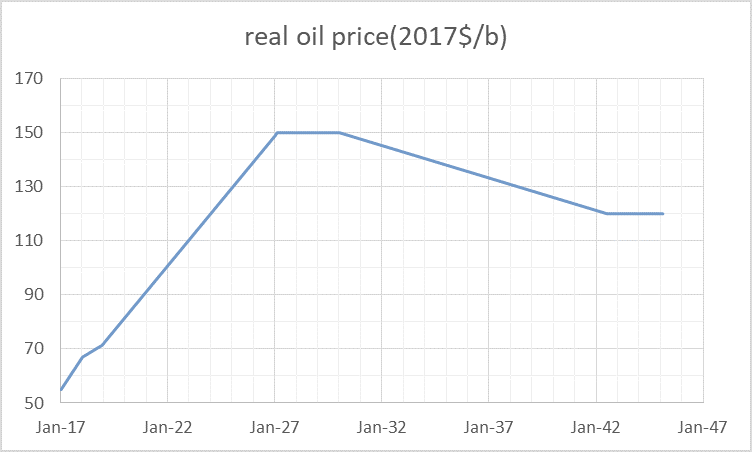
The recent Niobrara wells have an estimated ultimate recovery (EUR) of 143 kb. The oil price scenario below is used for all of the scenarios.
Well cost is assumed to be $4.5 million in 2017$. The scenario below assumes EUR starts to decrease in Jan 2019 as sweet spots become fully drilled. Economically recoverable resources (ERR) to 2040 are 2.7 Gb with 21,000 total oil wells completed, peak output is 623 kb/d in early 2021. Fewer wells are completed relative to the North Dakota Bakken and Permian basin because the wells are less profitable.
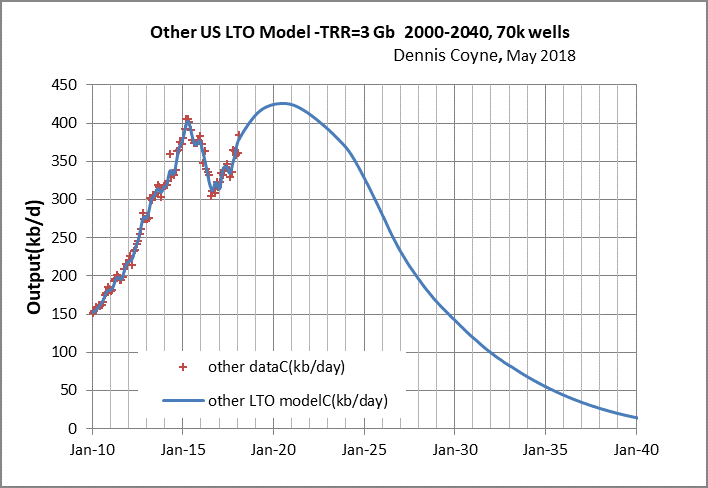
Other US LTO
For US other LTO, much of the output is from condensate from gas wells so the analysis is more approximate and a discounted cash flow analysis is beyond the scope of this post, the “average well” produces only about 38 kb over its life, but in many cases the output of natural gas makes the well profitable, there are some areas where shaleprofile.com does not have data such as the Anadarko basin, so I have simply taken the average well profile for areas covered (excluding ND Bakken, Eagle Ford, Permian and Niobrara) and then found the number of these “average wells” that fit US other LTO output data from the EIA(including Anadarko). The true average well profile for all areas including Anadarko is unknown.
The scenario below should be considered very preliminary, actual output might be much higher or lower than suggested by this scenario. TRR is 3 Gb from 70,000 wells completed and peak output is 426 kb/d in mid 2020. For comparison US other LTO output was 385 k/d in Feb 2018, so increased output from other US LTO plays may be quite small in magnitude.
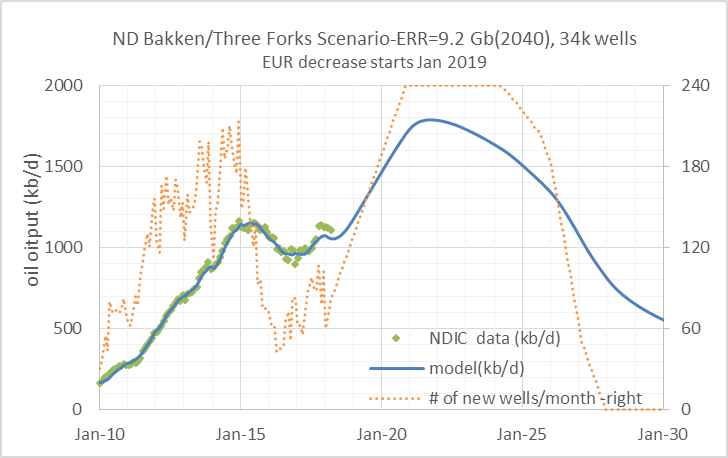
North Dakota Bakken Scenario
Eagle Ford Scenario
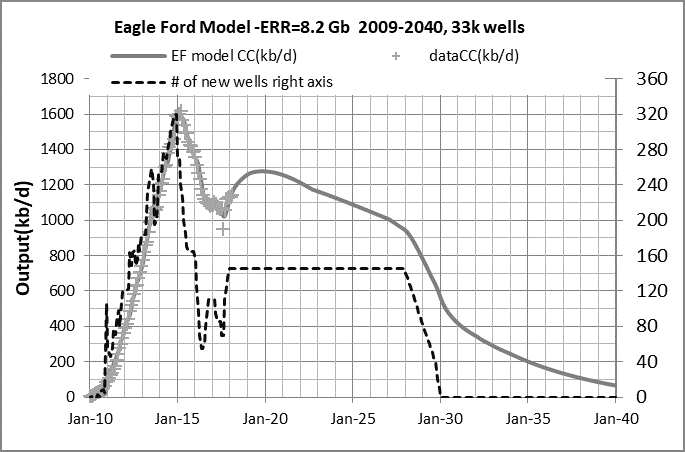
The ROI for Eagle Ford wells is much lower than Permian or Bakken wells which accounts for wells added per month remaining far below the peak level, ERR=8.2 Gb with 33,000 total wells completed, in Jan 2020 output is 1277 kb/d. Like the ND Bakken and Permian scenarios it is assumed for the Eagle Ford that new well EUR starts to decrease in Jan 2019.
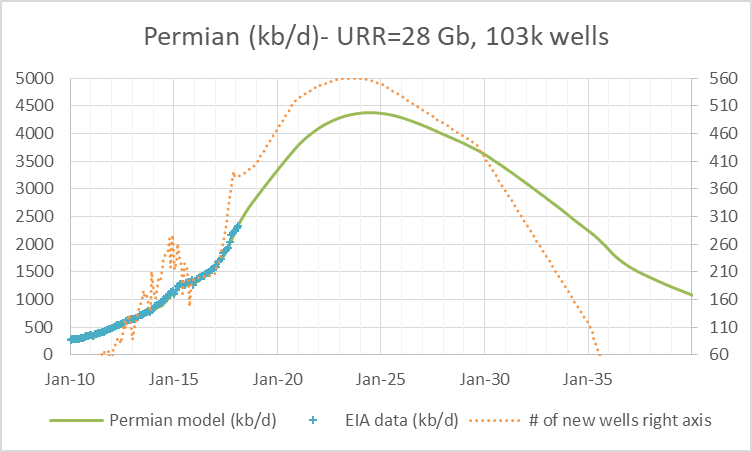
Permian Basin LTO
ERR is 28 Gb through 2040 with 103,000 wells completed, peak is 4246 kb/d in 2024.
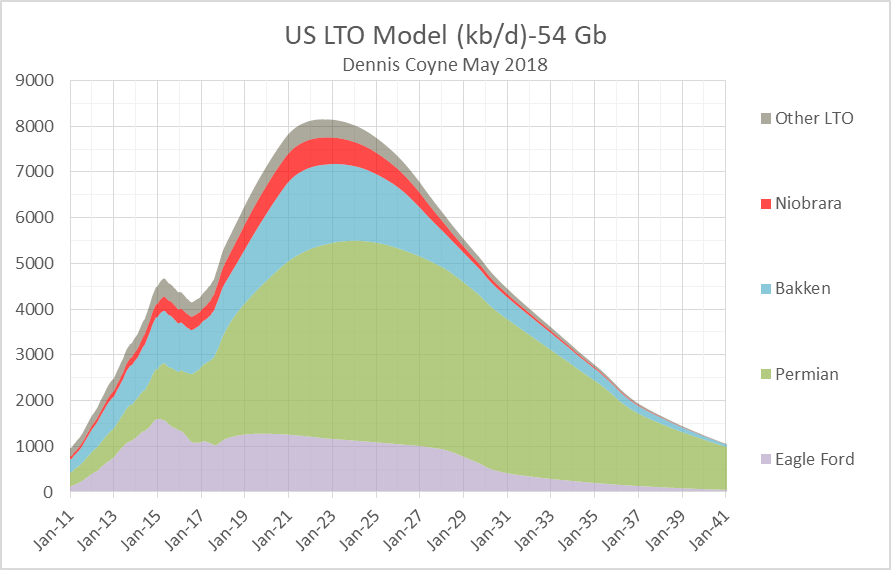
For all US LTO we add up these 5 scenarios to get the chart below. Peak is 8152 in July 2022, URR to 2050 is 54 Gb.
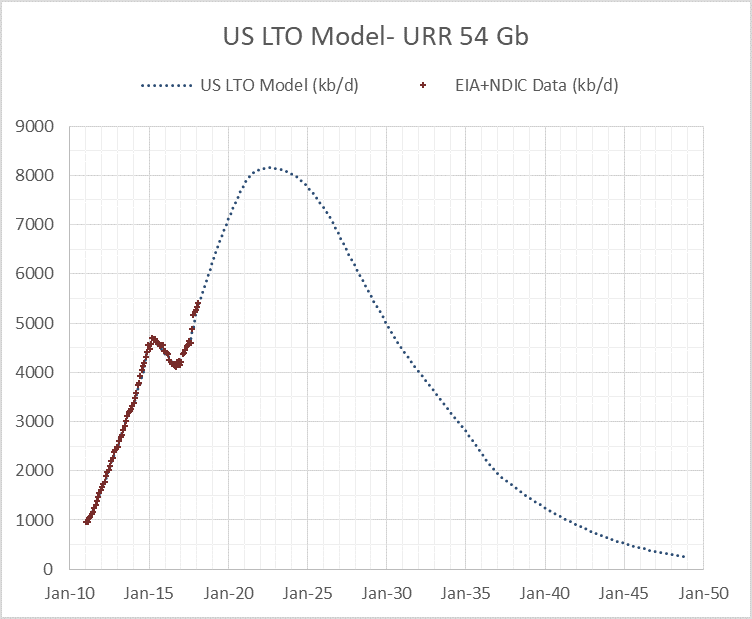
Chart below shows the contribution of the various plays to the total (horizontal axis ends in 2041 rather than 2050).
The scenario presented above lines up with the USGS mean estimates for the Permian Basin and North Dakota Bakken and David Hughes most likely scenario for the Eagle Ford in terms of URR. Reasonable guesses for the Niobrara and other US LTO were made based on EIA tight output data and well data from shaleprofile.com and these will be updated as more information becomes available. Higher or lower scenarios could be created with URR from 45 to 65 Gb and peak years between 2020 and 2025 and peak output between 7000 and 9000 kb/d. In my view, US LTO has about an 80% probability of falling within the low and high scenarios outlined above.
278 responses to “US Light Tight Oil (LTO) Update”
Dennis
Don’t know where you got the $4.5 million per well for the Niobrara, but that sounds kind of high.
You have said several times that you do not rely upon the operators’ own numbers, so I wonder what your source for that cost figure might be.
FWIW, several DJ operators have claimed for years of sub $3 million to D&C, with one outfit (PDC?) claiming about $2.3 per for a 4 well drill/frac on a pad a couple of years back.
The Niobra boys have been employing so called mono bore drilling for awhile that is fast on these somewhat shallower (under 7,000 TVD) wells.
Having said that, the oil component is barely 50%, high NGL.
Similar in composition to many of the Oklahoma wells.
As an aside, Liberty Resources is giving an update at the Williston Basin Petroleum Conference (currently underway) on their EOR project in the Bakken via gas re-injection.
This year’s conference is featuring several presentations on EOR approaches in both North Dakota and Canada.
A lot of effort is ramping up in this endeavor.
Does D & C presumably not include equip? How about the cost to transition from natural flow to submersible to rod lift with a 640 Lufkin? Is that LOE or CAPEX?
When you add tank battery, flow lines, electric lines, natural gas gathering system, plus service costs on all of the above, can add another $500K-$1 million?
Last I knew, D & C gets you a hole that is ready to be produced. All that other expensive stuff I mentioned is a must to get the oil out of the hole and to the stock tanks, to be hauled away with tanker trucks, or to the natural gas pipeline.
Interesting that those wells are costing so little when Bakken is back to pushing $10 million all in and Delaware Basin is $11-13 million.
Glad the service guys are actually generating positive operating cash flow after giving stuff away for three years.
Drill and complete is exactly that … drill and complete.
LOE is exactly that, ongoing cost over a 20/30 year time frame to continue to produce hydrocarbons.
Tank batteries, flow lines, electric, gathering are shared amongst the 8 to 32 (or more) wells that eventually produce from that pad.
One thing Anadarko in particular has is complete ownership of mineral rights which they purchased from the defunct railroad, Union Pacific, decades ago.
coffeeguyzz,
Why do you call Union Pacific a “defunct railroad”?
Curious, I am.
Syn
Good eye.
Shouldda said Union Pacific Resources, which was the outfit that was spun off from the railroad way back when.
When the US government gave land grants to the railroads back into the 1800s, to encourage investment/development, they often included mineral rights.
When the railroad was having financial difficulties, it spun off the mineral rights group – UPR – which Anadarko took over a few decades back.
Going from memory, but pretty close.
Referring to the no longer existing mineral rights holder.
Got it. Thanks.
I mean, Delaware is nowhere near 11-13. DC&E for the operators that I’m personally familiar with is running around 6-7.
How long of lateral?
Do you have access to JIB’s and LOS’s or is this just field talk?
Stuff on costs is all over the map, and investor presentations are not too specific.
Nony is upset with me too for my post. Guess I struck a nerve. LOL.
The lower for longer folks (sub $50 WTI) didn’t see this coming. Admittedly I didn’t either, but I am good with it.
Shale can make money generally in a mid to high price environment. But it isn’t taking us back to $1 gasoline, which is too bad for those who pine for those prices so they can spend more money on rock concerts, clothing etc.
coffeeguyzz,
EOG Niobrara wells in Powder river cost $4.5 million, which is their larger acreage position in Niobrara.
http://investors.eogresources.com/Presentations-and-Events?item=68
Presentation March 27, 2018.
Dennis
I am impressed that you go to these guys for information. We all recognize that they put on their best face at these events.
Still, a wealth of relevant information is usually displayed.
I have never seen the Powder River Basin considered part of the Niobrara, but it may well be.
The Denver Julesburg formation is what seems to be considered Niobrara in both Colorado and southern Wyoming.
I’ll check what the EIA includes in their categorization.
That being said, the description from EOG’s presentation uses the term ‘target’ for $4.5 PRB and $4 for DJ wells (in millions). ‘Target’ strongly implies they ain’t there yet, but shooting for it. 9,000 footers in PRB and 8,000 footers in DJ are longer than the 5,000 footers that I was considering with the sub $3 million per, which I believe is still accurate.
The EOG presentation interestingly uses the CWC terminology, not D&C, which Complete Well Cost includes infrastructure as the footnote explains.
All in all, these guys are bringing costs down while initial production increases.
One of the big unknowns – and cause for debate/argument – is if and by how much ultimate recovery will increase.
We shall see.
What is it that you keep hoping to “see,” Coffee? Its already been a decade.
In spite of lower incremental D&C costs that put the service industry in the toilet, continued low interest rates, lower and lower imaginary breakeven prices, reverse splits and/ or more shareholder equity dilution, little to no debt reduction, outspending revenue, again, increased overall debt, longer laterals, more sand, more water, higher productivity, saturated core drilling (to the point of well interference and rising GOR), cute things like cube drilling and much higher oil prices thanks to OPEC and Russia’s help, 2017 was yet another lousy financial year for the US shale oil industry. Google it; start with the WSJ. The shale oil industry is so market stupid it is driving the cost of its product down, again, and can’t even sell its associated gas. LTO exports are approaching 2.8MM BOPD while the price of gasoline to the American consumer is now $3.00, 50 cents a gallon higher than a year ago.
What part of this “revolution” is actually working pretty well in your internet enlightened mind? At $60 gross, $32 net back…the public shale oil industry in America alone has to produce over 8,000,000,000 MORE BO, as much as it already HAS produced the past decade…just to get out of debt, just to get back to even. Think of the fresh water and associated gas it will have to waste to accomplish that. And the trees that will have to be cut down to print all that money!
So, what’s next? What does the shale industry have up its sleeve next? How much more time does it need? And by the way, I think its a hoot you are lecturing Shallow about the difference in D&C costs and LOEs. Good grief.
There is no physical, truthful way to drill and complete an 18,000 TMD, 3 string shale oil well, cram it full of 15,000,000 of sand, and 500,000 BW and get it all to market for less than $9.5M. No way. 85% of the information being spoon fed the America public about shale oil is dung heap.
I’m intrigued by this but out of my depth. Could you direct me to a comment or post of yours (or someone else’s) that gives a full summary your point of view on this? It sounds contrarian and important.
See Fractional Flow
https://fractionalflow.com/category/bakken/
Rune Likvern’s article is very interesting.
He has lease operating expense increasing over time which is likely to be much better representation of reality.
Michael, I have been an oil and gas producer for 40 years. I have interest in shale oil wells and know what they cost, how they perform. I work in the heart of the Texas shale industry. You must, however, no more take my word for shale economics than you would say, the CEO of EOG. You must make up your own mind. The first way to do that is to avoid anything the shale industry says about itself and dig out the data, do the math for yourself. Fractional Flow is a great site, Art Berman knows the truth, Steve does, and several others willing to think for themselves do. The BEST thing to do is look at filings made with the SEC and work backwards, towards reality.
Reality is that oil and gas extraction is a business and the business of shale oil extraction is NOT working. Its failing miserably, actually. It has all this debt, and can’t make a profit. Its like getting a free pizza parlor, with free help, and free ingredients, your bills all paid, except for a token interest payment, and you STILL can’t make a profit. That’s not making America great again; cheerleading for THAT is really screwed up.
Good luck with your research.
I will add, energynet.com has a wealth of data, actual joint interest bills and lease operating statements on individual shale wells.
Also, you actually get to see the check stubs, which show the deductions for RI, ORI, severance and extraction taxes, price discounts to WTI and the like.
The site is an auction site, you can actually bid and buy a piece of your own little shale wells if you like.
It’s pretty cool if you are dorky like me and like to look at stuff like that.
Where I got the idea that pulling the sub and installing rod pump was a pretty freaking costly thing. Those subs tend to get stuck in the curve. I’ve seen over half a million for such an endeavor, all told.
Also where you get to see how much everything else really costs, such as tubing leaks and rod jobs, hot oil treatments, down hole chemicals, water hauling etc.
They also have the production histories, which in great detail show how those 1000 BO IP’s fall off the cliff.
If you are lucky, you will get to see how much the well actually cost.
Will never forget seeing the bills the poor guy or gal got for having been cute and leasing a 40 acre tract in a CLR 1280 Woodford high density unit. Got dinged for 3.125% of over $140 million of CAPEX.
You will see stuff that will lead you to believe that non-ops in shale wells aren’t always so lucky, especially if IP was 2015-2017 when prices were low.
Edit: Just went over to that site, as always a wealth of direct information. In particular, small non-op WI in two of EOG’s wells in Parshall. Plenty of good exoense info on Van Hook 67-3606H and Liberty 33-1423H.
EOG JIB statements could use more detail. Lots of charges for MISC TANGIBLE EQUIP (NON-AFE).
Mike, what does that mean?
Would it have cost $330K to run the submersible down Van Hook 67-3606H? $93K to Schlumberger for the submersible itself?
Would be really cool if a company laid out all these costs in detail for one well,even if they cherry picked a problem free one.
Energynet is lovely; it allowed us to get out of some inherited oil & gas working interests (which had long since degenerated to stripper / tertiary recovery status) by auctioning them. We very carefully made sure the buyer assumed *all* associated liabilities of *any* sort, which I suspect didn’t turn out so well for the buyer. Sold at the market peak in 2008. Lost of published information from those auctions.
“Good luck with your research.”
Thanks, but I’m going to have to let others do that for me. I suffer from the lay person’s curse: interest, but no time, nor capability. On my own behalf, I’d say I’m more knowledgeable about oil than 99% of my (US) compatriots. I have the benefit of having studied geology in the 80s before becoming an English major (ugh). My greatest intellectual asset is that I don’t believe in magic. My greatest liability is that I don’t do numbers well, am ignorant of economics and can’t stimulate an appetite for it.
Mike, when I was planning horizontal wells I concluded the optimum well plan would delay the kick off as much as possible, make a turn which took the well sideways as it built hole angle…
This well would be drilled from a pad, so the wells looked like fork tines. We drilled two forks, all the tines lined up parallel. The pattern alignment had to match the field stress to have fractures perpendicular to the horizontal leg.
The idea was to lay wells in layers so that each pad would have 12 wells. The wellheads were on 25 foot spacing to allow the rig to get on a well while the offsets were protected by cages.
We planned artificial lift to go down to just above the cut off point. However, I researched but never ran a setup with a jet pump ran all the way to the top perforation. I think it would have failed due to gas lock.
Anyway, that’s all I know about that.
Thank you all for the comments.
Mike,
I actually guessed at the well cost by doing a discounted cash flow analysis using the recent well profile based on Enno Peter’s data at shale profile.
I then assumed lifting costs, G&A, interest, royalties and taxes were similar to other LTO plays for the Niobrara.
I used an annual discount rate of 10%, G&A of $2.75/b, interest+other cost of $3.65/b, lifting cost of $7/b, and transport cost of $8/b, at a wellhead price of $66.88/b the net present value of discounted future cash flow is zero when the well cost is $4.5 million. With the transport cost of $8/b that’s about $75/b at the refinery gate.
Currently WTI futures are at about $72.50/b and Louisiana Light is at about $77/b.
That’s how I guessed at Niobrara well cost, I only checked what producers are saying after Coffeguyzz asked the question, several different companies mention recent costs around $4.5 million for enhanced wells. I assume the recent increase in Niobrara well productivity is because more of the wells are “enhanced” with longer laterals, more frack stages per lateral foot, more sand per lateral foot, etc, in short they likely cost much more to drill and complete.
For Bakken, I used $8 million well cost, maximum ROI for oil price scenario used gives 81% ROI for wells drilled in Sept 2019 (annual IRR of 31%). For Permian, I used a well cost of $7.5 million (includes Wolfcamp and Delaware and most wells are in the Wolfcamp so far), maximum ROI is 76%(annual IRR of 26%) in Oct 2022 for the scenario presented. For Eagle Ford I used a well cost estimate of $6.5 million, maximum ROI is in Feb 2023 at 40%(annual IRR of 22%) for the scenario presented. For the Niobrara, the maximum ROI is 22% (annual IRR of 11%) in Sept 2020.
ROI is total real discounted net revenue at an annual discount rate of 7% divided by real well cost (prices and costs in 2017$).
Dennis, I don’t know why you do what you do, but you do it very well. Forget the sunk stuff, use all full cycle costs, including land and toilet paper in the porta potties (water going into the Permian is pushing $2.50 and coming out the same or more.) Those wells in the Delaware cost way more than you think.
Folks can claim $2M well costs if they leave enough stuff out, makes no difference to me. Take away one time tax charges and asset sales in 2017 and nobody made money in the shale oil biz.
Mike,
The analysis is far from perfect. The problem with including sunk costs is they vary quite a bit from operator to operator. Those that got in early may have very low land costs than those that jumped in late, it’s difficult to do a general analysis which accounts for that (or beyond my ability to do so).
Can you be specific?
For Permian, I have $9/b in expenses and $4/b transport cost (I assume pipeline constraints will be fixed in the future), royalties and taxes at 32% and $42,000 per year in downhole maintenance cost, well cost is $7.5 million all costs, prices, etc are in constant 2017$ and I use a real discount rate of 7% (equivalent to 10% nominal DR at 3% inflation).
It is not hard to re-do the analysis with more realistic numbers, just throw them out there and I can run it.
I am not going to do this 12 different ways, so if others want to throw out ideas, feel free.
No shale company will ever, I mean EVER provide payout statements.
Nony says they don’t because they don’t have to.
I say they don’t, because if they did, it wouldn’t be pretty.
Check book producers know the score. Shale is a Wall Street baby, and a good way for upper management to ring the register.
Hi shallow sand,
Where do you talk to Nony?
Can you remind me what numbers make sense? Would $13/b for G&A, interest, lifting costs, etc (added together) make sense, along with 32% for royalties and taxes, and $4/b transportation costs in Texas and maybe $8/b for transportation cost in North Dakota and the Rockies.
Niobrara well cost is $4.5 million, Eagle Ford $6.5 million, Permian $7.5 million, ND Bakken/TF $8 million.
Any suggested changes?
Edit:
I forgot that I include $3500/month or $42k per year for down hole maintenance in my economic analysis for each well.
Seeking Alpha. Goes by a different name, heck maybe not even the same person. No big deal.
I must admit I have not dug as deeply into costs as I did in 2015 and 2016.
From what I saw then, investor presentation numbers tend to be pretty sloppy, with some things left out.
Pulling the sub and running back in rod pump should be CAPEX. Is that part of coffee’s D & C costs? Good question.
Dennis, I think you have looked at 10K’s before and divided total CAPEX by number of wells. Doesn’t that typically come out much higher than numbers touted in investor presentations?
I called it “expenses”, should have said OPEX is $6/b, probably should be $13/b, would love to get input from oil pros.
Thanks shallow sand
Mike,
Wouldn’t it be less for the Eagle Ford play? Also Rune Likvern says 8.5 to 9 million for Bakken.
In any case, I assume you mean $9.5 million for Permian, Guym suggests $7.5 million for Eagle Ford, does that seem to low (he is an owner, but not a producer like you, so clearly you are likely to have better insight)?
My apologies I missed the fact that you gave me a well cost (I am guessing that referred to Permian). Using 9.5 million well cost and LOE=2.3*output+15000, where LOE is monthly LOE in 2017$ and output is barrels of oil per month. and the revised oil price scenario (shown in chart below and elsewhere in these comments), I get the following for the Permian basin.
I understand that this oil price scenario is very likely to be wrong. The point is to show how high prices need to be to make this basin profitable, and that the resource may be smaller than some seem to believe, even with high oil prices. USGS mean estimate for Wolfcamp(Midland basin only) and Spraberry undiscovered TRR is about 24 Gb, my guess is for Delaware Wolfcamp it might be another 5 Gb.
Mike,
You said:
There is no physical, truthful way to drill and complete an 18,000 TMD, 3 string shale oil well, cram it full of 15,000,000 of sand, and 500,000 BW and get it all to market for less than $9.5M. No way.
I assume you are taking about Permian Basin and possibly Bakken/TF.
How does $7.5M for Eagle Ford sound? I have read that average land cost is about 500k per well (IHS study in 2015).
https://www.eia.gov/analysis/studies/drilling/
Also for Powder river- Niobrara see slide 16 from
http://www.chk.com/Documents/investors/Suntrust%20CHK%20PRB%20Update%20-%20Final.pdf
Dennis
Do you have any actual production data of shale wells over a 5 year period?
Just a rough calculation if a well produces 500 b/d to start and using these decline rates
https://link.springer.com/article/10.1007/s11053-016-9323-2
Then in the first year that well would have produced an average of 325 barrels per day. the second year about 120 barrels per day. The third year about 70 barrels per day.
Even at $50 per barrel. That well would generate an income of $9.1 million over 3 years. Since shale companies were losing money when prices were under $60 then total costs must be higher than $9 million over that 3 years.
Hi Peter,
I use data from Enno Peter’s excellent site (link below).
http://shaleprofile.com/
Chart below shows average well profile from March 2017 (2016 data was used to fit a hyperbolic profile, then the first 9 months of 2017 data was used in place of the 2016 well profile as an approximation.) In the scenarios it was assumed the well profile would be unchanged from Jan 2017 to Dec 2018. After Dec 2018 it was assumed the average new well would gradually become less productive as producers need to move from fully drilled core areas (sweet spots) to less productive areas.
For the Bakken well I show the average March 2027 well (dashed line). The well profile gradually shifts down from the original solid Bakken line toward the dashed line below the Eagle Ford Well profile.
The model actually has 122 different well profiles between the Dec 2018 (same as the March 2017 well profile shown) and March 2027 well profiles. The same is true for each of the other 4 cases (Permian, Eagle Ford, Niobrara, and “other LTO”), I have only chosen one case as an illustration (and to keep the chart readable).
Estimated Ultimate Recovery (EUR) is 378 kb for Bakken, 377 kb for Permian, and 258 kb for Eagle Ford from Jan 2017 to Dec 2018, for the March 2027 Bakken well the EUR is 143 kb.
Ideally the well’s capital cost is paid for in 3 years, let’s say the well costs $8 million, remember there are also royalties and taxes (about 32% of wellhead revenue) that has to be paid and operating expenses (OPEX) of about $13/b. So of the $9.4 million in your example (assuming $50/b at the well head, which would be at least $55 at the refinery gate due to transport cost of $5/b minimum) so 68% of $9.4 million is $6.4 million, then we deduct $2.4 million in OPEX, leaving $4 million and we are 4 million short of profitability. A wellhead price of $82/b is needed to reach profitable levels (well gets paid out in 3 years).
Note that I have used your assumptions for well productivity, the month 2 (peak) output of the average Permian, Bakken and Eagle Ford March 2017well is about 622 b/d and cumulative 36 month output is 238 kb for the Bakken, 212 kb for the Permian, and 170 kb for the Eagle Ford. Your numbers give about 188 kb over 36 months.
So actual price needed for a 36 month payout will be slightly different than in my simplified calculation, note that well cost for Bakken is about 8.8 million, Permian about 7.8 million and Eagle Ford about 7 million, if you want to play with the numbers.
Also note that Mike Shellman uses the 36 month payout rule (though he probably does a DCF analysis), where shallow sand uses a 60 month payout rule (though he too probably does a DCF).
The difference is that the 36 month rule is equivalent to about a 15% discount rate in a discounted cash flow(DCF) analysis and a 60 month rule is equivalent to about an 11% discount rate.
In any case the 60 month cumulative is 280 kb for Bakken, 257 kb for Permian, and 197 kb for Eagle Ford, obviously the 60 month payout would require a lower wellhead price for profitability than the 36 month payout rule.
Well profiles in excel file at link below
https://drive.google.com/file/d/1v88XXWI6KaKaOPYI2OoxB-5EX3V8_9Fm/view?usp=sharing
Chart below can be enlarged by clicking on it.
Thanks Dennis
Saudi Arabia needs oil prices to be at around $90,
https://uk.reuters.com/article/us-saudi-arabia-imf/saudi-arabia-needs-oil-at-85-87-a-barrel-to-balance-budget-imf-official-idUKKBN1I30H7
I do not think they will try to destroy the shale industry again by producing more than demand required. That plan hit their finances very hard.
https://www.thenational.ae/business/economy/saudi-arabia-s-deficit-to-narrow-this-year-and-kingdom-to-maintain-stable-fiscal-position-says-moody-s-1.726618
I think oil prices will be high enough to allow shale companies to muddle through.
Peter,
I agree oil prices will probably be high, but the LTO resource may be smaller than the IEA and EIA are forecasting (especially the EIA’s AEO 2018 has LTO resources at 107 Gb produced from 2000-2050 in their reference scenario). The actual amount of LTO to be produced is more likely to be about half of what the EIA assumes, by 2025 this will become apparent.
The problem is the World is not prepared for the coming shortage of oil, when everyone realizes this, there may be another global financial crisis (maybe around 2030 or so).
Dennis
It is a pity global oil production did not peak in 2005 as some people thought. Back then there were “only” 900 million vehicles on the planet. When oil peaks in 2025 give or take a couple of years. There will be 1.8 billion vehicles which will need oil to move.
Yes there will be 50 million electric cars but many of the diesel and petrol trucks, vans and cars will go short. Governments and people will be desperate to get their share.
Poorer countries will not be able to help poor farmers transport their crops to market and processing plants. So I see a food price spike with riots in many African, Asian and Middle Eastern countries.
Peter,
It may indeed not be pretty. High oil prices will allocate the resource to it’s most efficient uses, if one believes standard economic theory where free markets (properly regulated for externalities) are allowed to operate.
In reality governments will interfere to “improve” the outcome, and in many cases will fail badly.
Posted in the last thread:
Ok, humbled again. Don’t think weeklies as of the end of March we’re really off. Pending lease initial for March was 674. Second month pending and production was actually 18k over EIA and my estimate of 4012. So, adding 3107 preliminary production plus 674 plus 362 (estimate from last month) plus 18 gives 4161 for my estimate of Texas for March production. Up 149k. Adding 149 to US total Feb, gives 10,413, or close to the 10,460 weekly Apr 4. 10k either way, and I count it as a ringer. Notice that that is pretty close to Dean’s. He looks to be about 50k over mine on corrected last month vintage. His may turn out to be more correct in about ten months. 50k would be nominal in this game. Ok, sorry we have not posted Dean’s yet. Dennis is better with charts, so we’ll ask him first
Dean’s estimate
Thanks Dennis.
We may see some weird bumps as the Permian is throttled somewhat until late 2019, but there should be corresponding upticks on the others. Mm. The more I look at it, it seems you already have. Eight seems about right for the high. Much more realistic than EIAs weird projections. EIA shows LTO going to 10 quickly in a high price scenario, dropping to Eight by 2050. Unreal. This one should raise some eyebrows.
Thanks Guym.
You have already put a caveat in there on eventual EUR. I know you expect a high oil price scenario. Cost of the well, I don’t think has much significance in this projection. What may have significance is more places to drill in a high price environment. Technical advances in EOR could affect the graph. But, I only see that making the tail a little higher for a little longer. Because of the constraints in the Permian, I expect that new uptick in the Eagle Ford will be a little higher within the next year, then shift back. But, it’s a graph, and a realistic one. What I thought of are unknowns, and how the hell can you graph unknowns? Your caveat covers it.
My model says oil price should be $68 per barrel.
Fernando,
$68 until 2030?
If so not much LTO will be profitable.
Dennis, the model says “run economics at $68 per barrel, escalate costs and oil price with inflation”. It’s not a prediction. It’s what the model says should be used fir economics. A large company should run that and use a pv10 to decide whether to proceed or not. If pv10 is positive, the project is good.
Maybe I’ll run one assuming oil price is $75 over the next three years, and then make it spit out what an investor should use as a price deck for investments in 2021?
Hi Fernando,
Thanks for your insights.
I always run my models in real dollars, and also use pv10 (assuming 3 % inflation so real discount rate s 7%).
My understanding of the real world economics of these decisions may be far less sophisticated than yours.
WTI Midland (Argus) vs. WTI Financial Futures Settlements
Updated chart, https://pbs.twimg.com/media/Ddyb4GPVAAAZqRN.jpg
Source, CME Group –> http://www.cmegroup.com/trading/energy/crude-oil/wts-argus-vs-wti-calendar-spread-swap-futures_quotes_settlements_futures.html
Hi Dennis, thanks for the interesting post. Is there a paper where the mathematics of your “Oil Shock” model is described?
Thanks, Dean
Hi Dean,
A book will be published later this year. For something short see
http://oilpeakclimate.blogspot.com/2015/02/the-oil-shock-model-with-dispersive.html
developed a bit further
http://peakoilbarrel.com/oil-shock-models-with-different-ultimately-recoverable-resources-of-crude-plus-condensate-3100-gb-to-3700-gb/
Note that these LTO models are simply convolution of well profile with number of wells added.
See
http://peakoilbarrel.com/oil-field-models-decline-rates-convolution/
Feel free to e-mail me.
Thanks!
Dean
Dennis
IEA which has done very well in predicting oil production growth believes that US tight oil production will grow until around 2023 and then peak.
https://www.iea.org/oil2018/
I think it is underplaying the problems that lie ahead, stating that massive investment is needed to meet demand after 2023.
Considering that the world consumed 30 billion barrels last year and found only 4, I cannot imagine any amount of investment replacing consumed reserves.
IEA is using mostly the insane projections of US shale as the EIA. They just realize that even with the unrealistic projections we will be short. They predict an oil price shock by around 2023. It’s happening sooner. OPEC predicts an eventual oil price shock, but they are also using the insane predictions for US shale. Note, in their recent statements the vow to cover Iran drop, only. Not Venezuela, Angola, or the rest of the world. I expect Iran drop to be minimal. EIA is the only one currently expecting a supply overage into 2019.
Hi Guym,
Chart below compare EIA AEO for tight oil (reference case) and STEO (assuming non LTO L48 onshore remains at the Aug 2017 to Feb 2018 average level from March 2018 to Dec 2019). STEO not much different from my scenario, and my scenario is quite a bit higher than the AEO 2018 reference case until 2027.
I cant find it again, so we will reference your graph. AEO (which is EIA) has tight oil increasing and only slightly declining from 8 million barrels until 2050. Is that realistic, at all? Do you see this chart on world oil supply and demand realistic?
https://www.eia.gov/petroleum/weekly/
or is this one slightly more realistic?
https://www.iea.org/oilmarketreport/reports/2018/0418/
Guym,
No the EIA’s AEO projection is not realistic as it requires twice as much LTO in the US as is likely to be recovered (110 Gb vs 55 Gb.) As to projected “liquids” demand, it is a very poor measure that includes “bottled gas”, I think only liquids at STP should be called “liquids”, most NGL should not be called liquids as they are gases at STP (propane, butane, ethane, C4 or lower).
Guym,
I agree the IEA supply demand balance looks better. Though again they include more than C+C in their chart it is a “liquids” chart that includes NGL, just as we don’t call LNG “liquids”, we shouldn’t call any liquid that needs pressure more than 1 ATM or temperatures below 20 C to become a liquid. Petroleum Gas maybe would be a better term for all NGL except C5.
Depends what you mean by oil price shock?
Global GDP for 2018 will be around $87 Trillion. Global expenditure on C&C at $80 per barrel is $2.4 Trillion. Which is only around 3% of GDP.
For £3 of every £100 we spend, we get our food grown and delivered to all the shops. All the other goods transported around the world, all the petrol and diesel used for private cars and all the 4 billion passengers flown around the world.
We need $100 oil to increase drilling and also to make electric cars more attractive.
and $100 will not break the economy.
Hi Peter,
There is a fair amount of proved reserves which have not started producing, probably 400 to 500 Gb. A Hubbert linearization (which often underestimates) suggests about 2400 Gb URR for conventional C+C (excluding LTO, and extra heavy oil), about 1330 Gb have been produced through the end of 2016, leaving at least 1070 Gb of 2P reserves at the end of 2017, roughly half of these reserves are already producing. I would estimate there will be another 400 Gb of combined reserve growth (revisions of previous estimates over time) plus new discoveries in the future (50% probability it will be higher or lower than this). In addition there is extra heavy oil (500 Gb) and LTO (80 Gb for the World).
I expect conventional oil has probably already peaked or will very soon (before 2020), all C+C (including LTO and extra heavy oil) is likely to peak between 2023 and 2027, with 2025 being my central estimate, at a peak output of 83-86 Mb/d (C+C only).
Dennis
I agree that global oil production will level out around those dates. It will be very interesting to see how high oil prices go and how countries adapt.
very interesting times
Oil Shock model
If the projections of production in this chart end up being close, I see two big take-home messages.
First, the world production capability will still be close to what it is today for almost 20 more years.
Secondly, by the time we get to 20 yrs out there is going to be a lot more CO2 in the atmosphere. Almost everyone will get it by then. Thirty years too late.
Hickory
That is just oil, China uses as much coal, oil and gas as the entire world did in 1960. China with a fifth of the world population burns half the world’s coal.
https://ourworldindata.org/fossil-fuels
Indeed Peter. I wonder what the graph for global coal consumption will look like.
Hickory,
Depends on how fast wind, solar, and nuclear ramp up. Below is a “medium scenario” with about 1000 Gt (billion metric tonnes) of Coal consumed.
Some estimates (David Rutledge) suggest there may only be 700 Gt extracted.
See also
http://peakoilbarrel.com/coal-shock-model/
and
http://rutledge.caltech.edu/
Thanks Dennis.
Eyeballing this graph, it looks like we have only burned something like 40% of the total projected thus far.
As of 2014, the estimated CO2 emission sources are- “Fossil fuel emissions (including cement production) accounted for about 91% of total CO2 emissions from human sources in 2014. This portion of emissions originates from coal (42%), oil (33%), gas (19%), cement (6%) and gas flaring (1%).”
Dennis, I wonder if you could take Venezuela out of your figures, and do a separate estimate, later this year. I’m mentoring a friend who’s doing an MBA and working out production recovery strategies to follow if the communists lose power and a rational regime is put in place.
If you read the guidance I gave him on items to look out for regarding risk perceptions by potential investors your hair would stand on end. Right now I don’t see Venezuela producing 2 mmbopd within five years.
Fernando,
If you can shoot me an email at [email protected] with Venezualan oil output projections, I can back it out.
Here’s my extra heavy projection for Orinoco, probably very different from yours (which I expect would be more accurate).
following assumes things get better in Venezuela by 2030.
Let me ask some friends what they think so we can provide you a better product.
Estimating future supply, using current reserves, is the most dumb thing peak oiler can do.
ktos,
Not sure who you are addressing. My model uses USGS estimates of technically recoverable resources and estimates economically recoverable resources based on current and assumed future costs and prices.
Clearly any assumptions about the future could be incorrect, that’s why projections of the future are always wrong, one possibility out of an infinite number of possibilities is chosen.
The odds are very long that any projection of the future will be correct.
Chart below is an old Bakken projection from Oct 2012.
When i look at the permian basin using google maps it seem to me that nearly the whole patch is already drilled. Ok im not that fit in it, but it is obvious that there is a very large area in west texas/ east new mexico that is covered by a big web of roads and wells.
You have an even more amazing number of wells if you look at Texas RRC GIS map under Online Research Queries. But, there is an amazing number of fields (I read 35 in one article) within the Permian. Layered from a rough estimate of less than a few thousand feet to well over 10k feet. Most of those wells on the GIS map with one dot, are vertical wells. For over fifty years, the Permian has been drilled with verticals, gathering up most of the shallower areas. Some verticals have been deeper into the areas they are now drilling on with horizontals. From that explanation, it even gets more complicated. In short, there is more area to drill in under them. Questions are now arising as to the spacing of the horizontals, although that hasn’t been worked out, yet. Far more complex than I can explain.
Guy/KJ
The December 2017 Investor relations piece from QEP has a pretty decent explanation – with graphics – of the multiple formations and their density approach in the Midland Basin.
One thing they describe that is new to me is a so called “Pressure Wall” whereby they use the elevated formation pressure from the frac to enhance output and move laterally several hundred feet to continue working on other wells on the pad.
It looks exceptionally challenging to juggle all the operational aspects, but they seem satisfied with the results.
QEP has an outstanding reputation from their efforts in the Bakken.
(FWIW, they claim sub $6.5 million to D&C with $.8 million more for AL and related facilities).
QEP Resources Pretax Income (2018 Q1)
-67.5M
QEP Resources Profit/ Loss (Net Income)
-53.6M
A shale player.
The nightmare situation would be a stock market crash or recession leading low prices. If prices are kept low because of economic troubles we could see much lower prices than anticipated. Low prices of oil combined with an economic downturn following the past four years of low prices could hit production hard.
Problems with oil supply -> economic problems -> problems with oil supply.
The ideal situation is a price shock. This buys us time before peak oil and gives us an additional incentive to transition to renewable energy sources.
Interesting to see the whole production projection. Looks like we are what, about 20% into the production potential at this point?
I suppose this analysis assumes that there is unlimited funds chasing the oil?
I’m very surprised that there aren’t some other areas of the world that can’t replicate these methods in their shale beds. Perhaps there will be money going after the Russian or Argentinian shales in the next decade.
Hickory the analysis makes some economic assumptions which should perhaps be revised. I expect oil prices will rise as supply becomes short and make a lot of the LTO plays profitable.
Note that revisions to the original model have been made based on suggestions from Mike Shellman (well costs were too low, they should be $9.5 million) and Guym (help on Eagle Ford well cost), I also revised my model for LOE based on work done by Rune Likvern on the Bakken. See comment linked below.
http://peakoilbarrel.com/us-light-tight-oil-lto-update/#comment-640454
Rune Likvern’s post at link below from his FRACTIONAL FLOW blog.
https://fractionalflow.com/2017/10/08/a-little-on-the-profitability-of-the-bakkennd/
Argentina has two problems: they are coming out of one of those populist/socialist periods so common in Latin America. This means the oil industry doesn’t fire on all cylinders. And 2. The rocks may not be as good as people think. Russia has a similar problem, lousy government plus rocks plus the terrain can be hard to work on.
Here is the NEB forecast for Canadian tight oil production if anyone missed it in January
(The chart includes both light and heavy oil but no oil-sands production)
https://www.neb-one.gc.ca/nrg/ntgrtd/ftr/2017cnvntnll/index-eng.html
Thanks Energy News.
Using data from the link you posted (figure 2.2 data). For all of Canada we have the following projection for light tight oil (LTO) and shale oil.
Hello Dennis Coyne
How are you?
Why is it so different your peak year and production with respect to Laherrere?
For example laherrere US tight oil peak is 2019 and 5Mb/d peak production
https://aspofrance.files.wordpress.com/2018/03/lahall19march.pdf
Thanks
Cecilia
He uses some pretty low EUR numbers. For instance, he only has .5 gb left in the Eagle Ford. I have assets there, and follow it fairly closely. I do not see that number as realistic, at all.
Guym,
What do you think of the 8 Gb URR estimate for the Eagle Ford?
Not clear on the remaining URR. You mean 8 remaining?
URR is total C+C output including cumulative production to date. About 2.6 Gb have been produced from 2000-Feb 2018, an 8.2 Gb URR leaves about 5.6 Gb to be produced from March 2018 until 2046 or so. Though my model has the last well drilled in the Eagle Ford in Dec 2029, output is down to zero by Feb 2046.
Nothing out of bounds in that assumption that is obvious. His .5 is obviously out of bounds.
Thanks. Local knowledge gives a great deal of insight.
Hi Cecilia,
I don’t think Hubbert Linearization works very well early in the development of a resource. The annual production divided by cumulative production needs to reach less than 5% in order for the estimate to be reliable. For all US LTO aP/CP% in 2017 was about 16%, Laherrere charts monthly production divided by cumulative production, for that kind of chart of mP/CP% (vertical axis), the value would need to be under 1% for a reliable Hubbert Linearization estimate.
My estimates are based on USGS mean estimates of 10 Gb for North Dakota Bakken, 25 Gb for Wolfcamp part of the Permian Basin, 4 Gb for the Spraberry play, and 8 Gb for Eagle Ford based on David Hughes estimate in Drilling Deeper. Together these total 47 Gb and I have added an estimate for Niobrara (2 Gb), Delaware (part of Permian basin)[5 Gb] and the rest of US LTO[3 Gb]. That brings the total to 57 Gb of technical resources and this is reduced a bit due to the economic assumptions I have made.
I agree with Laherrere that the EIA estimates are too high, but I also believe that Laherrere’s US LTO estimate is too low by at least a factor of 2, my F5 estimate (40 Gb) is roughly double the estimate by Laherrere (20 Gb). F5 estimate means there is about a 5% probability that the URR will be lower than 40 Gb.
Brent price is shooting up, API stock numbers must be down, or has something else happened (Shell force majeure in Nigeria, didn’t do much, at least yesterday).
THE SHALE OIL PONZI SCHEME EXPLAINED:
I am quite surprised how bank analysts and brokerage firms can continue to fund shale oil and gas companies or advise clients to purchase stock when the industry is behaving just like the Bernie Madoff Ponzi Scheme. The only big difference is that the U.S. Shale Industry is a Ponzi at least four times greater than Madoff’s $65 billion fiasco.
https://www.youtube.com/watch?v=E_He0650klE&t
In the new shale business model profit is no longer necessary.
The next loan seems to be the model.
“Time and again, despite the collapsed prices of oil and gas, the players in the shale revolution have gotten more funding from Wall Street, whose ZIRP-blinded clients kept gobbling up the newly issued junk bonds, leveraged loans, and shares, taking on huge risks and hoping to make a little extra money in a Fed-laid minefield where all decent assets are way overpriced.”
Hightrekker,
Very true. The next loan is the business model.
However, as Mike has stated, the real oil men in the past would never consider screwing over someone to produce oil. Why, because the real oil drillers mostly dealt with the investor, face to face.
Today, the investor is some POOR SLOB off in the distant that no one cares about because they are hidden from view. Thus, the only way Shale Oil can be made possible is by defrauding FACELESS INVESTORS.
This is the way of the world today as it pertains to investing.. F*CK those who don’t know any better or those who we don’t get to see.
Another excellent example of this is shown in the documentary, THE CHINA HUSTLE: https://www.thechinahustlefilm.com/
GOD HATH A SENSE OF HUMOR…
Steve
…real oil men in the past would never consider screwing over someone to produce oil … – is that satire or just nonsense? Rockefeller, Getty, BP/CIA in Iran, anybody involved in early South American oil, the list is endless. They’d fuck over anybody they could find for a cheap barrel. Or is the suggestion that “real” men didn’t do it only because they couldn’t get away with it – not much manly about that I’d suggest?
I found that comment kind of funny myself.
In US there were onshore oil scams all the way back to prior to WW1. Similar to the many land hustles that occurred. Think promotions for land in West Texas which depicted the area as “the Garden of Eden.”
In the old days, it was accomplished by making up a slick presentation and selling investors non operated working interests. I think part of the reason Dad Joiner sold the Daisy Bradford well (E Texas discovery well) was because he had sold more WI than truly existed and was in deep do do.
Really, shale only differs in that it is generally not non operated WI that are sold, but shares of stock or bonds.
Shale is real, there is no doubt. Shale can make money at high oil prices, no doubt.
My objections have always been exaggerations that do not match SEC filings and lack of spacing rules.
EOG touting some type of “super economics” they employed in 2016 to be profitable at $30 WTI, when the SEC filings showed contrary is one example of the former.
Well bashing in OK and TX is an example of the later. Hopefully the conventional well operators are being adequately compensated for all of their wells that are ruined by these ultra high pressure and volume fracks.
Read LGCY’s most recent investor CC transcript, it appears based off that that the well interference is real. LGCY operates a lot of conventional wells in PB. Also drills unconventional. It’s not all perfect in the Permian Basin for sure.
Mr. Kaplan, there have indeed been some bad characters in oil history; I assume you chose BP because it had a blowout in the GOM? That’s not the first time in history that’s happened. It “manned” up to that, capped the well, and paid over $80B in restitution. As a student of Mexican, and South American oil history, including Venezuelan, I otherwise have no idea what you mean. Great American oil finders essentially found and taught the world how to produce its hydrocarbons, then for the most part got “fucked” themselves when countries nationalized and they got the boot. The is a much longer, endless list of honorable men, men who ran good companies, who raised money to drill wells the old fashion way, with hat in hand, maps spread out on conference tables; who looked a man in the eye and told the truth, laid out the risk, the arithmetic, then did what they said they would do. They personally guaranteed loans and lived or died by paying them back, no matter what. They provided jobs, delivered the goods, paid people when they needed to be paid, and returned profits to millions of happy investors. The world is a much better place for these men.
The shale phenomena, and the men that run it, are indeed different. Mr. Srocco is correct about that. There is a clear and obvious disconnect now between reality and available capital. Everybody lies about everything. There are no consequences, no reputation, no honor to lose. CEO’s of public companies pay themselves millions of dollars in salary while their shareholders are losing money hand over fist. They bail on billions of debt and simply start over. They retire and get the hell out before shit hits the fan. The lenders that loan them the money have nothing to lose either; their money comes from Central Banks…the entire system exists using OPM, Monopoly money. In my 50 years of making a living finding and producing oil and natural gas I have never witnessed anything quite like this. The shale oil industry is a decade old and still failing financially. There is something really wrong with that. That is how I took Steve’s comment and it is correct.
I better clarify before I am misconstrued.
There have been scams in the upstream oil business for decades, but that doesn’t mean all operators have been by any stretch and in fact, most have not. Same in real estate, as well as many other businesses.
Those bad actors cause problems for the rest. We get bad mouthed behind our backs. I will say, however, the last boom 2005-2014 didn’t see many “deals” in our field. Almost all wells drilled were by small business owners using their own money.
In the early 1980s a lot of people looking to make a quick buck got into promoting wells. There were issues.
Those deals are nothing compared to shale, which has such large numbers all the way around.
I understand the boldness of the claims made in 2015-16, as the companies were scared to death they were toast. It was a big shock to us too, dropping from $100 to $25. I think that came through loud and clear in some of my posts at that time. It will again if the price tanks again.
Hey shallow sand,
Are you seeing rising costs in your area with the increased oil price? Hope everything is going better for you these days with the higher oil prices.
Hey, using Rune Likvern’s post as a guide. I redid LOE so that it rises in a similar fashion to Rune’s work on the Bakken. For the average 2017 Bakken well I use LOE=barrels produced per month times 2.3 plus 15,000 to get LOE in $/b. So it is a variable plus fixed cost and looks like the chart below. The chart stops at month 36, but by month 60 LOE=$13.23/bo and at month 217 (10 b/d), LOE is up to $49.18/b.
Let me know if this looks reasonable to a man who actually produces oil.
I have worked with a model which tracks oil, water, gas, wellhead pressure and well density. This is usually done with a reservoir model or with a spreadsheet which projects trends.
The work is justified when looking at a field development, considering how to space wells, design the well and field decline rates, and optimizing economics. It’s also useful when looking at property values.
A few years ago I consulted for a small Canadian company buying an overseas property. The company team asked to be given $50 million authority, but a Vicepresident suggested I get called in to double check things. By the time I was finished with them the valuation had dropped to $10 million. Most of this was attributable to a smarter way to project OPEX.
Fernando,
Was that the fixed plus variable OPEX
you have suggested in the past?
OPEX =a*p+b,
where a and b are constants and p is output produced in period t.
Dennis, that’s right. The actual fixed and variable costs can be customized by the user. For example, say you are looking at buying a medium size company…the head office costs can be considered fixed, or you can assume you’ll be reducing costs and staff over a period of say five years.
Variables costs can be tracked if you have decent data. And there are options to have step changes in variable costs. For example one can lay a multiphase flowline to a central plant to avoid having to operate and maintain a satellite station.
Getty, Enron, Penn Square Bank, boiler rooms selling 1.5 million investments in a 300k well, why would anyone distrust the oil business? Even now, they have news articles about that fabulous new company that can turn a sows ear into gold. P T Barnum had it nailed. Yeah, most of the people in the business ARE normal. It’s the small percentage that create havoc.
Nope, I chose BP because they got the CIA to initiate a coup against a democratically electing politician and installed the Shah as dictator.
Yea, the Brits couldn’t do it, so they got the CIA,
1953– we will getting blowback on that one until the Mideast is no longer a problem (and oil is no longer part of our much smaller population, being the optimist that I am)
“My grandfather rode a camel, my father rode a camel, I drive a Mercedes, my son drives a Land Rover, his son will drive a Land Rover, but his son will ride a camel”,
p.s. Mexico isn’t in South America, it’s part of NAFTA after all.
p.p.s. This idea that people spending their own money have some kind of extra charitable slant to their ambition compared to others and are somehow more honourable for it is ridiculous.
I am from Texas; I know where Mexico is.
Spending one’s own money and/or feeling responsible to those that have loaned you money, or invested THEIR own money in your ideas and your reputation for telling the truth, to build and manage a business does indeed strengthen one’s “ambitions” to succeed. It is indeed far more honorable than destroying shareholder equity while a CEO makes $15M in compensation the same year, terminating employees right and left because of poor planning, not paying vendors for 120 days at a time or bankrupting out on billions of debt. And its way more honorable than being on your knees, lying about your business performance, begging to defer debt, or asking to borrow more money to hang on another year.
Not all men and women in the oil and natural business are how you wish to paint them. But if you must, you are definitely on the right blog.
Mike,
There are good and bad people in every business, including the oil business.
It seems to me that one place the criticisms align is that both you and others are criticizing large oil companies. George’s comment was directed at BP for the assassination of a democratically elected leader in Iran. Yours are pointed at the large and mid-sized LTO producers.
In both cases the oil industry is being criticized, yours tend to be pretty scathing.
Your own blog also criticizes LTO producers regularly.
I think smaller (I am assuming your income and shallow sand’s is not $15 million per year) oil producers like you provide a great service to this nation.
Eventually (maybe 2050 or perhaps sooner) we will need to substantially reduce our petroleum consumption.
That’s just reality.
Dennis.
Not everything the large companies do is evil either.
I see first hand everyday the good works of a large refiner, from providing hundreds of high paying jobs with very good health insurance and other benefits, to the large charitable donations made by the refiner to the local community.
I am sure something similar is happening in the US shale basins.
I have seen what a refinery closure has done to a local community firsthand. Decimated it, still trying to recover 25 years later.
I have also seen firsthand what has happened to coal miners who have been laid off. $100K plus benefits to $15/hr with scant benefits will shock a family in negative ways.
OTOH, I am very mindful of the discussion that we need to lower FF emissions.
I also see the tech giants who say most laborers will not be needed, so governments will just need to pay them. I see those same tech giants now getting called to the carpet for some serious issues with the services and products they sell, and those tech giants getting pretty freaking defensive about it.
These are complex issues, but the radicals on each side paint them as black and white. Just like the US politics of the extreme that I dislike.
I have a tough time weighing the facts and reaching definitive conclusions on these issues. They aren’t simple.
Yes, Dennis, my criticism of the shale oil industry in particular can be pretty “scathing.” I feel like I have earned the right to be critical of a faction of my own industry that is getting what amounts to a “free ride” on finding costs and still can’t deliver on its promises. It is not telling the truth, misleading America about our hydrocarbon future, and, clearly, by your own work regarding well costs (which are still too low) and IRR, will NEVER likely be able to pay its debt back. Why wouldn’t any American, or for that matter anybody in the world, not be a little pissed off about all that deceit, and concerned? Why aren’t you? How on earth can your models for shale oil recovery come to fruition with the IRR’s you have predicted…at $140 oil prices?
I am able to sort out the difference between bad oil folks and say, bad college professors, or bad plumbers, thank you. I am proud of my industry as a whole and anybody that pays attention to my comments can see that. I am also pretty keen on reality, thank you. If I did not believe we were headed for hydrocarbon woes in our future, and in need of conservation, and alternative developments, I would not be outspoken against the shale oil abundance crap.
Shallow sand,
I agree not all large companies are bad, just like people there are good and bad and in between and sometimes “good” companies do bad things occasionally, likewise “bad” companies sometimes do good things.
Nothing is black or white, just different shades of gray in the real world.
Mike,
I made a mistake on my IRR calculation where I was using discounted cash flows in the calculation, these were “real rates of return” as I use constant 2017 dollars in my calculations (costs and prices are adjusted for inflation), if we assume a long run rate of inflation of 2.5%, then 2.5% would need to be added to annual IRR (if you think in terms of nominal rather than “real” rates of return).
For the Bakken, the annual real IRR for a Jan 2019 well is 37% for the oil price scenario below. For the same oil price scenario and calculating total discounted real net revenue above the capital cost of the well (full cycle including land) for ND Bakken/TF, Permian, and Eagle Ford from 2018 to 2060, the total is $406 billion in discounted net revenue in 2017$ using a “real” discount rate of 7% (equivalent to a 10% nominal discount rate assuming 3% annual inflation rate.)
What’s the total debt outstanding of the LTO industry? According to Jan 2018 article below, it’s $265 billion.
https://www.forbes.com/sites/daneberhart/2018/01/26/challenges-of-funding-shale-boom-2-0/#4b2248cf49b5
So 406-265=$141 billion left over. 🙂
Click on chart if it’s too small.
Mike,
I responded in wrong place below.
http://peakoilbarrel.com/us-light-tight-oil-lto-update/#comment-640301
Also wanted to add that along with higher well costs (from comment linked above) I adjusts LOE similar to figure 11 in Rune Likvern’s post at FRACTIONAL FLOW, linked below
https://fractionalflow.com/2017/10/08/a-little-on-the-profitability-of-the-bakkennd/
see figure at comment linked below
http://peakoilbarrel.com/us-light-tight-oil-lto-update/#comment-640175
I assumed LOE would be similar in other LTO plays which is probably not quite right, but the best I can do.
On the shale oil abundance, I think a sober post showing that even with oil prices at $140 or $150/b that the shale oil resource is likely to be less than half of what is predicted by the EIA in the AEO 2018 reference case (114 Gb URR for US LTO, if we assume LTO output drops from 8Mb/d in 2050 to zero in 2055).
Note that the scenario only reaches $140/b after EUR has decreased from 300 kb to 200 kb. The maximum ROI is about 65% (discounted net revenue over the life of the well divided by capital outlay) at a 7% real annual discount rate. Note that the average 2016 Permian well pays out in 36 months at a well head price of $82/b for $13.40/b LOE and 32% royalties and taxes. At that price ROI is 37% (discounted net revenue of 12.3 million divided by $9 million well cost).
A 65% ROI is about equivalent to a 24 month payout.
It occurs to me that I may not be using the term return on investment correctly as I am taking discounted net revenue and dividing by well cost, that turns out to be incorrect. When I use net revenue divided by well cost I get 82% ROI and this will have an annual IRR of 22.6%. Sorry for the confusion.
Note that I do everything in terms of discounted cash flows because I add wells until the NPV of the discounted cash flow falls to zero for the last well added.
For the Permian scenario the wells have an IRR of 35% from 2021 to 2023. The IRR drops to 22% in 2028, note that these are “real” rates of return in constant dollars, so nominal IRR would be 3% higher.
I would note that the 60 month payout rule used by shallow sand, results in an IRR of 12.3% and ROI of 50% over the life of the well.
Also the ROI (now done correctly) over the life of the well is over 82% from Feb 2017 to Sept 2026 for Permian basin wells in my scenario using the oil price scenario in the comment above.
Mossaddegh wasn’t assassinated, but real men of SAVAK made up the numbers with plenty of others, and the people of Iran were certainly royally fucked over.
Wow, have you got a chip on your shoulder. I don’t wish to paint the people of the oil industry as any different from anyone else, that seems to be your position. You seem to have set yourself up as some kind of arbiter of ethics, with yourself as the paragon we should all strive towards.
To set the record straight, I never said, “real oil men would never think of screwing over someone to produce oil,” to anyone.
“Rockefeller, Getty, BP/CIA in Iran, ‘anybody’ involved in early South American oil, the list is endless. They’d fuck over anybody they could find for a cheap barrel,” which I believed was actually very “belittling,” and I responded by suggesting, respectfully, I might add, that such a broad sweeping statement is not true.
I am the CEO of a private corporation with employees, social responsibilities and obligations to many. Individual men create corporations and occasional those corporations will reflect the values of those individuals. My criticism of the shale oil business model and the people that implement that is just that; criticism. I have interest in shale oil wells, however; I am not outside looking in. I don’t consider that criticism and occasional effort to bring facts about shale oil economics to the table here at POB ‘self serving,’ quite the contrary.
Mike,
I agree you have earned the right to criticize other oil producers, and I clearly have not, and know a small fraction of what you do about the oil industry and close to nothing about how oil is produced in the real World.
George Kaplan seems to know a fair amount especially about deep water oil production (again far more than me).
I am glad that both of you share your knowledge with us.
I think there is a fair amount of middle ground between the opposite sweeping statements that all conventional oil producers are nice people (like Mike Shellman) and all oil producers are bad people.
I would note that neither of you have actually taken either of these extreme positions, though were you to have a beer together I imagine you would find there is much more that you agree on than disagree on. Though I think George would prefer a bar or pub with cricket or football (aka soccer), rather than baseball or football (aka American Football).
George,
Thanks for the correction on Iran, I didn’t read your comment very well, you said CIA and coup, not assassination, I agree installing an Iranian dictator was a bad idea.
Dennis, it’s more accurate to build inflation into your spreadsheet. This is important if you want to capture depreciation and the impact of devaluation in overseas properties properly.
To visualize how this works, assume you invest $100 million in country X, where inflation is 30% per year. You are forced to carry your books in local currency. The exchange rate varies inversely to the difference between local inflation and dollar inflation. Dollar inflation is 3%.
If you run economics your way you’ll overstate your ability to depreciate assets because in local currency the investment will be shrinking very fast over time. See?
Fernando,
I only use the economics for US LTO, for the World I simply assume supply will attempt to adjust to satisfy demand, essentially economics are ignored.
I expect supply will not meet demand over the next 25 years or so at an oil price of $68/b. Most US LTO needs about $80/b to be profitable and this will rise as the core areas of LTO plays are fully drilled (my guess is this occurs by Jan 2019).
So the simple assumption is that oil prices increase so that some demand is destroyed so that supply is in balance with demand, I would humbly suggest that $68 or even $75/b will not be a high enough oil price to match World C+C supply with World C+C demand.
Perhaps in the short term (until the end of 2018) $80-85/b might be high enough. Longer term (through 2022) $100-$120/b will be needed.
Trying to get the inflation rates correct for every oil producer in the World, would be a daunting task.
My models are not hat sophisticated at the World level it would require a bottom up analysis for every oil producing nation.
I will leave that to the EIA, IEA, and OPEC.
George.
I too am surprised that you would see no difference between a business owner having compensation which is dependent upon the success, or lack thereof, of his business, and upper management of a large corporation, that makes more and more money each year, regardless of the company’s success.
I live in an area where there are several small business owners in the oil and gas industry.
I will give you one example. A friend who produces about 20 BOPD. He worked for a larger company first, saved some money, borrowed the rest, bought a small amount of production, operated it after work for years, and paid it off.
He then bought more, quit his job, as he needed to devote full time to the increased number of wells, and went into business for himself.
He was able to payoff the debt on all his leases. He works seven days a week. His wife helps him. They are out there every day, 365, no matter whether it is 0 F or 100 F.
When prices were high, he did have one part time helper so he and his wife could take weekends off. The helper was a retired man, looking for some additional work. Right before prices crashed in 2014, the helper had to retire from that due to health reasons. Before they could find someone else prices crashed. From mid 2014 to early 2017, neither had one day off. Worked every single day.
We finally convinced them to let us pump their wells for four days, so they could take a break.
When prices were high, this family donated a lot of money to charities in our community. We are about the only people that know this, they did it without fanfare. We know this because one of us is on the board of one of those charities.
When prices were high, this family was making really good income. In 2016 they almost worked for free for the entire year.
They have two really smart kids that are both in college. The oil income pays for that too.
This story is very common in many small oil producing communities in the United States.
Small business is the backbone of the US in my opinion.
Hopefully this also sheds some light on why people owning these businesses do not care for the anti-fossil fuel groups.
It should also shed some light on why people owning these businesses are not fans of shale.
Now, maybe go look at the Oklahoma Energy Producers Alliance website. Look at the videos of stripper wells that have been bashed. Read about the severance tax discussion and how the small oil producers are fighting for more tax money to fund their public schools, with the big shale companies fighting against more money for OK public schools.
Mike,
I have adjusted well costs to 8.8 million for the ND Bakken, 7.8 million for the Permian Basin, and 7 million for the Eagle Ford, and am leaving Niobrara at $4.5 million. I don’t really have much data for well costs for Niobrara, but IHS did a study for US well costs in 2015 and projected costs out to 2018, I have bumped their estimate up by 0.5 million and have included land cost in the estimate.
See
https://www.eia.gov/analysis/studies/drilling/
If these are still too low, could you give me the correct average well costs.
You seem to know, but like to keep it a secret perhaps. 🙂
SS -I didn’t say such a thing, and your response seems more based on the misconstrued reply and not what I wrote. Also a sample of one, from an anecdote, has no statistical significance, however nice it is. People are self employed not primarily from a wish to be charitable. There are good and bad in all walks of life, but most are some mix in between, and not always the same mix in all circumstances (although it’s been suggested sociopaths are about 10 times more common among major company CEOs, whether public or private). Suggesting all self employed are somehow better is belittling to all the others, and tends to feel a little self-aggrandising if coming from the self employed.
Public corporations are required not to be charitable – they are required, actually by specific laws in some places, to maximise shareholder value above all else, otherwise the CEO is replaced. Within that they have to be regulated, snd they will always work up to the regulations as far as possible, it’s never been any different. Shale companies work to current regulations, if they are screwing the system then the regulations or their enforcement are to blame – that’s capitalism as it currently works.
I see now that Mike thinks well cost is $9.5 million, he didn’t specify where, but I assume he means Permian basin.
I will increase my estimated well cost to $7.5 million for Eagle Ford, $9 million for Bakken, and $9.5 million for Permian, these estimates include land cost as well as drill and complete and plugging the well at end of production I will leave my estimate for Niobrara at $4.5 million. The Permian ERR decreased from 28 Gb to 26 Gb with the higher well cost, mostly this affects the tail which is thinner.
Overall for US LTO the higher well cost results in maybe 3 to 4 Gb lower ERR, assuming the same oil price scenario, so perhaps about 48 to 50 Gb URR for US LTO, if oil prices are high (as in my oil price scenario). Lower oil prices would reduce the ERR.
Updated scenario,
uses LOE = 2.3 times monthly output+15,000 for monthly LOE in 2017$, royalties and taxes are 32% of well head revenue and transport cost is $10/b for Bakken, $3/b for Eagle Ford, and $4/b for Permian Basin.
Well costs include land and abandonment and are $9.5 million for Permian basin, $9.5 million for Bakken, and $7.5 million for Eagle Ford. Niobrara and US “other” LTO scenarios are unchanged from original post.
Peak output is about the same (about 8150 kb/d in June 2022), the higher well costs result in faster decline and Lower URR through 2050 (50 Gb vs 54 Gb).
https://www.ft.com/content/60412154-5da1-11e8-9334-2218e7146b04
India is clearing its vision, first. They will be affected greatly.
2018-05-22 (Argus Media) Venezuelan state-owned PdV is preparing to resume oil supply to Curacao’s fuel distributor Curoil as early as today in the first sign of a breakthrough in a protracted debt-related dispute with US independent ConocoPhillips.
The court ruling effectively cleared PdV to resume crude shipments to Curacao, without the risk of court-ordered seizure.
The arrangement takes operational pressure off of PdV, even though the Venezuelan company will be forced to give up revenue, and risks other creditors following in the lead of ConocoPhillips. PdV officials told Argus that a prolonged dispute would have eventually led the firm to shut in production because of limited storage in Venezuela.
In their rulings last week, the Dutch Caribbean courts ordered that revenue generated by PdV’s local oil sales will go into escrow accounts.
https://www2.argusmedia.com/en/news/1684952-pdv-to-restore-oil-exports-pay-conocophillips-debt
Imagine other creditors have followed the success by Conoco.
There are hundreds of creditors owed billions by pdvsa. But the debts arise for different reasons. Conoco lost oil properties stolen by the regime, so their case is stronger. Back in 2006 Total also lost a property but they made very quiet threats out of court and pdvsa very quietly paid them with oil. So there are different approaches and results.
I have suggested the better option for Venezuela is to have the opposition name a government in exile, have it recognized by the USA, Canada and the Lima Group, so it takes over all government and pdvsa assets overseas. It can then issue a decree explaining that all debt incurred by the Maduro regime as of now will not be recognized, that all asset sales such as gold and oil will be considered looting of national patrimony, and that prior debt will be subject to renegotiation with a suitable hair cut.
I assume that some countries, like Cuba and Bolivia, would side with the current regime in this kind of standoff. Who else? China?
Yep, the usual bad guys will side with the communist dictatorship. Cuba, Nicaragua, and Bolivia have dictatorships or are cementing red autocracies. Ecuador appears to be distancing itself, Russia, China, Belarus, Iran and China are recognizing Maduro.
But the key seems to be the formation of a government in exile which would be recognized by the USA, most EU nations, and the Lima Group. That would give Trump the ability to give this exile government control of Citgo. Since over 1.5 million, and possibly as many as 4 million, Venezuelans will be abroad, the exile government can recruit and arm a 20 thousand member national liberation army, which can take a portion of Venezuela fairly easy with USA air support. At this time the Venezuelan army is suffering from a large number of desertions, so it’s likely the fighting would be between a motley crew supporting Maduro (scattered chavista militias, the brown shirt colectivos, the secret police types, and Cuban forces already in the country), against the liberation army augmented by thousands of army personnel which switches sides, and a huge number of people who’ll fight as amateurs but with a lot of zeal to get rid of Maduro. I think he would fall in weeks.
Doesn’t China have a lot invested in Venezuela?
I’m not so sure that the USA has balls or inclination or fortitude to buck China on something like this.
Unless they both found a win-win scenario to construct.
The Chinese have less invested than Total. They have $40 billion in loans, but I’m not sure how much of that may have been recouped.
As for the “US not willing to oppose China in Venezuela”, that depends on the Israel lobby, which seems to control USA foreign policy to a large extent. They may see the flow of millions of Venezuelans and the epidemics as a distraction and allow the USA to back a forceful take down of the Maduro dictatorship. Or they may wish to keep the USA bogged down in the Middle East and encouraging more terrorism. Who knows? I don’t expect rational behavior from USA politicians.
Oil prices are already going up and will stabilize Maduro very soon. If projections are correct, Venezuela will cash in 150$ per barrel for decades. No way to topple the government then.
That’s one of the reasons anti-Maduro propaganda is recently going into high gear. There is no time left to overcome Chavism. And if the Venezuelan government manages to secure its power, latin american leftist movements will always have enough support to survive.
That’s the main reason for the propaganda we’re reading recently in the media. Time’s not running out for Maduro – it’s getting short for his foes.
If he is producing any oil then anymore…
Not paying oil workers and foreign companies for technology support is so socialistic, it hurts.
But I know, hungering people in Venezuela is only Propaganda, everything great there…
Certainly not “great” – I just hinted towards the big picture which so many times goes lost in political turf battles.
Remember: With high oil prices the Chavists held production steady for about a decade while constantly replacing traditional production with bitumen oil. You can’t be totally dumb or dogmatically spoiled (which is more or less the same) if you achieve that.
Speaking of energynet, COP is selling some non-op interests in some Lodgepole wells in Stadium and Eland fields, Stark Co, ND.
Some huge cumulatives on those, drilled in mid 1990s.
For example, Klein 1-23. First production 3/1995. Most recent reported 2/2018. Oil cumulative 4,490,211 BO. Gas cumulative 2,432,227 MCF. Most recent month still at 90 BOPD and 60 MCFD. That one is a monster for sure!!
do you know what a good well cumulative production was by decade, or a place to find an average? I’ve always been curious
Dennis – The ROI for Eagle Ford wells is much lower than Permian or Bakken wells which accounts for wells added per month remaining far below the peak level – the evidence would suggest ROI has not been among the main criteria for shale oil investment, so why should it suddenly become so? Growth (and associated CEO bonuses) has been the big selling point, which has meant the oil has been developed at too lower price, as has been suggested here more than a few times, that also means it isn’t there to develop when the price goes up, contrary to some of your assumptions.
Hi George,
I am assuming eventually these businesses will become rational, perhaps a bad assumption. 🙂
It would explain the experience since prices dropped, where development moved away from the Eagle Ford for example. Most of the LTO growth has been in the Permian Basin since 2015 due to higher ROI. Bakken ROI may in fact be lower than I have estimated because my assumption for well cost there may be a bit too low. It should probably be $8.5 million rather than $8 million.
In any case, generally projects that are more profitable will be chosen over those that are less profitable you implicitly make the same assumption in your projections by choosing projects that have been sanctioned. The reason they are sanctioned is because they are the most profitable projects available in the area being analyzed.
George,
The amounts that I have assumed are “there” to be developed are consistent with the USGS estimates for North Dakota Bakken/ Three Forks, Wolfcamp, and Spraberry (these last two are part of the Permian Basin) and David Hughes estimate of the Eagle Ford (his “most likely” estimate) in Drilling Deeper. I have also assume the Delaware Basin will be about 5 Gb (I have not found any estimates for LTO of this basin), and that Niobrara will be about 2 Gb and the rest of the US will be about 2 Gb for a total of roughly 50 Gb. This is a bit challenging because there are no large projects like the deepwater offshore, we are guessing on the development of 100s of thousands of wells.
I have also stated that the total could be much lower or higher than I have estimated.
Proved reserves of US LTO were about 15.5 Gb at the end of 2016 and cumulative production was 2 Gb, so about 17.5 Gb. If we assume there will be no more LTO output from Niobrara, and other US LTO (aside from ND Bakken, Eagle Ford, Wolfcamp and Spraberry) we would have about 10+8+20+4+2=44 Gb for the USGS mean estimate, the F95 USGS estimate is roughly 60% of the mean undiscovered resource estimate in the case of the Bakken/Three Forks. If we assume it is similar for other plays, we would have 26.5 Gb of undiscovered mean resources (44-17.5) and 60% of 26.5 is 15.9 Gb, so rounding we have 16+18=34 Gb for a rough F95 estimate, if we assume no further output from Delaware basin LTO and all other LTO basins in the US beyond proved reserves at the end of 2016.
I think 40 to 60 Gb is about right, based on the information available at present.
At a high oil price, I think it is there. It is not there at a price below 90. They need to recover most of the capex the first year, or they may me screwed. A lot of the area does not have very high or long tails on the decline. All the way up to 2013, the story was that the Eagle Ford was homogeneous. It’s not. They drilled, and prices crashed in 2014. What could have been at least break even eventually, was a huge loss. Then, they were stuck with drilling contracts, and areas to complete to hold the leases. It was a huge fiasco, but there is profit there at the right price. I own percentage in a 3000 acre area, that has just 5 wells on it. All would be highly profitable at $70. First year production from 125k to 175k. EOG is still gun shy, and will only target those areas profitable at $40 to $50. That will probably change in 2019.
Guym,
You may be right, but the areas in the Eagle Ford will be competing for capital with the Permian Basin and Bakken, where ROI is quite a bit higher.
I used $6.5 million for the average drill and complete cost for an “average” Eagle Ford LTO oil well, does that seem reasonable? What might it be if we included land and interest over the life of the loan? Does $7.5 million sound reasonable for “all in costs”, including costs for infrastructure for water and natural gas handling, etc. (in other words if a 16 well pad and associated infrastructure is built, then each of the 16 wells shares 1/16 of the cost for the necessary infrastructure. As a Texas landowner, I imagine you have far more insight than me.
More than half of EOG’s permits are going to the Eagle Ford in Texas, probably will continue that way for awhile.
Each company has a different set of costs. Like, EOG has a hammerlock on contracts due to their size, owns their own sand, and some other costs are handled within the company. So, they have lower costs. Costs adjusted for a 5300 foot lateral they claim is $4.5, hoping to be 4.3 this year. But there are lesser 5300 foot laterals, They can go from 5000 feet in the Karnes Fault area to close to 10K feet in western Eagle Ford. You can’t just divide and multiply to get there, because there is some savings on doing a long lateral. EOG was one of the first in, and their per acre costs are damn cheap. In most cases, less than fifteen hundred an acre, second bonus probably raising it over that. However, I look at costs a little differently than most, because I would use an incremental or marginal cost decision on whether to add a new well. Land costs, where the acreage is held by production, would be a sunk cost. So, would some of the infrastructure already in place, adding only those costs which would connect it to that infrastructure. I am sure each one of the companies would look at it differently, too. Just a wild guess would be EOGs “all in costs” as you describe would be probably close to 6.5, others could be 8.5, or more. Everyone is digging the long laterals now. So, 7.5 is probably as good as any.
Thanks for all that info.
So for the average EOG well that is being drilled today, is the 5300 foot lateral close to their average well? In any case, I will use 7.5 million as using all costs may give a more realistic estimate. Hard to drill a well without land. 🙂
How are you going to figure those land costs??? They range from $400 an acre in the Eagle Ford to $15k. In the Permian they go for close to zero to $50k. Good luck with that. I’d just use 7.5million. If it’s too high, inflation costs will catch up sometime.
Guym,
Just guess what the average cost is. I realize they will vary a lot depending on where the land is in relation to the sweet spots etc and when the land was purchased.
For those that got in early consider what the land could be sold for as the “opportunity cost” for that property.
In any case I will just use 7.5 million as you suggest your guess is likely to be far better than mine.
That’s not a well considered amount, rather more like a WA guess.
Yep, your WAGs are probably better than mine.
Based on an EIA report from 2015
file:///C:/Users/dcoyn/Downloads/upstream%20drilling%20cost%20US.pdf
Full cycle well costs (including land cost)
Eagle Ford = 7 million
Permian=7.8 million
Bakken=8.8 million
all in 2015$.
Annual IRR for wells in June 2020 for an oil price scenario shown in chart below.
Eagle Ford-15%
Permian- 22%
Bakken – 29%
By June 22 average new well annual IRR is
Eagle Ford – 17%
Permian – 26%
Bakken – 17%
This is with updated scenarios with adjusted well cost and increasing LOE, I have used Rune Likvern’s model presented at Fractional Flow for the Bakken and have assumed other LTO plays would behave similarly, which may not be a good assumption.
Chart with oil price scenario. Click to enlarge.
Wow! Where does your oil price chart come from? And, you might be behind at 2018. Kind of hard to tell in five year increments on an iPhone.
Hi Guym,
The new scenario for oil price used the Permian scenario in the original post as far as well profiles and number of wells added, then I changed some assumptions for lease operating expense and well cost and found an oil price scenario that would make the scenario work. Clearly nobody knows future oil prices, but basically there is a linear increase in the real (2017$) Brent oil price (at about 17.5 cents per month) from $67/bo in Jan 2018 to $147/b(146.74) in Feb 2027, the oil price remains at that level until Dec 2040 and then decreases linearly at 73 cents per month until Dec 2050 (price falls to $127.70).
$80/b mid 2019, 89, 98, 106, 115, 124, 133, 142, and $147/b in 2027, all prices at mid year in consecutive years from 2020 to 2027 except the last $147/b price reached in Feb 2027.
Guym,
Yes actual oil prices have run ahead of my scenario, but sometimes oil prices decrease. Chart below takes AEO 2018 (from EIA) Reference Brent oil price and High Oil price scenarios and finds the average of the two, my scenario is not that far from this average “high-Ref” case. The reference case would result in far lower LTO output, but that case does not seem realistic when one looks at USGS technically recoverable resource (TRR) estimates and makes realistic economic assumptions.
On ROI of Eagle Ford, I was talking averages, the sweet spots of the Eagle Ford no doubt have much better ROI, but again I have no idea how much room is left in the sweet spots. I am just looking at the average EUR of recently drilled wells (2016 to 2017), though I imagine most of these recently completed wells have been in core areas.
Ok, I did not keep up with lateral lengths enough in the Eagle Ford. I was comparing the Watermelon lease to mine in Atascosa. It was doing significantly better, and now I know why. The damn lateral is over 12k feet long. It should do better, it is one and a half wells to my one. The Watermelon was one of EOG’s poster children on their presentation. It’s efficiency of money spent, but it is still one and a half wells. Can’t drill there again. That allocation well has a lease cast a page long.
Guym,
In some of my comments I have the ROI incorrect. For Eagle Ford, at a 7.5 million well cost and the oil price scenario above, the ROI is at a maximum in 2021 at 37%, and the maximum annual IRR is in 2022 at 18.8%.
For both the Bakken and Permian Basin rates of return and IRR are quite a bit higher for the average new well. Permian basin maximum ROI is in 2020 at 78% ($9.5 million well cost assumed), maximum annual IRR is 20.4% in 2023. Bakken maximum ROI in 2019 at 109% and maximum annual IRR is 36% in 2019, assuming a well cost of $9 million.
If we assume Bakken well cost is $9.5 million, then maximum ROI is 98% in 2019 and maximum IRR is 31.5% in 2019. By June 2023 Bakken ROI falls to 35% and annual IRR is 14%, Permian has ROI of 71% and annual IRR of 20.4% in June 2023 with well cost of $9.5 million.
https://www.cnbc.com/2018/05/22/opec-may-decide-to-ease-oil-supply-curbs-in-june-sources-say.html
June might just about correpond with the Khurais expansion coming on-line.
Hi George
No doubt you will have seen this. “The Oil and Gas Authority (OGA) has agreed to dish out 123 licences over 229 blocks or part-blocks to 61 companies in the 30th offshore auction.”
Yes – is it as good as they are making out? Only 360 mmboe potential I think I read, but with 8 or 9 commitment wells, which is something. It was suggested that almost all the licences with interest are near field, and therefore short cycle and a good thing, but that could equally suggest they are the last dregs, and there are no major new fields to be found, especially as they also highlighted new seismic technology that better identifies prospects (it also better identifies duds).
I think BP continuing cuts with another 3% of upstream staff is more indicative of the way the industry is going.
Everything is awesome…..lol
Most likely KSA will increase production by 400k bpd in June for electricity burn. None will go for export and they won’t disclose this. They ramp up production every summer for electrical generation.
George K,
It’s also casting a realistic eye on future Venezuelan production, I bet.
They have to make the right noises about maintaining stability but can they and should they. The world wants a cartel if it keeps prices low, but it’s anathema if it’s keeping prices high. OPEC did have some reason to maintain low prices to stop deep water and oil sands development around 2000s but they couldn’t stop the shale oil glut by maintaining high production through 2015 (how could they when the drillers don’t care much about prices as long as they get the loans). They are supposed to have spare capacity but has it ever been seen in action? They certainly have some sparage to cover for downtime – but there’s always downtime so always a demand on the spare, therefore it’s not really over and above current production.
Great comment, George!
Some signs that rising fuel prices are going to put a lid on demand growth
2018-05-23 (Bloomberg) Brazil to Scrap Diesel Tax as Truckers Protest Over Fuel Prices
2018-05-22 JAKARTA (Reuters) – The Indonesian government will protect the public from any “big shock” from soaring global oil prices by raising subsidies, its finance minister said on Tuesday.
https://www.reuters.com/article/us-indonesia-subsidies/indonesia-will-shield-public-from-big-shock-as-oil-prices-jump-fin-min-idUSKCN1IN0KX
2018-05-21 NEW DELHI (Reuters) – India is looking at ways to keep rising fuel prices in check, its oil minister said on Monday, with retail rates for diesel and petrol touching record highs in capital city New Delhi and financial hub Mumbai.
On Monday, industry lobby group FICCI called for an immediate cut in the excise duty on oil imports.
https://in.reuters.com/article/india-fuel/oil-minister-dharmendra-pradhan-says-considering-steps-to-keep-fuel-prices-in-check-idINKCN1IM0I6
The oil price rise in various currencies https://pbs.twimg.com/media/Dd3msOIU8AEn4AS.jpg
Government intervention to hold the price to consumers down would not seem to be evidence that demand will diminish.
Watcher,
Where in the OECD is that occurring? Maybe in China and India they may try to reduce taxes to keep prices down or even subsidize oil use (like some OPEC nations).
In that case demand will be there, but supply may not.
I suppose one would then argue that oil supply will also be subsidized, the system becomes pretty inefficient when everything is “free”.
In effect, isn’t the US LTO industry an example of subsidized production?
Subsidized by the debt ‘forgiveness’ that our system offers, in the guise of artificially low interest rates and other financial machinations that funnels capital into the industry despite the poor ROI at these prices?
It is a interesting economic model.
“Anyone who believes that exponential growth can go on forever in a finite world is either a madman or an economist.”
― Kenneth E. Boulding
I think the point, which seems valid, was that the three examples given indicate increased subsidies to stop excessive price rises, which would therefore not limit demand growth. Nothing to do with OECD or anywhere except the three countries cited, and probably an indication of the continuing relative importance of oil to economies and politics.
Oil demand is known to be inelastic in the short term because there is a lot of sunk cost in the fossil fuel infrastructure that keeps demand going forward for a while. Even if record investments are made in highways, airfields, harbours, ships, locomotives, airplanes or vehicles…the implied message according to impatent reasoning is that fuel cost is too high right now; you better stop using what you bought or just sell what you have at loss. That is what is best for you…. There are just so many other sunk costs that higher fuel costs than you think can be endured. In real life it takes a lot of time to adjust. Scrapping old equipment, switching to other fuels or reducing energy consumption all together comes in the medium term (a few years) in most cases I guess.
That being said, Asian demand is challenged by the high US dollar exchange rate. This is different from the last period the oil price was high (2011-14), when the dollar was low for most other countries. Who knows the effect of just that, but if I was to take a guess economic growth in low income per capita countries would halt in a time period of give or take 1 year if oil prices stay around 100 dollars at current exchange rates. How other energy or raw material prices move would influence it as well, it is not all about oil. Commodities seem to move together in cycles; most likely because energy can be substitued and raw material extraction is highly energy intensive.
Demand pretty much always rises, with population if nothing else.
Consumption, on the other hand, might not.
Definition of demand in economics is the willingness to pay a price for a good or service, which is considered consumption. Unless, there is some other kind of distinction you are drawing? Like marginal propensity to consume?
I think he means: the demand curve can shift, meaning at any particular price people will buy more. But, prices can rise and that will move people to a higher price-point on the demand curve, where consumption is less. I think some people refer to that as demand destruction.
OTOH, if substitutes like EVs become more attractive, the demand curve can shift the other way.
Also, there are different curves for different customers. Trucks and container ships can reduce consumption sharply in a matter of hours by reducing speed. Shippers can substitute rail for trucks, but at a certain capacity threshold that will require infrastructure replacement (new ROW, new tracks, new bridges for double stacking, etc). Residential consumers can switch vehicles in their household, carpool, sell their car and buy a more efficient vehicle (which doesn’t have to be new): the average car turns over about every 3-4 years.
Finally, we should note that there is a different demand curve in the short term (short term demand elasticity) vs the long term, and that which curve people are working from depends on perceptions of the duration of current and future prices: a hurricane induced temporary price bump won’t change behavior much, but a long-term rise in prices will. Media discussion of the source of price increase (e.g., OPEC vs PO) will make a difference.
Recessions can be induced by vehicle buyers delaying their purchases to see if a price increase is longer-term (and therefore they need to choose a more efficient vehicle) – that may have been a substantial contributor to the 2007 recession. That is a short term effect, of course – eventually people will start buying cars again, and higher oil prices may trigger higher levels of vehicle replacement as existing inefficient vehicles become perceived as obsolete.
That’s what happened during the 1930’s Depression: lower farm prices, caused by newfangled tractors, pressured other farmers to accelerate their replacement of horses with tractors, and business investment actually rose. The Roosevelt administration tried to support crop prices, but the trend was way too strong, and the destruction of farm income hurt the economy more than the higher business investment helped. Local and regional bank failures caused by failing farms didn’t help. The only solution was massive migration of farm owners and workers out of rural areas that no longer had a use for their labor. Those areas are still hurting, of course, and trying to elect presidents who can magically reverse that trend…
That makes sense.
U.S. Petroleum Balance Sheet: http://ir.eia.gov/wpsr/overview.pdf
Saxo chart summary https://pbs.twimg.com/media/Dd44XLaV0AAj_P4.jpg
From your charts a question begs answering; what does it take to raise the distillate inventory in the US? The problem must be more serious than most think going into high demand season. High imports for now solves the problem.
I was wondering that myself. I don’t know how flexible refineries are? And I guess that light oil is less flexible than heavier oils.
If anyone is interested in refinery flexibility, this explains it a little…
OCTOBER 12, 2016 (Reuters) U.S. refiners also exploited the flexibility in their processing operations to curb production of gasoline and maximise output of middle distillates like diesel and especially jet fuel.
At a first approximation, refineries produce roughly fixed proportions of the major fuels like gasoline, jet fuel, distillate fuel oil and residual fuel oil.
But there is some flexibility to shift yields especially between gasoline on the one hand and jet fuel and distillate fuel oil on the other.
In particular, refineries can switch production between the heaviest components of gasoline and the lightest components of jet fuel and distillate fuel oil by changing cut points and catalysts.
The capacity to switch is termed the “swing cut” and is part of what makes fluid catalytic cracking units so important for refinery economics.
https://www.reuters.com/article/us-usa-gasoline-kemp-idUSKCN12C27B
Good one. George K. touched on this before. I am getting mixed articles on blending heavier Canadian with LTO. It can be done in Cushing, as they both wind up there. A couple said it was something that can be done, and is. The other said some oils can’t be mixed effectively. Would be the perfect option if it could.
Looking at seasonality it seems that refineries can get an extra +1% more middle distillates if they need to, they seem to do that every winter?
Thanks.
European refineries have a much higher distillate output, because of the popularity of diesel cars in Europe. If you crack heavy oil to lighter products you can reduce the carbon chains to get a mix of destillate and gasoline products. You can also add hydrogen to improve diesel/gasoline yields. Unfortunately this reduces volume (increases residue) and comes at an energy cost. For too light crude oil, there is no cost effective way to make enough destillates. That is about all I know about this subject. But I think the implications can be huge; demand must adapt to lack of destillates and product price spread becoming very high? (shipping engines on natural gas is maybe one of the changes needed to be made?)
To change the crack spread they need the right feedstock in the first place, i.e. heavy oil, with long chain hydrocarbons. The loss of Venezuela oil and some other upsets might be limiting their ability. They are only just out of maintenance period so there may still be some overhang from that, and the IMO changes are accelerating the demand on diesel over normal growth (from what little I’ve read it seems most shippers are switching to low sulphur marine diesel rather than desulphurised bunker oil or adding scrubbers).
The 50,000 ships that might be affected by the IMO requirements are already having a large impact on the futures market for ultra low sulfur diesel pricing.
There is no physical way that sufficient supply can be produced as the refiners have not made the modifications, and the several year time lag ensures insufficient product will be available.
Only about 200 to 600 ships have had the scrubbers installed, so very few will meet the emissions limits.
Seems like it will come down to whether or not the IMO will modify its stance.
RBN energy did an outstanding writeup on this about a week ago.
Demand in the USA is strong, looking at weekly “Total Product Supplied”.
And in the EU, this is Spain https://pbs.twimg.com/media/DbsQTMgXUAAojIg.jpg
And also China (Bloomberg) China’s apparent oil demand rose 9.3% in April, according to data compiled by Bloomberg.
http://www.northamericanshalemagazine.com/articles/2377/port-of-brownsville-set-to-build-permian-shale-export-facility
I was tongue in cheek on the rowboats going down the Rio Grande, but wasn’t expecting this one. Port of Brownsville to have one million barrels per day export capacity from the Permian by 2020. I guess if they can get a battleship up the mouth, they should be able to get a Suezmax. They have several LNG plants in the works here, too. Big gas pipeline going into Mexico around Brownsville has a spur planned to the Port. SpaceX new launch pad is across from Padre Island there. They’ve already built up a theater type setup on the South part of the Island to view the launches. The Valley has been busy beavers getting new business. South Padre Island is supposed to be a new docking port for the Caribbean Cruises soon. Houston, Corpus Christi, and Brownsville sound like they will be increased and fully functional by 2020. It just seems that creating more Loops, like in Louisiana would be cheaper in the long run, than constantly dredging. Plus, they can service VLCCs. Of course, if you simply look at how much can be loaded. Brownsville, on million a day vs. Loop at 2 million a week, it looks better to have it close, and load more.
Guy
Did you catch the last paragraph in that linked article?
Looks like they are planning on a VLCC terminal 6 miles offshore.
Lol, no in the scrolling, I missed it. Also missed it was Panamax, not Suezmax. Yes, two ship spaces, a million a day would give Panamax. The location of the offshore is not clear. This pipeline hits three major ports in Texas. The real oddity to this news is that it is not in the Brownsville papers on a search. The article link above, San Antonio, and Oklahoma City have the only articles on it. Last big news for the Port was a 1.5 billion investment decision to put a steel plant in the Port over a month ago.
Some background on this. The LNG plants tried to secure a tax break for their location, which was vigorously opposed, along with the LNG plants would ruin the neighborhood. No tax break, no fanfare gives fait accompli.
Big, big bucks being spent on infrastructure.
Yes, there is. If it all functional by 2020, and shale peaks in 2023, will it get paid for?
The port of Brownsville did run a Suezmax through in January. Loaded it with about 300k barrels of naptha to Corpus. So, an Panamax would probably do fine.
If it’s feasible, they can always partially load the big ships at the dock and do lightering slightly offshore.
One way or another, these guys seem to be ramping up for big time production.
Not sure if a VLCC is an option. The Suezmax was the largest ship they ever had in port. A VLCC holds twice as much as a Suezmax.
https://oilprice.com/Energy/Energy-General/Permian-Growth-Is-Reaching-Its-Limits.html
Repetition is also learning.
Everyone is concentrating on the US reports. Price down slightly, but OPEC basket keeps rising.
The Mexican hedges stand to lose about 1.05 billion US for 2017, and 1.26 billion US for 2018. They made about 2.6 billion in 2016. Easy come, easy go. At least over the last three years, they are slightly ahead.
“The market is screaming right now, ‘We need every barrel we can get,’ ” said Phil Flynn, an analyst at the Price Futures Group.
https://www.dollarcollapse.com/oil-front-page-news/
True or False?
I like Phil, and get his daily newsletters. Is it true, no. If they were scrambling for every barrel, oil would be way north of $100. Is it tightening, and good to persuade his readers to stay long on oil, yes. Ignore the EIA weeklies, it’s not representative to what’s happening in the rest of the world. Hence, my reference to the OPEC basket above. About the only place oil supply is increasing is in the US. Reinstating the export ban would essentially kill the increase, as refineries can’t use it all. They can only use so much LTO, as they are mostly set up for heavier grades of oil. World supply would plummet faster, and oil prices for Brent would go through the roof faster. You would just wind up with a WTI glut, and a massive price differential, and we would still be importing the same amount of more expensive Brent. Or, we could further screw it up, and require refineries to use US oil. Distillates will plummet, and ships may not have enough, or there might not be enough diesel to move that Walmart truck. Or maybe one of those senators has the technical know how to combine Canadian heavy with LTO to run a refinery.
So do you really believe the supply/demand equation is really that tight, or is the squeeze a result of (say) Russia and the Saudi easing back (a lot) from their top sustained production rate?
We have been titillated with true Peak Oil for so long I have lost touch with what is real any more?!
I used to fret that increased demand within oil producers would cut out supplies to small non-producers (like my place), leaving any available export surplus to be gobbled by the big demands like China, India etc.
Is ~98 Mbod really the top?
I don’t think it is quite peak supply, yet. Will supply ever get past the demand curve again? Probably not. IEA has a better grip on what is happening than EIA. But, they are behind in analysis, too. Though they predict the price spike eventually. OPEC Would be hard pressed to keep up with just Venezuela and Angola drops. US has some serious constraint issues into the latter part of 2019, and won’t provide the increase, short term, that EIA and IEA are predicting. Even if they did, it would be doubtful there is enough Port capability to handle it until 2020. At this point, I see Iran as a non-issue. Short term, the demand curve won’t move that much. Over a couple of years it will. But in the interim, we have decline curves, and no significant new oil finds. In my opinion. Let’s just hope the rest of the car industry has better luck developing EVs than Musk. I need one that gets close to 500 miles.
Guym,
Does your car or truck go 500 miles between fillups?
As long as you are on a major highway there’s supercharger stations. Texas is pretty big so if you drive a lot on the back roads it might not work.
https://www.tesla.com/findus#/bounds/36.5007041,-93.50803889999997,25.8371638,-106.64564610000002,d?search=supercharger&name=Texas,%20USA
Thanks. However, the other issue is highlighted when I search near me. There is not one in Fort Worth. Arlington, Dallas and Plano, yes. Within thirty miles of where I live, there is none. While some of hotels along the route I travel from Fort Worth to South Padre have chargers, most are a little more pricey than what I want to lay out. Simply, not there, yet, for Texas. Getting better, but not there. My Versa takes one stop in between. So price per gallon is not a game stopper with a less than 12 gallon tank. It’s when there is questionable supply is when I would think differently, and plan my trip around my car, rather than convenience, or where I might want to stay.
Guym,
I just assumed you drove a pickup truck, I thought everyone in Texas did. 🙂
I usually don’t drive 500 miles at a time and when I do there are Superchargers along the way, often times there are chargers at restaurants etc.
As far as there not being one within 30 miles of you, most charging is done at home, as long as you don’t go more than 300 miles a day you just plug in at night. Its like having a gas station in your garage.
Actually, I do. A 2000 Nissan Frontier. Comes in handy sometimes, and only had 137k miles. A 2.4 liter four banger, but it sucks gas. Didn’t mean to upset your understanding of Texans.
Guym,
Thanks, you had me wondering if you were really from Texas. 🙂
What do you think of plug-in hybrids, like the Honda Clarity or the Chevy Volt?
Seems like the best of both worlds: with roughly 50 mile electric range you can run electric for 80-90% of miles, but you can always fill up at a gas station.
I drove a Toyota Prius quite a bit (a housemate had one). Once from St Louis to Marin north of SF.
No problem–
Probably a better choice for Texas and much of the US today. I would go with the Honda. It’s 33,400 for the base model and eligible for 7500 rebate so a net of 25,900 about the price of a Prius. The length of the vehicle is similar to a Honda Accord, so I guess a mid size, range is 47 miles, only a 7 gallon gas tank, gas + electric range is 340 miles.
Pretty cool car.
Guym,
If the charging is free, then you save on the cost of gas that you might have needed. Don’t know the price difference, but 10 gallons of gas is at least 25 dollars, so if charging is free and the Hotel costs 25 dollars more it’s a wash.
Before long all hotels will have charging, cheaper hotels will make you pay.
That’s about the range of my Versa with an 11 gal tank. I bought my 2017, used, with 7000 miles on it for a little over $10k before trade in. A mid size has some conveniences over mine, but I can get by without them.
Tesla is going bankrupt. Interesting to see what happens with the stations. Tesla said they are not a profit center, so may have no value to others OR the price for charging is going to increase making economic differences between EV’s and ICE less in a high oil price environment.
Getting a significantly negative review from Consumer Reports had to have been a painful experience for Musk. But, that’s not all he has in his plate. I’m sure the Martians will give him a standing ovation.
Evolve,
Go ahead and short the stock, you should make a bundle.
/sarcoff
I have. Long dated puts
I make fun of Elon, because is so far ahead of the curve that it is scary, sometimes. But, I could never sell the guy short, just based on his amazing record. I sometimes wonder if he will come up with a “Back to the future” vehicle.
“But, I could never sell the guy short, just based on his amazing record.”
It’s amazing how Tesla is valued just because of one guy.
Tesla is currently trying to fix the production of Model 3 to reach 5k cars per week and make profits on it. It won’t happened until July, as Tesla try to reach the 200k milestone in Q3 to keep the Federal Tax Incentive as long as possible.
The future of Tesla rely on the Model 3 production, nothing else. If this continue to go bad in Q3, then Tesla is done… It doesn’t matter what tales Musk show (Model Y, future sales, Semi, etc.). At some point, you become a real company, not a cash-bleeding unicorn, or you die.
Tita,
Yes, just like Amazon, which lost money for years.
They are going bankrupt any day. 🙂
Dennis– it has been 10 years for Tesla– it has been a while.
But like shale, profit is no longer a goal, it appears.
(Founded in 2003)
https://www.forbes.com/sites/jonmarkman/2017/05/23/the-amazon-era-no-profits-no-problem/#49eccbc6437a
“Profits are so yesterday. Now it’s all about vision and great storytelling.”
Plus Amazon has 50% of online sales, and doesn’t manufacture anything. It is a cash machine, and nobody wants it to stop.
Massive cash flow.
Here’s another for you, Adam:
https://oilprice.com/Energy/Energy-General/Increasing-WTI-Brent-Spread-Points-At-Higher-Crude-Prices.html
Also, it fits in with Energy News post, below.
http://crudeoilpeak.info/latest-graphs
Oil prices go up like between 2004-2008.
http://crudeoilpeak.info/oil-price-analysis
We know how that ended
Or does it look like 2009 to 2011, when oil prices remained high for the next 3.5 years (2011-2014.5)?
The difference this time is there is not likely to be a glut of oil, eventually there will be another severe recession like 2008/9, my guess is 2029/30.
You are such a optimist Dennis!
Hightrekker,
How so?
I am essentially predicting Great Depression 2 around 2030+/-2, not all that optimistic, but maybe more so than for those that think it will happen tomorrow.
I am hopeful that oil prices will be high as that might be the 2 by 4 to the side of the head needed for people to realize we need to start moving to a World that uses less oil, so plug in hybrids like the Honda Clarity (about 26k after Federal rebate) which gets 49 miles of range on electric and then can use a regular hybrid system to get 40 MPG and Tesla Model 3 and Chevy Bolt with 220 and 240 miles of range at about 35k (rebate will be cut in half for Tesla in Dec 2018 and then be cut in half again in July 2019 and end altogether on Dec 31, 2019.) Not sure about the Bolt, it depends when Chevy gets to 200,000 vehicles that have claimed an EV or plugin rebate, Tesla is expected to hit this at the end of June 2018.
In Australia, all cars converted to EVs would require 3,500 MW running 24/7 for recharging. But:
16/3/2018
NSW coal power maxed out in hot summer (part 2)
http://crudeoilpeak.info/nsw-coal-power-maxed-out-in-hot-summer-part-2
14/3/2018
NSW coal power maxed out in hot summer (part 1)
http://crudeoilpeak.info/nsw-coal-power-maxed-out-in-hot-summer-part-1
So, would that EV charging cost be cheaper than imported oil if the electricity was all coming from a combo of solar, wind, and nat gas?
Mushalik,
Are you accounting for the 75% thermal losses for ICEV? EVs are much more efficient at converting energy to work.
Natural gas and wind and solar have far lower thermal losses than ICEV or coal fired power plants.
Spreads widening
Brent – WTI spread above $8/bbl
Chart: https://pbs.twimg.com/media/Dd-2HIRVQAAztXu.jpg
Midland WTI – Gulf Coast MEH $-17.75/bbl
Chart: https://pbs.twimg.com/media/Dd-uCLIVAAAihsD.jpg
Geeze. Midland looks like the cartoon of Wiley Coyote going over the cliff with an anvil.
lybia, home to the hottest place on earth has productiin problems due to heat…amazing
https://oilprice.com/Energy/Energy-General/Extreme-Weather-Causes-Production-Outages-In-Libya.html
Things like that are likely to be a growing problem. The maximum design temperatures for plant built over the last 40 years may all be exceeded, so too will the average temperatures which were used to give the optimum plant operations. All turbines drop in efficiency as the air temperature rises, and eventually start hitting trip points; they are likely to be near the limit of available designs in the hottest places already as there is no incentive to over design for higher temperatures that didn’t previously exist. Water and air cooling system efficiencies drop off really fast as the inlet temperature rises. HVAC systems can’t cope, local machinery rooms overheat and shut down. Sea level rises exceed original design freeboard. Droughts drop water intakes below acceptable levels.
And then some graphs in this article here assume that all this fossil fuel production continues on a business as usual basis. In Australia, some coal fired power plants and transmission lines reach thermal limits in hot summers. Use the search word “thermal” in this file of the Energy Market Operator
https://www.aemo.com.au/-/media/Files/Electricity/NEM/Security_and_Reliability/Congestion-Information/2017/Interconnector-Capabilities.pdf
As AEMO noted in its incident report, Vales Point units came “within one degree of reaching their absolute outlet temperature limit”.
https://www.smh.com.au/environment/climate-change/revealing-the-dark-side-of-liddell-from-power-failures-to-braineating-viruses-20170914-gygzz6.html
Revisiting an explanation provided some time ago.
Travel back in time to the 1970s and find yourself a gasoline line in the United States. Walk up to one of those cars sitting in the line, knock politely on the window, ask if you can get in for a few moments.
While you’re sitting there ask the driver how much gasoline he’d like to get today. He’ll say something like”well, I’d like to get 15 gallons, but I probably won’t be able to get that much.”
Why not?
“They’re limiting us to $5 of gas per visit. Some places won’t let you buy any gas unless your license plate number is odd on odd numbered dates. But whatever they choose to do, I won’t be getting all that I want.”
This is not rocket science. The demand doesn’t have to equal consumption. This largely is the definition of the word scarcity.
One part of these oil shortage was due to people rushing to gas stations to fill their tank and jerrycans with the embargo news. Fear changed the behaviour of millions of people in a short time. It wasn’t exactly an oil shortage… Just the idea of an oil shortage.
Yeah, he is on the “demand curve” somewhere.
If you want to know what a real physical oil shortage is all about, read this:
http://crudeoilpeak.info/my-experience-oil-crisis-1979
Good story. I wonder what the life expectancy of an EV parked on the street overnight would be if we get something like that in the next few years.
Makes an electric car, or plug-in hybrid, with photovoltaic on the roof, smell like sweet grass and alfalfa.
Ever notice in the stories about the gasoline lines of the 1970s we never hear about the trucks and diesel?
OPEC-Russia discuss raising output by 1Mbd. https://www.reuters.com/article/us-oil-opec-exclusive/exclusive-opec-russia-discuss-raising-oil-output-by-about-1-million-barrels-per-day-sources-idUSKCN1IQ0Q6?il=0
The question is which countries will increase their production and by how much:
“However, it is unclear which countries have the capacity to raise output and fill any supply gap other than Gulf oil producers, led by Saudi Arabia, and Russia, the sources said.
“Only a few members have the capability to increase production, so implementation will be complicated,” one OPEC source said.”
Just the threat has dropped prices by $2, that may hold for a few months before the real supply declines set in, so they might hold off anyway.
Translated, that means, we will try, but probably get nowhere close. This is a good time for OPEC to exit the mess, anyway. Any longer, and they will be toasted by everyone.
Better, now than later for the markets too. It is going to take many months to clear through all the misinformation, anyway. No sense, this continuing to be an “issue”. The .8 that is left can be easily dismissed, as we are trying to get there. From a standpoint of looking at IEA’s projections, the “addition” would have little effect on what they are already projecting. They used OPEC’s stated production amount as a guide to OPEC production, even when it was in decline. It’s “call on OPEC” amount.
On another note:
https://oilprice.com/Energy/Crude-Oil/Irans-Demands-Europe-Must-Guarantee-It-Will-Buy-Iranian-Oil.html
I cant see a wholesale agreement to these demands. Agreeing to buy the oil, is one thing, looking stupid, is another.
In the Permian, it’s drill, baby, drill as they get $50 a barrel.
https://www.hellenicshippingnews.com/rapid-shale-oil-supply-likely-to-disappoint-in-coming-years-oil-industry-veteran/
Platts interview Mark Papa.
https://www.platts.com/latest-news/natural-gas/washington/feature-permian-oil-producers-have-a-natural-10447825
Last paragraph is an interesting fix, if enough climb on. Oil producer gets zero for the gas, but the gas producer is able to eat his cake, now, and have for later, too.
Mexico Pemex April crude oil production 1,886 kb/day (crude & condensates without NGLs)
Up +22 kb/day from March
Down -63 kb/day from the average in 2017
The rig count (all oil) has increased from a low in Nov 2017 of 9 to 25 in April, with a big increase in land rigs.
https://pbs.twimg.com/media/DeHECiSWkAAVuLP.jpg
Mexico Pemex net exports (crude + products without LPG) during April were up +162 kb/day from the average during 2017
https://pbs.twimg.com/media/DeHESBSW4AAzvYk.jpg
Petroleum Consumption in OECD Countries – Seasonal – EIA – Monthly Energy Review – Table 11.2. May is usually a low.
https://pbs.twimg.com/media/DeH0XazW0AA8pX5.jpg
The thing that sticks out, is not that it is greater, but the starting point in 2018 was so much higher than previous years. Trucking in the US went crazy the first of the year in response to the new tax law. Wonder if that is the primary cause, or a major contributing factor.
Yes and it must have at least something to do with low unemployment, like you were saying a few weeks ago.
And the world economy seems to be growing at the moment.
2018-05-17 (Bloomberg) U.S. petroleum demand at 20.31m b/d in April vs 19.56m a year earlier, strongest April demand level since 2007, API says in monthly report.
2017 US Energy consumption. 99 QUADS
Nat Gas decline last 2 years?
Rejected energy in transportation increasing? 8 of 10 liters/gallons of fuel dumps out the radiator of your Ford mustang. Good thing they will still make them..
https://www.zerohedge.com/news/2018-05-25/visualizing-us-energy-consumption-one-chart
Russia’s Rosneft discovers new oil field in Iraq
http://tass.com/economy/1005776
No indication on size etc.
It sounds possible that we’ll see US crude oil exports peak over 3 million barrels per day this summer. US crude is cheap at the moment.
May 24th (Platts) A weaker WTI versus Dubai spread typically makes North American crude grades priced against WTI more competitive than Persian Gulf oil.
https://www.platts.com/latest-news/oil/singapore/chinas-unipec-buys-record-monthly-volume-of-us-27986917
2018-05-25 (Reuters) U.S. crude exports peaked at 2.6 million bpd two weeks ago, but are expected to keep rising.
No definitive data are available on how much crude the United States can export, though analysts estimate a nationwide capacity of 3.5 million to 4 million bpd. Most terminal operators and companies do not disclose capacity, and the U.S. Energy Department does not track it.
That capacity may begin to be tested next month, as Sinopec, Asia’s largest refiner, bought a record 16 million barrels, or about 533,000 bpd of U.S. crude, to load in June, two sources with knowledge of the matter said on Wednesday.
https://www.reuters.com/article/us-usa-oil-exports-china/chinese-others-clamor-for-crude-exports-but-u-s-straining-capacity-idUSKCN1IP3V7
Lot of BS in that article. Quote pipelines at 3.4, and production at 4.2, now. In the second half of 2019 an additional 1.25 of million production will be added. I call BS on all those numbers. Especially production now at 4.2 from the Permian. Pieced together information from other articles, which she had no clue to.
I really think 3 million is close to a max average, which I think is the “tightrope” allusion that Drillinginfo is referring to.
If they are going to have that additional million plus in pipeline capacity by 2019, they really need the additional port capacity before 2020. My guess. This whole Permian thing is the opposite of the voice in Field of Dreams”. In this one it’s “let them come, and you will build it, later, maybe”.
https://www.zerohedge.com/news/2018-05-26/brazilian-military-deployed-break-trucking-state-emergency-worsens
Behold. Why diesel is everything.
India has record fuel prices and half of the price is tax
2018-05-24 NEW DELHI (Reuters) India has the highest retail prices of petrol and diesel among South Asian nations as taxes account for about 40-50 percent of pump prices. Prime Minister Narendra Modi’s government, which had raised taxes on the two fuels when global oil prices were low, is already facing criticism from the opposition for higher retail prices.
https://in.reuters.com/article/india-fuel-graphic/graphic-indias-petrol-diesel-prices-surge-to-record-idINKCN1IP1J5
2018-05-23 RIO DE JANEIRO/BRASILIA (Reuters) According to Petrobras, state and federal taxes make up 29 percent of the final price of diesel paid by consumers. The average retail price of diesel is now 3.595 reais per liter.
https://www.reuters.com/article/us-brazil-transport/petrobras-slashes-diesel-prices-to-ease-brazil-trucker-protest-idUSKCN1IO34V
India fuel consumption, average January-to-April, is up by over +7% year/year
https://pbs.twimg.com/media/DeMoQ9dW0AE-zZm.jpg
India oil consumption 2015-2016 was 7.8% growth. 7+% is normal. The 2016-2017 number will be out in the BP bible in a few weeks.
This represents per capita consumption of 0.00359 barrels/day/person. Far behind the US 0.061 bpdpp. But that growth rate will catch them up nicely.
If India gets to US level of per capita consumption with their 1.32 billion population, they will consume about 80 million bpd.
The US is not the highest per capita oil consumer in the world. Canada is higher at 0.066 bpdpp. KSA is 0.135. Qatar 0.154.
Brazilian biofuel production averaged 563 kb/day in 2017
(Produção Etanol Anidro e Hidratado + Produção de biodiesel)
https://pbs.twimg.com/media/DeMPhuqXcAASup2.jpg
https://seekingalpha.com/article/4177001-eogs-eagle-ford-situation-may-indicative-overall-fields-future
Not much help for analysts who cannot read, or haven’t a clue about company history. In their schedule they list total locations left that have been drilled, or yet to be drilled after dumping tons of tier three acreage. That number is 7200. The analyst assumes that is total premium locations (tier 1). It doesn’t say total premium locations, it says total locations. Since drilling, they have probably drilled less than 2100 wells total.
Guym.
Think they will keep adding rigs in PB when their well head price drops into the $40s after Memorial Day?
I read in one article, where the worst case scenerio for the discount was $21 to $26. It was close to $18 in the last article. I guess it depends on the type of derivatives they bought into last year. I’m clueless on that.
The IEA doesn’t see a shortage of diesel production or a lack of demand for LTO
2018-05-07 (IEA) Are global refiners ready for US shale exports?
Asia’s growing demand for chemicals has sparked a petrochemical construction boom. LTO, along with condensates, is a feedstock that is best suited for refineries with integrated petrochemical operations. Thus, most of the incremental output of US LTO is expected to eventually find home in Asian markets for petrochemical feedstocks and in European market as a low-sulphur, low residue yield feedstock.
http://www.iea.org/newsroom/news/2018/may/commentary-quality-vs-quantity–are-global-refiners-ready-for-us-shale-exports.html
Refineries are complicated and I’m far from an export but I think I have this right: when heavier components are cracked diesel tends to come from hydrocracking atmospheric column bottoms or lighter streams from vacuum units, and gasoline from fluid cat. crackers or coker units fed from vacuum column sidestreams or bottoms. Internal recycles and whatnot mean it isn’t quite as clear as this but close. Therefore the EIA curve below clearly shows one of the US refinery industry responses to the growth in LTO – they added hydrocracking to allow more diesel production from cracking of the heavier components. Depending where the hydrogen come from hydrocracking can add to overall refinery gains, I don’t know if that’s been seen though.
US Diesel consumption looks like about 400K bpd.
No it’s much higher than that. What that chart shows is about 600 kbpd added potential since 2008 to produce diesel from heavier components in the slate (and which therefore could be used to replace diesel that was, previous to the LTO growth, present in the feedstock and produced by simple distillation).
Friday May 25th Markets
OPEC Reference Basket Price $74.87, WTI(July18)(CME) $67.88, Spread ORB-WTI at $6.99.
Brent(July18) $76.44, WTI(July18) $67.88, Spread Brent-WTI at $8.56.
Chart, jpg file on Twitter: https://pbs.twimg.com/media/DeRiBkkXkAAQPtR.jpg
Can Asia afford to buy more fuel at higher prices?
Reuters – Asia refinery gasoline margins remain near 5 year seasonal lows
Chart: https://pbs.twimg.com/media/DeRKjplWsAEIv87.jpg
Net long paper barrels finally decreasing a little
Saxo Bank – funds accelerated the selling and cut the combined net-long in Brent and WTI by 45k to 924k. Record longs in both gasoil and gasoline last week
chart: https://pbs.twimg.com/media/DeRKjplWsAEIv87.jpg
“Can Asia afford to buy more fuel at higher prices?
Reuters – Asia refinery gasoline margins remain near 5 year seasonal lows”
If Asia means China . . . the yuan is pegged. It has a govt decreed trading range to the USD. They have a central bank that can create all the yuan they want, and define by decree its value vs the USD. They generally keep the yuan movement restricted to about 10% and off and on they define it vs a basket of currencies or the USD.
https://www.investopedia.com/articles/forex/030616/why-chinese-yuan-pegged.asp
So why would they be unable to afford oil?
(BTW Hong Kong does this, too. Frankly, all countries do via their own central bank’s ability to “intervene” in trading)
China was at a high in April. Both India and China are strong, so far. Though, India has been complaining. They added a bunch of tax when prices went down, and the public is unhappy with elected officials.
2018-05-28 SINGAPORE (Reuters) – A seasonal splurge has helped lift Asia’s crimped gasoline refining profits out of a long slump, but higher crude prices and the rise of energy-efficient cars are set to leave margins stuck at historically weak levels, industry watchers say.
Asia’s gasoline margin, or ‘crack’, stood at nearly $9.60 barrels per day (bpd) on May 25, well above the 20-month low of $5.42 a barrel on April 19. Traders say the surge since late April has been triggered by strong demand.
Firms like Indonesia’s Pertamina, Asia’s top gasoline importer, have led the charge, buying actively ahead of the Ramadan fasting month, which this year goes from May 17 to June 14. In India, meanwhile, Bharat Petroleum has beefed up imports in recent weeks to meet an uptick in demand.
https://www.reuters.com/article/us-gasoline-asia-demand/asia-gasoline-profits-rebound-but-rising-crude-prices-and-green-cars-cap-gains-idUSKCN1IT0FW
2018-05-28 (Argus) Brazilian president Michel Temer agreed to a 60-day diesel price cut in the latest concession to striking truckers that have blocked highways and snarled food and fuel distribution nationwide since 21 May.
The price reduction of R0.46/l ($0.12/l) to R1.64/l is a fresh sign that Brasilia is backing away, at least temporarily, from a policy of market-based fuel pricing that was implemented by state-controlled Petrobras in 2016 in the wake of a debilitating corruption scandal.
The new price cut equates to an elimination of federal fuel taxes PIS/ Cofins, a key demand of the truckers. After the first 60-day freeze, diesel prices will be reviewed monthly, Temer said.
https://www.argusmedia.com/en/news/1688102-brazil-slashes-diesel-prices-truckers-strike-ending?backToResults=true
Even a modest and, so far, short lived rise, but I guess quite fast, has caused ructions. Some of it to do with currencies that have depreciated against the dollar – won’t these subsidies and economic impact from the disruptions just make that worse? I think it unlikely a long term rise to beyond $100, especially if there is a disproportional impact on diesel, isn’t going to cause some serious problems, especially added to all the political turmoil now (Italy, Iran, Nato, Russia, China, North Korea, maybe Spain, Brexit, Hungary, charity corruption, etc.). Also interesting that Brazil, which by some measures, because of ethanol, does quite well for ‘renewables’, is affected so quickly.
Populism isn’t really about the man and woman in the street having their say. It is more about one part of the elite breaking away from the established part. As I remember from the book ‘Secular Cycles’ that is one of the common features that initiates and marks the decline stage of the cycles, however it is couched.
If Saudi does raise output it will be interesting to see how close to 300 kbpd (the new production available from Khurais expansion) and whether it declines from then (possibly until Manifa water injection is fixed). I don’t think the timing is entirely unrelated, and it’s interesting that not a single article has so far mentioned anything about this or other supply side gains in Russia.
Yes I guess that cutting fuel taxes will just increase demand and prices. As long as the economy is growing then I guess demand for energy will also grow.
No doubt OPEC doesn’t want another glut and so they will at least try to increase supply gradually in response to demand.
Goldman Sachs view from Friday https://pbs.twimg.com/media/DeRxFYWWsAIMhzO.jpg
While debt levels are high around the world, I keep thinking that I should be keeping an eye on bond market news.
While the decrease in price is not helping me the short term, it is better now than later.
There are several things it will address in the short term, and give time to see how things will actually happen.
How fast and how much OPEC can raise production.
How much can Permian increase, and the effect on upstream on discounted oil,
What will be the actual demand to further draw down inventories.
Finally, I am curious to see how much of this stuff can really be exported with current infrastructure. Brent/WTI is over 8 now.
All these questions need to have apparent answers before we can look at 2019 more realistically.
https://oilprice.com/Energy/Energy-General/India-Wont-Pay-For-Venezuelan-Oil-With-Petro-Cryptocurrency.html
Maduro is having a hard time promoting his Kleptocurrency.
I was just having a quick look at Oman’s numbers, if anyone is interested here is a chart up to April…
28 May 2018 (Platts) Oman’s crude oil exports jumped 8% month on month to 863,130 b/d in April, the sultanate’s national center for statistics and information said in its latest monthly bulletin.
The sultanate produced a total of 29.033 million barrels of crude and condensate in the month, averaging 967,750 b/d, the ministry said.
Under the OPEC/non-OPEC production cut pact, Oman has an output quota of 955,000 b/d. (I guess this is crude only without condensate?)
https://www.platts.com/latest-news/oil/singapore/oman-data-april-crude-exports-jump-8-from-mar-27987826
But I’ve said before – they don’t have much new oil coming on line or potential discoveries (one or two small ones maybe – they had one big potential field offshore which turned out a bust), their growth over the last 10 years has been mostly from EOR applied to pretty old, heavy fields that had been steadily declining (they’ve use all three main methods – steam, polymer and soluble gas I think), and the curve was looking a bit peaky, so the cuts may be hiding a decline, or undulating plateau with decline to come. Their oil rigs have dropped about 10 over the last couple of years, gas numbers steady.
New posts up.
http://peakoilbarrel.com/open-thread-petroleum-may-29-2018/
and
http://peakoilbarrel.com/open-thread-non-petroleum-may-29-2018/