The Texas RRC Oil & Gas Production numbers are out. They came out on a weekend this month. All RRC data is through July. The EIA data is through June. Keep in mind that the RRC data is incomplete, that is why the chart lines droop on the end. However the EIA data is from the EIA’s Petroleum Supply Monthly, the data of which the EIA says now comes directly from the states, and reflects the complete best estimate of oil production.
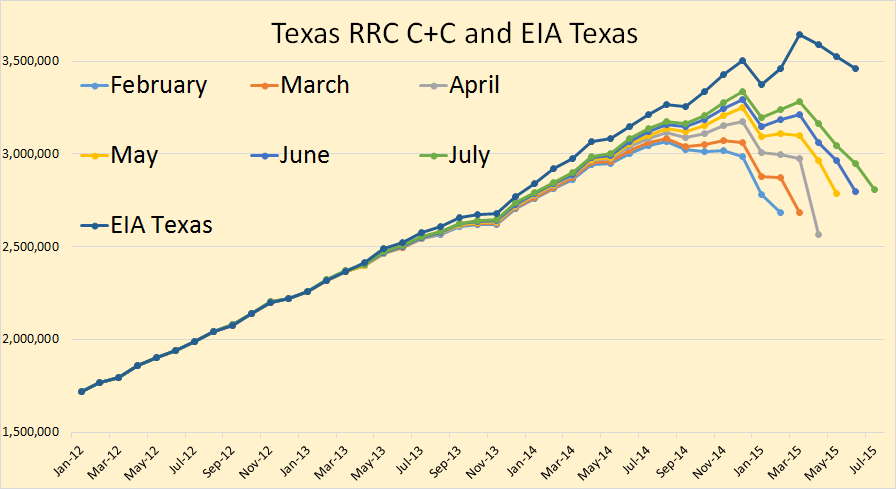
According to the EIA data, Texas crude + condensate peaked, so far, in March and declined in April, May and June. However the incomplete data from the RRC shows production likely dropping sharply in April, up in May then flat for June and July.
Dr. Dean Fantazzini has an algorithm that uses past and present RRC data and predicts what the final data looks like. He has Texas C+C slightly up in July.
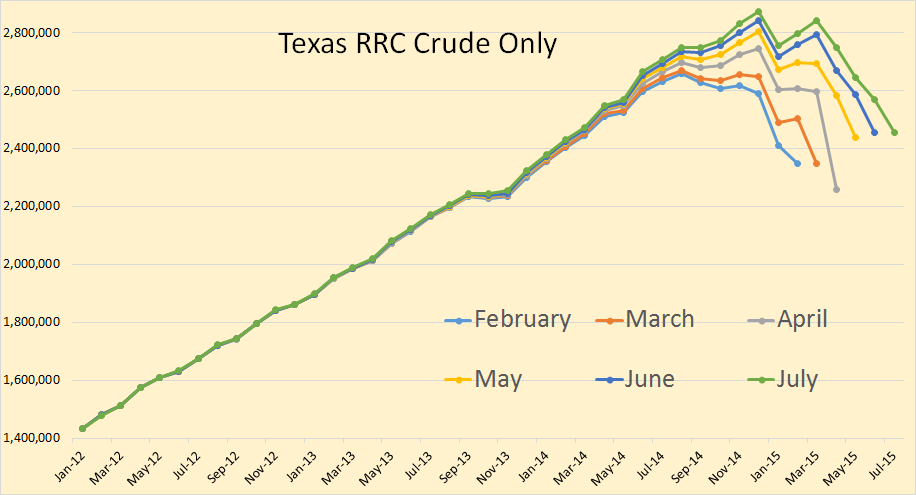
Texas crude only shows a similar pattern as C+C and it should since crude makes up, currently, about 87% of the total.
Dean shows Texas crude oil peaking in April but turning up in July.
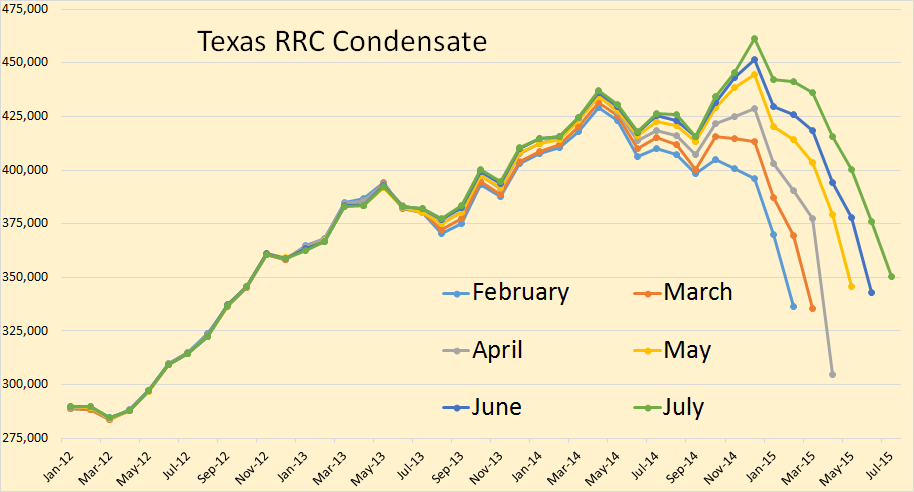
Texas RRC condensate seems to be slightly up in July.
Dean’s has condensate slightly up in July but flat for the last 8 months.
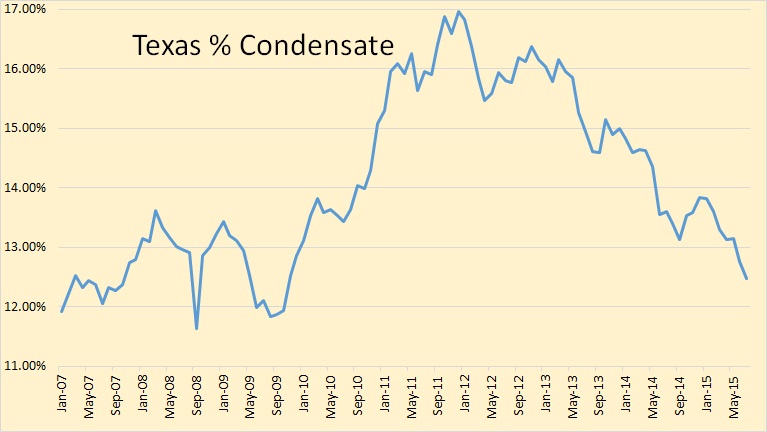
Make of this chart what you may. It shows the percent condensate varied between 12 and 13 percent but took off in 2010, peaking in 2011 at almost 17% then dropping ever since. Condensate comes primarily from gas wells but some wells in Eagle Ford produce primarily condensate. 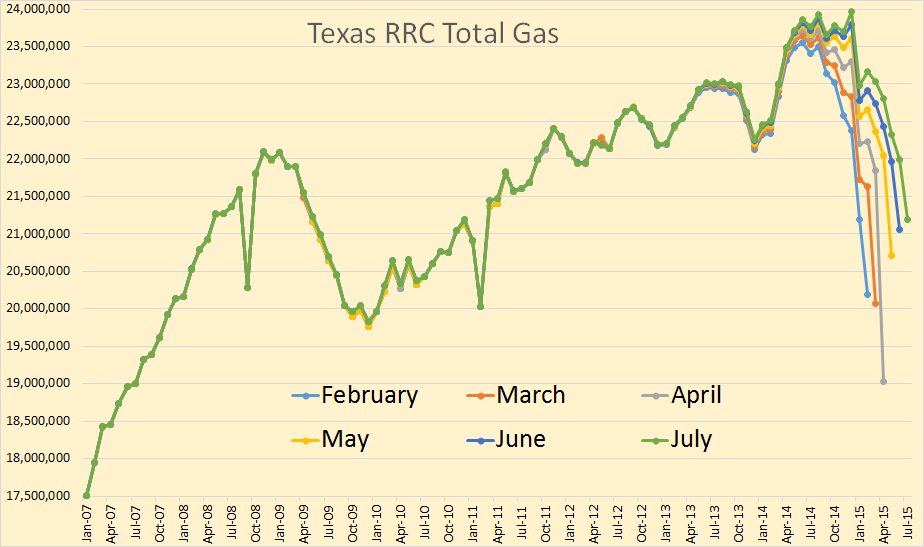 Texas total gas still seems to be increasing.
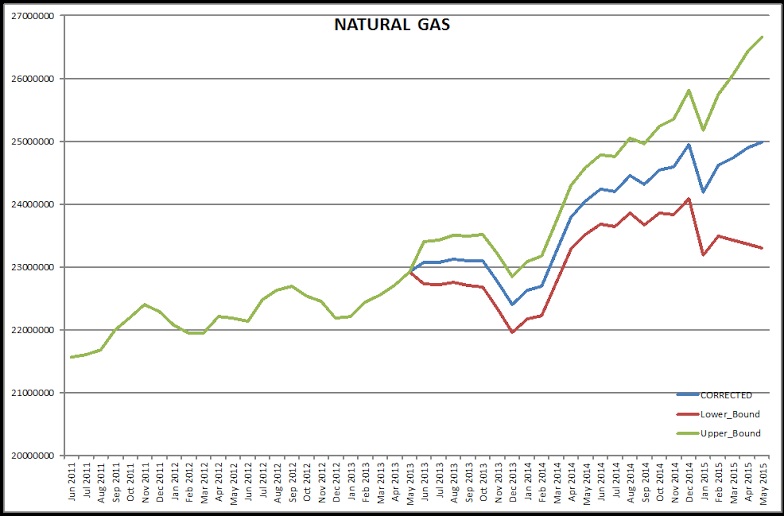
Dean shows Texas total gas sharply down in April but up every month since then.
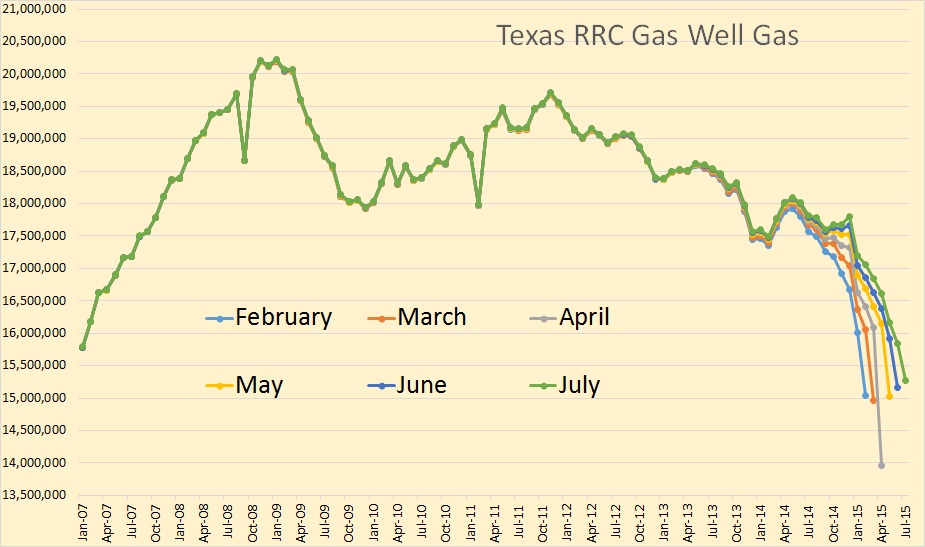
Texas gas well gas appears to be slightly up since dropping sharply in April.
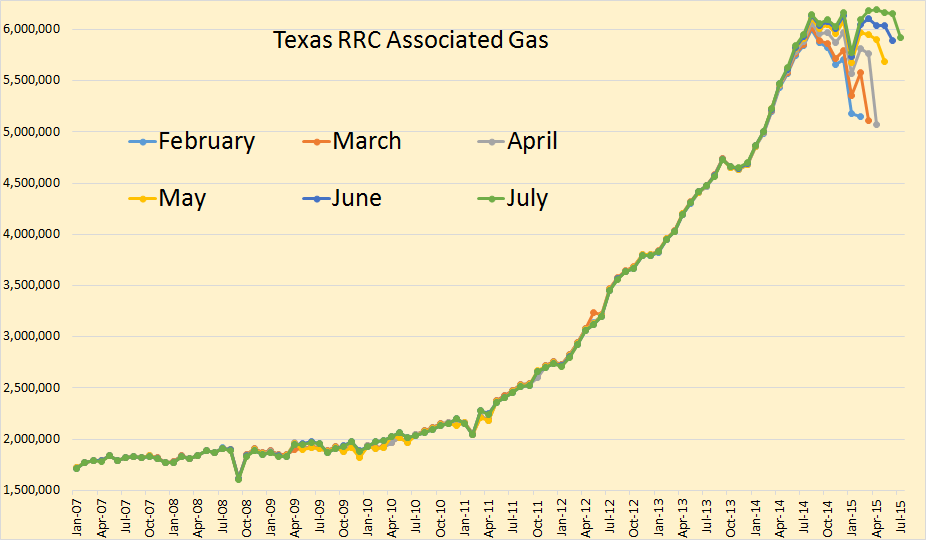
Texas associated gas, or what the RRC calls casinghead gas, shows a strange pattern, It dropped sharply in April and has increased slightly in the three months since like gas well gas. But the strange thing is it was increasing sharply every month through August 2014 but has run pretty much in place since then.
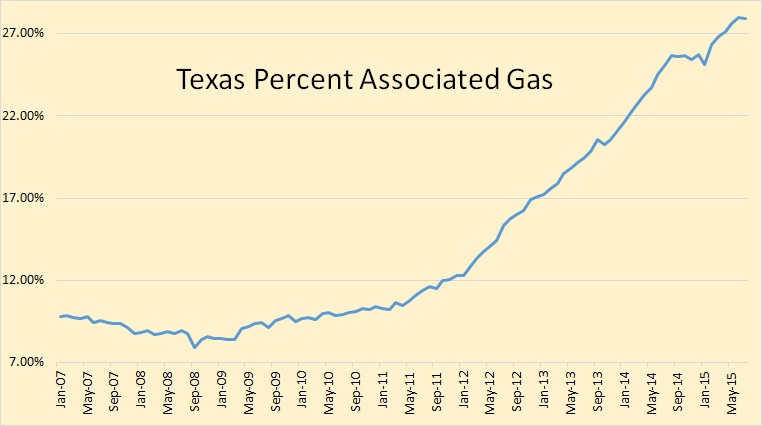
This chart shows why Texas total gas has been increasing, it is because of a dramatic increase in associated gas. Back in 2008 associated gas was barely above 8% of the total but is at 28% the last two months. The associated gas started its dramatic increase in 2011, right when the percentage of shale oil started it dramatic climb to prominence.
__________________________________________________________
I send out an email notice whenever I have a new post. If you would like to be included in that notice then please post me at DarwinianOne at Gmail.com
198 responses to “Texas RRC Oil & Gas Production”
Bearish report for both crude oil and natural gas prices. Agree follows the two month uptick in prices, but those prices were still below profitability for most new US and world wide projects IMO.
Heinrich Leopold posted about cash flow negatives for US producers of oil and gas, and questioned how long it can last.
Wonder if EIA is underreporting August and September production.
shallow sand,
From April through June oil prices have been comparatively high and there has been the widespread believe that oil prices will recover strongly in the fall. Hence production did not fall materially. If you look at the US natgas and oil production numbers from the FED https://research.stlouisfed.org/fred2/series/IPG211111N production rose in July and fell strongly in August. In September however, there is more widespread desillusion about oil prices and it looks like (weekly rail traffic numbers) that we will see a more substantial fall of oil and natgas production.
Heinrich. Seems like there is much conflicting data, which is not surprising given the large amount of data collection and the many collectors of data with differing methods, as has been discussed here.
I originally thought that there would be a supply response fairly quickly. There may be one as we speak, but we won’t know for awhile.
I think I have underestimated the ability of US producers to keep drilling and completing wells at a loss.
My error appears to have been thinking in my own terms. I should have looked at the shale gas industry, right next to the LTO industry, for guidance.
Shale gas producers have kept the price down for over 7 years. No reason LTO will not do the same.
I am beginning to think Russia and OPEC will be big losers re LTO. They are going to have to learn to do without for a few years.
We are learning to do without this year. Over a year of no money taken out of oil company. Looks like that may be the situation for several years.
If OPEC and Russia do not cut, sub $50 will be here a long time. Russia and OPEC are really boxed in. I guess they will have to live with the new normal, much like privately held US producers.
The problem, of course, is US public producers do not have to have earnings. Earnings forecasts for many are negative through 12/17. However, the upper managemt will not suffer much. They will maybe lose on shares they own. But they will still be able to borrow. Investors will still by the bonds.
This really stinks. But we had a good run 2003-2014. Have to pound sand for 2015 through at least 2020, I am afraid, unless OPEC and Russia cut.
I wonder of OPEC and Russia targeted a price of $75 Brent if LTO would take off again.
I wonder if reverse psychology would kick in. Investors, bankers might just thank their lucky stars and be less likely to throw money at LTO. Likewise, there might then be some expectation on the part of same that LTO producers show actual earnings, become cash flow positive and pay down debt.
Again, just speculation on my part. Hard to know what would happen.
Wonder if OPEC and Russia announced small cuts, state targeting 75 Brent, what would happen. Might throw in that if there is a NA production response they will back away, maximize production and let the price fall.
Wonder how NA producers and financiers would react to such a strategy? Keep in mind that 1986, 1998 and 2009 saw cuts required for a significant price reaction.
The more I think about it, Russia and OPEC need to make US shale boring to investors and financiers. Target a price, high enough they can make a little, but low enough that there are no great returns.
This would chase of the venture capital vultures. No assets to pick up and turn. No speculators looking for the big pop. They’d be gone.
If WTI was $70, meaning $60-$70 in the field, wonder what the reaction would be? Would it make sense to encourage the likes of CLR, et al to go big time cash flow negative? Wouldn’t CHK investors ask about reinstatement of the dividend? MSM would stop talking about oil. Too boring.
There are holes in this idea, what are they?
Well, I think that the hole is that no one has been able to “target” a price for oil – ever. Jeffrey Brown pointed out that about 10 years ago the Saudi’s increased quite a bit, but prices went way up.
I agree oil price is difficult to set. Speaking theoretically, what would happen if Russia and OPEC announced a target of Brent $75, actually set that price for all of their oil, with a scale for differing grades, and announced a small cut, say OPEC one million and Russia 300K. In the announcement it was stated the cartel would meet each month and adjust production as necessary to meet the price objective and would jointly abandon the plan for periods of time in the event of rapid non-cartel supply growth.
Just throwing things out there. Mowed a lot yesterday, had a lot of time to think.
Funny that all non-shale and non-tar sand producers, even in US, would probably be in favor of a cartel that could establish a strong, but not too strong, and stable price. I know we get nervous when the price gets too high, and have not enjoyed the expense run up that price spikes cause.
Just theoretically speaking, I’m sure Russia and OPEC cannot achieve Texas RRC like price stability. Maybe $75 Brent is too high anyway.
Personally, I have always thought that if Russia “posted” a take it or leave it price for its exported crude, that would become the price. They might have to severely limit shipments for a month or two, but if they stuck to it, I think that the market would have no choice. Say $75/barrel.
shallow sand,
In any case, LTO will not add ~1 mb/d per year, as in 2012-14.
2016 will see flat y-o-y LTO output at best.
Saudi Arabia, in my view, has peaked and will not increase output for the rest of 2015 and in 2016.
Russia’s production will remain flat to marginally declining next year.
However I reiterate my view that these two countries will not deliberately cut. Russian government is planning its budget for next year based on $50/bbl oil. And KSA’s foreign reserves are sufficient to survive for 2 or 3 years, despite their huge deficits.
Iraq’s production is unlikely to significantly increase in the near term
(http://oilprice.com/Energy/Crude-Oil/Oil-Prices-Could-Surge-As-This-Country-Fails-To-Meet-Production-Targets.html;
http://www.bloomberg.com/news/articles/2015-09-15/iraq-asks-oil-companies-to-submit-lower-2016-budgets-by-sept-30;
http://uk.reuters.com/article/2015/09/14/iraq-oil-contracts-idUKL5N11K3VK20150914😉
The rest of OPEC ex Iran will remain flat at best, although Libya remains a wild card.
Non-OPEC production ex-US will decline in 2016, according to forecasts by the IEA, EIA and OPEC.
So the only significant addition next year will be from Iran. But I do not believe that they are able to raise output by 1 mb/d.
Meanwhile demand will increase by 1.2-1.3mb/d.
To sum up, next year will be difficult for all producers (not just OPEC and Russia), but the market will begin to tighten in 2017.
AlexS. I agree all producers will suffer in 2016, at the the for profit type.
Not for profit US shale will do just fine. It is only hurt if it is not in the news. That is the American way.
I own stock in some US utility companies. Have for many years. They are not reported on at all. Just pay a nice dividend every year. Revenues are set by regulators.
Oil exporters have the perfect opportunity to set the price of oil for many years and turn US shake into a boring utility.
I dont’s think oil & gas industry, including shale, will ever become a utility-like boring sector. It will always remain highly cyclical
AlexS. I suppose you are correct. Commodities go through price cycles.
Is in interesting how commodities move somewhat in unison.
I would note the Texas RRC was able to keep prices very stable from post WWII until Texas conventional peak.
Maybe the current exporters are just not as adept as the Texas RRC was. Or cannot agree amongst themselves.
AlexS. I agree all producers will suffer in 2016, at least the for profit type.
Not for profit US shale will do just fine. It is only hurt if it is not in the news. That is the American way.
I own stock in some US utility companies. Have for many years. They are not reported on at all. Just pay a nice dividend every year. Revenues are set by regulators.
Oil exporters have the perfect opportunity to set the price of oil for many years and turn US shale into a boring utility.
shallow sand,
The underlying force here is that Russia and the Middle East productions have large economics of scale and low cost structures and on the other side shale is based on small economics of scale and high cost. So, for Russia and the Middle East a price of 50 USD per barrel is still a fantastic high price, especially after the rubel devaluation. Russia is doing actually very fine and over the latest months Russia had an huge trade surplus and increased its currency reserves. The situation is by far not the same as in 1998. So, Russia, Saudi Arabia and the Middle East can live comfortably with the current situation. In my view there is also a political element in this situation as Saudi Arabia is somewhat neglected by the US in the Middle East political landscape and Saudi Arabia wants to shows its might to gain leverage over the US.
I thought Russia’s economy is contracting akin to US contraction during 2008-2009 financial crisis and that KSA deficit is 20% of GDP, further will deplete reserves with oil at these levels by 2018?
I don’t believe things are all hunky dory for Russia, KSA or the rest of OPEC at sub $50 Brent.
Are the numbers I have been reading incorrect? I understand the ruble devaluation issue, but doesn’t that steep of a devaluation hurt in other areas?
shallow sand,
A devaluation just hurts the first few months. There is a spike of inflation and interest rates. However after the first year, a devaluation erased a lot of debt through inflation, consumer suffer, yet the industry – mostly commodity industry – thrives. I have been through a devaluation in Finland, which has been a huge shock in the first year. Yet, over the following decade Finland’s industry thrived. The Finnish paper industry erased over this time most of its debt and could take over nearly all of the European pulp and paper industry.
The Texas RRC publishes a monthly adjustment factor for crude and natural gas. This varies monthy apparently based on non reporting wells and other info they have. I don’t think the raw data actually tells us as much as we would like.
Last September Texas was averaging 902 rigs (all types) and this month they are averaging 369. It’s amazing to me how well production is holding up in the face of such a rig count decline. The lag between rig count and production is far longer than I would have expected.
I am with Joe on this one. The decline in rig count has not resulted in nearly as quick a decline in production as I would have thought.
The only easy conclusion is that the oil ship is even bigger and slower to change speed and direction than most of us thought earlier.
The flip side of this coin is that it might take a lot longer than we expect for new production to be brought online again once the price is up again.
The joker in this deck is that there might be a substantial built in lag in production drop because of projects underway well before the price crash that could not be abandoned half finished. Some of them might have been started as much as four or five years ago , conceivably even as long as eight or ten years ago in some places.
This leads me to speculate that when the price DOES go up again, there may be a period of time, maybe as long as four or five years, when producers can enjoy a sellers market before they spoil it for themselves by over producing collectively again- IF that is even possible in the face of growing population and depleting oil.
The Haynesville Shale Gas Play case history:
http://i1095.photobucket.com/albums/i475/westexas/Haynesville-rig-count-and-natural-gas-production1_zpsb1n95tiz.jpg
Interesting graph –
The rig count dropped by 50% in 2009 but production kept rising steadily. Not even a blip.
The ramp down and up were symmetrical
1.5 – 2 year time lag before production declined
As Fernando noted, there are some differences between oil and gas wells, in regard to the time lag between drilling activity and production levels, but the bottom line is that in both cases we see time lags between drilling declines and production declines.
Well I don’t know what happened in Haynesville but World oil production definitely took a huge hit to the tune of over 3 million barrels per day. The chart below is through April 2015.

Ron,
It was an intentional cut of OPEC production quota intended at stabilizing the market. Actual cut was 2.9 mb/d vs. 4.0 agreed at OPEC meeting
July 2008: 37089
Jan 2009: 34266
Feb 2009: 34245
Mar 2009: 34183
That was total liquids, including NGLs
Here is OPEC C+C
The reduction was the same: 2.9 mb/d
Jul-08 33,369
Jan-09 30,595
Feb-09 30,542
Mar-09 30,485
The Haynesville is rather unusual in that it was one of the first basins to have widespread fracked development, although it’s later than the Barnett. These early wells were very lightly fracked by today’s standards, and tended to come on line with quite low IP and quite low decline rates compared to more recent wells. This changes as you move along this chart, but leaves a base of production with a relatively low decline rate even more recently.
Need to segregate oil from gas wells. Gas wells are usually choked back or limited by facility constraints. This means it’s possible to change rates.
Once you segregate oil wells need to consider completion and facilities hook up back log.
Texas monthly oil well completions
Source: Texas RRC
Texas cumulative oil well completions: 2015 vs. 2014
Jan-Aug 2014: 17787
Jan-Aug 2015: 11723 (- 34%)
Texas average oil rig count vs. oil well completions
Hi AlexS,
Great stuff as usual. In the Eagle Ford Play there were 9102 oil wells on the schedule (I think this is total wells completed, but am unsure) on Sept 1, 2015. There were 7574 oil wells on schedule in the Eagle Ford on Jan 7, 2015. Thus over the first 8 months of the year about 190 new wells per month were completed in the Eagle Ford play.
There were 239 new wells added to the oil schedule in August 2015.
I also thought this would slow down much more than it has so far.
There were 5021 oil wells on the schedule on Jan 6, 2014, so about 208 new wells per month were completed on average in the Eagle Ford in 2014.
So only a drop of about 10% in the number of new wells completed per month in 2015 (first 8 months) compared to 2014 (all 12 months). Very surprising.
Dennis,
I’m not sure what means “wells on the schedule”.
From OPEC MOMR, September 2015:
“Eagle Ford wells brought online are expected to fall to around 2,700 from 4,000 in 2014, according to analyst group Wood Mackenzie Ltd. The company’s most recent analysis cites that production growth is slow in the near term, but the full effect of lower oil prices is moderated by improved recoveries in core areas. Eagle Ford is expected to produce 2 mb/d of oil and condensate by 2020, the report said. The company divided the play into nine sub-plays, three of which account for about 75% of Eagle Ford’s remaining NPV10 reserves. The Karnes Trough, Edwards Condensate and Black Oil
sub-plays are predicted to grow at an average of 10% in 2015, the company said.”
Here is the direct link to WoodMac research:
http://www.woodmac.com/public/media-centre/12529050
2700 vs. 4000 is a 33% decline y-o-y. This is close to TRRC number for the whole Texas in Jan-Aug (-34%)
Hi AlexS,
I looked at that link.
“We expect wells brought online in 2015 to fall to around 2,700 – down from around 4,000 in 2014.”
Note that they do not say “oil wells”, I am focusing on the “oil wells on schedule” from the RRC. See
http://www.rrc.state.tx.us/oil-gas/major-oil-gas-formations/eagle-ford-shale/
The grahics on the upper right part of that web page give you the oil and gas wells completed. The video gives the history back to 2011.
For the oil wells completed in the Eagle Ford the average rate for the first 9 months of 2014 was 209 wells per month completed. Compared to 191 wells completed per month for the first 8 months of 2015. Since 209/191=1.094, I would say the oil well completion rate has fallen about 9 to 10% from 2014 to 2015 in the Eagle Ford.
Also note that many of the wells completed in 2014 in Texas were vertical wells in the Permian basin, these wells have much lower output per well than the horizontal wells in that basin, this is the reason we can see the total number of completions go down, but production remain flat. The overall average output of the new well completions has increased due to the increase in the percentage of horizontal well completions.
In addition most of the drilling to hold leases by production (HBP) has stopped and with the low prices companies are focusing on core areas and drilling many holes per pad which reduces rig moves and increases the spuds per rig per month, so we can see rig counts fall with a smaller fall in completions.
Rig counts for oil rigs in the Permian for Q4 of 2014 compared to the most recent 3 months fell by 45% for horizontal rigs and by 73% for vertical rigs. In the Eagle Ford horizontal rigs drilling for oil have fallen by 59% from Q4 2014 to the most recent 3 months. Some of the lack of drop in well completion rates may be increased rig efficiency and some is due to the so-called frack-log (though Mike doubts this explanation and thinks the frack log is smaller than many analysts believe).
Finally the ratio of condensate to C+C in the Eagle Ford was between 20% (Dec 2014) and 23%(Jan 2014) with a decreasing trend from 2011 when it was 50% condensate to C+C down to 18% in April 2015.
As has been brought up, the reason drilling still continues is the availability of financing. There are many companies still drilling the same number of wells despite being financial disasters-SFY, PVA, HK, SD, CHK, WLL, CLR and many others. However, these companies are finally running out of money. CLR will be in default of their notes after this quarter but they might get a waiver. In any case, their production will drop 15% between June and end of year. As the financing gets used up, production will plummet. These companies keep drilling because the have access to funds. Borrowing bases cut next month should help some.
I noticed Triangle, Halcon and Sandridge look like BK coming soon and are still drilling.
“As has been brought up, the reason drilling still continues is the availability of financing. ”
I believe you are correct. My guess is that they company employees and executives can continue to collect paychecks on working being done (ie drilling). They will simply continue BAU until they run out of OPM (other people’s Money). I expect a lot of investors will lose more than their shirts in the next 6 Months. When these losses are made “official” will end Shale drill financing for a generation unless the gov’t co-signs future loans.
“August 2015 Had Highest Sea Surface Temperature on Record”
http://arctic-news.blogspot.com/2015/09/august-2015-had-highest-sea-surface-temperature.on.record.html
just imagine the amount of energy it takes to accomplish that.
Were Scroomed
Hi Jef,
Please put comments like your comment above in the Non-oil and natural gas thread.
Thanks.
There is already an oil and natural gas thread yes? So if this is some kind of precedent, and even if it is not, perhaps we will also have these specialized non-oil/non-natural gas articles and instructions to place any comments/graphs/etc. that are more about oil and natural gas in their appropriate threads?
Anyway, it makes me think of creeping complexity… and creeping additions/specializations/layers to increasingly-bloated governments (and oil/energy resources) to manage it all. Oh, and of course collapse ‘n’ stuff.
Dennis Coyne for prez. (Now there’s a specialization.)
Caelan,
You are correct. I was forgetting there was no non-oil thread posted so it can all go here I guess. My bad.
Yep-
We ned to be PC
DC,
There is an open thread non-oil and people have been posting on it today.
Now I’m confused.
Hi Synapsid,
I am confused too. People can post what they want where they want, I think it would be better to try to keep non-oil stuff in the non-oil thread when it is an initial comment. In other cases the conversation tends to wander from oil or gas to other topics and I do this as often as anyone else (perhaps more).
Another problem with this kind of thing is that it limits ‘idea cross-pollination’.
“Through cross pollination, we are able to come up with ideas and posts that would not be possible otherwise.” ~ Gail Tverberg
In any case, my inquiry was in part also about equality of subject-matter; how it ‘leans’ on a site:
If there is an Oil thread and a Non-Oil thread, great, but if there is an Oil thread and a Non-Oil thread and then an Oil-Based Article thread with comment allowances that are the same as the Oil thread, then POB’s comment allowance structure becomes skewed toward Oil-based comments. (And if the latter also ends up at the top of the blog’s front page more often than not.)
This is unless there are also Non-Oil-Based Articles (climate-change, finance, preparing for collapse, etc.) with comment allowances that are the same as the generic Non-Oil thread.
Dave Ranning: One of my rare sayings for when I am about to retire for the day is, “Well, it’s bedtime for Bonzo…”
In the current front-page hierarchy and in the Recent Posts list to the right, ‘Open Thread, Non Oil’ is third from the top.
So if this is where POB wants to relegate the importance of Non-Oil posts and cross-pollination, they have performed a bit of a sleight-of-hand coup. ‘u^
Caelan, I don’t really care. People kept complaining about all the non oil related posts. Mike left because of it. So Dennis initiated this Non-Oil and Oil only thread.
But you can’t please everyone. I am really getting tired of the whole goddamn mess. I will continue the current plan of posting non-oil and oil only threads when there is no data to post. I really think it is a good idea. But if someone posts something in the wrong place, I probably won’t even see it. That is I don’t want to be too strict about it. Let’s just live and let live and not sweat the small stuff.
Thanks Ron, I also like the idea, especially its simplicity compared with the alternatives.
Yair . . .
As I have mentioned before I like the format, the site works very well down here in Australia and I believe the shorter threads are easier to read.
I don’t post much but I come here several times a day and browse one thread or the other.
Thanks Ron and PLEASE keep it going who cares if a post slips into the wrong thread or goes a bit off topic.
Cheers.
Well I was kind of being a little tongue-in-cheek about it, if with an admitted interest in self-similarity at various levels of scale and the butterfly effect/chaos.
Gee what a surprise. Mike’s left before only to return…
But you know, while I was away from POB for a bit, enjoying some of the dog days of summer, upon my return I did catch something between Mike and Nick G.
It made me recall again something of what Mike’s occasional approach reminded me of from when I was much younger:
When we played sports casually, often someone would be the only one to bring some vital object to the game, where the game could not be played otherwise, or not easily. It might be a ball or a bat or something like that. (That rhymes.). And sometimes that person would get into some kind of argument or fight with someone. When that happened, occasionally they would threaten that if the person they were having it out with wasn’t somehow ‘disciplined’, and usually to their satisfaction, they would leave and take the vital object with them.
I think it would make the non-oil threads feel like less of an afterthought if they had a nominal topic. This could be done relatively easily by affixing a rotating subject tag such as batteries, PV, collapse, etc. Better but considerably more difficult would be in-depth news posts such as we have for oil.
OT. Have read many posts here about higher temperatures.
After a terrible drought in 2012, the middle of the US has now had three consecutive summers of lower temperatures and higher rainfall, which has led to a surge in grain yields and a glut of grain.
What factors are at play that have impacted middle US weather patterns?
Dennis, sorry, just saw your post. Permission given to delete or move this post.
Hi Shallow sands,
Not a problem. In this case there is not a non-oil thread so its all good.
shallow – You are talking about weather I am referring to Global Climate.
You can not go outside, stick your finger in your mouth, hold it up in the air and then dismiss the global consensus on climate change.
Jef. I am aware of that. I referred to weather patterns and not climate. I did not make any comment on climate change issues.
I do not get into climate change debates here because I am not well versed on the subject. I do read posts on the issue here and am becoming better informed.
Sorry you took my post as a statement on climate issues. Wasn’t meant to be.
Remember the long standing debate about the nature of Bakken oil and how it affects the marketing of it, given the volatile nature of the stuff? I haven’t seen much about that lately.
But here is a little excerpt bit from an article about the train wreck that killed forty seven people.
http://abcnews.go.com/US/wireStory/judge-poised-sign-off-oil-train-disaster-settlement-33895307
”But Keach contends there’s a distinction between liability for the derailment and liability for the deadly explosions. He contends CP failed to properly classify the Bakken region crude oil, which was as volatile as gasoline. Plaintiffs also believe CP bears some responsibility because it managed shipping documents and contracted to get the crude to its final destination in Saint John, New Brunswick.”
I can’t say if that is lawyer hyperbole or not.
It does relate to the very low price of Bakken oil.
Hi OldFarmarMac,
The low prices in the Bakken are because it costs a lot to get the oil to refineries and many of the US refineries have been set up to handle heavier oil. The best refineries to handle the Bakken oil are on the east and west coasts and much of that oil is moved by rail which is expensive. Lawsuits make it more expensive, which is your main point.
Hi Dennis,
Do you or does anybody else know if Bakken producers have been shipping oil as volatile as gasoline?
It stands to reason that an accidental fire in such a light oil would spread explosively.
A spilled diesel fuel fire takes a little while to get really rolling because the oil that is NOT actually being burnt takes a little time, seconds to minutes or longer, to heat up enough to start boiling away into explosive vapors -whereas gasoline evaporates extremely fast once spilled even at fairly low temperatures.
I am only guessing based on personal experience ( farmers being prone to doing such reckless things as starting fires deliberately with gasoline and diesel fuel as well as anything else handy and cheap) but you can spill a gallon of gasoline sometimes and drop a match a hundred feet away and the fireball that sometimes results could put you in the hospital or even six feet under depending on the terrain and movement of the air.
Spill a gallon of diesel and you have to work at igniting it and it would take five minutes for the fire to really get rolling and even then there would be no fireball or explosion.
There is a serious possibility in my opinion that the oil in those cars was dangerous as hell and should have been labelled and transported differently.
The Japanese lost a battleship towards the end of WWII most likely as the result of fueling it up with extremely volatile crude instead of refined oil since that was all they had.
Hi Old Farmer Mac,
I doubt the fuel was as volatile as gasoline, my guess is that there may have been some extra light ends making it somewhat more volatile than a typical crude, but that is a WAG.
Bakken crude flashpoints are as low as -59C and the vapor pressure is similar to gasoline. It can contain up to 10 percent C2-C4.
So, yes it has characteristics similar to gasoline.
It is classed as a flammable liquid for transport, as gasoline is. It is not an explosive, it does not ignite spontaneously when exposed to air. However it is easily ignited by a spark or flame at normal temperatures.
Railroads routinely carry very hazardous and toxic materials. If we want this kind of civilization, it’s a necessary evil.
The Lac Megantic disaster was clearly an operator error, driven by extremely poor management decisions. No matter what happened to the locomotive, if enough manual brakes had been applied, the train would not have moved when the air brakes lost pressure.
The newer tank cars are thicker, have insulation and from what I saw a metal shield to help prevent penetration. Of course with the materials carried (propane, oil, etc.) and the kinetic energies involved accidents will still happen. The stuff burns, that is why we use it.
What concerns me more is poor quality of some of the rail being produced in Asia and used here. A track supervisor was telling me how they crack and chip very quickly compared to US made rail.
http://www.manufacturing.net/news/2015/09/oil-company-officials-laud-findings-on-crude-oil-volatility?et_cid=4834378&et_rid=54676140&location=top
“Preliminary research and comments by several federal agencies on the volatility of crude oil from North Dakota shows that Bakken crude has been unfairly singled out in safety discussions, oil industry representatives said Tuesday.
…
North Dakota Petroleum Council president Ron Ness said the group has stated “from day one” that Bakken crude is not unique. …”
A pack of lies….
Are they just this greedy?
Did they have to pay off anybody?
Are the regulators just that easily bamboozled?
Interesting article in MintPress news about a Russian-Middle eastern alliance over oil forming. Claim is that KSA, Iran and Russia will put aside their differences.
Never heard of this news site.
OFF TOPIC in the immediate sense- but it is obvious enough that the chance plays a huge role in history and that the study of history is an excellent way of gaining insights into why governments do the things they do. The actions of governments have as much to do with oil as the actions of oil men themselves.
This link is to a series of lectures -history classes taught at Yale covering the history of the Roman empire. You could spend a couple of thousand bucks at a hell of a lot of reputable universities to for a history course where you would learn a lot less. This is free online.
https://www.youtube.com/watch?v=ZC8JcWVRFp8
Thanks. By the way, I hooked up my tv to YouTube, so when I get these links I watch 15 seconds, then watch the show on my tv, because they are loaded in my history.
SS – I do not have the graphs handy, but I think you will get some comfort if you can find a projection made about 6/15/14 that shows monthly projected oil production for the Bakken and Eagle Ford for 2015 and 2016. Then plot on that projection, 2015 actual production to date and a current projection for Oct 2015 thru 2016. That should show a meaningful change (down). Well completions (such as for Texas shown above by AlexS) will eventually tell the story. Either there are enough completions each month to offset legacy decline, or there are not. If not, the decline will be hard to turn around, largely because as noted many times, it will be hard to get a boom going again. Once burned, twice shy.
Here is a nice interview to cheer your heart, Shallow Sand:
http://www.bnn.ca/Video/player.aspx?vid=705183
Correctly points out that it is continually claimed (erroneously) that oil demand is going down. This guy is calling for $85 by the end of the year.
Greenbub,
For oil at 85 USD per barrel for the end of the year, the USD must drop substantially. In addition, there is a large inventory overhang, which must be cleared and there is also Iran preparing for production. It is very unrealistic to expect a 60% oil price increase over the next three months. It is a policy to convince investors not to panic and keep their investments or even buy more.
I think the idea is that the market is very unrealistic.
Greenbub,
In my view the markets are always right. In many cases we do not understand the reasons why markets do not react to our ‘reality”. However, in about three months we know more.
Hi Heinrich,
If the markets are “always right”, how is it that when one looks at past futures curves for WTI and Brent, the curve is wrong as often as it is right.
Are you one of those guys that sees a $100 bill on the street and doesn’t bother to pick it up because clearly if it was worth something someone would have done so? 🙂
In my view the market knows as much about the future as I do, that is, very little.
Dennis,
It depends very much on how the term market is defined. My definition is that the market is just a mirror of all interests of the market participants. Consumer want high quality and a low price. Producers want a high price and a big market share. In the case of oil, quality is very well defined, so consumer want just a low price. Producers want a high price and market share. This is where we are now for the oil market as the current competition is not for price but for market share. The interest for Saudi Arabia is now for market share and as they are a low cost producer they can afford to flood the market with their product in order to squeeze out competitors (shale). This is what telegraphy did to squeeze out the pony market, this is what Intel did to conquer the chip market for processors and this is what Microsoft did to get rid of Apple and IBM OS2. And the market was right to push out high cost producers for the benefit to the consumers. We have this fight for market share now for oil. If shale is really a low cost producer it will prevail at current prices and even expand. If not, than shale has to cut production and not Saudi Arabia. However, it is absurd to ask the low cost producer Saudi Arabia to cut production and let the high cost producer shale gain market share. This is price fixing and central planning, which has never worked in history. Yet so far, the oil market reacted very well and is right to choose the low cost producer.
It’s curious that the dollar/oil trading pattern has frequently been different recently (normally higher oil prices tend to correlate to a lower dollar, relative to the Euro at least). This morning for example, oil prices are up, as is the dollar, relative to the Euro.
Jeffrey,
The dollar is also down when oil is down. The market treats the USD already as commodity currency. This is a huge change from the past. This is why the FED could not raise interest rates as it has to support the oil price through a lower USD. As long as the oil price is going down, the USD will be down as well. This is the other side of being Saudi America.
Thank you, Jeffrey, for asking the question I’ve been asking myself for a few weeks, and Heinrich, for your explanation, which makes sense although I’m sure I don’t fully understand the implications.
So what happens if/when US shale shows a market changing decline? Does the dollar go up with oil prices and global funds flow into the US financial markets? Or something else?
Thanks for your insights.
Jim
Cracker,
In my view the biggest impact for the US dollar is a fall of the oil price below 40 USD per barrel. This would really threaten the shale industry and subsequent the high yield bond market. It is the nature of credit markets that a credit bubble builds up slowly – sometimes over decades – and then burts in a few months, when a black swan event occurs. Oil below 40 USD per barrel for more than a year would be such a black swan event and all shale debt comes due in a short period. The natural answer to save the bond market would be a steep drop of the USD. The FED can drop the dollar any time through a steepening of the yield curve. It has done so over the last century several times (e.g. 1985/86).
Perhaps you missed the following comment up the thread?
Pardon my French but I call bullshit on the Fed “has to support oil price”.
The Fed is interested in the overall economy rather than the oil industry. At some point the loans the banks have out to the shale industry might force the Fed to bail out some BANKS but not the oil companies themselves since they are smaller and less politically powerful and less well known that GM and the UAW for instance.
I don’t know of any economists who are saying the sorry state of the oil industry – from the industry pov- is a problem for the American economy – compared to the benefits to be had from the REST of the economy enjoying cheap oil and gas.
The banks have a problem with tight oil loans , true. But they also have loans to EVERYBODY to make up the losses if any and leave them sitting pretty – so long as the overall economy hangs in there.
old farmer mac,
Currently the oil price influences the overall economy through a cracking high yield bond market. This is the link between the economy and the oil price. Hence the FED supports the economy through supporting the bond market through a higher oil price.
Hence the FED supports the economy through supporting the bond market through a higher oil price.
Really now? $45 a barrel is the “higher oil price” that the Fed must support?
Ron,
I think: yes. The FED has to stop the oil price from falling below 45 USD per barrel. We have seen that when oil falls below 40 USD per barrel: The DOW gapped down nearly 15% in a few days. The high yield bond market tanked as well. If the FED would have increased interest rates now, there would have been turmoil on the markets and for sure some very weak economic numbers. The FED has to wait until the oil market stabilizes and low cost oil production depletes. There is no doubt, the US is now a commodity driven economy. The huge shale debt hangs like a Damokles sword over the US economy. In that sense the US economy has painted itself in a corner.
As the FT reported recently, the Fed could care less about the real economy of the United States. It works for the finance sector, and nobody else. To wit:
As an uneasy consensus took hold over the past few days that the Federal Reserve will not abandon its almost zero interest rate policies come September, the dollar fell against both the yen and the euro (though emerging market currencies continued to slide on scary data from China).
There are few lessons to safely draw from the market turbulence of the past two weeks, but one takeaway is surely the fact that quantitative easing is all about supporting asset prices rather than anything to do with the real economy….
The disconnect between the markets and the real economy and the gap between fundamentals and valuations grows by the day as long as unconventional monetary policies remain in place. These policies do not merely support market levels — they largely determine them. And that in itself has become a source of volatility in the markets.
Fundamental research does not matter nearly as much as second guessing the Fed. Since prices are artificially supported by government and central bank actions, the market struggles to find the proper level in the absence of such policies.
http://www.ft.com/intl/cms/s/0/4d936278-4cd4-11e5-9b5d-89a026fda5c9.html#axzz3mTFcupOG
But to jump from this to the conclusion that the Fed has identified oil as a sufficiently important asset class to make it worth singling out for its extraordinary support is a theory that needs some evidence to support it.
I for one believe that oil and oil production have a lot more to do with the real economy than with the financial economy, and as such I doubt if the Fed has given them much thought, other than how they might negatively impact the enshrined ficticious economy.
Hyperbole HL, Shale debt is reported as $235B. Not chump change but not a game change either. And definitely not when easing is conducted in lots of $80-$100B monthly.
Heinrich,
Perhaps I am missing something, but could you explain your reasoning behind the following two comments that you made?
Jeffrey,
I know this is confusing. However, when oil is falling below 40 USD per barrel, there is a different kind of mechanism which sets in. Oil below 40 USD per barrel brings down the high yield bond market – and this is dangerous for the USD. It is not only the bond market for oil and exploration companies, but also for ancillary (like drilling, infrastructure, housing, cars….) which is here at stake. Oil above 50 USD per barrel (which is basically no real threat for the US bond market) follows the old rule that a higher oil price increases the current account balance of the US and mainly Japan and China, which leaves less money available for dollar and treasuries purchases and thus weakens the US dollar. Fortunately there are no defined rules in investing. What brings down the oil price in todays environment can bring it up when the environment changes. This is why investing is so fascinating. There are no simple rules.
Heinrich wrote:
” Hence the FED supports the economy through supporting the bond market through a higher oil price.”
Actually lower oil prices are better for the US economy than higher prices. Low prices lower transportation costs for everything. Lower prices support increased consumer spending as they spend less of their income on energy and more on consumer goods and services. The US economy is no based upon Oil exports or production, but the consumption of refined Oil products to produce goods and services.
The issue is that global economy is very weak, being propped up with cheap credit to “defer” a debt crisis. The Fed needs to keep rates low indefinitely because of excess debt loads by the private and public sectors. If rates were to normalize, the US gov’t would be forced to default as it would be unable to pay the interest due on its ~ $19T in debt ($19T @ 5% is $950B in interest only payments)
If the US economy falls back into severe recession mode this fall-spring. The Fed is planning to move to NIRP (Negative Interest Rate Policy) to “defer” the debt crisis some more.
Oil prices have fallen, along with most commodities because the global economy is in recession. Most of the reduction was led in Asia as China’s credit bubble is beginning to deflate/pop. The US and the EU are also seeing some declines, but not as severe as Asia (for now).
TechGuy,
Low oil prices have been beneficial for the US economy before the shale bubble. Yet the shale bubble changed this. If oil prices are below 40 USD per barrel it smells catastrophy for shale and the US economy.
The consumer goods are made in china, the call centers for services are in India, etc.
The light tight oil production reduces imports and uses mostly USA labor and supplies.
I think at this time the USA probably does better with $100 per barrel oil and an extra 500,000 high paying jobs. The key is not to overproduce. Maybe Texas can join OPEC?
Fern Wrote:
“I think at this time the USA probably does better with $100 per barrel oil and an extra 500,000 high paying jobs. The key is not to overproduce. Maybe Texas can join OPEC?”
Unlikely, since $100 bb oil destroyed more than 10M US jobs. Lower energy costs puts allow more consumers to spend on more stuff. $100 bbl also also sends money to OPEC which is similar to sending money to China. Lower energy costs would also lower production of goods and services in th US. Higher energy costs are likely to increase outsourcing and automation as companies try to avoid passing on higher production costs to consumers, and look to cut labor costs.
Heinrich Wrote:
“If oil prices are below 40 USD per barrel it smells catastrophy for shale and the US economy.”
Not really, The reason why oil prices fell is because the global economy is in poor shape as demand for oil has declined. High energy prices only lasted as long, because of easy, cheap credit (first in the west, then in Asia). If the Central banks pulled the plug on ZIRP, the global economy would collapse in a matter of about year.
The US is a net importer so higher oil prices just send more money out of the country.
The real issue is that Conventional Oil peaked in 2005 and it was the end of cheap energy. The Higher cost of energy is leading to demand destruction. LTO oil is just another bubble, just like the Tech bubble of the 1990s or the housing bubble. All bubbles pop. To believe a bubble can be sustained indefinitely is just foolishness.
The “catastrophe for the US economy” began decades ago, and has nothing to do with LTO drilling.
Sooner or later the Fed will do QE4 and oil prices will shoot back up. However, as long as the Fed and other Central banks avoid money printing, energy prices will likely remain low (excluding a major war in the ME that blocks exports, which is a possibility now that Russia is moving in troops into Syria)
TechGuy,
At https://research.stlouisfed.org/fred2/series/BAMLH0A3HYCEY you can see that a low oil price affects the whole bond market (BofA bond index for CCC and lower) and thus the whole US economy. This has not been the case before the shale bubble, which is about to burst just now.
Sure it has, During the Tech Bubble and the Housing Bubble. In both cases Bonds where under stress. During the Housing Bubble it was so bad that the Fed had to buy up ~ $4T of bad loans and lower rates to Zero to prevent a depression. Also the rates are still stuck at zero after 7 years of the Housing Bust. We still never recovered from the Housing Bubble (evident since the Fed never raised rates)
Even if Oil was near $100 the LTO drillers still would go bust. When Oil prices were near or above $100 the LTO drillers were loading up on Debt to fund operations and expansion. At best, higher prices would have deferred the bust that is coming, and probably would be more severe since the Drillers would have likely been able to borrow larger amounts. . Also recall, sooner or later LTO drillers would have run out “sweet” spots, ending their parade. LTO is like the gold mining ghost towns that ended up getting abandoned after the mines were depleted.
For some reason you think falling Oil price is the “cause” of the weak economy. Just the opposite. Its a “symptom” of the weak economy. If the economy was really growing, any increased in supply would have been gobbled up by consumers and used to grow the economy.
Old Farmer Mac,
The implosion of oil prices has certainly sent shock waves through the credit markets and the currency markets.
But I believe you are right. Oil price is a double-edged sword.
For instance, not every country in the world is a Mexico or a Venezuela, dependent on oil revenues to run their economies and their governments, and to pay their external debt.
Greece, for instance, will more than likely be a beneficiary of the low oil prices.
..
You do realize that their largest source of foreign currency is tourism, and that as a service it does not appear in trade deficit calculations? Buy a steak from overseas for $5 and sell it to a tourist for $20, and your country’s trade deficit goes up by $5.
Nah.
Services
When an intangible service (e.g. tourism) is used by a foreigner in a local land and the local resident receives the money from a foreigner, this is also counted as an export, thus a credit.
https://en.wikipedia.org/wiki/Current_account
Furthermore, the point which you are unsuccessfully attempting to make has no bearing whatsoever on whether low oil prices will improve Greece’s balance of trade.
One of the things Alex touched upon recently was that although rig counts have fallen dramatically, the number of new wells has fallen less. A recent development in North Dakota is that the number of wells drilled per rig per month has increased fairly rapidly. This has happened before in 2009 when the rig count also fell. It could be that this increase is because better rigs, with more experienced hands are kept, and that the focus is on pad drilling. Perhaps there are also other artifacts. It could also mean that a further drop in rig count will have more effect (as better rigs are removed).
I am not sure which % of a well cost is determined by the rig and rig crew. But the well itself probably costs far more. As the number of new wells has fallen less than the rig count, the rig count drop should be larger than the drop in capital that is still going into the ground.
One theory I am considering is that pad drilling has increased this rig efficiency, but that it may also limit further improvements in average well performance. This is because the rig may very efficiently drill a bunch of Middle Bakken and Three Forks wells on a pad, but not all wells will be very good, even in the sweet spots (especially Three Forks wells typically have a worse performance). The upside for the operators may be that at least they can book all the related reserves?
Below chart shows the # new wells spud per month, per rig in ND. It did not yet rise to 2, as Helms mentioned some time ago, but the increase is nonetheless pretty large (an almost doubling of efficiency compared with 2011). I also show the 1 year moving average, and the average monthly rig count (divided by 100). I think it is too early to say whether the trend above 1.5 well/rig/month will be sustainable, but we’ll see in the coming months. There could also be a difference in the number of wells spud, which I can measure, and the number of wells completely drilled (as Coffeeguy once mentioned that 2 seperate rigs may drill a well), which I can’t measure.
Below chart shows the number of wells spud vs the number of wells starting each month in ND. I also show the monthly rig count, and from this you can see the recent increase in wells spud vs rig count.
In dark green the total number of wells spud, but not yet producing are shown. This is a measure I deduce myself, and is somewhat different from the NDIC number (“wells waiting for completion”), as I include wells that are still in the drilling stage. This number has been steadily dropping since last November, as in most months the number of wells spudded was less than the number of wells being brought online.
Given that the typically lag time between a well spud and a well flowing is about 5 months in ND, a normal working level with the current number of wells being spudded would be about 500-600 wells. This shows that the excess number of wells that could be, but are not, completed (the fraclog), is about 400-500 wells in ND. It is not clear which % of this fraclog is not being brought online because of economic reasons, as I guess it makes more sense for most operators to hold off on completing mediocre wells. EOG is a known exception, as they are not completing a bunch of probably very nice wells, until at least early next year.
Enno,
Thanks for the chart and comments
One question. You estimate the fraclog in ND is about 400-500 wells.
However, the recent NDIC Director’s Cut says:
“At the end of July there were an estimated 914 wells waiting on completion services, 70 more than at the end of June.”
Do you think they include in this number all wells that are still being drilled?
That NDIC number is slightly odd, given that the NDIC also reported during July that 111 oil wells were spud, and 136 were brought online. Therefore, I can’t explain how they come up with the increase of 70, unless rigs finished drilling a large number of new wells, and did not start drilling.
Still the discrepancy is not large: I count 986 wells spudded but not completed at the end of July, and the NDIC reports 914 wells waiting for completion, so if 72 wells are in the process of drilling, then the numbers match.
I do think their number does not include wells that are still being drilled, whereas my number does (as there is no status update publicly available between spudding and flowing) .
Historically, it took 3-5 months from spudding to flowing. The actual drilling is less than a month, so it appears that there used to be a normal waiting time before the completion crew could do their job (probably to synchronize all completion activities). The NDIC does not seem to include this waiting time in their numbers, and starts to count the well the moment the well could be completed. Since early 2013, the reported number by the NDIC was almost always higher than 400-500. Therefore, in my mind the NDIC number is not a good indicator of the excess wells that really could have been completed already.
It seems that the only reliable numbers from NDIC are oil production statistics
I know almost nothing about oil rigs -just what I read in forums such as this one- but I have bounced around heavy construction jobs off and on, and always made a practice of learning all I can. One thing you learn fast is that any company having new equipment runs the hell out of it in preference to old equipment because it is under warranties that will expire on the calendar as well as the hour meter. New equipment means a LOT less down time, a lot less fuel, higher overall production taken all around, but new equipment does not work miracles.
A blue ribbon crew that has been together for a while and which expects bonuses at Christmas can outwork a pick up crew by maybe ten to twenty percent max, doing the same work with the same equipment, would be my seat of the pants guess.
Now this multi well pad drilling business IS something relatively new, as I understand it, and saves a hell of a lot of time moving the drill rig from one well site to another. One or another of the hands on guys ought to know how much time this saves, per well, on average, and how long tight oil companies have been customarily using the multi well pad technique.
If just about every body was going the multi pad route over a year ago, it can’t account for drill rig productivity picking up over the last year.
The less experienced guys have almost for sure already been laid off right across the board and there is no reason to expect any further significant increases in rig or crew productivity if I am right about these things.
Pad drilling is very old. But it seems to be new to USA independents. Don’t forget the basic principles evolved in offshore oil drilling, as well as in Western Siberia, and other places.
The offshore set up is different because the drilling platform has at least two decks. The well heads are on the lower deck, the rig itself sits on large steel beams on the upper deck.
In western Siberia I’ve seen a very efficient design, with the well casing heads recessed about 1.5 meters below the pad surface.
Moving the rig depends on the rig design, the distance between wells (we call that wellhead spacing or center distance). A well designed rig drilling on a pad where the wells are spaced about 25 feet can move to the next well in about 30 hours. But this requires some work done before the actual skid, and additional work done in parallel as the rig gets ready to drill (for example, it’s good practice to do a full function/pressure test on valves once the blow out presenters are set on the wellhead).
What I’ve found is that the rig move seems to take longer the bigger the rig and the deeper one wishes to drill, mostly because it involves a lot more drill pipe, higher pressures, etc. Union rules also have an impact.
http://www.rrc.state.tx.us/oil-gas/research-and-statistics/production-data/historical-production-data/crude-oil-production-and-well-counts-since-1935/
1956 oil production was at 2.9 million bpd. 1967, 68, 69 were good years for production. 1970-1977 look like the peak of the plateau and the downhill trend begins. 2000-2010 were years of lowest production. 2014 production is comparable to years 1960-1965.
Texas has had plenty of oil for more than one hundred years, they have to keep statistics.
Fairly obvious it can be done for a few more years.
Somebody please straighten me out on the difference between “starting” a well and “spudding” a well. Sometimes I get the impression these terms are used interchangeably, other times not so.
Thanks in advance.
When I say starting a well, I mean that it starts to flow. Indeed probably not so clear.
Spudding is the start of the drilling phase.
Thanks Enno, I was able to see that spudding comes before “starting” from your comments and charts. But some other people seem to use the term start to indicate beginning to actually drill a well.
There are lots of words used interchangeably and the context usually shows the meaning clearly enough to an insider, but I am an outsider when it comes to oil.
Some times for instance a mechanic will say an engine will not “turn over” meaning it will not start and RUN. Other times he means the starter motor is inoperative for one reason or another.Most mechanics insist on calling engines MOTORS.
Wars have been won and lost because one general issued orders to another that were misinterpreted due to ambiguous language.
Sometime back we lost an eight or nine figure space probe because one crew of engineers worked in metric and another in the old Imperial system.
They say English is the hardest language to learn in large part due to ambiguity .
Try this: MIRU Rig #1. NU & Press TST BOP. PU & RIH w/DA #1, DO CMT & 20 Ft SH. TST CSG SHOE. POOH. Watch sunset.
Fernando,
Now you are speaking the language, I understand. Smiles.
Enno, Alex
Great work as always, thanks.
At the ND DMR site, clicking on the info tab, then the ‘Presentations’ choice, one can download the financial presentation (7/20, I think). Slide #26 has a good description of the timeframe for a typical ND well. While it is geared towards truck/road usage, (Watcher, take note), one can get a sense of the activity/chronology of a Bakken well.
“North Dakota is considering allowing drillers to temporarily abandon wells that have been drilled but not yet fracked. Under current rules, drillers must complete wells within one year after they are drilled. There are currently some 900 wells that are awaiting completion. Lifting the requirement that they be drilled within the next year lifts a major financial strain off the drillers.”
Enron accounting?
No, that’s a mini bailout. Regulatory.
There has to be a bailout of the industry dies, absent an oil spike.
Note that the supply/demand people have forgotten Libya. One of those things that could generate flow at a moment’s notice, and high diesel flow.
The OPEC and Russia are hurting theory pretty much dabbles into the world of “if you make less than you were making, you’re hurting. Is there anyone out there who thinks Russian conventional flow can’t be profitable at $45? How about Ghawar? Anyone think they are losing money on flow from Ghawar at $45?
They make less than they were. That’s not a loss. Government spending becomes excessive, but that’s not a loss on oil flow. That’s a loss on fiscal policy. Both countries have rather a lot of years of reserves they could use to fund spending, and saw an article on the Russian royalty tax recently and how it may be tweaked to increase government revenue. Rosneft is mostly government owned. No reason they can’t do this.
As for the price, let me once more note the quote from KSA . . . “we will not allow ourselves to lose market share.”
What does that mean for a place that is only selling 1 mbpd to the US? Their share of the US market is essentially 10% of US imports. What market share are they in danger of losing? It can’t be the US. That market for their exports doesn’t exist.
China gets 19% of its oil imports from KSA. 9% from Russia. THAT is the market share to concern them, and I suspect THAT is the price they had to match. Russia is food self sufficient and car self sufficient. They can tweak their royalty tax and spend cash reserves, and it is THEY who were sanctioned and have every incentive to retaliate. It is THEIR price KSA has to match to protect market share, and it doesn’t have to have anything to do with supply or consumption.
Watcher Wrote:
“Note that the supply/demand people have forgotten Libya. One of those things that could generate flow at a moment’s notice, and high diesel flow.”
I don’t think so:
U.N.-Brokered Libya Peace Talks Teeter on Collapse
http://www.wsj.com/articles/u-n-brokerered-libya-peace-talks-teeter-on-collapse-1442855145
Thousands of refugees from the Libya region are heading to the EU. Libya is in a state of anarchy and probably will remain that way for at least a couple of years until one of the factions wins control.
Hi, I have a question for all:
I remember that back in 2010 at TOD people were showing convincing calculations that for Natural gas to be profitable, a price of $6-8 was needed. In 2011, the rigs were switched over more and more to oil. Yet, the ng production continued to grow, price fell and never even came close to $6. There are / were not a lot of bankruptcies in the gas patch, although there are/were a lot of companies skewed toward gas.
What is the reason(s) for this?
My best explanation is the ever increasing amount of associated gas. But is this enough?
If shale oil reacts in a similar way, there will be years of low price.
Any ideas welcome!
It might be worthwhile to review the earnings of the more shale gas weighted companies, look at the price per mcf during each quarter/year, and see how profitable or not the companies were/are. Cash flow positive/negative would also be worthwhile.
My concern is what you bring up, shale gas has depressed gas prices for years, why not oil? Granted, NA gas is stranded, but so is NA oil. However, US imports a higher percentage of oil from outside NA than it does gas.
I think, much like our governments, public companies can limp along for years losing money, as long as those financing them allow them to stay alive.
I still think OPEC and Russia are underestimating just how long US shale and Canadian tar sands will depress oil prices, absent those organizations/countries intervening. However, some here argue OPEC and Russia are doing just fine at current oil prices, so therefore, if that is true, I agree there would be no need to intervene.
As I just noted, NGLs can fund natgas.
There is no similar 2ndary (primary) output of something else from oil wells that can fund the oil well and define low priced oil.
The explanation is NGL flow from shale gas wells. NGL funds the effort. Natgas is a byproduct, somewhat.
“I remember that back in 2010 at TOD people were showing convincing calculations that for Natural gas to be profitable, a price of $6-8 was needed… There are / were not a lot of bankruptcies in the gas patch, although there are/were a lot of companies skewed toward gas. What is the reason(s) for this?”
Likely lots of borrowing and investors chasing fake Alpha.
The Dim Outlook For Chesapeake Energy
http://www.forbes.com/sites/christopherhelman/2015/08/10/the-dim-outlook-for-chesapeake-energy/
My guess is that when the LTO drillers start rolling over into Bankruptcies, so will the gas drillers.
Florian,
I often ponder the same thoughts. In my mind, there is no doubt that a lot of produced associated gas helped to depress natural gas prices. But also, there is a lot of gas coming out of the Marcellus and Utica. I think some of the overproduction can be attributed to companies like Cabot who I suspect used very low cost Marcellus gas to subsidize its Eagle Ford program. Cabot once had a well balanced portfolio of oil and natural gas projects spread across the Rockies down to the Permain Basin and the Gulf Coast and then up to the Appalachian basins. Now I think it only has assets in the Marcellus and Eagle Ford.
Cabot had legacy assets in the Marcellus area that dated back almost to the days of
Colonel Drake that allowed then beat most of the competition. I was told by a Cabot geophysicist about 6 years ago that it could produce some Marcellus gas for .75/mcf and make money. I guess those days are here.
But someday soon I think these pubcos will regret abandoning the 3 legged stool portfolio asset balance
Somewhat off topic but we all owe Ron big time for running this forum in such a way that diverse points of view and opinions are tolerated.
A few days back I posted a question at ENERGY MATTERS to the effect of asking the opinion of the regulars there what they think batteries similar to a POWERWALL will cost in five to ten years in constant money.
I got four or five responses about a lack of lithium and the price of lead and the impossibility of building battery capacity enough to run the national economy and all that sort of foolishness.
So –
I posted this reply :
Every body who commented in answer to my question as to their estimation of the future cost of batteries dodged the actual question.
The chemistry of lithium ion batteries may or may not have reached fundamental limits. The actual manufacturing process is still in short pants in terms of incremental improvements that will result from scaling up manufacturing.
The cost of internal combustion engines in relation to the durability, performance, and fuel consumption per horsepower hour of operation of these engines has been falling for a century now and continues to fall.
The fundamental engineering has remained about the same the entire time, all the improvement has been from incremental improvements.The price per horsepower, and price per horse power hour are at all time lows , and kWh of work per unit of fuel consumption is at an an all time high.
Now to answer the question, If any of you naysayers DARE answer the actual question.
How much do you guys think it will cost to buy a large rechargeable battery comparable to a Powerwall in five to ten years in present day money?
No dodge ball.
Lithium might go up let us say five times between now and then. Add that it to your estimated price. It doesn’t take a hell of a lot of lithium to manufacture ONE such battery, only a few kilos are needed for one big enough to run a car eighty miles.
It appears to me that if the cost of such a battery falls by half or a little more, and it lasts ok, it will make excellent financial sense for a person paying high demand rates and low off peak rates to buy one.
Warranties are important to be sure- but both my old car and my old truck have outlasted the factory warranty by a factor of five.My el cheapo smart phone had a twelve month warranty and is still going strong at twenty four months.
There is no question at all that fossil fuels deplete and over any extended time frame will cost more and more in terms of constant money.
Oil cannot be recycled except for lube oil.
Lithium can be recycled.
At some point batteries are likely to sell for so little that they can be economically used for household and small business demand management.
It is true that building enough batteries to manage demand on a national business as usual basis is a pipe dream.
It is also true that that the idea we can continue to rely on gas and oil long term is a pipe dream as well. World wars have already been fought as much for access to depleting natural resources as for any other reasons.
I am interested in hearing the opinions of any regulars HERE, especially ones with engineering or large scale business management backgrounds. How much do you guys think a battery similar to a POWERWALL will cost in five to ten years in constant present day money?
Dear Farmer
Apple just indicated it will build an electric automobile.
Don Stewart
I hope it does not come equipped with Apple maps!
OFM Asked:
“How much do you guys think it will cost to buy a large rechargeable battery comparable to a Powerwall in five to ten years in present day money?”
Any decreases in manufacturing costs will likely be negated by rising costs for raw material (ie Lithium) as demand increases.
“Lithium can be recycled.”
My guess is that Lithium in batteries will probably not be economically recoverable, or its likely be be significantly cheaper to mine lithium than recycle it.
http://www.waste-management-world.com/articles/print/volume-12/issue-4/features/the-lithium-battery-recycling-challenge.html
“Due to less demand for lithium and low prices, almost none of the lithium used in consumer batteries is completely recycled.”
[So it appears costs to recycle Lithium from batteries is considerably higher than mining!]
Anthor potentional issue with Lithium (from same article):
“almost 70% of the global lithium deposits are concentrated in South America’s ABC (Argentina, Bolivia and Chile) region. This poses an inherent risk due to the accessibility of the raw material that is available only in a specific geography. Unrest or instability of the governments in these regions can greatly affect the supply”
So as the Oil supplies decrease when depletions grips global production, its very likely that these regions will become increasing more unstable. Most of South America is now a basket case. I would imagine this will only become more severe in the future.
FWIW: Forget about Lithium saving the economy. Any mass-scale production of battery storage will need to original from better designs that use much cheap and abundant resources. I doubt that there will be a viable replacement until a new storage tech is developed that does not use chemical reactions with the electrodes. As long as the electrodes participate in the chemical reaction, batteries will always degrade and fail too quickly as a replacement for fossil fuels.
A gold exploration and mining company has agreed to purchase a potential site for excavating lithium in Nevada, citing the “great deal of attention” brought onto the state by Tesla’s decision to locate its mammoth manufacturing facility there.
http://storage.pv-tech.org/news/tesla-interest-could-spark-new-nevada-gold-rush-for-lithium
What is the cost to extract Lithium from Nevada compared to other locations outside of the US. Not all Lithium mines are equal
http://fortune.com/2015/04/26/lithium-mining/
“According to Anderson, Western Lithium, like many new lithium operations, simply aren’t working with the right raw materials. Though lithium isn’t rare in the environment, the cost of extraction varies greatly with its concentration and form. With existing technology and present prices, truly profitable lithium comes only from the evaporation of highly concentrated brine.
Those sorts of brine deposits are nearly all in southwest South America, and controlled by established players… Albermarle is developing lithium brine holdings around Magnolia, Arkansas—the only American deposits that Anderson allows might make economic sense in the near future. ”
[So an analyst that studies lithium mining does not believe Nevada’s lithium mine will be economical in the long term since it ore concentration is too low]
FWIW: I think the gigafactory will fall, probably within two years of operation or less, unless its bailed out by the federal gov’t.
Did you weigh the batteries in an electric vehicle with theoretical 100 mile range?
http://www.springer.com/cda/content/document/…/9781461401339-c1.pdf?...
In this chapter, the fundamentals of EV battery technologies will be addressed …. battery pack larger than 100 kWh that can weigh over 900 kg. Nevertheless, it is.
It’s not how much the Battery costs. It’s the Cost per cycle.
We are deploying “pancakes” in PV System now.
Tesla Model S has taken a big byte of the Luxury Car market and existing suppliers are not going to have it. Note BMW plans to says BYE BYE to ICE in 2020. Much work going into Super Life Anodes.
Such as http://www.scib.jp/en/product/index.htm
10,000 cycles to 80% Capacity.
Few Lead Acid still have 80% Capacity at 250 cycles.
Thanks but you guys didn’t offer your opinions or estimates of future battery prices either, lol.
I think there is at least a slim possibility that we can adapt to more expensive oil in smaller quantities year after year for some time without oil being the direct cause of a really bad economic crash. In the short to medium term, out to five or ten years, we can’t really do much about our lifestyles, but in the longer term we will learn to live in the city or very close to the city and just about do away with oil burnt simply to get to work. And in the shorter term, we can most certainly finish junking out almost all of the cars and trucks built prior to the mid nineties which will substantially improve the fleet fuel economy average in combination with new more fuel efficient vehicles.
There is a hard crash coming, it is without a doubt baked in, and scarce expensive oil will certainly contribute to it in a major way. But if Dennis and others who think oil supplies will decline slowly turn out to be right, oil is not apt to be THE straw that breaks the camel’s back -barring bad luck.Between electrification, conservation, improved efficiency , lifestyle adaptations and coal to liquids we can skinny past peak oil – with a lot of luck- at least in countries such as the USA.
A hot war started over oil, or a war that shuts down international trade in oil for an extended time, might be the beginning of the end.
OFM –
I don’t have a clue on where LION battery costs might go, but Tesla thinks it could drop to $100/kWh by 2020. Current costs are guessed at north of $600/kWh, but no one is really willing to say how much they are actually paying. The power wall may not drop to 1/6th the cost, though. Power electronics (battery charge controller, power inverter, etc.) continue to drop, but it hasn’t been with quite as steep a curve as Tesla believes. The EPA is looking at a much higher cost. Predicting battery prices appears to have the same throw-the-dart rigor as predicting future oil prices.
http://www.hybridcars.com/tesla-projects-battery-costs-could-drop-to-100kwh-by-2020/
Future battery prices will be 10 % lower than today’s prices. Technology improvements will be offset by depletion of battery commodities such as lithium.
Actually, a careful reading of BMW’s release shows that they expect that all their vehicles will have electric drives in them. Not necessarily electric ONLY. They are aggressively developing various hybrids, many plug-in type. There was a reason back in 2011 they they poached Frank Weber, one of the top engineers who developed the original Volt, from GM. BMW’s conversion is driven as much by EU future emissions requirements as by Tesla’s competition. Audi has also made a 180 degree turnabout. A few years ago, they claimed they’d never develop an EV or hybrid. Now they have a whole e-tron line of hybrids and plug-ins.
From NASDAQ’S site: ” German luxury car giant Bayerische Motoren Werke AG or BMW Group (BAMXY, BAMXF, BMW.L) is looking to go all-electric over the next 10 years due to the upcoming stricter carbon emission laws. Virtually every BMW model would be converted to electric drivetrains, including range-extending engines and plug-in hybrids.
The transition will see even the company’s top-selling 3 Series sport sedans turned into plug-in hybrids.”
http://www.nasdaq.com/article/bmw-all-models-electric-within-decade-20150629-00597
Integration of the ICE in an E Drivetrain as necessary. ie. Trucks. I read long ago that the Auto Industry was 10% of the US economy. Seems like more auto parts stores than drug stores. Two things for Certain- Electric cars could be much simpler than ICE cars and the 1st Gen of eCars are anything but simple. For sure – Please no Micro$oft car.
Guess it’s possible for Electrochemical Energy storage could fall to add only 50% additional cost per kWh. That’s assuming kWh’s continue to increase.
Price: Here’s one projection.
So we’d estimate that at the following battery prices we’d get the following effective LCOEs:
– $300 / kwh battery : 33 cent / kwh electricity storage
– $200 / kwh battery : 22 cent / kwh electricity storage
– $150 / kwh battery : 17 cent / kwh electricity storage
– $100 / kwh battery : 11 cent / kwh electricity storage
http://rameznaam.com/2015/04/14/energy-storage-about-to-get-big-and-cheap/
Given the European global warming mania, a plug in hybrid may indeed be the better choice for rich folk. The common folk will have problems with the plug in, because many of them park on the street. But over time I assume parking garages will have the plug with a meter one can pay with a cell phone app.
Interesting article on Institute of Electrical and Electronics Engineers site, IEEE.org, by Vaclav Smil, which argues oil price needs to be adjusted for both inflation and oil intensity. Oil intensity traces oil used per unit of GDP.
Article argues with this adjustment, the oil price peaked in 1980 at $88 per barrel WTI and in 2014 was just $34.50. Further states that by 1985, US needed 35% less oil to produce the same unit of GDP as required in 1970 and by 2014 needed 62% less oil to produce the same unit of GDP as in 1970.
Jesus . . . GDP?
Here’s the GDP equation:
Y = C + I + G + (X − M) private Consumption, Investment, Govt Spending, (Exports – Imports)
The US has been running big deficits for years and years. That involves G above. Recently, the defs have been funded with Fed QE. Print money, lend it to the government, cover the borrowing for the deficit and declare the spending part of GDP.
Given that it’s being created whimsically, how can this be a valid way to measure anything having to do with oil?
It’s really sick, isn’t it, how GDP, and the maximization of GDP, have become sacrosanct?
It’s the triumph of the utility or price theory of value.
If the US spends $800 billion a year on its military, then that expenditure just is, no quesitons asked.
If the US spends more than any other country in the world per capita on police, surveilance and imprisoning its own people, then that expenditure just is, no quesitons asked.
If the US spends more than any other country in the world per capita on the most corrupt and inefficient health-care system in the world, then that expenditure just is, no questions asked.
If the US spends more than any other country in the world per capita on its finance sector, which has converted from being a productive force to a cancer on the economy, then that just is, no questions asked.
More than 50% of US GDP is spent on things which have nothing to do with human flourishing or the well-being of the American people.
But none of this matters. To question the expenditures is heresy, because according to the hallowed tenets of the price theory of value, the price is righteous.
But all of it does matter a great deal, of course. That’s why I keep saying that it is insane to say we can’t afford a quick switch to solar, which I think we just have to do to save the biosphere, when all we would have to do to get it done fast and easy would be to reallocate those useless bloats you mention to what really counts for the national, and global welfare.
Politically impossible? Of course it is, almost as impossible as for us guys raised in the rural south to even come close to thinking that anyone with the faintest hint of african ancestry could get to be POTUS. Outtuh sight, man!!
Wimbi,
The problem as I see it, is that American capitalist and corporatist culture inculcates children born here to think of the mountains and the forests as a pile of resources to be mined for profit by a small group of property owning elites, as the only way that our society and civilization can be structured.
There is no deep connection here to nature and very little general knowledge about the biosphere or the concept of the true commons on which everyone depends equally. This is a culture where people think their food comes from the fast food joint or maybe the supermarket and nature is the fountain at the shopping mall surround by potted palm trees and a few pigeons. To get energy all you have to do is turn on a light switch or plug something into a socket or stop at the gas station to fill up.
Furthermore our culture teaches us, that other cultures, that might still see that mountain as the home of the spirits of their ancestors and therefore a place to be revered are just ignorant and primitive people who need to be civilized for their own benefit. Imagine many of those poor schmucks don’t even have electricity and they still live off the land.
The dominant corporatist global culture has been very successful in eliminating other more ecologically benign cultures all over the planet.
Saving the biosphere by switching to alternative energy and less exploitative ways of living is not merely a political non starter with the vast majority of Americans, it is above all else an assault on our most cherished and deeply held cultural and national beliefs. This is the essence underlying our supposedly non-negotiable lifestyles. We want our big Macs and oversized sodas and we are damned well going to get them by driving our F-150 pickups over to the drive through.
That’s not to say, that many of us, can not already see that those beliefs and that culture are no longer beneficial or useful in this new world order of too many people and too few resources. There is a small minority that clearly sees the writing on the wall and is ready to embrace the necessary changes.
Most rational people when taken individually can understand that this cultural paradigm is now harmful to our continued survival and it must be discarded. However to society and collectively it is still almost completely unthinkable. The old cultural paradigm is too deeply ingrained in our collective consciousness.
Nevertheless paradigm change is already happening in many places and it will only gather more and more steam.
All true. But I have this little private puzzle. Do I live in some sort of special place? Hard to believe, but lots of people around here are working hard and effectively to get off the old and on to the new paradigm. And they are actively seeking other like-minded communities to join.
I asked our mayor, a very intelligent guy, trained as a biologist but with a natural gift for the best kind of politics , and widely traveled, if this little place was or was not a fair example of what’s going on in the whole country, and he gave the answer most politicians don’t seem to be able to do — “I don’t know”.
Wimbi,
you wrote:
Do I live in some sort of special place?
You bet you do! You have a mayor who is an honest man!
Now that alone is about as special as it gets. 🙂
Shallow Sand,
a few posts back you were inquiring about the “timing” of oil prices coming back up.
In response to your comment I wrote:
“There will be no increase in prices…don’t wait for it.
Except for a the volatility of “..a bomb went off here…” and “… a war broke off there…” news, there shall be no $200/brl oil…
…it is going down and, when Yellen and Co. lose control and what was left unfinished in’08-’09 resumes, it is going down and off….permanently!”
-Well, lo & be hold your wish is possibly going to be granted!
Now that theRuskies are inSiria OVERTLY (of course to fight terrists…just as we are…ha, ha, ha!) andRuskie embassy and air base was attacked by terrists who, eventhough smell and eat poorly, seem to have pretty accurate satellite imagery of military installations (highly likely made by satellites paid for by mine and your tax dollars…that’s the sad part: theRuskies are the good guys nowdays…Jefferson is rolling in his grave!!!),
other “incidents” and “accidents” are about to happen…again: nothing to do with gas pipelines, but only to save the innocent refugees and fight the terrists(…ha, ha, ha!)
Careful what you (and I) wish for!
That increase in price is likely to come with “perks” that will make it worthless!
Be well,
Petro
Have been looking for Rosneft information.
Trying to figure out specific information about their production, given BOEPD is 5.2 million and BOPD is 4.16 million.
One of their larger fields is Samoltor, the giant discovered in 1965. This field produced 3.4 million bopd at its peak. Last I can find is 2012 produced 358K bopd from about 8,300 wells plus about 2,700 injectors. Produces from sandstone formation at about 7,300′. Appears to now produce a lot of water, many wells on ESPs. Looks like production there was 454K bopd in 2008, so declining more than a little, at least through 2012.
Can’t see how total costs, including CAPEX in this field could be $3 US, even with currency devaluation.
Can’t find where Rosneft publishes financial info other than in general terms. Nothing like 10Q or 10K in US.
I am skeptical of both Russian and Gulf OPEC OPEX and CAPEX claims. Why? Because I have never known an oil producer to not exaggerate lower both OPEX and CAPEX if he thought you wouldn’t see or figure out the actual numbers.
These countries are producing a large part of their oil from old fields where secondary and tertiary methods are common.
For example, I have yet to see wells with ESPs in US be low cost. To me, ESP=mucho produced water.
Rosneft’s press release with financial info for 2014:
http://www.rosneft.com/news/pressrelease/04032015.html
It claims OPEX at $3.9/boe and CAPEX at $5.3/boe.
A bigger report:
http://www.rosneft.ru/docs/report/2014/en/main.html
According to this page:
http://www.rosneft.ru/docs/report/2014/en/upstream/locations.html
Samotlor output was 433K bopd in 2014.
Thank you for the links!
Shallow sand,
Samotlor was an asset of TNK-BP. Rosneft acquired TNK-BP in 2013.
AlexS. Thanks! I have been trying to educate myself re Rosneft.
Those of us in the US tend to focus only on what is happening here.
It looks to me that the US sanctions hurting the Kara Sea project is a very big deal, maybe a bigger deal in the long term than the US leading the lifting of Iranian sanctions. At least we’re oil production is concerned.
Also read about the debts Rosneft has coming due in 2015 and how it has secured financing. Seems ironic that we discuss bailouts of US shale here. Appears Russian government rejected Rosneft bailout proposals and encouraged company to look for private refinancing and/or issue more shares.
Given Rosneft produces over 4 million bbl per day, maybe more attention should be paid the company by those of us here. I am going to keep reading. Any links that are helpful greatly appreciated.
shallow sand,
I put together some numbers, which show how Rosneft (and its Russian peers) were able to largely mitigate the effects of lower oil prices thanks to a sharp depreciation of the ruble and lower upstream taxes.
AlexS. Thank you very much for the information.
I did read that a large part of Rosneft debt is due to the company purchase you describe.
Although the debt is high, nothing like US shale on a per bbl and per BOE basis. Further, much more stable low cost production than US shale, so better assets securing the debt. Also, like XOM, midstream and downstream assets that US shale companies generally do not have.
What are the primary reasons that OPEX and CAPEX are so much lower than US and Canada, besides currency issues?
Cheaper pay. Things are run a bit sloppier, workers are used to work long hours, are fed cheap food. Camps suck.
shallow sand,
You asked: “What are the primary reasons that OPEX and CAPEX are so much lower than US and Canada, besides currency issues?”
You know, that conventional production is less capital intensive than LTO or oil sands.
LTO requires constant investing just to maintain flat production due to high decline rates.
Oil sands projects require huge upfront capex.
In Russia, significant part of capex is maintenance capex aimed at slowing decline rates at mature fields.
Besides, Russian mature fields are “less mature” than most old US fields.
And yes, Fernando is right, workforce is cheaper.
As such, I think capex per barrel for US conventional onchore projects isn’t much higher than in Russia
“What are the primary reasons that OPEX and CAPEX are so much lower than US and Canada, besides currency issues?”
SS,
Primary reason is monetary imbalances are out of whack.
here is very simplistic Canadian version:
$30 (Western Canadian Select) per barrel has to pay for $60k for new F-150, $300k and up for minimal housing dwelling other than igloo and that is in the Canadian boonies, and minimum $400 per day to have somebody with pulse come and actually do the work. All that is not going to happened with $30. Even with oil at $100 it had to be supplemented with debt and it was just threading the water.
You tell me, which costs above you want to try to reduce and I will tell you who is going to default next week: real estate/construction, car manufacturing or general employment.
AlexS. I think Ves has a good point.
In 1990s up to about 2005 we would have been very happy with $45 WTI. Costs in North America skied.
What does a 7,300′ vertical well cost to drill, complete and equip in Russia?
What is a typical pumper’s salary? Is there health insurance, worker’s comp insurance, liability insurance in Russia?
I agree the tax structure is very different between US and Russia, and at $100 oil takes away almost all the upside for Russian producers.
We likely won’t pay any income tax this year attributable to oil, the way things are going. Have paid at high rates in prior years, but not as steep as Russia.
“What is a typical pumper’s salary?”
$1-2k/month at today’s exchange rate. Extremely good by Russian standards. The employer additionally pays ~50% of that as various taxes and insurances if the employee is officially hired.
That would. Be about 20-40% of what an experienced one makes where we are.
Rosneft has the highest debt among all the Russian oil companies (in fact, others have relatively small debt load).
Rosneft’s debt is a result of the acquisition of TNK-BP, rather than overly aggressive organic capex. The company was and remains cash positive, which helps it to gradually pay down debt.
A couple of years ago now I received a phone call from a business selling silver contracts. They had one for sale for 33 dollars for a Troy ounce of silver. I informed the sales associate that in my opinion silver was going to be 25 to 28, the price was dropping. Hence, the phone call, finding buyers, fishing for suckers. Today I can buy silver for under 15 dollars. Had I paid 33 USD for the contract, I’d cry every single day and rivers of beer would flow like wine. It’s second instinct to know when not to do something as foolish as buy high, live through the misery of a prolonged low price environment and be forced to sell low. I hate it when it happens to me.
Silver has remained at 15 dollars for quite some time at this point and it looks stuck. Kind of tough to sell silver at 50 USD when it sells for 15. If it is a numismatic, then you might have something.
The price of oil is a similar story, the price fell enough to make it hurt, why should the consumer pay 100 when it’s for sale for 45? Not too difficult to see that buying at a lower price will be of some benefit to some someone.
One difference between the silver market and the oil market: In the current oil price environment, there are buyers looking to buy oil properties, mineral rights, they want what might be for sale, a deal. They’re out there fishing to see who might bite. They want to buy, not sell. They’re out there buying, not selling, which means there is money somewhere.
Somethun fishy ’bout dat.
An acquisitions oriented oil and gas company just announced that they are building a new 21 story tower in downtown Fort Worth, Texas.
They are tossing money away. They would do better with a two story office in Plano. Or they can go to Greenspoint in Houston.
I don’t know if anyone has posted a link to David Hughes’ latest paper. If not, here is a link and an excerpt:
TIGHT OIL REALITY CHECK
REVISITING THE U.S. DEPARTMENT OF ENERGY PLAY-BY-PLAY FORECASTS THROUGH 2040
FROM ANNUAL ENERGY OUTLOOK 2015
http://www.postcarbon.org/wp-content/uploads/2015/09/Hughes_Tight-Oil-Reality-Check.pdf
Jeffrey,
thanks for the link
IMO, David Hughes is asking some excellent questions, and I think that a key question is whether tight/shale plays will be commercially productive in higher operating cost areas around the world.
Based on US data, it seems to me that tight/shale plays tend to be either gas prone (both dry and wet gas) or mostly non-commercial, e.g., the Monterrey Shale Play. As David Hughes noted, the new tight/shale plays that tend to be commercially productive with crude oil are relatively rare. Excerpt from his summary:
In the Bakken, we are seeing an average (C+C) production rate of a little over 100 bpd with a median production rate of less than 100 bpd, with an overall rapid decline rate. I wonder whether production profiles like this will work in higher operating cost areas around the world–especially given that the Eagle Ford and the Bakken are so far relatively rare.
The recent Polish shale play case history could very well be the norm, rather than the exception, globally:
http://www.bloomberg.com/news/articles/2015-05-11/russia-was-right-shale-in-europe-has-proved-a-dud
Also, I think that a lot of analysts are underestimating how long it will take for US oil and gas companies to get up anywhere close to the drilling and completion numbers that we saw last year, given the loss of personnel (some permanent) and given the loss of and degradation of equipment, plus a more difficult financial capital environment going forward.
Maybe Russia would be a low cost area for shale, given OPEX and CAPEX appear to be much lower than US for similarly situated onshore production.
I’m not sure. Unlike conventional projects, LTO production could be more costly in Russia, especially at initial phase of development.
LTO well costs in the US fell substantially after all necessary infrastructure was established and production reached large scale.
While I find these exercises from David Hughes interesting they are also a bit disappointing. All they do is hold the EIA up to well deserved ridicule. What would be nice is an updating for each geological formation of the well productivity over time and a corresponding update to the projected recovery based on more current drillinginfo data. Yes we know the EIA is wrong but please give us a view of what is a more accurate understanding.
In the post before the first pair of open threads, I asked about how the EIA arrived at the numbers for their forecasts. My question was in relation to a forecast for wind and solar that had growth grinding to a halt in 2017, in contrast to oil production forecasts showing world oil production growing steadily through 2040 {See http://peakoilbarrel.com/the-eias-international-energy-outlook-2014/ ). David Hughes’ paper suggests that there is some actual method to their madness but, for all I know, they may as well have pulled those forecasts out of their collective asses. AFAIAC any forecast that does not include the effects of a reasonably near term peak (0-5 years) in world oil production, needs to explain where all the oil that is going to be needed to overwhelm legacy declines is going to come from.
All I know about the oil and gas industry is as a result of this web site and before it, theoildrum.com . Yet I feel sufficiently empowered to call bullshit on these EIA forecasts, with all their fancy, shmancy models. For all I know, it seems Webhubbletelescope and Dennis have developed more reliable models!
When the EIA forecast vary as radically as they do from one year to the next they are implicitly telling telling you that their forecasts are bullshit. Almost half of the projections for a given year and formation were changed 50% or more. Six of them were increased by 200% or more, absolutely nuts.
Good example – US LTO production forecasts from the EIA Annual Energy Outlook
Is this having an effect on exploration / production?
The divestment effort—the now-global movement that pressures institutions to drop their investments in fossil fuels—continues to grow at a breakneck pace. A new report from Arabella Advisors, a philanthropic advisory group, tallies the total assets committed to fossil fuel divestment worldwide at $2.6 trillion. That’s a fairly astonishing figure, considering that at this time last year, that figure was a mere fraction of that.
http://motherboard.vice.com/en_uk/read/divestment-has-pulled-26-trillion-dollars-out-of-the-fossil-fuels-industry
Executive Summary
To date, 436 institutions and 2,040 individuals across 43 countries and representing $2.6
trillion in assets have committed to divest from fossil fuel companies. The divestment
movement has grown exponentially since Climate Week in September 2014, when Arabella
Advisors last reported that 181 institutions and 656 individuals representing over $50 billion
in assets had committed to divest. At that time, divestment advocates pledged to triple these
numbers by the December 2015 Paris UN climate negotiations. Three months before the
negotiations, we have already witnessed a fifty-fold increase in the total combined assets of
those committed to divest from fossil fuels.
http://www.arabellaadvisors.com/wp-content/uploads/2015/09/Measuring-the-Growth-of-the-Divestment-Movement.pdf
For investors, keep in mind that these “movements” when they reach critical mass provide outstanding buying opportunities in the shunned companies. Likely not there yet. Reminds me somewhat of the rush to sell all South African stocks/assets during apartheid (was not an investor then).
so, still plenty of buyers?
If there is an increase in the sales volumes, will this push prices down? Will that affect the stock valuations and thus perhaps the ability to secure financing?
Not sure what your question is. In any transaction, if there is a seller, there is also a buyer.
Are you asking if I think today is a good day to buy fossil fuel stocks? Certainly better than many days in the past, but likely not as good as days ahead is my opinion.
Question for anybody.
Who has an estimate as to the amount of oil being produced today that is costing MORE to get it out of the ground and to market than it is selling for?
Apparently the actual day to day operating expenses of a lot of producers exceeds their daily revenue, but I have not seen an estimate as to the amount of oil that is produced daily that costs more to produce on a daily basis than it sells for on the same basis.
Then there is the question concerning the amount of oil that costs more in TOTAL to produce than it is selling for. Some producers are obviously cash positive from one day to the next but deep in the hole when taking into account the money they spent on mineral rights, drilling and so forth. What portion of the oil on the market might fall into that category?
I do understand that precise answers are out of the question but even a wild assed guess is better than nothing- and I am too clueless to make even a wild assed guess.
Farmer
shortonoil (BW Hill) has given a number of estimates of the kind of things you are asking about. He comments over at Peak Oil News.
For example, today he stated that oil company equity has declined by 50 percent since the fall in oil prices, and that many oil companies no longer have any equity at all. That is, take the reserves and multiply them by the current price, subtract the debt, and there is nothing left.
He has been critical of Wall Street claims that oil could go to 20 dollars, giving estimates of how much oil currently being produced cannot cover its lifting costs at 30 dollars.
You might try to ask him….Don Stewart
My wild guesses, OFM.
At $45 WTI 3-5 million bopd is losing on an operating basis.
As far as what drilling projects are not losers at $45 WTI, in North America I think about one in five will pay out in 60 months at that price, which is how I define success v failure on a new well.
World wide I’m not too sure.
I can tell you about our little neck of the woods, which probably is not representative of much.
Continuos production here for over 100 years. Many original wells still producing. I’d say about half of the leases, maybe more, are losing on an operating basis, when everything required to keep them going is included. We range from $5 to about $70, and I suspect if you go well to well or lease to lease, that is what you will find everywhere in the world. I bet even KSA has a dud or two.
Bakken well lease operating statements I have reviewed have been below $1 up to about $55 for example.
I’d say where I am at no drilling makes sense. This year I have observed two wells being drilled within a 50 mile radius of my home, one was a salt water disposal well. I have heard of a few others, but I think many permits were allowed to expire.
I personally have only lost for the year on an operating basis once on oil production, in 1998. This year appears to be number 2. I guess that is not a bad record, but after 2011-14, it has taken some getting used to.
Hillary finally came out against the Keystone Pipeline to save the planet from “Climate change.” Now, hopefully, she will promise to do something meaningful. Like, immediately banning fossil fueled auto’s, airplanes, home heating and cooling, manufacturing, agriculture, ethanol, etc. This would immediately SAVE the human race and the planet. Forty acres and a mule would save us all for thousands of generations to come. Our grandchildren could live in harmony with nature. Maybe a million or two could survive, but the Earth would be safe. No longer would it be acceptable to keep warm with a lump of coal, or a wood fire [both fossil fuels]. Humans need to take advantage of the Earth’s natural benefits. Move towards the Equator. The Garden of Eden provided.
Having won the “war on drugs” and the “war on poverty,” time to move on to the “war on fossil fuels” – after all, how many would be against those wars?
There’s even a war on air. Everyone knows it’s Peak Air and its all downhill from here. Sarcasm alert, however, the War on Air is probably the next war du jour.
H. L. Mencken said it best:
“The whole aim of practical politics is to keep the populace alarmed–and hence clamorous to be led to safety–by menacing it with an endless series of hobgoblins, all of them imaginary.”
“Law and its instrument, government, are necessary to the peace and safety of all of us, but all of us, unless we live the lives of mud turtles, frequently find them arrayed against us…”
https://mises.org/library/hl-mencken-liberty-and-government
Move towards the Equator. The Garden of Eden provided.
Great idea! Just don’t forget to bring your own water, lots and lots of it…
Some oil price predictions
The Economist Magazine ran their “Drowning in oil” cover story in early 1999, in which they suggested that we would see $5 to $10 oil for the indefinite future.
At the time of the story, annual Brent crude oil prices were then in the early stages of three approximate price doublings:
From $13 in 1998 to $25 in 2002;
From $25 in 2002 to $55 in 2005;
From $55 in 2005 to $110 range for 2011 to 2013 inclusive (about $99 for 2014).
And . . . .
In late 2004, Daniel Yergin predicted that oil prices would be down to a long term index price of $38 by late 2005 (which caused me to suggest that we price oil in “Yergins” with One Yergin = $38).
Also in 2004, the Saudi oil minister reiterated their support for the OPEC price band of $22 to $28.
In August, 2009, Michael C. Lynch predicted that oil prices would soon be back to a long term price in the low 30’s.
In early February of this year, Ed Morse predicted that oil prices could fall as low as the “$20 range for a while.”
These various oil price predictions ranged from a low of $5 (the Economist Magazine) to a high of $38 (Yergin).
The sustained three year annual high Brent of $110 that we saw from 2011 to 2013 was about three times the highest price predicted by these various prognosticators, and annual Brent prices, inclusive of 2015, have been above $38, mostly well above $38, since 2005. Note that the average oil price prediction for this group was for a price of about $25.
Economist Magazine, March, 1999: The next shock?
http://www.economist.com/node/188181
Leningrad Cowboys:
https://www.youtube.com/watch?v=maOtX4tXyb4
Rear view mirror.
That happened only 22 years ago in Finland, pretty amazing! The red Army Choir singing with the Leningrad Cowboys. I’ll bet a heck of a lot of vodka was consumed at this event.
Meanwhile on the ground in Sao Paulo traffic is flowing only 64 km of traffic jams this morning and gasoline, diesel and ethanol are being consumed in large quantities with correspondingly large quantities of CO2 emissions flowing into the atmosphere. It’s going to be a scorcher today, not a cloud in the sky…
Note the screen capture ate the 64 Km but the word ‘lentidão’ means slow…
Jeffrey. Add to your story Goldman Sachs call for oil below $50 WTI until 2030.
Link to my supply side comments, focusing on crude oil versus liquids associated with natural gas production, plus some net export data:
http://peakoilbarrel.com/jean-laherreres-bakken-update/comment-page-1/#comment-534101
IMO, there is a very good chance that refiners next year are going to be scrambling, trying to obtain sufficient actual crude oil feedstock.
Three interesting articles on US refineries and inventories that various people have posted this year:
U.S. refiners turn to tanker trucks to avoid ‘dumbbell’ crudes (March, 2015)
http://www.reuters.com/article/2015/03/23/us-usa-refiners-trucks-analysis-idUSKBN0MJ09520150323
Subject: COLUMN-U.S. crude inventories might be tighter than they look: Kemp (September, 2015)
http://uk.reuters.com/article/2015/09/08/usa-crude-storage-kemp-idUKL5N11E2YE20150908
Traders Scramble for Sweet Crude on Gulf Coast Awash with Heavy Grades (September, 2015)
http://www.downstreamtoday.com/news/article.aspx?a_id=49158
For the reasons I have previously outlined, one can’t help but wonder if the bulk of non-refinery storage in the US consists of mostly condensate. If we have enormous inventories of actual crude oil (45 API and lower crude), why do we have the following report: “Quickly dwindling supplies of light, sweet crude in the U.S. Gulf Coast?”
Bakken crude used in diesel engines:
“… enter “Deutz in F250” in a search engine and follow the hits and links. The featured truck has been over a goodly portion of the US and Canada fueled solely on 100% raw well (crude) oil. It never passes up a chance to refuel with oil from the Bakken/Three Forks/Sanish formations. The truck took its first “swig” from the Elm Coulee field about seven or eight years ago. Since then its visited quite a few farms in ND that have production.”
https://svensbakkenblog.wordpress.com/2013/11/21/running-bakken-crude-in-a-diesel-engine/
When tractors first came into widespread use, farmers in oil country soon figured out that any light fast evaporating crude they could put their hands on would run, for better or worse , in early spark ignited tractor engines, although getting them started in that sort of fuel was tough. A few drops of refined gasoline would do the trick though – they just poured it right into the air intake.
Some oil is light enough to call it ” natural gasoline” .
Some tractors were built to START on gasoline and run on what they usually called distillate back then- they had a very small gasoline tank for starting and warming up the engine and a regular sized tanks for the distillate which was light enough and volatile enough to work with a carburetor- once the engine was hot. Some of them had provision to heat the carburetor and intake manifold- maybe all of them I am not sure. Distillate was dirt cheap compared to the better refined gasoline sold to use in automobiles.
I suppose if you could filter it THOROUHLY, before you put it in the tank, you could run a modern diesel on unrefined oil – if the oil is about the right API gravity and does not have much metal or sulphur etc in it.
Otherwise you would likely be stopping every fifty miles to put on new engine fuel filters.
Anybody who might be contemplating buying an old diesel beater car and running on home brew diesel made from used restaurant oil better think twice. They have a good market for it these days- selling it to livestock and pet food manufacturers as well as other people who got in line for it some years ago to make their own homemade diesel .
It is no longer free for the asking except in very small quantities at small restaurants.
Way upthread some place Glen S comments that the Fed serves the financial industry rather than the overall economy , and I must agree with him that there is a huge kernel of truth in this way of looking at things.
But to make an example by analogy, I read a book about crooks, crooked cops, gangsters, gambling and mobs ones – the scene being Las Vegas.
A key point was this one. Some crooked cops are always around and sometimes they are mostly crooked- but a city CONTROLLED by crooked cops is in nobody’s best interest except the cops themselves.
The entire city depends on the city sheriff being reasonably honest and competent rather than in the pocket of some particular outfit.
It is in the interest of the REAL crooks, the ones with the REAL assets, such as actual ownership of the hotels and casinos , etc, to have a FUNCTIONAL city , rather than one bled dry by one subset of what amounts to a whole city full of criminals.
What I am trying to get at is that the Fed in the short term in my opinion looks after the banking industry more so than it does the overall economy- but in terms of the big picture, the bankers who control the Fed and the Treasury ( revolving door, campaign contributions etc ) are as dependent as anybody else on the overall economy doing well.
If you think about it, who would your rather be- a Russian or French prince a couple of centuries ago, with no fresh food in the winter, no air conditioning, travel by horses on pig paths, all around medical care worse than none, due to doctors being so ignorant,at high risk of dieing of a contagious disease, no phones, etc etc. A thriving economy has made even poor people in a rich country richer in many respects than the super rich of by gone times.
In Animal Farm the animals are all equal , but the pigs are more equal than all the other animals. In the USA, we are all equal, but the bankers are more equal than anybody else.
The theory the Fed uses to justify its “third mandate” — the upward manipulation of asset prices — is what is known as the “wealth effect,” discussed here by Fortune:
More here from Reuters:
But how has this theory, which the Fed clings to like a life raft in turbulent waters, worked out in practice? As Reuters continues:
And as Fortune concludes:
In its most recent drive to increase asset prices the Fed created “huge and insupportable debt” bubbles in the oil and gas sector, as well as in other sectors which produce primary materials, and in emerging markets.
These debt bubbles are, as we speak, only in the beginning steps of deflating. Time will tell what the ultimate carnage will be of this deleveraging.
Old Farmer Mac said:
True. But the very definition of pathology is a condition in which those who suffer from it can and typically do as much harm to themselves as to others. The global capitalist system is pathological and dysfunctional, and has now entered self-destruct mode.
This sort of social pathology and dysfunction is naturally occurring in the plant and animal world (see Figure 5 below) or can be induced by human manipulation. Here is an example of the latter:
Two different routes are open to us at this point:
1) We can accept the pathology as being “natural,” inevitable, and perish in an orgy of passive nihilism, or
2) We can take the bull by the horns and try to find a cure for the social pathology.
I am familiar with this sort of research, you would be ASTOUNDED at the amount of unlikely research that has been conducted on agricultural research farms- but I quit reading about it a long time ago. I no longer have access and no real desire. But an example – somebody decided to select the LEAST healthy calves out of a fair sized lot once all born to healthy cows sired by healthy bulls. They selected for LACK of fitness just to observe results. IIRC , the experiment ran only about four or five generations before it had to be terminated. Maybe ten- in any case the calves that survived were unable to breed successfully enough to maintain the numbers needed to continue the experiment.
If I had been able to afford out of state tuition I might even have gone to Purdue myself and maybe even taken some classes under this guy depending on when he got there himself.
Yes, the bankers may well be in a pathological race to the bottom, similar to this chicken research, which could and will if left unchecked result in a final outcome that might not be any better than outright disaster for society as a whole, and or for the bankers themselves, considering that they were at the beginning the lords of a prosperous world, and at the ending, the lords of one impoverished. Unless the mod gets them in the end.
Mother Nature is a compulsive pathological gambler, she never stops, but she has to need to stop. She owns the casino, and she owns all the chips, and every living creature is compelled to play by her rules which are exceeding simple – survive and leave another generation if you can , and if not tough shit, there are countless other creatures that will fill take over your little bit of biological turf. She doesn’t give a rats ass about who wins and loses, she is not sentinient in any meaningful sense.
The greatest mystery of all is why LIFE IS.
ALL we know for sure is that life IS and that it survives or perishes according to the rules of Darwinian biology – which incidentally are fairly well understood in most respects but not yet to the point of being cut and dried in some areas.
There are other powers and forces that might stop the race to the very bottom and turn society as a whole in a different direction. I am not hopeful though.
I expect things to end very badly for most of the human race and that things are going to go very hard for the relative handful that might squeak thru the coming collapse.
In historical terms, there are people who have used bankers the way the bankers have used everybody else.
I hesitate to mention nazi Germany, since it is such a sensitive topic to so many people, but the rich people, the bankers and the owners ( not NECESSARILY one and the same but to a large extent one and the same in this case) THOUGHT they were going to use Hitler- but it didn’t work out that way. He turned the tables on them and they wound up doing what HE wanted, or dead or at least FLED – the ones who realized soon enough and managed to flee.Of course the nation itself was destroyed,for the most part, and it took from 1945 until very recently for Germany to make a mostly full recovery.
If there is a big difference TODAY, the bad side is that the banks seem to control almost EVERY thing , but there are SOME entities that don’t seem to be too dependent on bankers. The Chinese communist party. Putin and company. Bankers depend on THEM for permission to EXIST, not in the aggregate but as individuals and individual banks.
Apple may have to use banks to do day to day business but it is UNLIKELY Apple will need to borrow any money any time soon.
When the shit starts hitting the fan fast and furious , there is some hope the governments of some countries will throw the current rule books out and put new rules in place.
Revolutions have happened before. Remember the French Revolution and the guillotine. Remember what the Limeys did right after WWII- they kicked out Churchills party- the biggest war heroes in history at the moment of their greatest triumph, from the local pov..
The Depression brought about a nation wide old age welfare net here in the USA.
History ain’t over, but the future sure does look dark and stormy in terms of THIS OLD FARMERS world wide long term weather forecast.
I believe there is a rich man’s doom stead within ten miles of my house. He spent a million bucks gouging out granite, you could hear the giant jackhammers on the big track hoes pounding away all day for months. No trespassing sort of job site of course. But there were local people hired to work on the place just the same.
If the world goes to hell in a hand basket the local people who survive – and there will be some- will murder him out of hand- and his friends too- sooner or later- because they will just as naturally as the sun coming up hate their guts and everything they stand for and blame them, right or wrong, for their own troubles.
If some sort of upper crust manages to get control of government and create a police state to protect themselves and maintain their top dog positions, the big dogs won’t be bankers and stock market tycoons. They will be exmilitary, ex secret police, once and future cops.
Putin and company are the prime example. For NOW.
Pope Francis stands with Obama on the issue of “climate change” which has as its core tenet the reduction and eventual elimination of fossil fuels. The current atmosphere is such that if you do not believe in “climate change” that is as provincial a view as being against “equal rights” or being against same-sex marriage. Perhaps this marks the beginning of the end of oil production in the U.S. and the so-called “big oil” companies of the U.S. This has gone beyond a mere business matter and is becoming a movement, for better or worse.
Art Berman has a new power point presentation:
http://www.artberman.com/wp-content/uploads/The-Shale-Revolution-The-Current-Oil-Price-Collapse-21-Sept-2015-copy.pdf
Shallow, maybe OPEC will save the conventional!! I sure hope so.
Whiplash. Who’s making the Killin ?
http://www.zerohedge.com/news/2015-09-23/wti-crude-crumbles-test-44-handle-algos-run-stops-read-doe-report
EIA weekly oil production statistics:
US total: +19 kb/d (from 9117 to 9136)
Alaska: +19 kb/d (from 469 to 488)
US ex Alaska: unchanged (8648 kb/d)
Ah yes, the reach for the reason. But oil increased in price on that report.
The price fell 30 mins later. ZH interprets that as “it took time for the algorithms to read the full report”. Uh huh. Slow computers. That’s the answer.
In the overall context of “what determines the price of oil” it strikes me as astounding that the discussion never starts at “the refinery negotiates with Saudi Aramco and reaches an agreement”.
Or in the case of Motiva – SA owns the downstream.
Short negotiation.
According to UNCLE, lithium carbonate battery grade averaged costing less than seven thousand bucks a metric TON last year.
And a rather large battery,one big enough to propel an ordinary sized car a couple of hundred miles, will need less than a hundred kilos of actual lithium. Methinks the lithium content of lithium batteries is not that big a deal, at least not for a few years, considering the total cost of such a battery is many many times the current cost of the lithium needed to manufacture it.
AND the cost of recycling old lithium batteries can be expected to fall as the VOLUME of batteries AVAILABLE for recycling rises. Damned few industries work well at low volumes.
I will hazard a guess that lithium production can be scaled up easily if the price of it goes up a few times .
If it does turn out to be too expensive for full on battery propulsion, then smaller batteries such as the one in the current Chevy Volt will still suffice to cut the need for gasoline for a typical driver by ninety percent or so.
About seven percent lithium by molecular weight a thousand kilos would have roughly about seventy kilos of lithium. So disregarding expenses involved, a really big battery does have about a quarter to a third of it’s price being lithium.
But it RECYCLES.