The preliminary Texas RRC Production Data is out this morning. There appears to be a considerable drop in Texas crude oil production in April. All Texas RRC data in the charts below is through April 2015 and all EIA data is through March 2015.
For those new to this site, the Texas RRC data is incomplete. The drooping lines will eventually, after the final data comes in, closer resemble the EIA data. Though I believe the EIA data is quite a bit too high at this point.
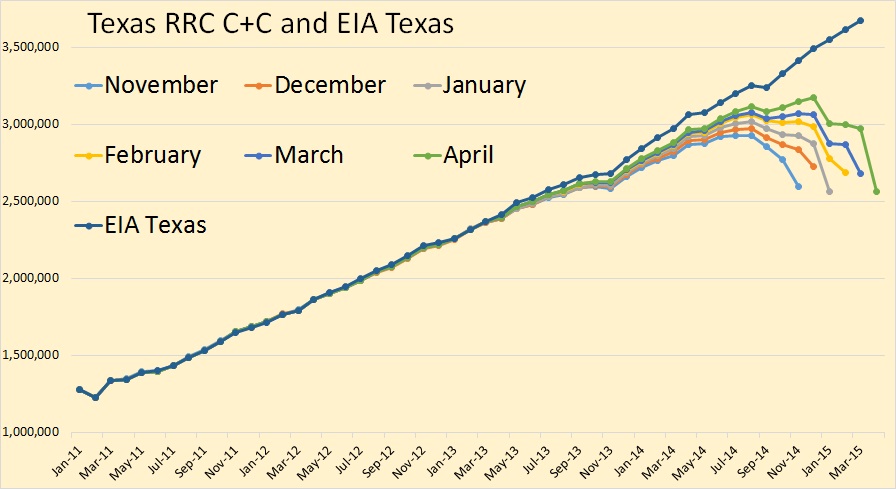
It appears that, when the final data comes in that Texas will have took a huge hit in January, recovered somewhat in February and March, then took another hit this past April.
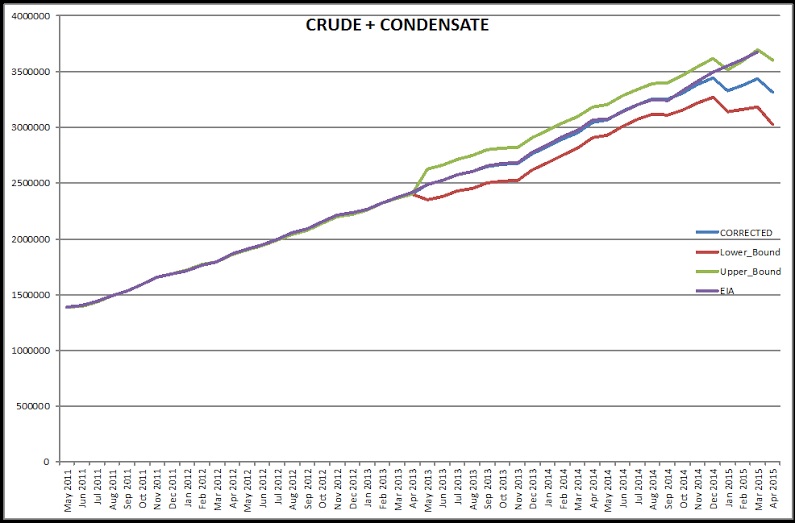
Dr. Dean Fantazzini, with his algorithm that calculates the final production numbers, also comes to the conclusion that Texas took a hit in April production. Dean has three results with the most probable in the middle.

Texas Crude only, in April, when the final data comes in, should be slightly above January but still well below December.
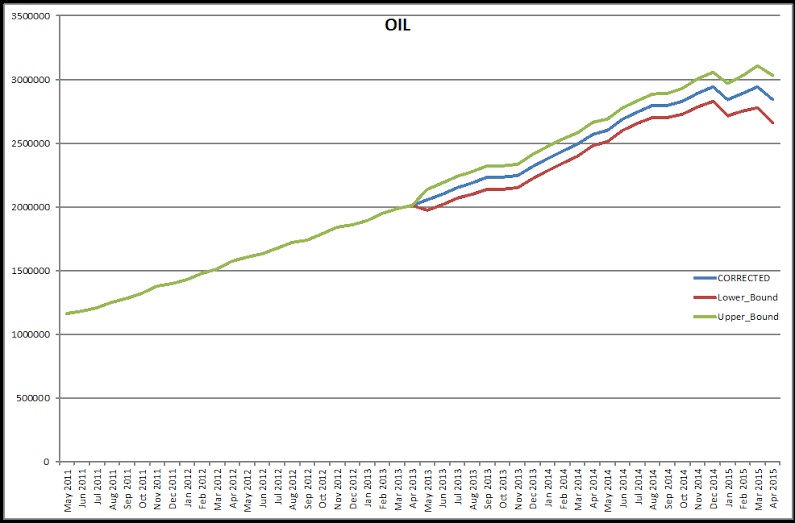
Dean’s corrected data shows Texas crude only declining in January, recovering in February and March, then declining again in April.
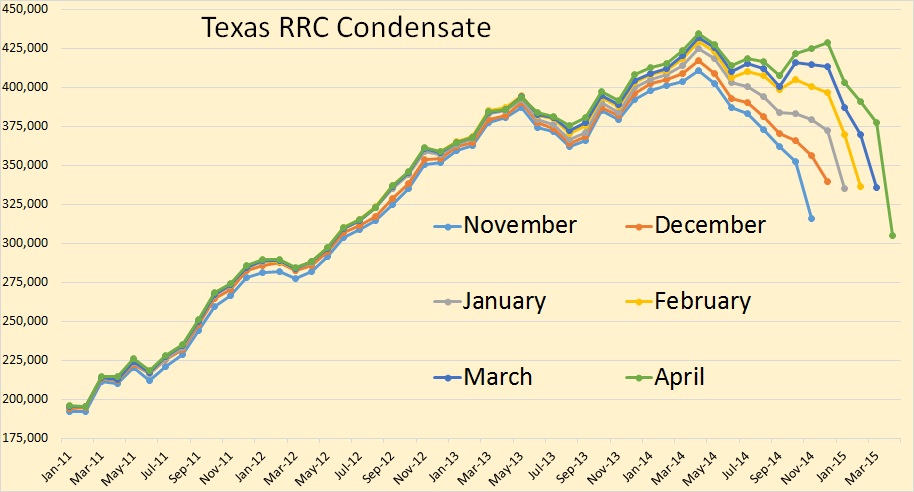
Condensate took a far greater hit in April than did crude only. This is likely because natural gas production in April took a bigger hit than did oil production.
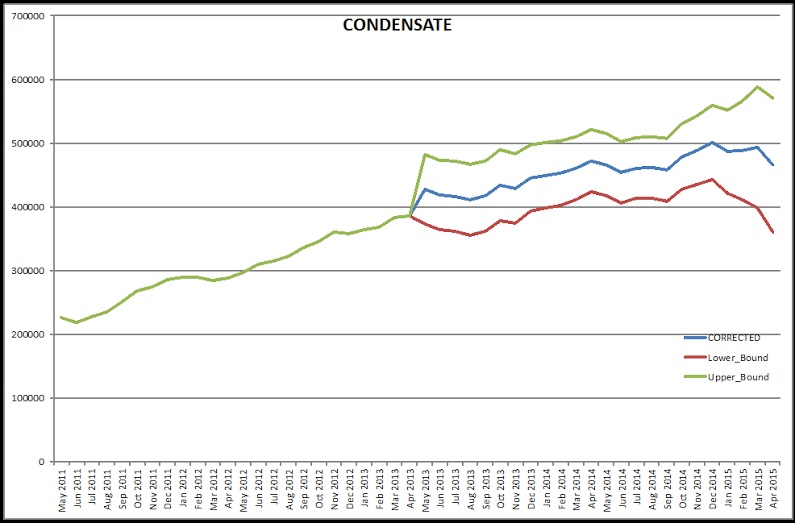
This is Dean’s take on what Texas Condensate will be when the final data comes in. December appears to be the peak… so far.
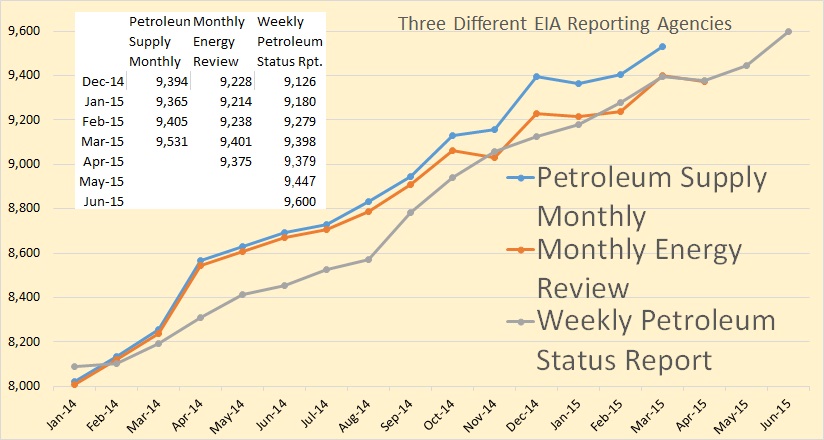
There is no doubt that North Dakota, the USA’s second largest producer, is down since December. And I believe the data clearly shows that Texas, the USA’s largest crude oil producer by far, is down also. Then how is it possible that the EIA has US Production up so much since December?
In the chart above as well as the one below, the weekly production data are the averaged per month. The June weekly numbers are the average of the last two weeks reported data.
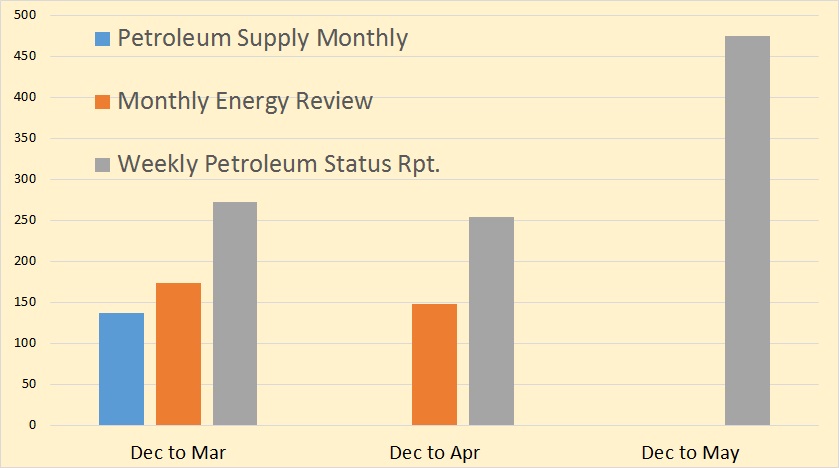
This is what the three different reporting departments say has happened to US C+C production since December 2014. I believe this will turn out to be the largest production error in the history of the agency.
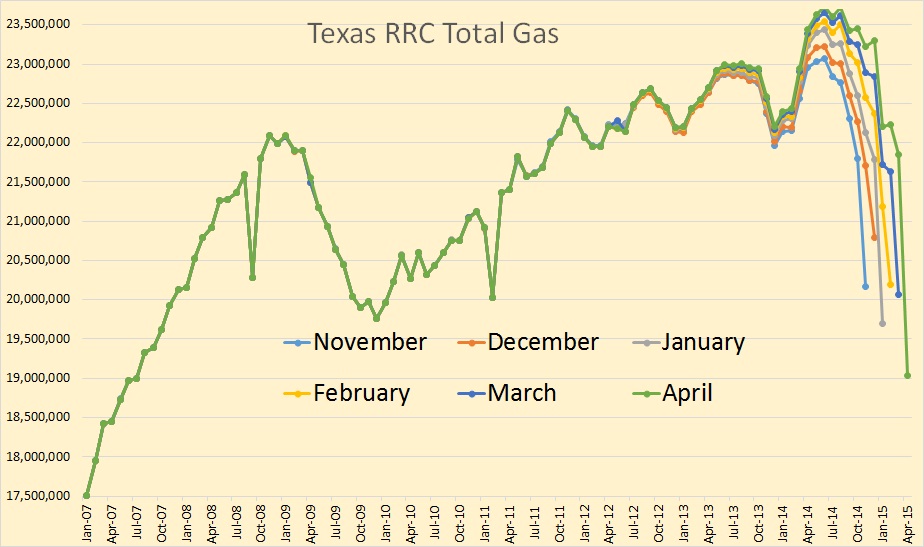
It appears that Texas Natural Gas took a bigger hit than did oil. All natural gas data is in MCF.

This is Dean’s estimate of what the final Texas natural gas production will look like. The peak, so far, is in December, just like crude oil.
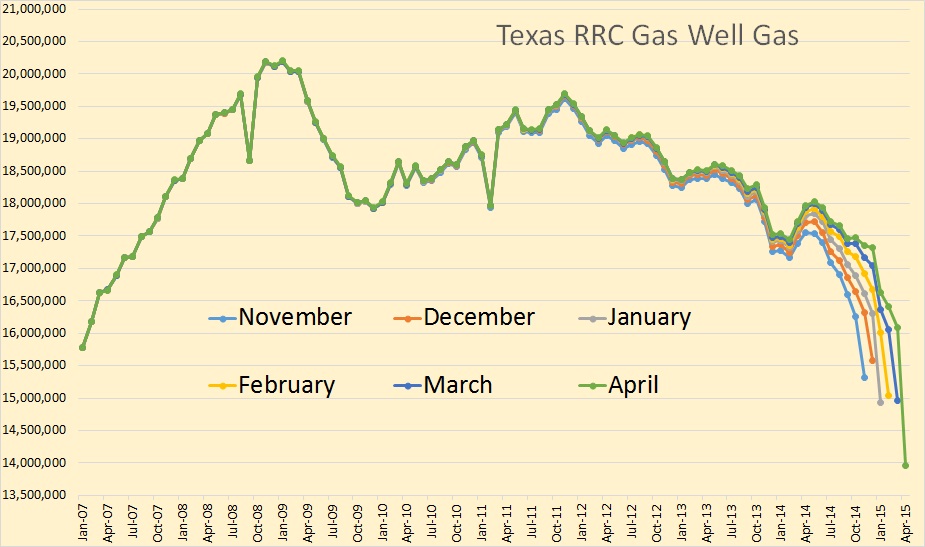
Texas gas well gas peaked way back in April of 2009. In April it was Texas gas well gas that took the biggest hit of all.
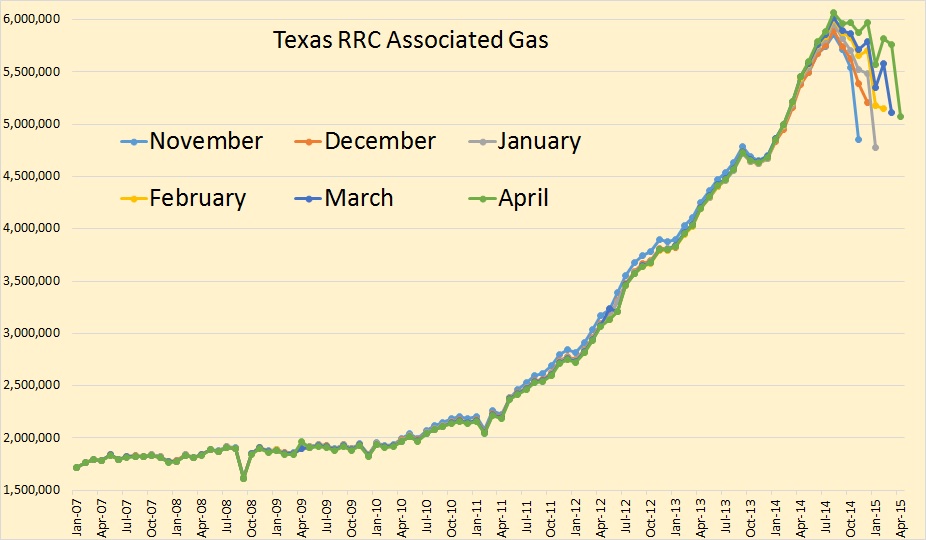
Texas associated gas did not take nearly the hit that gas well gas did. This is gas from oil wells. So it appears that even though oil production did take a hit in April, natural gas took an even bigger hit.
The North Dakota Director’s Cut is just out.
Mar Sweet Crude Price = $31.47/barrel
Apr Sweet Crude Price = $38.33/barrel
May Sweet Crude Price = $44.70/barrel
Today’s Sweet Crude Price = $48.00/barrel (all-time high was $136.29 7/3/2008)
Mar rig count 108
Apr rig count 91
May rig count 83
Today’s rig count is 79 (lowest since December 2009)(all-time high was 218 on 5/29/2012)
The statewide rig count is down 64% from the high.
Comments:
The drilling rig count dropped 17 from March to April, 8 more from April to May, and has since fallen 4 more from May to today. Operators have each been experimenting with running 1 to 2 fewer rigs than their planned 2015 minimum to see if drill times and efficiencies will continue to improve. This has resulted in a current active drilling rig count that is 5 to 8 rigs below what was operators indicated would be their 2015 average if oil price remained below $65/barrel. The number of well completions dropped sharply from 244(final) in March to 94(preliminary) in April. Continued oil price weakness anticipated to last into next year is by far the primary reason for the slow-down. There was one significant precipitation event in the Dickinson area, 10 days with wind speeds in excess of 35 mph (too high for completion work), and no days with temperatures below -10F.
At the end of April there were an estimated 925 wells waiting on completion services, an increase of 45. To maintain production near 1.2 million barrels per day, 110-120 completions must be made per month.
Drilling permit activity decreased slightly from March to April and significantly more from April to May as operators positioned themselves for low price 2015 budget scenarios.
Helms is saying that wells awaiting completion increased by 45. This makes no sense whatsoever. Wells completed in April totaled 153. Spuds were 129 in March and 94 in April. How on earth did “Wells Drilled” increase by 45 above “Wells Completed”?
___________________________________________________________
Note: If you would like to receive an email notice when I publish a new post, then email me at DarwinianOne at gmail.com .
464 responses to “Texas Oil and Gas Production for April”
For all,
Ron, nice post.
Not about Texas, I just posted an update on Bakken LTO with data as per April 2015 and with a closer look at 8 companies;
Continental Resources, EOG Resources, Hess Bakken Investments, Marathon Oil Company, Oasis Petroleum, Statoil Oil & Gas, Whiting Oil and Gas Corporation and XTO Energy.
There are some interesting differences between the companies and their response to the collapse in the oil price.
http://fractionalflow.com/2015/06/18/status-on-the-bakken-red-queen-with-data-as-per-april-2015/
(Lots of statistics)
That is probably the most informative info on the Bakken that I have read. I knew Continental was still trying to out produce OPEC, but the percentage of production these companies represent tells a lot.
Could the big difference between what you think and the government estimate be related to the gulf of Mexico?
The Gulf of Mexico federal has been declining since it hit a peak in December 2014. I don’t think new projects will offset additional decline. However, we need to wait for more information.
Saudi oil exports down 500,000 in April. due to higher domestic use and their ever increasing refining capacity. Ramadan began yesterday so there oil consumption will the much higher June/July: http://mobile.reuters.com/article/idUSKBN0OZ0YG20150619?irpc=932
India’s oil consumption is increasing rapidly causing it to ascend to being the world’s third largest importer: http://oilprice.com/Energy/Crude-Oil/India-Becomes-3rd-Largest-Oil-Importer.html
Link to Saudi net exports discussion, and to discussion of Chindia’s Net Imports (CNI), on the prior thread:
http://peakoilbarrel.com/bakken-april-production-data/comment-page-1/#comment-521843
Key Points:
Net exports are, of course, the ultimate measure of “keeping it for the grandchildren” but the more compelling point is simply China’s 11.056 million bpd oil consumption as those relentless car buys define reality, and of course now India –>
3.846 million bpd burned, up 3% on the year. Only US at 19+ (up 0.5%), China at 11+ (+3.3%) and Japan at 4.3 million bpd (-5%) burn more. Japan’s pop down about 1% and economics pathetic so there is no hope to be found there for any efficiency boost.
China and India have those huge populations so they MUST ramp up their per capita consumption. There is nowhere else to get it than tankers going somewhere else. They have their own central banks so they’ll always be able to pay any price.
Not if they’re smart: EVs are cheaper and better. And in fact, Chinese EV sales are growing very fast.
I suppose if we’re feeling competitive with China, we should hope that they buy more ICEs, and dig themselves into a bigger hole.
Nick G,
“I suppose if we’re feeling competitive with China, we should hope that they buy more ICEs, and dig themselves into a bigger hole”
Such a statement is truly effective cynical sarcasm that forces people to think and ponder the effects. Very straightforward, easy to grasp statement that forces ones mind to delve into whether such a scenario is “good” or “bad” for the U.S.
My biased hypothesis is that more ICEs = more non-discriminatory oil demand = higher (all else being equal) oil prices = negative impact on world’s largest oil consumer.
Many tribes requiring fruit from a single tree yields a common need, separate cultures that can relate and understand each other. Demand for a single good yields economies of scale and, through economies of scale on both the demand and supply side, makes the good cheaper to produce and consume.
That is, until it plays musical chairs and mandates that any party requiring a chair pay whatever maximum marginal value they can afford. Whomever is more entrenched pays dearest, and every party is forced to ante up to their highest price.
Clearly a tongue-in-cheek statement to get people thinking, and a successful one at that. The more inelastic demand produced by China’s dependence on ICEs, the more both the U.S. and China suffer as a declining harvest forces a bidding war.
If China follows our path and buys more ICEs we both lose, if China buys more EVs they win. Both options result in the U.S. losing. The U.S. only “wins” if its own path, regardless of China, is one of a strong transition to EVs, renewables, and acceptance of autonomous vehicles.
If the U.S. maintains its lead in those technologies (primarily through Silicon Valley), then the game of musical chairs will be to our advantage. As chairs are taken away we’ll not only be reducing our demand for chairs, but will be selling new chairs to the world as the old ones deplete.
The U.S. became a superpower by being the world’s largest supplier of the fuel of industrialization. It could happen again if circumstance and policy allow the U.S. to be the world’s largest supplier of the next revolution in energy. I’m not referring so much to supplying renewable energy, but in providing the vehicles and infrastructure that make it possible – batteries, services (like apps that make autonomous EV service convenient and cheap), and products (vehicles, charging stations, autonomous software).
Possible? Yes. Likely? Can’t say.
When it comes to oil demand the U.S. is coming to be in an oddly beneficial position, relatively speaking. Potential growth in marginal U.S. demand is limited; everyone already has ICEs, so competing for MORE isn’t essential. China is only just beginning its suburban, consumer oriented, gas dependent transition. The U.S. is already saturated which means it has the highest inelastic demand in the world, but that very problem may not be as bad as China’s need to not only MAINTAIN inelastic demand but to GROW its inelastic demand.
Neither country has a preferable position, and declining supplies will impact both in severely harsh ways.
What is worse? A stable need for 1L of vodka per day, or a need of .75L of vodka that grows higher every day? An oversimplified analogy in every way, but certainly something to think about.
All of us are swimming in the same pool. All of us are pissing in it.
So if one or the other of us gets the others to piss more than they— all of us are now swimming in yet more piss.
And here we all are, with super-abundant available energy pouring all over us every day from our local gravity-stable thermonuclear reactor, which can easily drive that piss back thru the membrane into purest water.
So, let’s all get together and DO IT.
BTW, those chinese “need” more ICE’s like I need another heart attack.
Mustn’t forget that we have been pissing in the pool for longer than the Chinese. The baseline yellow colour in the water is from us. The fact that the Chinese are now able to piss at the same rate as us should not obscure the fact that we’d already soiled the pool.
Anyway here is hoping that the Chinese, Germans and Californians, by embracing solar, might save us from ourselves.
It’s a forlorn hope.
That suggests that it’s a sacrifice for the Chinese to transition away from coal and oil.
That’s the point: the faster the Chinese move away from coal and oil, the more affluent and healthier they will be.
nick (ouch) – do you seriously think that there is even the slightest possibility of manufacturing the 20 million or so EVs that china NEEDS each year and the hundreds of millions of batteries that that would take?
And thats just china never mind the rest of the world which would triple those numbers. Ridiculous.
So what you’re saying is, invest in lithium mining companies?
I know.
Can you believe there are people who think that the US can get up to 1 million barrels of oil per day production?
I mean, even if there were that much oil in Pennsylvania, there wouldn’t be enough horses and barrels to transport it anywhere.
I hear that fancy new electricity is going to replace kerosene for lighting, then what are those oil drillers going to do?
Let us take a step back and rise up out of the weed-hopping to a higher analysis vantage point:
Point to ponder: What is the Chinese adopt manufacturing automation/robotics in a big way to increase their manufacturing efficiencies/productivity?
Great! Right? Higher productivity can mean lowers costs, greater market penetration, more profits…what’s not to like?
Ask Henry Ford.
What will be done with the displaced workers? Back to the fields? Sweeping streets? Back to the higher education/vocational training mill to retrain X people to compete for X/?? jobs? Will these jobs have lower compensation due to a surfeit of workers and a reduced number of available positions to fill? Put them on the state dole? Put them in the PLA and menace their neighboring countries?
http://www.naturalnews.com/042357_China_robotic_labor_manufacturing.html#
But this issue is Much larger than just China:
http://www.nytimes.com/2012/08/19/business/new-wave-of-adept-robots-is-changing-global-industry.html?pagewanted=1&_r=2
Between the quest to continually outsource human touch labor to countries with lower-cost labor (and lax to practically non-existent environmental and labor/safety protections) and the drive to automate everything possible, there is a profound question about what exactly all the surplus people are supposed to do to ‘earn a living’….especially given that a high number of displaced workers will likely equate to lower wages for the jobs that are left for humans to do (with exceptions at the minority report level for the superstar engineers and scientists and managers/owners in the system).
Henry Ford know that in order for there to exist consumers with enough scratch to buy his wares, these consumers needed to be employed and be paid enough money to buy his stuff!
Here is a short fiction book that attempts to address these issues:
Manna:
http://www.amazon.com/Manna-Two-Visions-Humanitys-Future-ebook/dp/B007HQH67U/ref=sr_1_1?ie=UTF8&qid=1434911110&sr=8-1&keywords=Manna
I think the book is a technocopian pie-in-the sky cop-out that invokes techno-majic to avoid both the .001 % phenomenon (Morlocks-Eloi) and also to duck any Limits-to-Growth issues, but read the book and judge for yourself.
there is a profound question about what exactly all the surplus people are supposed to do to ‘earn a living’
In my opinion, this is a huge issue and not one addressed by most economists or policy makers. We’ve got more people than we need for the workforce.
Now, there isn’t really any reason why we need to have the world’s population all working 40-50 hours a week. We could have a system where everyone works 10 hours a week. But right now we would rather pay a few people to work a lot and then we don’t know what to do with everyone else.
In terms of future scenarios that get talked about here, it means that the top 1% or the top .1% don’t really need most of the world’s population. So if lack of resources, disease, war, or so on eliminate a lot of people, that shouldn’t lessen the quality of life for those few who have amassed a nice life for themselves with sufficient resource to keep themselves, their families, and a small support community going.
At the same time, the fact that the wealthy don’t need a lot of people, and many people may turn out to be economically dispensable, is good for the environment. If a significant number of people disappear, then the few that are left and the other species that are left may have a better chance at survival.
None of this is fair. The wealthy don’t deserve a better chance at survival, but I think it will happen.
We don’t have a surplus of workers. We have inadequate aggregate demand, largely due to misplaced priorities of the 1%.
There’s a great deal of work that needs to be done in the world: health care, medical research, childcare, education, building of infrastructure, including renewables, environmental remediation, etc.
There’s a great deal of work that needs to be done in the world: health care, medical research, childcare, education, building of infrastructure, including renewables, environmental remediation, etc.
Definitely we could use more people in childcare, elder care, care of the disabled, and so on. But we don’t want to pay them. So until the economic system is reconfigured to pay people for necessary work, or until the system is reconfigured so that everyone works a little at paid work and then has time for unpaid work, it doesn’t function well.
Where the surplus worker idea comes in is that when the wealth is concentrated in few hands, they are the ones to determine who they choose to pay. They need relatively few people to sustain their wealth. Everyone else is surplus to the wealth-holders.
In feudal times the landowners needed people to work the land. They needed people to make the food. And so on. They didn’t want to wipe out entire villages because those people provided manpower. But now manpower and horsepower can be supplied to the wealthy by machines.
Good conversation.
Once again, recommend the book ‘Manna’…it is fiction, but seems to represent the author’s ideas on this subject.
It is a whopping 99 cents on Amazon, and a short and interesting read. The automation aspects book evoked my memories of the Phillip K. Dick short story ‘Autofac’, although the plots are quite different.
http://www.philipkdickfans.com/mirror/websites/pkdweb/short_stories/Autofac.htm
It is thought-provoking…enough to perhaps motivate people to consider these issues.
No, I am not the author…no self-promotion in play!
Pervasive automation, the Limits to Growth, and their collision with the non-negotiable U.S. American lifestyle (goes for other countries as well) are topics of top-shelf importance…profound predicaments.
Watcher Wrote:
“China and India have those huge populations so they MUST ramp up their per capita consumption. There is nowhere else to get it than tankers going somewhere else.”
Both India and China have high inflation, China is also in a massive bubble (Real Estate morphing into equities). China and India can not print themselves prosperty or use it fund oil imports.
Saudi oil exports down 500,000 in April. due to higher domestic use and their ever increasing refining capacity.
If their refining is increasing, then presumably their imports of refined products are decreasing. Decreasing refined product imports would offset lower crude exports. That’s why Jeffrey refers to “net exports”.
Nick, here’s a quickie look at the storage requirements for a hypothetical interconnected wind power grid built in Western Europe.
http://21stcenturysocialcritic.blogspot.com.es/p/blog-page_19.html
I played around with actual data I got from Euen Mearns’ blog, and pretty much copied a similar study he had performed, but I changed some of the parameters to investigate the energy storage requirements. This is a very rough look, I sort of cut it short, maybe later I’ll see if I can optimize it and add the total demand to visualize whether this makes any sense.
Hmmm. If I read this correctly, for this period average production would be about 23.3GW, 22% short of the specified 30GW. Storage of 160GWh’s would cover the shortfall.
82GW of wind power would cost about $164B. 160GWhs of pumped storage would cost about $16B (at $100 per kWh). That’s a premium of about 10%. That doesn’t seem like a break-the-bank kind of cost.
NickG Wrote:
“82GW of wind power would cost about $164B”
Either divide power by 3 or multiple the cost by 3. Wind output only operations at about 30% of nameplate capacity. Solar is worse, only about 20% of nameplate output.
I used 30. You should look over the graphs. But that quickie study only used the month of January. If I get a chance I’ll do the month with the lowest wind availability.
I went back and looked over the spreadsheet, extracted the max hourly delivery for each sector and got a total 110 gigawatts. If we allow an extra 5% for units being repaired or maintained we need 115 mw to get the 30 mw. That’s less than the 30 % suggested for wind.
I think the problem arises because some of this network is installed in areas with poor wind? Thus far I haven’t seen a well crafted study showing a really large wind power kit can deliver reliable power at a reasonable cost. As the pope says, renewables need a battery.
Total and complete nonsense from an electrical infrastructure perspective. Every single bit of “kit” connected to the grid requires back up or “battery” in your parlance. The demand itself is variable!
I think this can be optimized (I did it in a couple of hours). Let’s assume your figures are right: $180 billion for 30 gigawatts. I think the cost is slightly higher, because this requires a very sturdy interconnect. But what I’m focused on is the procedure.
I was thinking the key may be to have a control system, to be installed in each metered facility (commercial, industrial, residential, etc) which can send a shutdown signal to appliances. This would allow load shedding on a tiered basis. Those who don’t want to have their washer shut down can pay more. For example, I don’t run the AC, but use fans in the summer. It wouldn’t be a huge deal to have the fans shut off automatically, if it happens a couple of times per month.
Yeah, Demand Side Management (DSM, aka Demand Response) makes a lot of sense.
There are a lot of ways to do it. You’re describing a traditional Industrial/Commercial curtailment model, but you could use Time of Day/Use pricing with smart meters, or just have devices that sense the grid frequency.
I prefer the pricing model myself: just set pricing dynamically, and have devices programmed to respond. Your smart meter could receive 24 hour forecasts, and your EV would choose when to charge (or discharge back to the grid) to minimize overall cost.
In that case i may need the ability to re order priorities. I wouldn’t want my tv turned off in the middle of a football game.
That’s the nice thing about the pricing model: you program in your priorities, and the device uses your preferences to respond to price signals.
It doesn’t give quite the same top-down control of the I/C curtailment model, but utilities would learn how consumers respond, and develop the pricing model they need to shape consumption.
Consumers could choose to pay more, if they really need to something at a particular time, and utilities would spend what was needed to match supply & demand. In turn, if that was expensive, consumers might respond with lower consumption at that time. It would develop naturally over time.
A smart grid system as you describe has already been tested.
The study ran for three years between 2010 and 2013 on a few villages in the North West of Jeju island. In the show-house I visited the smart meter could be set to turn off individual appliances as the price varied.
For a look at some of the results of that study see
A Study on Jeju Power System Considering Smart Grid Elements.
http://www.tandfonline.com/doi/pdf/10.5370/JICEE.2013.3.4.300
Need a larger test using a market with a representative profile. Maybe the Germans will volunteer?
More research is always good. Of course you can’t find a tougher test than a small island. A much larger grid will be much easier to keep stable, due to the law of large numbers.
Demand Response is semi-old news, at least in the U.S.
Several 10’s of GW of DR exist in the US as of 2013.
http://iet.jrc.ec.europa.eu/energyefficiency/sites/energyefficiency/files/files/documents/events/8_dnv_kema_15102013.pdf
https://en.wikipedia.org/wiki/Demand_response
case study from vendor of system for Pepco Holdings (aka Pepco, Delmarva Power, Atlantic City Electric):
http://www.comverge.com/comverge/media/pdf/Case%20Studies/Pepco-Holdings,-Inc-Case-Study.pdf?ext=.pdf
373 MW, 392,000 customers enrolled, starting in 2009.
blah blah from vendor about how it works:
http://www.comverge.com/home/demand-response/
hardware is getting kind sophisticated:
http://www.comverge.com/product-pages/hardware/
I would like to see a test of people behavior. We don’t know how a large Western European population will cut its demand when given a price signal.
The total system cost is $230 billion plus $16 billion plus say $20 billion for the grid. Total is $266 billion for say 35 gw to 40 gw (asumíing some demand management). That’s $6.7 million per mw. What may work better is to jack up storage somehow. It always seems to come back to storage.
We don’t know how a large Western European population will cut its demand when given a price signal.
Well, Europeans tax personal transportation fuel to create prices that are about twice as high as the US, and they use only 18% as much personal transportation fuel per capita. That’s pretty clear.
$6.7 million per mw.
Which is pretty cheap. Amortize that 6.7M over 30 years at 7% interest, and you get an annual cost of 54 cents per watt. Divide that by 8.76 kWhs per year, and you get 6.2 cents per kWh.
That’s mighty affordable, especially given that you’ve included some of the grid overhead costs.
I’ve used the following example to illustrate the differences between gross and net exports:
The same garbage put out by the Energy Idiots Agency is used by the IEA.
So if EIA forecasts are so bad, why does anyone pay attention to EIA forecasts for renewables??
habit 🙂
Does anyone know anything about IRENA?
Am posting a couple of comments about windmills.
Firstly in the UK – With an installed capacity of 576 megawatts, Gwynt y Môr the world’s 2nd largest offshore wind farm was inaugurated yesterday.
See – http://www.4coffshore.com/windfarms/gywnt-y-mor-launches!-nid1953.html
Whereas in South Korea the big plans announced in 2011 to build the world’s biggest offshore windfarm are going nowhere. The big Korean conglomerates that were investing heavily in wind turbines all seem to have backed out recently (Samsung Heavy, Doosan, Hyundai Heavy). I live on Jeju Island. Official policy is that this island of half a million people will be 100% reliant on renewable energy by then. Seems unlikely! A second part of the policy is that all 400,000 vehicles on the island will be electric by 2030. The local governor has teamed up with LG Chem in promoting this idea. Currently EV’s make up about 0.5% of the cars on the island.
My own feeling is that peak oil and associated financial ‘collapse’ will happen long before 2030. But I expect all advanced nations to survive intact and for the electrical grid to remain on. Gasoline for regular civilians however may be either a) expensive b) rationed or c) unavailable. EV’s will become more valuable. Windmills however may not. Without a working storage solution their usefulness is debatable.
Great comment(s), thanks for the update.
Maybe you should buy up all the Jeju horses and make a killing!
Of course, EVs provide storage. They can buffer supply variation by charging when supply is high. They could also buffer low output with Vehicle-to-Grid power.
There’s a nice synergy between EVs and wind/solar.
If this scenario unfolds my Volt will be my most valuable asset. I’ll be able to purchase my alloted, rationed amount of gas since I do have an ICE. However, I can simply resell it to the most needy person as I won’t need it.
I can only imagine the re-sale value would skyrocket as people clamor for used EVs. I’m of course assuming high oil prices would make most people poor, induce recession, and reduce the ability of people to purchase new EVs. Demand for any and every EV would rise, but due to negative economic conditions demand for relatively cheaper used EVs would skyrocket.
Really I’m just fantasizing about a hypothetical future where people envy my EV purchase instead of questioning it. Really they already should! I got my Volt for $16,500 when an equivalent Prius was $24,000. By paying $7,500 less I got superior acceleration, 1200 mpg (my overall mpg after 3,600 miles) compared to a Prius’ 60mpg, and my near zero use of my gas engine means that at 100,000 miles I’ll have an ICE with a youthful 30,000 miles in wear and tear.
The best way to think of a dual vehicle like the Volt is this: even if the battery craps out after 70,000 electric miles you still have a completely functional ICE with only a few thousand miles on it. Drive it as an EV for 10 years, and even then you still have a low mileage ICE. The way the market is priced at the moment is confirmation that this fact is entirely forgotten.
Even that “battery goes bust after 70k EV miles” scenario is absurdly pessimistic. There are now hundreds of Volts with over 70k electric miles now. None of them, not even ONE, is experiencing range loss of over 5%. Don’t get me wrong, Nissan LEAFs, due to a higher SOC and their cheaper air cooling system, are frequently experiencing range loss of 20-30%. Chevy Volt’s only use 50% of their battery capacity (50% SOC). This means you pay for a much larger battery, but only get to use half of it. It is quite literally equivalent to paying for a 16.5 kWh battery, but only getting an 8.25kWh battery. Combined with the Volt’s more expensive liquid cooling system it means that you pay much more money for not just an equal EV range, but a LOWER EV range.
The end result is that people’s real world experience in a Volt is to go 70,000 EV miles with no range loss while a Nissan LEAF can go 40,000 EV miles and rewards you with a 20-30% range loss. Over the next few years this data will transition from being common knowledge amongst EV enthusiasts to being common knowledge in the public arena. Resale values of older Volts will increase as consumers transition from fears of battery capacity loss to the crystal clear fact that some EV models were specifically designed to never experience such things.
I am not paying close attention to LEAF battery life but it is my impression that the typical Leaf battery does not go down hill so fast.
The ones used in extremely hot or cold climates may be wearing out as fast as you indicate.
OFM,
As usual you are correct. Severe range declines in LEAFs are found in climates with pronounced hot and/or cold temperatures. They’re outliers in other more moderate climates, but are not uncommon in the numerous non-moderate climates of the Midwest, Northeast, and Southwest.
Nissan went for the unfilled niche of affordable EVs, and in order to achieve that they did what they had to. As they update the LEAF this issue will be less of an issue, but it is a significant issue that is unique to the LEAF at the moment.
More extreme, albeit common, climates that experience the heaviest capacity declines are merely indicative of the flaws inherent in using an air cooled battery design with a higher SOC. That being said, it was the only way to produce a vehicle in the affordable EV market, and the result was clearly an overwhelming success – the Nissan LEAF is consistently a top seller in the EV market.
I don’t mean to bash Nissan as I see what they were doing as a business strategy and it clearly was successful. I just think that the long-term consequence will be that current Gen LEAFs will experience sharply declining resale value compared to that of the Volt. As of right now, the difference in MSRP for a new Volt is far, far higher than a LEAF, reflecting the much higher costs of the Volt’s battery size and liquid cooling system. However, the price difference between a used LEAF and a used Volt are marginal. After a lot of research I concluded that the price difference in the used market between these two vehicles is highly, and temporarily, distorted.
If buying a new vehicle, then the LEAF is a better option, but, then again, the people who buy new vehicles aren’t concerned about depreciation – otherwise they wouldn’t buy new in the first place.
If one seeks the best value, and is looking to mitigate the risk of depreciation of their vehicle, then the Volt is, at the moment, the best opportunity in the entire vehicle market – be it EV, ICE, PHEV, hybrid, or whatever.
All very interesting. I bought a Leaf because I knew I could get a combustion car more or less immediately any time I needed it, so why bother to tote one around in our usual short trips?
In two years we have used that Honda only twice, a couple of hundred miles. All the rest was the Leaf.
My wife was at first timid in using the heater or AC, but soon learned to do so freely, since her average trip is usually less than 30 miles.
We have not noticed any battery decay.
We also bought the necessary PV at the same time, all of it together a real bargain compared to my friends and their big pickups.
I gave a little talk to local energy group on the Leaf as a used car bargain, and was greatly surprised that a lot of them then went out and bought one, 11-13K each around here, that is, an essentially new car just like mine for less than half price.
Of course I myself would prefer a bare bones model A version EV, but wife loves the cushy feel and the great sound system.
https://www.dmr.nd.gov/oilgas/directorscut/directorscut-2015-06-19.pdf
The number of well completions dropped sharply
from 244(final) in March to 94(preliminary) in April. Continued oil price weakness
anticipated to last into next year is by far the primary reason for the slow-down. There
was one significant precipitation event in the Dickinson area, 10 days with wind speeds
in excess of 35 mph (too high for completion work), and no days with temperatures
below -10F.
Over 98% of drilling now targets the Bakken and Three Forks formations.
At the end of April there were an estimated 925 wells waiting on completion services, an
increase of 45. To maintain production near 1.2 million barrels per day, 110-120
completions must be made per month.
Hi Toolpush,
The very poor estimates by Lynn Helms on the number of wells completed relative to the number of new wells that start producing each month (which is the more important number). makes me question if Helms estimate of the frack log is any better. If the estimate is correct and the 75 rigs can drill one well per month and we need 140 new wells per month for relatively flat output, then we would need 65 wells per month out of the frack-log. If there are 900 wells waiting on completion, then 900/65=13.8 months until we run the frack-log to zero, at that point output will fall if the rig count is not increased.
I think by June 2016 oil prices will be at a level where more rigs will be working and output can remain flat unless new well productivity starts to fall before that time.
Hi All,
I agree with Ron about the petroleum supply monthly data being too high, but it is not clear to me that Texas will be lower in April, it seems to me that Dean’s estimates for the most recent couple of months (say March through April in this case) will tend to creep up over time. My guess is that the Monthly energy review estimates will be within 100 kb/d of the correct output for April 2015.
In fact, I would estimate that the petroleum supply monthly estimate is mostly incorrect due to a poor estimate of Texas C+C output. If we take the difference between the Petroleum Supply Monthly and Monthly Energy review for US C+C output and assume that all of this difference is an overestimate of Texas C+C output we get a “modified” EIA estimate for Texas which I show in the chart below. Looking back at Dean’s estimate from last month it looks like the March C+C estimate has indeed increased somewhat from last month’s estimate and I think if Dean looks back at his old estimates for the most recent couple of months for each of his estimates he will find that they are always an underestimate relative to the newer estimate, so that his estimates are biased on the low side for the most recent 2 or three months. Dean can correct me if this is not the case, I am guessing based on only two month’s estimates (from June and May of 2015). A chart of the “best estimates” from Jan 2015 to June 2015 would be instructive (similar to what Ron does for the RRC data).
So my guess is that Dean’s estimate is correct through Feb 2015, but that his estimates may be a little low for March and April. My estimates below for Texas C+C in kb/d:
Sep-2014 _ 3202
Oct-2014 _ 3265
Nov-2014 _ 3289
Dec-2014 _ 3326
Jan-2015 _ 3402
Feb-2015 _ 3447
Mar-2015 _ 3545
Apr-2015 _ 3581
Dennis, you have Texas January production up 70,000 barrels per day. The Texas RRC data, after three months of corrections still has January down by 165,000 barrels per day from December. I would bet you big money that Texas production actually declined in January and your January estimate is off by well over 100,000 bpd.
Incidentally, another EIA reporting agency just published their numbers through February 2015. The International Energy Statistics just came out. They have January US C+C production down 14,000 bpd and US Total Liquids down by 351,000 barrels per day. Eventually the EIA gets it right. But those January C+C numbers will still be revised lower.
Hi Ron,
The December estimate I made may be too low, the assumption that the Monthly Energy Review is always the better estimate is probably incorrect, I would not sweat the specific month to month variations too much, the bottom line is that we will know in two years what actual Texas output is (as in a complete accounting of all Texas output).
In the mean time you can claim that Texas output was down sharply in January and perhaps you are correct, I don’t really get too excited by little wobbles up and down from month to month, the overall trend is what matters, I believe that trend is up, time will tell.
the bottom line is that we will know in two years what actual Texas output is
Well it will not be nearly that long before we have a very good idea what is happening. For instance we already know that there was a big drop in Texas oil production in September, 9 months ago. And I already know that there was a huge drop in January. But apparently you are not yet aware of that fact. 😉
Dennis, apparently you are of the opinion that the Texas RRC data is totally worthless. That is far from the case. Every time there is a huge drop or a huge increase in the RRC data that change always shows up in the final data. Not by the magnitude it first appeared of course, but the hugh change does not magically go in the opposite direction months later.
Just check September and May of 2014 and November of 2013. These months showed huge drops the month they first appeared, and that decline is still there.
Hi Ron,
It depends on how you define huge, if 100 kb/d is a “huge drop”, perhaps you are correct. A bet would need to define “well over 100 kb/d”, does that mean 150 kb/d. Note that my December value may be too low. Are you saying that January output will be 153 kb/d under the value I have estimated, which would be less than 3250 kb/d for all Texas C+C output?
I am thinking that is more than Dean’s best estimate.
If Dean is reading, it would be interesting to see the numbers for his central estimate from October 2014 through April 2015 for TX C+C.
Hi Ron,
It looks like Dean’s central estimate for TX C+C in Jan 2015 is about 3300 to 3350 kb/d , my estimate for Jan 2015 is about 50 to 100 kb/d higher than this. In my mind, given how little good data we have, this essentially the same estimate, it is well within the 95% confidence interval in Dean’s chart( the low end of his range is about 3200 kb/d vs my estimate of 3400 kb/d and the high end of his range is above 3500 kb/d).
Dennis, my point is that you show the trend climbing ever upward just like the EIA. My point is that Texas April 2015 production is below December 2014 production. Therefore the trend is down.
Dean is on vacation, out of range of the internet and will be there for about a week. He sent me his charts from the airport as he was leaving.
Hi Ron
December was a high point we don’t want to cherry pick.
Dennis, December happened. Oil peaked, so far in the Bakken, in December. It was very likely the high in a lot of other places also.
Pointing out a high in production is definitely not cherry picking. Also any downward trend always begins at the high point. It could not possibly do otherwise.
I will not point to the peak in any production and call that cherry picking though you are, of course, free to do so.
Hi Ron,
The trend at this point looks very slightly down, based on Dean’s central estimate, note that his high estimate shows and increasing trend. The estimates will be revised next month. Dean shows a downward (very slightly so), and the EIA shows a steeper upward trend, reality is likely to be a slightly upward trend in my view, through May, then the trend will flatten and probably decline slightly by the 3rd quarter. If oil prices rise to $100/b by May 2016 output will flatten or rise slightly.
The EIA’s Drilling Productivity Report has total shale down 208,000 bpd in July. But they have the decline beginning in May. I think the decline began in January and will be down by a lot more than any of the EIA groups believe.
Hi Ron,
The Drilling Productivity Report(DPR) is not very good. In the case of the Bakken the DPR is at least 30 kb/d too high in March 2015. The Eagle Ford estimate in March 2015 for the DPR is at least 150 kb/d too high, and the Permian DPR estimate is at least 50 kb/d if we assume all New Mexico output is from the Permian Basin region. So the DPR overestimates in March 2015 by at least 230 kb/d.
Bottom line, I ignore the DPR, it is not very good.
Dennis, in spite of what you tell me, clearly you still think we don’t know how to add down here in Texas and don’t understand the accounting process. You are stuck in the mud and I can’t pull you out.
Remember, its not possible to maintain Eagle Ford LTO production levels (that decline at the rate of 65% the first year) with half the rig count we had one year ago. Don’t buy too much into the frac back-log thing in Texas; ain’t so, IMO. And for the record, I’d say at least a dozen of Baker’s rigs still working in the EF or not actually drilling shale, but fractured carbonates. The trend is down, not up. Take 3 Advil and call me in 3 more months.
Mike
Hi Mike,
I think you guys can add just fine. I think one computer system (for taxes and such) does not communicate with other computer systems (for the PDQ) in a timely manner. Or you guys like to make sure all the data is perfect before it is reported, I just don’t know.
I have shown over and over that the PDQ data is incomplete, everyone seems to agree.
Ron seems to think it is a big deal that there was a decline in January, I don’t care what happens in any single month, the trend over several months is what is important in my view.
The output levels in the Eagle Ford have been maintained so far, with a possible small decline (about 50 kb/d), depending upon what the best guess for total Texas output is.
Ron seems to think it is a big deal that there was a decline in January, I don’t care what happens in any single month, the trend over several months is what is important in my view.
The decline in January and April is runs contrary to what the EIA and Dennis is saying. That difference is as plain as black an white.
Dennis your data shows Texas April production 255,000 bpd higher in April than in December. So you believe the trend is not just up, but sharply up. No the trend is slightly down. I said up thread that your January guess is off by over 100,000 bpd. Now I am saying your April guess is off, I believe by about 300,000 barrels per day.
The trend is down. Do you think that is important?
Hi Ron,
As I said before, these are all guesses, I am assuming that the EIA has access to information that I don’t have access to, perhaps the EIA estimates are too high in the MER.
I have plainly stated my assumptions and that they could be incorrect. I will be very surprised if my April estimate turns out to be 200 kb too high. Do you really feel confident that April TX C+C output will be less than 3380 kb/d?
I maintain my position that we will not know what final output for Texas C+C output in April 2015 is until June 2017, in June 2016 output as reported by the PDQ will only be at about 99% of its final output, if the speed of production data reaching the PDQ remains the same as the past history.
The trend is actually pretty flat from Nov to April based on dean’s estimate. I think output in TX is flat or up slightly the trend is not down.
I give up on the reporting thing, Dennis. I have two questions for you, however:
a.) to what do you attribute your fairly consistent production levels to in Texas with a 60% decline in rig count in the past 8 months?
b.) if rig count has had no effect on production trends in Texas, what, if anything, will? In other words, do you believe we will stay relatively flat (or as you say, trend upwards) until oil prices improve and LTO can simply ramp back up again?
Mike
Hi Mike,
Unlike you, I believe what I have read about there being a substantial frack-log in Texas, I have no data to back me up.
My estimates of Permian and Eagle Ford data in April suggest that so far the completion of wells in the frack log have kept output up.
If the Texas LTO plays follow what is going on in the Bakken/Three Forks, I think that the decline in rigs will only have a big effect when the frack log is close to zero.
Another fact is that in Texas a lot of the rig count decline is in vertical rigs rather than horizontal rigs, so the horizontal rigs have been cut in half, most of the output is going to come from the horizontal rigs rather than the vertical rigs.
So if oil prices go back up to $90/b by May 2016 as I expect, I think TX output will be flat or possibly up slightly ( we may see a small decline, but no more than 200 kb/d below November 2014 levels over the course of 2015.) By June 2016 TX output will be higher than it is today (though we won’t know until August 2018).
If the Texas and ND tight oil production stays flat (say through 2020) then will we not see a significant decline in world oil supply (i.e. a clear 2015 peak rather than your plateau for five years). I’ve seen figures indicating development projects worth $200 to $400 billion being cancelled or delayed. If this was all for oil production facilities this would equate to 3 to 6 mmbpd lost. Admittedly some of this is for gas and some may be for exploration which would have a longer time frame to impact supply. The reports don’t always give enough detail to understand exactly how the numbers are arrived at, but I think they mainly only cover IOCs and maybe some medium sized companies – OPEC NOCs also seem to be cutting back on projects so the numbers might be low. At the best of times the industry had a maximum capacity for development and I doubt they will ever be able to get back to that level with an already ageing workforce being hit with current lay offs and recruitment hiatus. Plus I don’t think $90 or even $110 per barrel would be enough of a drive to even try. Therefore there seems to be a major short term (5 year) supply shock about to be added to the early post peak downslopes that you have modelled so well.
Hi Mike,
Bloomberg reported at the end of April that about 4700 wells were waiting on completion.
http://247wallst.com/energy-economy/2015/04/24/oil-well-completion-backlog-could-weigh-on-crude-prices-for-years/
Excerpt below:
More than 1,500 wells in the Permian Basin, 1,250 wells in the Eagle Ford and 632 wells in the Bakken have been drilled but not completed.
A slightly different estimate of Texas C+C output using the Petroleum supply monthly estimate through October 2014 and then using changes in lower 48 monthly C+C output in the monthly energy review from November 2014 to April 2015.
I assume all change in lower 48 C+C output is from the North Dakota Bakken/Three Forks and Texas. We have complete data for North Dakota, so if we subtract the Bakken change from the lower 48 change in output we can estimate the Texas change in output each month from Nov 2014 to April 2015.
Chart below.
The Eagle Ford estimate is based on the TX C+C estimate, so the different estimate above results in the EF estimate below.
The Permian Basin output (Texas only) changes as shown below.
The weekly EIA report is showing 9324 kb/d for the last week in February while the February EIA international monthly report is showing 9238 kb/d, a difference of 86 kb/d too high. As you suggest it will probably get worse.
Hi ovi
the best estimates of us output are in the monthly energy review. The weekly numbers are a snapshot and do not get revised.
Article on carnage in the service industry, with a focus on the GoFrac case history:
http://kfgo.com/news/articles/2015/jun/18/small-us-frackers-face-extinction-amid-drilling-drought/
It’s going to take quite a while to get anywhere close to last year’s drilling and completion numbers, even with the right oil price incentive.
Given the documented very high decline rates in US gas production*, it certainly seems quite possible that we could see a natural gas supply shortfall this winter in the US.
*My comment on US decline rates:
http://peakoilbarrel.com/opec-the-eia-and-other-news/comment-page-1/#comment-520916
That will catch many by surprise, given the press headlines about fracking for gas.
An interesting study of the press is to look at the U Texas Bureau of Economic Geology (BEG) study of the Barnett shale.
In 2013, they called the peak in the Barnett in 2012 (though using data only to 2010),
see oil and gas journal reprints down at the bottom of:
http://www.beg.utexas.edu/shale/pubs.php
The 2012 peak in the Barnett is born out in the data thru March 2015:
http://www.rrc.state.tx.us/media/22204/barnettshale_totalnaturalgas_day.pdf
But the press responses to the BEG study?
http://www.beg.utexas.edu/shale/media.php
Media articles from Feb. 2013
“New, Rigorous Assessment of Shale Gas Reserves Forecasts Reliable Supply from Barnett Shale Through 2030” – UT Austin News service
“Gas Boom Projects to Grow for Decades” – Wall Street Journal
“2/28/2013 Study: America Is Just At The Beginning Of A Gas Boom That Will Last For Decades” – The Business Insider
You have to go down 9 articles to get to this one:
“Barnett Shale Output to Tumble Through 2030, Study Says” – Bloomberg
Reading the text of the articles and they all pretty much say the same thing,
production peak in 2012 at 2 Tcf/yr, down to 900 Bcf/yr in 2030.
How can people say “boom” in the headlines, and “declining” in the article?
How is a “reliable supply” one that declines by more than half over 18 years?
Is the math beyond them?
Does 900 Bcf look bigger than 2 Tcf?
Is trillion bigger or smaller than billion (many of these are financial media!) ???
Are they so used to growth they can’t even conceive of decline?
That’s reliable supply for Texas. It doesn’t involve gas exports outside the republic to other countries.
The Baker Hughes Rig Count is out. US rig count down by 2, Oil rig count down by 4, Gas rig count up by 2, GOM down by 2.
Ron, great post. Thank you!
The month that I think points out the most that EIA is just estimating TX, without a lot of hard data to back things up, is January, 2015.
It has been discussed at length that weather related issues caused a significant loss of production volume in January in TX, both on this site and elsewhere.
Per RRC, 12/14 production C+C bbl per day 3,155,128. 1/15 production C +C bbl per day 2,997,593.
Per EIA, 12/14 production C +C bbl per day 3,492,000, 1/15 production C + C bbl per day 3,553,000.
So the difference between RRC and EIA in 12/14 is 336,872, in 1/15 is 555,407. I don’t think that big of a differential can be entirely explained by incomplete data. Especially when the differential between the two in 1/15 is 555,407, but by my calculations goes to 620,002 in 2/15. EIA is not factoring in weather related issues at all, it appears, even though those issues are well known and happened five months ago, giving EIA plenty of time to make adjustments.
My guess is that 12/14 will end up being shown to be the peak of US production, or at least very close. It looks to me the EIA could be off by 200-300,000 bopd of C +C at this point?
If that is correct, would seem to be enough to move the WTI market a little?
AlexS, had two very good links about shale oil economics, one from Bloomberg and one from EIA, at the end of the last of Ron’s post. I think it would be good if those were posted again here, since many may have not been reading the end of the Ron’s previous post in anticipation of this new TX post.
It appears that MSM and EIA is finally taking notice that at low oil and gas prices, these companies are in too deep. I have also read, maybe on another link here, that banks will likely take a much harder line in September during borrowing base redeterminations than they did in March, 2015.
I think US production is peaking, but if the capital is shut down, there could be a steep drop at the end of 2015 and into 2016. Look what happened to EOG Bakken production when they stopped completions, per Enno’s and Rune’s data.
Finally, I wonder why EIA sees the rigs returning in large numbers in 2016, boosting US oil production again. This seems contrary to it’s recent data post, which AlexS linked, indicating the massive losses shale oil companies experienced in Q1, 2015, plus EIA’s own low price forecasts through 2016. Those three data points do not reconcile.
Maybe the people looking at the economics of shale oil at the EIA never talk to the people who are estimating future US production?
“……..Those three data points do not reconcile.”
Indeed shallow sand. EIA people seem crazy.
Hi Shallowsands,
I think the EIA may be a little high, which is why I adjusted the numbers from the petroleum supply monthly to lower values. Not low enough for many here, but I think, as I usually do, that reality will be between the optimists (EIA) and the pessimists (POB).
Dennis. I am not referring to the debate you are having with others here about late 2014 US production levels through this month.
EIA forecasts WTI to average $55.35 in 2015 and $62.04 in 2016.
EIA came out with a report which showed large losses for US independent oil producers in the first quarter of 2015, which followed small losses in the fourth quarter of 2014. AlexS posted same at the end of the comments to Ron’s previous post. In the fourth quarter of 2014, oil prices were significantly higher than EIA projection of $62.04 for 2016 WTI.
EIA also forecasts that US oil production is declining now and through the end of 2015, but that there will be a rebound in 2016.
What is going to cause US independents to ramp up production in 2016 if WTI averages $62.04? If anything, I think production would fall further, as any current completion backlog would be pretty well worked through by this time next year.
I think you feel prices will be much higher soon. EIA does not, yet they see US production returning to growth next year. I don’t get why they do.
If EIA is correct on price through 2016, my opinion is several companies will file bankruptcy. Possibilities include Halcon, Sandridge, Goodrich, Emerald. Many others could be in the boat the aforementioned are in now at the end of 2016 with $62.04 WTI.
Hi Shallow Sands,
I mostly agree with you, but I have always said the Drilling Productivity report is not very good and I ignore it. For Production Data estimates through April 2015, the EIA has US C+C output up, not down through May 2015. Then output falls in the Short term energy outlook from May 2015 to Feb 2016, by 400 kb/d.
I don’t think much of the EIA’s price forecasts or output forecasts, so I will not try to defend them. The EIA estimates of past output in the Monthly Energy Review are probably within +/-3% of actual output, time will tell.
Worth a read:
https://carboncounter.wordpress.com/2015/06/17/there-is-no-renewables-revolution-in-china-here-are-the-numbers-that-show-this/
I suspect that this isn’t news to many or most here, but it was instructive to me. I suppose building 1 coal fired plant a week (that’s still happening right?) is a huge thing to overcome in terms of which energy source is growing faster.
Anyways, putting it out there for everyone’s consideration.
The link didn’t work for me – I had to google it, and use another site.
In any case, this comparison is misleading – it’s apples and oranges. It compares fossil fuel consumption in all energy sectors to renewable consumption in the electricity sector, when it’s only the electricity sector that people are talking about; and it compares overall energy growth over a number of years to the most recent renewable growth – China’s slowdown of coal consumption is very recent.
About 3% of their electricity comes from non-hydro renewables, and the rate of growth in electricity generation from those sources actually seems to have slowed in the last year.
If one looks at purely the electricity statistics from the BP data, and finds the % share of the annual growth in electricity consumption which came from wind and solar, it maxes out at 14% last year. His claim still rings true.
14% of new generation from wind really isn’t bad.
Remember how exponential growth works – it starts out at a small base, and then surprises you. Wind power is relatively new in China. Look at it’s growth (and remember, the last year is always understated, because it only includes part year production from new installations):
Yes, but it’ll likely be more like a logistic curve, which is what it looks like we’re seeing in Europe at the moment. China is somewhat hamstrung by its lack of offshore wind, though, so I suspect wind penetration will end up on the low side. Course a lot will depend on whether this economic slump everyone’s talking about turns out to be as bad as suspected.
I’ve often experienced ongoing bitterly cold winds coming from Mongolia in the winters (in China). Perhaps this airflow can be utilized for turbines? If so, it would certainly be a blessing.
They are planting millions of trees to slow down the wind and reduce the growth of desertification. Maybe the wind turbines will slow the wind too, so they need to build a lot of them.
I am only reading what I run across rather than actually researching anything in a serious fashion, but it is my impression that the Chinese have built wind farms faster than new transmission capacity.
So if they get caught up on transmission lines the rate of growth of wind power will probably pick up for the next year or two at least.
Fourteen percent is nothing to sneeze at. That much wind power has obviously already saved them a FORTUNE in avoided coal purchases- not to mention reducing the local pollution levels at least a little bit.
Delivered coal ain’t cheap.Coal mined in the the upper western states USA is selling for five or six times the mine mouth price delivered to Atlanta the last time I checked.
The less coal is sold, the cheaper it gets for everybody who uses it for any purpose.Hence the Chinese steel industry (for example) is saving money too , because of Chinese wind farms.
The only people who should not be happy about wind power growing by leaps and bounds are the people directly involved in the fossil fuel generation industry and maybe the nuclear industry.
Environmental considerations and the price of labor are not likely to stop the Chinese from building pumped storage facilities so as to take full advantage of their increasing wind capacity.
Maybe some of the engineers who hang out here can look at some maps and tell us how much pumped storage they can build at reasonable expense if they choose to do so.
NIMBY’s and BANANA’s aren’t very influential in China. Pumped storage will get built wherever there is a suitable site when they get around to doing it.
Any body who complains too loudly is apt to get relocated to one of the relatively unspoiled parts of Mongolia instead of a few miles to a new village.
Here’s the chart for growth of new wind power per year:
Installations are a little clearer:
If I read the tables correctly, China increased it’s average power consumption by 24.9GW in 2014. That’s about 75GW of wind capacity, so about 1/3 of new consumption is being handled by wind.
Even linear growth at the same rate we’ve seen recently would get China to 50% of new power coming from wind alone in just 5 years.
Ecological sustainability 101 says that neither exponential growth nor linear growth can be maintained indefinitely. So the wind growth graphs shown above look quite unsustainable to me.
About China, I wrote about it. Here it is again. In 2014, China built 22GW of hydro power, 47 GW of fossil fuels power, 5 GW of nuclear power, 21 GW of wind power, and 8GW of utility-scale solar power.
Fossil fuels electricity generation (mainly coal fired power) declined by 0.7%, mainly because hydro electricity surged by 19.7%.
In 2014, China’s electricity generation grew by 3.6% or 193 TWH. Hydro electricity grew by 19.7% or 175 TWH. Wind electricity grew by 12.2% or 14 TWH, only 7 percent of China’s electricity growth. Solar electricity grew by 171% or 15 TWH, 8 percent of China’s electricity growth.
Even wind and solar combined is far from accounting for more a half of China’s electric power growth.
PE,
A few thoughts:
First, your numbers don’t agree with the BP statistical review. Have you compared your numbers and tried to reconcile them?
Second, I absolutely agree that those curves will level off. That’s not the question. The question is when and where they will level off. What limits to their growth do you see, before they reach a level sufficient to replace fossil fuels?
Finally, it’s interesting to note that your numbers indicate that less than half of China’s new generating capacity in 2014 was fossil fuel.
These are Chinese electricity industry association’s official numbers.
I checked BP’s data which says in 2014, China installed 24 GW of wind power and 10 GW of solar power. These are similar to the Chinese source.
It’s normal for data from different sources to disagree because of different data coverage / statistical methods etc. For example, the Chinese source for solar power (as I said) includes only utility-scale solar (6 MW or above). And, of course, normally the BP data is second hand.
Yes, new fossil fuels power (by generating capacity) is less than half of the total newly installed capacity. Still, it’s 47 GW. That alone is close to the total global wind installed capacity in 2014 (52 GW).
By replacing fossil fuels, are you talking about just replacing the growth or the entire fossil fuels electric power, or the entire fossil fuels?
The world elecricity use grows by about 3% a year. World current installed capacity is about 6000 GW. To sustain 3% growth, it takes 180 GW.
The average capacity utilization rate for the world’s current electric power sector is 40-50%. Let’s say 45%. The observed world average capacity utilization rate for wind is less than 25% and for solar, is less than 15% (please refer to BP). Say, the average for wind and solar is 20%.
Therefore, to replace 180 GW (required for growth of electricity) of conventional power, it wil require 180 * 45% / 20% = 405 GW of wind and solar power
That’s just to replace the growth and just for the electric power sector!
Until the total annual installation of wind/solar hits 400 GW, it’s premature to talk about “replace”
To build 180 GW of conventional power, it consumes about 9 million tons of steel (at the rate of 50000 tons per MW of coal/gas power plant). To build 400 GW of wind/solar power, it consumes about 40 million tons of steel (at the rate of 100000 tons per MW of wind/solar power plant). This is close to 3% of world steel production and requires the burning of about 20 million tons of coal.
My guess is that wind/solar building will begin to level off long before it hits 400 GW because of the intermittency problem and the higher steel price in the future.
To sustain 3% growth, it takes 180 GW.
First, that’s dominated by China. And, as we just saw, less than half of China’s new capacity is fossil fuel. So, we don’t have to replace 100% of new generation, but rather much less than that, to eliminate fossil fuel growth.
2nd, didn’t someone just say: “Ecological sustainability 101 says that neither exponential growth nor linear growth can be maintained indefinitely”?
To build 400 GW of wind/solar power…is close to 3% of world steel production
And that’s barely above a rounding error. You’re not really suggesting that would create a limit to wind installations?
wind/solar building will begin to level off long before it hits 400 GW because of the intermittency problem
That’s a different question. And, as we’ve seen elsewhere, a grid that eliminates fossil fuels entirely is practical. Of course, we’re not going to get close to that for many decades, so that’s a distant challenge.
To put things in perspective, China has been increasing it’s electricity production very quickly using mostly coal and produces more electricity than the US. Coincidentally renewablesinternational.net has a post today Global electricity overview for 2014 which basically links to this PDF. Lots of data based primarily on the BP STATISTICAL REVIEW 2015.
My take is that the world wide growth rate of renewables, in particular solar, over the period under review is nothing short of phenomenal. From the summary
Wind power electricity production jumped in ten years by a factor of 8.25 (+ 23.5 % per year) to reach 706 TWh in2014 (3 % of world electricity and + 621 TWh/year compared to 2004 when the annual production was only 86 TWh).
Solar production (mainly PV) was multiplied by a factor of 71 in ten years (+ 53,2 %/year), up to 186 TWh in 2014 and 0.8 % of world electricity production.”
Now this is for the whole world and as our own Robert Wilson points out over at Carbon Counter the scale of coal fired generating capacity in China is just staggering! The thing is, it is the rate of growth that suggests a revolution and the rate of growth of PV capacity in China since 2008 has been impressive. Only between 2013 and 2014 did it not double at a minimum. See graph below.
The growth of hydroelectric power has been quite remarkable as well with China generating over 27% of the total amount of hydroelectricity in the world and just under three times the amount generated by Canada or Brazil (see page 116 of “Global electricity overview for 2014”). Despite this China still only ranks 20th in terms of the amount that this hydroelectricity contributes to the national total at 18.8%.
China generates the most electricity from renewable sources (including hydro) in the world, generating 24,6% of the world’s renewable electricity more than twice as much as the second place US with 10.4%. (see page 115 of “Global electricity overview for 2014”). From page 116 of “Global electricity overview for 2014”, China Ranks second behind the US generating 16.7% of all the electricity generated using non-hydro renewable sources in the world but, still only manages to rank number 33 in terms of the contribution of non-hydro renewables to the national total at 4.2% (see page 115 of “Global electricity overview for 2014”).
It is the sheer size of electricity consumption in China that is masking the renewables revolution in a similar way that the absolute size of US capacity makes it easy to ignore the fact that non-hydro renewables now contribute some 6.7% to the national total.
Based on the graph below, my advice would be, ladies and gentlemen, do NOT take your eyes of that ball. It is moving very fast. That exponential growth thing will catch you off guard everytime!
Using RRC data for the Permian basin and statewide Texas C+C output I found the percentage of Texas C+C produced from the Permian basin. This is multiplied by my estimate of Texas output from the monthly Energy Review(MER) and Petroleum supply monthly(PSM) where the difference is subtracted from Texas output in the Petroleum supply monthly (basically assuming that the MER is correct and all errors in the PSM US total are due to a bad Texas estimate, the assumption may be incorrect).
Using the same method as I used for the Permian Basin (and the same modified EIA estimate), I estimated Eagle Ford output.
EPA New! Proposed Rulemaking: Phase 2 Greenhouse Gas Emissions Standards and Fuel Efficiency Standards for Medium- and Heavy-Duty Engines and Vehicles
http://www.epa.gov/otaq/climate/regs-heavy-duty.htm
One of their presentations refers to a unit called a “megagram”. They also use grams per mile. I’m going to ask them if they want to use solar masses per parsec.
Mason Inman has a new post up, covering much the same ground as you and Dean, Ron. Perhaps it would be productive if you, Mason and Dean all compared data? Three heads are better than two!
https://www.beaconreader.com/mason-inman/all-my-guesses-live-in-texas-part-1?ref=profile
REN21 Renewables 2015 Global Status Report
http://www.ren21.net/status-of-renewables/global-status-report/
It is amazing that we are in a position to need a highly refined crystal ball simply to understand the past. Obviously the community here is much more skilled at that than many elsewhere. I found an article, The Texas Natgas Massacre, projecting an incredible 3.25 bcf/d decline in Texas natural gas production by the end of this year. It is a very detailed and interesting read even if it might have little credibility to the more informed community here:
https://oilandgas-investments.com/2015/natural-gas/the-texas-natgas-massacre/
The author of this article is projecting sharply higher natgas prices based on this supply decline. There seems to be evidence for an emerging El Nino that may exceed the very powerful El Nino of 1997-98. This will almost certainly create a sharply higher global average temperature record for 2015. Unfortunately for the bulls on the natgas market, such a strong El Nino is likely to produce very low total heating degrees for this summer (expected cool central US all summer and cool July and August for the Eastern US) and rather low total heating degree days for a very mild upcoming winter. If this comes true we might have less that $2 natgas and an additional wave of declines in natgas directed rig counts. I don’t know if anyone wants to extend their crystal ball visions this far into the future or to include the possible implication of an El Nino. However, we should be aware that we are moving into a very strange and interesting future.
El Niño conditions have been on and off since early 2014. I would bet on a warm winter for the world average. But the North Atlantic is showing a cold anomaly…the NE and Midwest could have a cold winter. Or maybe not.
I don’t think there’s a safer bet than 2015 being warmest on record by a considerable margin.
The cold North Atlantic shouldn’t be considered an anomaly anymore, it’s a feature caused by accelerating cold melt water flow from the Arctic and Greenland. It has been estimated to be able to keep global warming temperature rises in North Europe down to about half the world averages through this century. It also disrupts significantly the ocean thermohaline circulation and may virtually stop the gulf stream which will have many effects, and is not fully understood by a long way. The worst that has been posited is to lead to producing anoxic oceans over a few centuries, but as a minimum it will raise the sea level for north eastern US coasts by 1 or 2 foot due to the loss of the current (some form of coriolis effect I think).
A recent paper reported the thermohaline circulation is speeding up. It helps to read gobs of papers about the subject. I’d like to quote from it:
“Since the mid-1990s, hydrographic properties and current velocities of the Faroe Current have been monitored along a section extending north from the Faroe shelf. From these in situ observations, time series of volume, heat, and salt transport have previously been reported, but the high variability of the transport series has made it difficult to identify trends. Here, we present results from a new analysis of the Faroe Current where the in situ observations have been combined with satellite altimetry. For the period 1993 to 2013, we find the average volume transport of Atlantic water in the Faroe Current to be 3.8 ± 0.5 Sv (1 Sv =106 m3 s−1) with a heat transport relative to 0 °C of 124 ± 15 TW (1 TW =1012 W). Consistent with other results for the Northeast Atlantic component of the THC, we find no indication of weakening. The transports of the Faroe Current, on the contrary, increased. ……..During the same period, the salt transport relative to the salinity of the deep Faroe Bank Channel overflow (34.93) more than doubled, potentially strengthening the feedback on thermohaline intensity. The increased heat and salt transports are partly caused by the increased volume transport and partly by increased temperatures and salinities of the Atlantic inflow, attributed mainly to the weakened subpolar gyre.”
http://www.ocean-sci-discuss.net/12/1013/2015/osd-12-1013-2015.html
The Jetstream over North America is still truncated and slow. If that does not change, the northeastern US is in for a cold winter again.
You really like to talk the big talk, don’t you Ferny? It’s almost as if you want to control the discussion, no matter what the topic.
We think we have figured out the math and physics behind the El Nino-Southern Oscillation (ENSO) phenomenon over at the Azimuth Project, http://forum.azimuthproject.org/discussion/1608/enso-revisit#latest
http://www.azimuthproject.org/azimuth/show/Experiments+in+ENSO+modeling
If this is right and the fact that it works pretty swell at fitting the data over the last 130+ years, it could mean that we have a handle on predicting future sloshing events with much better accuracy.
”El Niño conditions have been on and off since early 2014.”
I can’t see very well past the end of my nose without specs but I do read a fair number of articles about the climate.
My personal seat of the pants estimate is that Fernando’s comment is pretty much in the ball park according to the varied opinions of climate pundits. There has been substantial disagreement among the pros as to the extent and or intensity of the El Nino for the last year or so.
WHT,your articles are no doubt extremely interesting to people who are really into the details of modeling and who have the time available to digest them – but they are TLDR for me, in addition to being too technical for me, given my background and age. I forgot most of the math I once learned thirty or forty years ago and to be honest I probably never learned enough in any case.
What is YOUR prediction for the remainder of this El Nino cycle?
Mac, this is a Japanese webpage, showing a really comprehensive look:
http://ds.data.jma.go.jp/tcc/tcc/products/elnino/elmonout.html#table
Here’s their prediction
http://ds.data.jma.go.jp/tcc/tcc/products/elnino/outlook.html
I like the Japanese data and predictions, they seem to be much more focused on the science and less on the politics.
Here’s an Australian Southern Oscillation Index.
http://www.bom.gov.au/climate/enso/#tabs=SOI
The Australians use SOI < -7 as El Niño conditions. The index went below -7 in April 2014, but bounced back during the following months.
I've read several analyses, and they seem to agree this is a two year event, with the high temperature conditions staying in a borderline area during 2014, swinging into full Niño in 2015. The huge question is whether the subsequent Niña will be a strong event. If so, the summer of 2016 will be a cool summer (just speculating).
As a modeler in the field of climate and agriculture, I can tell you many of my fellow modelers from the public sector put far too much credence in their model output. In one of my models, I can make the Potomac River run dry by fiddling with the settings for reservoirs in the water shed. I can also predict a week ahead of time the the daily flow, sediment, nitrogen, and phosphorus in the river when i get the model calibrated correctly. The issue with the type of models the liberals in academia use to investigate something like ENSO is there is no good way of calibrating or proving any type of skill by the model until the predicted events are in the past. Many of these models compare output to other modeled output for validation. Until the models can show some hindcasting ability with known data, we always need to take modeled data and the perpetuation of the climate change theory with a big grain of salt. Also keep in mind that much of the work involving these models is done mostly under the pretense of allowing the research scientists to secure long-term taxpayer funded grants tied into their future job prospects.
Tom, don’t be harsh on modelers. My first exposure to this topic came about when I got me a summer job working aboard a NOAA vessel taking current and other measurements. I was attached to a very brainy PhD who used to go nuts trying to figure out how we could model the Gulf Stream as it turned around the Florida peninsula and shed eddies all the way to cape hatteras (that was our project area). Many of these guys are really interested in understanding how nature works.
Tom, you’re blowing smoke.
Also keep in mind that much of the work involving these models is done mostly under the pretense of allowing the research scientists to secure long-term taxpayer funded grants tied into their future job prospects.
You’re saying that all climate models are done by US research scientists dependent on taxpayer money? No one else who doesn’t fit that description is doing climate research models?
That’s a big reason we don’t take comments like yours seriously. Your conspiracy theories don’t hold up to reality.
You know nothing about my professional life or education. I rarely post anything to avoid revealing personal facts about myself because the people I work with would ostracize me if they knew I wasn’t a full fledged member of their climate science cabal. I regularly work with and consult with several authors of the IPCC. If I tilt my chair back during the workday I can look across the courtyard to the NCEP headquarters, where several colleagues and collaborators call home. My work has been published in peer reviewed journals. I have been invited to participate in panels on agricultural practices related to climate change. I work at a major university heavily invested in water quality, adaptive agricultural and growth management techniques. You know nothing about my credentials, past or knowledge-yet you pass judgement on me by implying I am intentionally spreading conspiracy theories that just so happen to disagree with the spoon fed version of the world most liberals hold onto. Do you even have a background in modeling the climate, earth systems, satellite data algorithm designs, etc? Based on your past messages here suggesting a rudimentary understanding of science, I’m going to have to assume no, but feel free to criticize and correct me if I am mistaken.
If you can show that climate scientists are wrong…Why don’t you publish a paper on it?
You might get a NOBEL prize. I would love to have that on my CV.
Also, break your comments up into easy to read paragraphs. It is a much better way to communicate. Easier on the eyes.
Someone who has published papers in peer reviewed journals would know this…… I think.
Friend, the discussion should not be whether “climate scientists are wrong”. Most climate scientists don’t develop climate models, nor do they use them. Tom is right in the sense that climate models are oversold, and people who work in the field do get relentless attacks and have their careers ruined if they don’t toe the official line (the hounding of Lomborg is an excellent case).
I disagree with Tom because I’ve worked with climatologists for many years, and I think most of them are truly interested in improving their field. At the same time I sense there’s a lot of cynicism and careerism involved in using flawed climate model results to do “research” which amounts to a pile of garbage.
If you wonder why I happened to work with climatologists, when I was in college I took several oceanography courses because I wanted to graduate as an engineer and then join the U.S. Navy. Later, when I shifted to the oil industry I was able to pick assignments, and I landed myself in Arctic projects. Eventually I coordinated a fairly large team studying the development methods we could use in the Arctic, and we loaded up with several climate experts (but we called them Metocean Engineers because we were an engineering outfit). This gave me a good insight on what they do, their models, and the confidence they put in such models.
I have two issues with what Tom and his like are saying:
1. That there is a worldwide conspiracy to introduce false climate data.
2. That by discounting climate data, it’s going to change where we’re headed. This is a peak oil forum. Most people here anticipate hard times ahead irrespective of climate changes. It’s a resource issue. Debating climate data is a diversion that doesn’t change the resource issue.
It’s not a “worldwide conspiracy”. This doesn’t seem to sink in. The data is massaged by a very few teams, and used by everybody else. The trouble spots are in NOAA. NASA plays along, but their products (UAH and RSS) are fine.
The technical problems arise when the data is used to tune the climate models, and the model results are used for government propaganda.
I also have a purely technical concern with the way the data is used to arrive at a worldwide average. The methods they use are fairly simple minded, and thus far only the Berkeeley Earth group is using a better method (kriging, which we use in the oil industry to describe oil field geology for our dynamic models).
I think the problem is simply that this has become so political we can’t discuss it without getting insulted. I try my best to keep things civil, but it sure gets boring to listen to arguments which miss the point.
The technical problems arise when the data is used to tune the climate models, and the model results are used for government propaganda.
Tom was faulting climate modeling because it was being done by university researchers and university researchers are suspect for taking grant money.
But that would suggest that all university research is suspect because it uses grant money. If that is the case, we’ve got to re-examine the entire concept of scientific research. What usually happens is (1) Funding sources are supposed to be disclosed so we can look for evidence of bias. (2) Research is supposed to be widely scrutinized to look for errors.
Tom was also implying that only university researchers are doing climate modeling. I cited articles about the insurance business doing its own modeling.
I have always maintained that long term climate trends are a poor way to get people motivated to change lifestyles. So I don’t pay really close attention to the climate talk because I know that most of us aren’t going to do much different because of them. It’s too far off in the distance for most of us to grasp.
But what irritates me is stupid thinking on the subject.
And also what irritates me is the idea that people need to challenge climate research so that “left-wing” folks don’t force them to make lifestyle changes. The lifestyle changes ARE coming anyway and it is for economic reasons. Debunking climate studies isn’t really going to change that reality.
Hey Fernando,
I enjoy your posts and you are obviously a smart guy.
My opinion is simple, if you can find a flaw with scientific consensus and your argument is good, you can publish a paper on it and receive status for it if you are correct.
If you can disprove the Greenhouse Effect you will go down in history as one of the greatest scientists ever.
I don’t buy that scientists all over the world are fudging numbers in exactly the same way so for some LEFTY American agenda.
I live in Australia, and no one gives a shit about American politics.
They think it is hillarious entertainment because they don’t grow up with evangelicals so they can’t imagine that foolish mindset. I grew up in the Bible Belt, so it is refreshing to see that it is possible to avoid that nonsense.
I have been around forecasting, modeling and analytics my whole working life. It would be a logistical nightmare (or more bluntly impossible) to have everyone on the planet lie in exactly the same way.
Simple game theory would show, that the one honest guy could reap huge rewards by exposing the scam.
And there would be no shortage of money to expose a scam in Climate Science.
The reason it isn’t happening, is because it isn’t a scam. It is a scientific fact.
And aside from the implausibility of coordinating all the world’s climate scientists to use false data, what would be the purpose?
To stop fossil fuel use? Isn’t this what this forum is all about? Aren’t we saying that the end of business as usual is coming anyway? Why on earth would there need to be an intentional misrepresentation of climate data when the reality of economics will work just as well?
The smoking gun? http://dailycaller.com/2015/06/04/noaa-fiddles-with-climate-data-to-erase-the-15-year-global-warming-hiatus/
And look at how its revealed the EPA has been in cahoots with researchers by coaching them into arriving at just the right results to fit the AGW agenda of these federal government agencies.
Yep, it’s clear to see our government is working against us. Time for an overthrow?
What I find odd is that posts like the one that should appear immediately above mine, all seem to originate from people who have some connection with or live in the USA, the bastion of the free world.
So, in the nation which most represents the upholding of individual rights and in fact who’s founding fathers sought to place certain values above the political fray, in order to protect individual rights from the tyranny of transient majorities, is the one where people are saying things like, “Yep, it’s clear to see our government is working against us. Time for an overthrow?”
This is the only nation that I know of, where protecting “individual rights from the tyranny of transient majorities” has been discussed as a constitutional matter yet, this is where people most think that “our government is working against us”? As I said, I find that strange.
Makes me wonder why it is that, people in most other parts of the world, seem to hold the view that mitigation of global warming is something people, corporations and governments ought to do for the good of life on the planet?
Maybe Noam Chomsky (video) is right?
The people who post here with the sole agenda of repudiating climate data don’t seem to understand the purpose of this forum. They don’t grasp that the primary discussion is peak oil and whatever they say about climate doesn’t change the economics coming because of peak oil.
I see them erecting an enemy that isn’t really their enemy. They think government is conspiring against them, when resource depletion will be the more likely reason their lives will change. I see them trying to avoid their futures. It’s their thought process which I can’t relate to at all.
I hate to repeat myself Tom, but you are blowing smoke.
I think he makes good points. But it’s incredibly hard to show people how the system works nowadays. I imagine for some of you it’s like asking you to read Osama bin Laden’s collected writings.
I’ll go back to this.
Also keep in mind that much of the work involving these models is done mostly under the pretense of allowing the research scientists to secure long-term taxpayer funded grants tied into their future job prospects.
And again, I will respond with this.
You’re saying that all climate models are done by US research scientists dependent on taxpayer money? No one else who doesn’t fit that description is doing climate research models?
I haven’t looked at what these groups are saying about climate change, but they appear to be doing climate modeling and they aren’t being supported by US taxpayers.
Climate Models | World Meteorological Organization
RTI International – Climate Change Research
Climate Modelling and Global Change
Climate Modelling and Analysis – HOME – Climate Change – Environment Canada
Danish Meteorological Institute
I could add others, but you get the picture. I don’t have any reason to believe that climate modelling exists only in US universities.
Please show me where I ever said US scientists, or even specifically referenced the US. Are you deliberately creating a straw man here or something? Of course there are climate scientists and researchers all around the world. Believe me, I am fully aware the US isn’t the only place where faulty climate modelling takes place. However, the basic fact remains that no matter where the science and modelling is done, it is heavily subsidized by taxpayer-funded grants and done under the guise of growing government ever bigger and more powerful. Just look at the agencies your links point to. You proved the point for me!
This is what you said.
Also keep in mind that much of the work involving these models is done mostly under the pretense of allowing the research scientists to secure long-term taxpayer funded grants tied into their future job prospects.
Are you saying that all scientists at all universities anywhere in the world who are doing climate models are distorting data because they are receiving payouts from their respective governments?
And if that is the case, doesn’t that call into question your own credibility?
I work at a major university heavily invested in water quality, adaptive agricultural and growth management techniques.
Or do you see yourself as a whistleblower? If so, I think you’ll need to identify yourself.
Are you saying that all scientists at all universities anywhere in the world who are doing climate models are distorting data because they are receiving payouts from their respective governments?
The scientists are receiving grants (payouts, if you prefer) from their governments and directing the money into junk models in order to secure their positions in academia, now and into the future. Whatever use the governments have for the output from the models is an unrelated matter.
You still haven’t outlined your professional experience with regard to earth systems science, climate modelling, and data integration. Anybody with any research experience in those, or closely related, fields should have an understanding of how contemporary research careers at the university level in those fields are secured and maintained, particularly as they relate to the publicly-funded grant process. Additionally, anybody who’s ever done research in these fields should understand how the grant process works, including what kinds of research questions are most likely to be funded in the first place and how to then effectively use rhetoric in the proposal process so as get the funds directed to you rather than a colleague proposing a similar project.
Anybody with any research experience in those, or closely related, fields should have an understanding of how contemporary research careers at the university level in those fields are secured and maintained, particularly as they relate to the publicly-funded grant process. Additionally, anybody who’s ever done research in these fields should understand how the grant process works, including what kinds of research questions are most likely to be funded in the first place and how to then effectively use rhetoric in the proposal process so as get the funds directed to you rather than a colleague proposing a similar project.
I live in a university town. I understand how research works. And I understand how important it is to follow the money.
What you are saying is that virtually ALL climate models are invalid because the funding for virtually ALL climate models is paid for by governments, who have a collective ulterior motive in getting inaccurate data.
And you are also suggesting that within your own field (whether you mean to or not), research has been bought and paid for because that’s how the system works.
If all university research is corrupted by funding, then presumably no scientific research can be trusted, right?
Boomer, the guy is a bullshitter. I have met and talked to a lot of bullshitters in my time and this guy is nothing more than your average run of the mill bullshitter. He doesn’t have the job he says he has and hasn’t published a damn thing in any peer review journals. Not on the subject he says he has anyway.
He is blowing smoke.
Boomer, the guy is a bullshitter. I have met and talked to a lot of bullshitters in my time and this guy is nothing more than your average run of the mill bullshitter.
Yes, I suspect as much.
What I am trying to point out to him is that his statements fall apart based on what he himself is saying. There’s not a lot of logic to them.
This is not the place to expect people to accept what he says without some challenge to it.
What you are saying is that virtually ALL climate models are invalid because the funding for virtually ALL climate models is paid for by governments
Yes
who have a collective ulterior motive in getting inaccurate data.
Governments have a motive in expanding their power and reach over the citizenry. If inaccurate climate data is the way they want to do this, then that is the method they will go after.
And you are also suggesting that within your own field (whether you mean to or not), research has been bought and paid for because that’s how the system works.
If you’re talking climate research coming out of left-leaning avenues like public universities, then yes.
If all university research is corrupted by funding, then presumably no scientific research can be trusted, right?
University research is not equal to the sum of all scientific research since there’s also privately funded scientific research. This branch of research functions under an entirely different set of circumstances and is typically trustworthy because it does not have underlying political or ideological motivations.
You are still suggesting that a group of governments around the world are paying climate researchers to come up with similar data.
And the motivation for this is what? And it is being coordinated how?
And are you saying that if the same research is coming out of private universities, therefore it is more trustworthy? I haven’t researched this, but I am pretty sure I can find researchers at private universities who have created climate modeling models. Those are okay by you, right?
I’ll be doing a bit of research on this. I did find these so far.
Secret funding helped build vast network of climate denial thinktanks | Environment | The Guardian
“Dark Money” Funds Climate Change Denial Effort – Scientific American
Deeper Ties to Corporate Cash for Doubtful Climate Researcher – The New York Times: But newly released documents show the extent to which Dr. Soon’s work has been tied to funding he received from corporate interests.
He has accepted more than $1.2 million in money from the fossil-fuel industry over the last decade while failing to disclose that conflict of interest in most of his scientific papers.
Ok. I found what I wanted.
Here’s an industry that is funding climate modeling research. You’ll accept their findings, right?
Threat Level Rising: The Insurance Industry Responds to Climate Change Risk | Risk Management: “Risk modeling has become more comprehensive and refined as significantly more data is added to the models from new events,” Hedde said. “With each extreme weather event, we gather additional data and test how well the models perform. This new data and increased computing power have allowed the industry to take a more granular view of risks and to model very specific events. We then add our own insights and experience about climate variability to more accurately reflect the risks.”
“Our primary focus is the risks that insurers face today when it comes to climate change,” said Dr. Jayanta Guin, executive vice president of research and modeling at AIR Worldwide. “What we know is that the Earth’s temperature has been steadily increasing over the past few decades. Sea levels are rising globally—the mean sea level in the northeastern United States has risen by one foot in the last century. Over the next hundred years, the mean prediction is for a possible further increase of three feet.”
Here’s a big report from Lloyd’s of London. Another private company.
Catastrophe modelling and climate change – cc and modelling template v6.pdf
Here’s another. I won’t bother to go on. There are enough insurance companies doing their own climate modeling that we can say that not all climate models are being generated by government-funded grants.
Pricing the Risk of Climate Change – The Globalist: The Geneva Association, a re-insurance trade organization, reported on the implications of rising ocean temperatures in 2013.
Based on clear and well-documented statistics, their recommendation was for re-insurers to base premiums not on actuarial evidence, but on climate change models. In other words, they recommend reliance on the very models that climate change deniers try so vigorously to discredit.
Tom,
You know nothing about my professional life or education
Enough said.
You hit the nail on the head about the lack of model validation. The climate researchers these days have no theory to be independently verified, just computer models and a set of predictions. They say that their predictions will validate their models, but then when the models end up grossly over exaggerating actual observations, they act like they don’t even remember their original predictions.
A large ice shelf breaks off and they point to it as validation of their model. But they fail to mention that the model predicted the ice to have completely disappeared from the location a decade ago. They will demonstrate that Bangladesh has experienced a half meter of sea level rise, but are silent as to why that rise is not uniformly seen all over the world, as should happen under a large scale melting of the polar ice caps.
I’ve posted this after a different comment, but it is relevant here, too.
I have two issues with what Tom and his like are saying:
1. That there is a worldwide conspiracy to introduce false climate data.
2. That by discounting climate data, it’s going to change where we’re headed. This is a peak oil forum. Most people here anticipate hard times ahead irrespective of climate changes. It’s a resource issue. Debating climate data is a diversion that doesn’t change the resource issue.
Don Wharton,
Besides the tight supply environment for natural gas, the demand picture has also changed significantly. Previously, natural gas just capped the demand peak during heat waves, coal and nuclear filled the base load. However, with the installation of substantial wind and PV capacity, natural gas is used as a swing producer when there is less wind or sun and much of base coal and nuclear load is shut down. In June alone 6 GW of coal and nuclear came out of the market. So currently, even if the heat is not high, natural gas has to counterbalance volatile wind and PV production. Despite not extreme heat in June power burn is up by 30% from last year. There could be for the first time ever withdrawal from inventories during the summer as power burn is very likely higher in July and August.
Oil Production in Bakken, Eagle Ford Little Changed in May: Platts’ Bentek Energy Production From These Two Prolific Shale Plays still up 18% Versus May 2014
http://www.prnewswire.com/news-releases/shale-oil-production-in-bakken-eagle-ford-little-changed-in-may-platts-bentek-energy-300100851.html
DENVER, June 17, 2015 /PRNewswire/ — Oil production from key shale formations in North Dakota and Texas was little changed in May versus April, according to Bentek Energy, an analytics and forecasting unit of Platts, a leading global provider of energy, petrochemicals, metals and agriculture information.
Oil production from the Eagle Ford shale basin in Texas showed signs of decline in May, falling 6000 barrels per day (b/d), or less than 1%, vs April, the latest analysis showed. This marked the second consecutive month of production decline from the basin. However, the May decrease in production was less than that for April, when production dropped 8000 b/d. Meanwhile, crude oil production in the North Dakota section of the Bakken shale formation of the Williston Basin remained relatively flat, increasing only about 650 barrels b/d, or less than 1% in May vs April.
The average oil production from the South Texas, Eagle Ford basin last month was 1.6 million barrels per day. On a year-over-year basis, that is up 280,000 incremental barrels per day, or about 21% higher than May 2014, according to Sami Yahya, Bentek energy analyst. The average crude oil production from the North Dakota section of the Bakken in May was 1.2 million b/d, or up 155,000 b/d from year ago levels.
“The steep decline in rig count and the discouraging oil barrel pricing environment has taken its toll on oil production from the Eagle Ford shale,” said Yahya. “While producers have been actively making gains in efficiency and high-grading their acreage, the efforts have not been sufficient to prevent oil production from dipping. Still, it is worth noting that production decline from the Eagle Ford in May is very small and is less than the decline noted in April, and production from the Bakken shale remains flat despite the severe cuts in rigs. The shortening of drill times in both of those key shales has helped sustain production levels.”
Bentek analysis shows that from May 2014 to May 2015, total U.S. crude oil production has increased by about 870,000 b/d.
To note, according to the EIA’s June STEO, from May 2014 to May 2015, total U.S. crude oil production has increased by 960,000 b/d.
Ron,
Did you get this Fantazzini graph via personal communication or is there a weblink available? Do you have a link to his presentation at the following conference:
Energy Price Shocks and Economic Growth:
What the Academic Literature Says,
Current Situation and Future Prospects
29 May 2015
Keynote Speaker
Dr. Dean Fantazzini, Moscow School of Economics,
Moscow State University, Russian Federation
http://www.fm-kp.si/zalozba/ISBN/978-961-266-180-9.pdf
No, I don’t have an internet link to anything he has published. He sent me the graphs as an email attachment. He is now on vacation and told me he will have no internet connection where he is going. He sent me the graphs from the airport when he was leaving early this morning which would have been late Friday in Moscow. He said he will be gone about a week.
I see that the conference was held in portoros in Slovenia. Very nice! I hope he didn’t spend too much time in the casinos there.
Just a follow up to Ron’s observation at the end of this post.
For the months January – April 2015 645 wells started production (based on Enno’s compilation of monthly NDIC data).
For the months January – April 2015 552 wells were spud (Data from NDIC)
https://www.dmr.nd.gov/oilgas/stats/2015monthlystats.pdf
Some 90ish more wells started production than was spud in the period January – April 2015.
At end December 2014, 750 wells were awaiting completion (Directors cut February 2015)
https://www.dmr.nd.gov/oilgas/directorscut/directorscut-2015-02-13.pdf
At end of April 2015, 925 wells were awaiting completion (Directors cut June 2015, which Ron quoted from close to the bottom of this post)
From end of December 2014 to end of April 2015 the number of wells awaiting completion grew with 175.
Anyone out there who can explain this?
I am beginning to believe that Helms’ “Wells awaiting completion” is just a fictional number.
I think this discrepancy of (175 + 645 – 552=) 268 wells can be mostly explained by lead times.
During the last 1.5 year, the average lead time from spud to first flow was about 5.5 months. If we assume that it takes 1 month to drill a well, and for other reasons another 3 months before the well gets the status “Waiting for completion” (or at least it is presented to Helms then as such), then the change in wells “Waiting for completion” are the new wells spudded 4 months ago, minus the wells being completed.
We don’t have access to the exact well status during drilling (such as when it is “Waiting for completion”), but we can see the actual spud dates of all wells, and the month of first flow. The wells in this (larger) inventory, have been drawn down between end of December and end of April, by about 100-150, as more wells started flowing vs spudded.
Now the rig count has stabilized, the lead time effect I described above should mostly disappear, and we should see more directly the effect of more wells flowing vs wells spudded, on the reported wells “Waiting for completion”. Therefore, if the current trend of >= 150 new wells flowing per month, vs < 100 wells spudded per month continuous, the reported "Waiting for completion" count should drop fast in the coming months.
So, ignore all the stories about oil production keeping steady while rig count has dropped. As Rockman, Mike and a few others have said all along, just give it a few months to see what is really happening. The sequence is:
1) Dropping rig count (happening since a year)
2) Fewer wells spudded than flowing (since Dec)
3) Dropping # of wells waiting for completion (will be clearly visible with the June/July data)
4) Declining production (already started, but will be more pronounced within a year, with the current trend)
Below a graph that uses the actual numbers from ND to show the described effect:
1) # new wells spudded (excluding just a few wells that are not individually reported)
2) # new wells starting first flow
3) # Change in # wells in "Waiting for completion". This is signal 1), delayed with 4 months, minus signal 2)
4) # Cumulative change in wells with status "Waiting for completion" since December.
Found an issue in above graph, below is the correct one. I also added the official NDIC reported cumulative change in wells with status “Waiting for Completion” since Dec (925 in April vs 750 in Dec), vs my modeled series (in yellow).
Enno and/or others,
What is the qualification for applying the term awaiting completion?
Technically, one might say that a well that just was spudded is awaiting completion.
What is the reason that it (on average) takes 3 months after a well is drilled until it becomes classified as “awaiting completion”?
Good question Rune, I have no idea. I guess the spud date is the date drilling starts, so as drilling takes about a month, and maybe because of further operational or procedural issues the delay may be longer before a well is marked as “Awaiting completion”. The match with the data is very good if we assume that the average lead time from spud to that status is 4 months. Note that during the first 4 months this year, the average lead time from spud to first flow is still more than 5.5 months. We can see all individual well spuds, and from that I have the impression Helms has it right, which doesn’t surprise me. We should start to see a big drop in this status in the coming 2 months, because early this year there was a big drop in new wells spudded.
As we can’t see this status directly, monitoring the inventory of wells that are spudded, but not yet flowing (which we can see very well) is a good alternative.
Probably, because of different definitions of “drilled, but uncompleted wells”, I have seen their estimated number ranging from 2000 to 4700
Awaiting completion usually starts when the drilling rig has cleared enough space to put on the completion units (whatever they are). There’s other designations, such as waiting on hook up. It depends on the outfit and country.
Rune, Enno, Alex
Couple of points re drilling, completing, fracturing, producing …
The spud date, in the Bakken, at least, often was initiated by a smaller (less expensive) rig that would drill and case down to several thousand feet 2/4/6 wells at a time.
For various reasons, time would elapse before a bigger rig would arrive on site to finish the drilling (usually at 10,000′ depth and 10,000′ horizontal). The weight of the iron and the power of the pumps are the main reason for the big boys.
After the well is drilled, the completion hardware (specialized ‘pipe’) is installed, along with isolating ‘bushings’ (packers), or seementing is done as per individual well design.
The big rig moves off.
The drilling phase is generally considered as finished.
After a period of time, days/weeks whatever, the Frac spread arrives for a 4/7 day operation to fracture the well.
The ‘clean up’ phase can take several days as the flow back water emerges at a high rate along with measurable hydrocarbons. Every bit of oil and gas that comes from the well is measured.
At some point in time, usually – but not always – within a few days, the now-drilled, now-frac’d well is put ‘online’ and is producing.
The ND DMR folks have recently introduced a well classification – SI/NC – for wells being ready for, but not yet, frac’d.
There are other formations in other states that do not clarify this.
The Marcellus, which I’m trying to learn more about, simply classifies wells as permitted, developed, or producing. The ‘developed’ term applies to wells drilled, being drilled, or already frac’d. (Surprisingly to me, I have seen wells frac’d in 2011/2012 that are still not producing).
The uncertainty may arise with the terminology being applied in varying situations of the process.
Coffee, thanks for the very helpful clarification. That explains several things, including:
– why the spud date on average is more than 5 months earlier than first flow. Note that the average is also somewhat distorted by a couple of wells with a much longer delay.
– why there could be a large average delay from spud to “Awaiting completion”
I see that at the end of May, 486 wells in ND have the status “NC”, ready and waiting to get frac’d.
486 is a lot fewer wells than the 925 Helms reported was awaiting completion. And 153 wells completed is a lot more than the 94 he says were completed:
The number of well completions dropped sharply from 244(final) in March to 94(preliminary) in April.
And last month he said the number was 189 completed in March:
The number of well completions rose sharply from 42(final) in February to 189(preliminary) in March.
I have the impression that those NC wells are explicitly put on hold for some time, while there are still other wells with status “Confidential” or still in status “Drilling” that also can be completed. So, it could be that those 486 wells are excess, fracklog wells, above a normal number of wells about to be completed.
I have worked on multiwell pads which had surface casing and wellhead preinstalled using a water well rig. Then we had a 2000 hp rig move in to drill a couple of wells, we skidded it to the other end of the well array, and we had a small workover unit come in and do completions with the drilling rig drilling two wells on the other side. At some point we could have wells beng drilled, being completed, and producing at the same time, all on a single pad. But it takes a lot of planning and table top exercises.
Fernando
I briefly glanced at a comment by Hamm who said Continental was either starting to do that, or, maybe, planning on doing it.
Purpose being to compress the overall time frame to start producing earlier/faster as well as sequencing output so as to make the onsite storage /transport more manageable.
Actually, they have been predrilling conductor pipe and surface casing in the Eagle Ford for 3 years or more; it’s part of the “magic” that allows 16,000 ft. MD wells to be “drilled” in 17 days.
The time after the last frac stage is completed and the well is brought on line (first production) is seldom more than 2-4 days, long enough to drill out the plugs, or dissolve them, open sleeves, sometimes run production tubing, that’s it. It’s important to get the well in flow back stage quickly and take advantage of that induced energy. As I have said before all the production facilities are in place, strapped, flare stacks set, separators, the whole shebang is ready to go before the well is frac’ed. Even the legal aspects of disbursing income is pretty much resolved before frac’ing.
There are no delays between completion and first production, a week at most with testing. There may be delays in reporting first production, that’s it.
That is what actually happens in the field, in real life.
Mike
Do they have gas lines ready to handle gas production? I read they flare a lot of gas in North Dakota.
Fernando
Last Director’s cut had the flaring at about 18% of total produced associated gas.
Big issue with the producers is they will not be allowed to produce more oil unless they, on a company wide basis, stay under the state’s quotas (23% now, I think).
There are a ton of little guys – and heavyweights like GE – trying to sell a whole bunch of hardware/processes to the operators to capture and reuse the produced gas. Some of their ideas are pretty neat, I think.
Coffee, thanks.
All wells, producers, water disposal, exploratory in all formations (including conventional reservoirs) needs to be spudded.
Recently about 95% of the wells has been targeted the Bakken/Three Forks/Sanish? formations.
I recall reading somewhere (awhile ago) that for spudding a “lightweight” rig was used for “casing” the well. Then the “Big” rig moved in and drilled the rest of the well and set the tubing. When the “Big” rig had done what it was supposed to do, it moved away and it was prepared for the frack spreads. This makes sense as it is cost-effective and little capital is tied into the spud (the wells spudded this way are a minor portion of total well costs).
For multi well pads there will be a delay from spud to completion (fracking) as all wells are spudded simultaneously and then drilled in some sequence. As all wells are drilled, the “big” rig moves away and the area are cleared for the fracking spreads.
NDIC publishes monthly/annual total of wells spudded and wells producing. So using a baseline, say 2008, and totaling, it could be feasible to get an estimate of the difference of wells spudded and wells in production (adjusted for water disposal, exploratory and conventional) as per April 2015 and thus how many (LTO) producers that, as of end of April 15, is somewhere in the process from spudded and on their way to become producers.
Could this be an alternative method to get an estimate of the fracklog?
Rune
I don’t follow too closely all those types of numbers and data, but I recognize their importance to people who monitor output, potential future production, and related issues.
As per the above exchange between Enno and Mr. Patterson, I thought the newly introduced SI/NC status might only apply to recent wells, and not be designated retroactively to earlier ones.
Dunno, but I have found over the years shooting emails of inquiry to different regulatory or governmental bodies gave prompt, clarifying answers to my questions.
Might be worth a shot.
Rune, as you know I don’t like to prepare spreadsheets anymore, but a few months ago I did prepare a rough analysis of the economic value brought by completion delays. My analysis showed delaying the frac job was the best option. The decision to delay is based on the expectation of getting lower costs (I expected something like a 20 % cost reduction, I believe), as well as higher oil prices.
When I wrote my conclusions I got quite a bit of flak. But I didn’t get any solid arguments to make me change my mind. Waiting to frac until one can negotiate a deep discount from service companies is a pretty good option.
Fernando, at least some companies seem to be following that strategy (e.g. EOG), which definitely made sense with the steep contango, as long as they had enough access to cash. But it doesn’t change the fact that overall, since December, more wells were being completed than spudded in ND.
Enno, I was answering Rune’s question. I believe the number of completions exceeded spuds during that period because companies tend to have bureaucratic inertia which includes contractual and labor commitments.
When oil prices crashed starting in September 1985 I was asked to reconfigure a regional budget for a large multinational (I think I got picked because I was fearless and pretty stupid, I didn’t mind arguing with senior managers and I could use ledgers). I had to prepare a plan to cut budgets, activity, cancel contracts and “cut personnel expenses”. It was grim, and I almost had my head cut off several times by country managers.
I think I survived because they knew I was fearless and they felt they needed somebody like me to tell them the score when nobody else did. But many companies punish managers who try to invent fast moves, and company presidents hate being told the current plans are a total disaster. Near the top its mostly a gathering of sheep wearing suits.
Fernando, Enno
To emphasize the benefits of Fernando’s approach re delaying completion/production in a low price environment, just glance up at the ATW pricing numbers in Mr. Patterson’s post.
Round off March to $30, today to $50 (the Bakken/WTI spread is tightening lately).
Take 50,000 barrels – first month or so from a core producer. Every ten buck bump up in price is an extra half million right there. A 20 buck increase on the first 100,000 barrels goes a long way to paying off a 7 million dollah well.
Fernando, I’d like for Rune to respond to your post but since I was the one who gave you the most “flak” about hypothetical frac delays, and you think I did not give you are solid reason why, let me try again.
Whatever spread sheet analysis you can provide to support your claim it will not address the unique situation of each shale company owning that unfrac’ed well, its debt service requirements, it’s cash flow requirements, leasehold issues and about 20 other things I could point out it will not address.
There are typically 3 things that happen fairly quickly when a debt ridden, over leveraged company suffers a 60% decline in product prices over a 120 day period, with no near term price relief in sight: 1.) it solidifies it’s relationship with lenders and vendors and makes absolutely sure it can continue operations, 2.) it stacks the drilling rigs, slashes all costs and expenses across the board, wherever it can, however it can. In other words, it reduces cash out-flow, 3.) it looks for ways to increase cash in-flow. A production company can only do that by selling assets, or increasing production revenue. It does not, in my 50 years of experience anyway, start shutting wells in, choking wells back, or delaying completion of wells with 1/2 of total costs already sunk. Delaying frac’ing might work for a imaginary company that is flush with cash, has no outside WI issues and has NO debt service requirements or obligations to others whatsoever. If you can find me a shale company that meets that criteria, holler.
It is my belief (I am not retired, have interest in shale wells and operate in the heart of the largest shale play in the country) that most of the frac’ing contracts, like drilling contracts, have now been terminated and the penalties paid. Those penalties have been expensed. Frac’ing costs have come down a minimum of 30%, in my opinion. I think those costs are actually going to start back up now. There is no further impetus to wait for lower costs to occur. The 20-24 month WTI strip out shows contango has narrowed and future oil prices are now within 5% of current oil prices. There is no further impetus to delay frac’ing in hope that someday product prices will improve. Not realistically.
I see the largest shale oil company in the country frac’ing away like there is no tomorrow. I don’t believe in the Fracklog BS; that is a tool of the shale industry to calm the masses. Your theory may look good on paper but in real life these shale people need cash and they need it fast. That does not happen by voluntarily reducing production revenue.
Mike
And for the record, if delaying completions is such a great idea, it is NOT happening in real life. At the moment there are slightly less than 100 wells working in the Eagle Ford. I believe those 100 rigs can drill about 130-140 new wells per month. That, I believe, is the magic number the pundits believe is necessary to keep production levels in Texas flat…but all those wells have to be frac’ed and brought on line to sustain production levels. I don’t believe, nor do others I speak with, there were anywhere near 1000 wells in the EF awaiting frac’ing EOY 2014. Half that, maybe.
5000 wells now back logged in the US waiting on higher oil prices? That is ridiculous.
So y’all figure it out with all your number stuff. In my opinion wells are getting frac’ed, the lag time is down to about 3 months now, and in about 3 more months the production roof is going to come crashing down on the shale oil industry.
Mike
Mike, if oil prices climbed and the contracts were renegotiated (or whatever had to be done to get the lower costs), and if the well owner doesn’t expect a price increase to justify a delay, then the well gets completed.
I look at these options using a generalized approach. The math was very clear, waiting made sense if the contract and personnel issues could be worked out. In hindsight, prices went up, and CAPEX went down.
If company managers didn’t react, it was for the reason I explained, bureaucratic inertia. Companies have a tendency to gather a lot of yes types at the top, and they can’t turn on a dime.
I don’t follow the detailed numbers, but it has been my impression that the number of wells waiting to be fracked had climbed. If it did, its possible some companies did react as I thought they should.
As you wrote, I’m not working, I’m just living by the beach, so if anybody wants a homily or an opinion, they get it for free right here. I don’t accept liability if they do what I suggests and it blows up in their face. I’m too tired of the hassle to charge, and I definitely don’t like to take bs from company management. That’s why I retired.
Fernando, I wish I could retire. Sometimes. Other times I still love it and am up at 5 every morning and out the door. Everyday I still learn new stuff.
I read somewhere there were 5000 wells in the US waiting to be frac’ed but now I cannot find the link. I should stand down on that. If you take the weighted average of rigs that have worked the last 9 months, the number of wells those rigs would have drilled had to have all been frac’ed and put on line or production would be dropping precipitously. The only other explanation is that there was a whole bunch of wells stacked up in 2014 and I don’t believe that. That does not mean I am right. I often convey my own idealism and problem solving talents onto others and maybe that’s not right. Big companies get paralyzed, you are right.
I don’t believe anything the shale oil industry says on the internet, or in a presentation, and logic suggests to me these guys need money, costs have come down, <65 dollar oil seems likely for quite awhile (Rune, Berman etal) and they are back at the frac'ing, big time. I have a frac engineer buddy with EOG that won't talk too much, save to say that he hardly has time to take a dump he is so busy. I've tried to get him drunk, that doesn't work; I might try water boarding next.
Mike
Mike:
If all the small fraccers face extinction (http://kfgo.com/news/articles/2015/jun/18/small-us-frackers-face-extinction-amid-drilling-drought/ ) , then the large fraccers must also be cutting back drastically. Maybe 1/4 of fracs are being done now vs. before the oil price collapse, then won’t shale production fall drastically in 3-5 months (the lag time associated with the complete fraccing process)?
Joel
Joel, I think when we look at the number of wells now being drilled in unconventional resource plays eventually frac’ing will follow suit, track the rig count, and production will fall. Right now the argument is that enough back logged wells are awaiting to be frac’ed that production won’t decline and everything will remain the same, regardless of rig count. I don’t buy that and you are right, in another 3 months we’re going to see the real deal.
Mike
Hi Mike,
I agree that if rig counts remain at current levels that eventually output will fall, perhaps starting in May or June, but the decline will not be that steep until the frack log is gone. There may not be many unfracked wells in Texas (so-called wells waiting on completion), but in North Dakota there are about 900 of them (at the end of April.) You suggested 140 wells could be drilled with 100 rigs, let’s say in the Bakken it is 12 wells per month for every 10 rigs turning. There are now about 75 rigs in the Bakken so that would be 90 wells drilled per month, they need about 140 new wells per month for flat production (about 160 or so are needed in the Eagle Ford) so 50 wells from the frack log would be needed each month, so there is an 18 month supply of wells if the rig count stays at 75 oil rigs.
In the Eagle Ford if 140 new wells can be drilled with current rigs and the rig count remains stable and only 160 new wells per month are needed to keep production relatively flat, then an 18 month supply of wells in the frack-log would be 360 wells waiting on completion.
I have no idea what the size of the frack-log is in the Eagle Ford, you will have to bone up on your waterboarding skills. 🙂
(so-called wells waiting on completion), but in North Dakota there are about 900 of them (at the end of April.)
Dennis, you are of course aware that Helms gets a lot of things wrong. Why are you so confident that he gets this one right?
Hi Ron,
I trust Enno’s numbers. I don’t think Helms has the number exactly right, but he is probably within 100 or so of the correct number.
Dennis, if you were to have asked me I would have guessed fewer than 285 Duc(k) wells in the EF. That from several sources, but who knows?
On the other hand, I find 900 Duck wells in the Bakken, representing 380 million dollars of sunk costs, sitting there doing nothing, at a potential loss of 25 million dollars per day, astounding. To sit on that kind of CAPEX, with no returns, and interest accruing by the millisecond, like the electric meter on the Griswald’s house in Christmas Vacation, well, I am stunned.
That shoots my theory about declining LTO production all to hell, I guess.
Mike
I have read that the duc number is higher than 1000 in the Eagle Ford, but there are a lot of bad numbers out there. Your guess would be far better than mine.
When the number of Drilled UnCompleted wells falls to zero either more rigs will turn or output will fall. If there are 130 wells spudded each month and 170 new wells per month keeps Eagle Ford output flat, then we need 40 wells per month and 285 DUCs keeps things going for 7 months before output falls (assuming the oil rig count stays at 100.)
Fernando and all others, thanks for your replies.
To understand the size of the fracklog (and developments to rig counts) is important to understand developments to near term extraction developments.
The companies operating in shales come in all kinds of sizes, different structures, have different financial capabilities and may deploy different strategies (have different management personalities) to handle a steep downturn in prices just as experienced recently.
Companies with a production above some threshold will normally enter into some delivery contracts/agreements where a major portion of the production (a variable volume profile) is agreed with some (or several) buyer.
Not sure to what extent that is done in the shales. For those instances where there is such a delivery contract the oil/gas also need to be shipped from the seller (in Bakken) to the buyer (close to the market). This involves having a negotiated transport contract (which may have an agreed volume profile and which may be renegotiated at agreed points in time).
Transport agreements are normally “ship or pay”.
In other words, some companies (or a big portion of the production) are locked into contractual agreements where they need to adhere to some delivery/production profile. Some companies are relegated to the spot market for what that entails.
IIRC there is a regulation that has requirements to what time frame from spud till the well shall be put into production (1 year? in the shales). This may of course also be waived pending an approval.
So what about delaying the frack job?
For companies with financial strength a deferral of fracking will likely have the benefits of lower costs. If everyone does it, it just moves the demand for fracking services out in time and at some point the number of fracking spreads becomes a limiting factor.
Some companies (those that operates at some scale and with leverage) entered into long term fracking contracts, which of course may be renegotiated as prices dropped dramatically. Upon successful renegotiation these contracts (getting lowered costs for fracking) why should these companies further defer the fracking?
The forward curve is a poor indicator to speculate against.
Most companies have provided forward guidances on volume for their owners and creditors. Volume is key here, as significant deviations from volume will make investors and creditors uneasy.
Note the focus on volume in companies’ presentations and how many of the shale companies presents a metric like return on actual capital employed (ROACE)?
There may be companies that enter into the gamble of holding back production in expectations of higher prices. That also requires they have the financial resilience to do such a thing and most shale companies are highly leveraged with debt.
I am not convinced that a creditor would approve of such a strategy (gamble).
I think the better move for the little guys who couldn’t afford to wait was to sell the property, but that transaction takes about six months, and they would be selling on a low price downturn, which I imagine would be hard to sell.
If I was a larger company I would enquire if any operators had wells close to where I’m already operating, and try to buy them out. Theoretically speaking that may be the better solution, but it puts the seller in the position of having to cut personnel, and that is a huge hurdle if they have to cut management as well.
Buying a property may be difficult if the prospective seller has an inflated opinion of what he owns. In this case that may also be blocking sales.
Fernando,
Thanks for your responses.
There may be companies that could benefit from withholding production during a sharp price decline.
Likely candidates for such, IMO, would be companies with little debt leverage that are and would remain net cash flow positive, after implementing such a strategy. There may also be companies that (due to cash flow issues) defers fracking and may gain from it.
The interesting thing about this deferral is that it is not the companies that will stand to gain most from it, it is those receiving the royalty checks and taxes that benefits most from it.
For a company holding back production, the costs (OPEX, G&A, interest costs, transport and other fixed cost items) mainly remains during such an operation and thus increases specific OPEX ($/b) for whatever production is sustained.
If a strategy of withholding production is deployed to some extent, then effectively Bakken is about to become the world’s high cost swing producer.
Rune, I don’t think OPEx really impacts a well waiting on completion. I was thinking of a “normal” company such as Exxon, Statoil, etc.
Let’s put it this way: if I was running a business unit in North Dakota using 30 % debt to equity ratio I would have held out every well completion as long as I could deal with contract cancellations and take or pay agreements. I think we discussed this topic in January or February? At this point in time I would face much lower costs, and would have higher prices.
I think I would have had a slight personnel reduction, picked up better personnel, and right now I would be preparing to resume fracturing in September, and resume drilling in February 2016 at a very measured pace to sustain overall production capacity.
I would also gave checked to see if I could buy outside operated wells in my core operations area. I like to keep wells snug and tight, close to a field office with a large coffee pot.
Fernando,
My referral to OPEX was intended for producing wells.
For yet uncompleted wells it is a different story, and one really needs access to detailed company costs and their obligations (like sales and transport agreements) to enable an evaluation of how such strategy would play out.
I would look for companies with low leverage (low debt service costs) and positive net cash flows as candidates for such strategies.
I have also considered it a better strategy in general to put new wells on HOLD until prices moved higher.
Border related headlines on Drudge:
Damn it Jeffrey,
For the last year or two I have been able to convince myself that the odds of business as usual here in the USA outlasting ME are pretty good. 😉
Then you come along and remind me just how fast everything is falling apart. 🙁
Thankfully I am in pretty good shape to ride out the collapse of BAU compared to most people.
I even have the materials and machinery on hand necessary to build a fallout out shelter if things start looking really iffy in the short term. I keep enough of the really essential stuff on hand to feed a few friends and stay warm and dry for a long time – and if the shit hits the fan the friends who are going to show up are the sort who can get whatever is necessary to be done, DONE.
I really wonder what the odds are of life as we know it in the rich west simply falling apart in the SHORT term.
My personal opinion is that the people who are truly well qualified by specific training and general knowledge are not saying – at least not publicly.
The only person I know reasonably well, personally, who is very well qualified in finance and business (whose identity I am not at liberty to reveal ) thinks the world financial system is at very high risk of collapse in the near term – meaning well within the next ten years.
Really big troubles might arrive like an earthquake, with little or no warning at all. We know earth quakes are inevitable but we cannot predict them -not yet anyway.
It might not be unreasonable to assume that the odds of a sudden collapse or near collapse of business as usual are anywhere from one or two percent to ten or twenty percent in any given year.
Odds along these lines are in the same ballpark as the odds of a middle aged or older person experiencing a sudden critical health issue such as stroke , heart attack or cancer. We all worry ourselves sick about getting sick and spend megabucks on insurance.
How many people spend anything AT ALL on preparing for the possibility of economic disaster – outside the rather small community of doomers and preppers ?
Other than talking the issue over quietly with old acquaintances I have not really done anything at all myself SPECIFICALLY for the purpose of being prepared. Keeping a supply of pesticides , fertilizers, diesel fuel, hardware, non perishable foods etc etc on hand is actually cheaper and more convenient for me than NOT keeping these things in stock. Storage on a farm is essentially free and bulk purchases save trips to town plus cheaper prices per unit. The odds imo are that diesel fuel will go up faster any given year that interest accumulates on money in the bank.We are not supposed to be in an inflationary environment but the price of just about any thing useful in a pinch is up substantially at retail over the last few years . The price of a submersible well pump has doubled in the last five years.
The only real exceptions are diesel fuel and solar panels. It is way past time I bought some but I have been holding off since they are still getting cheaper.
The materials that could be used in a fall out shelter were bought at salvage sales for ten cents on the dollar compared to current retail at industrial supply houses or building materials stores . Every board and roll of wire and roll of tarpaper will eventually be used up on a working farm – even if the farmer is mostly retired.
In the event of a fast collapse , Sky Daddy alone may be just about the only hope for anybody living in an apartment earning their living doing non essential work.
Leviathans of the Uncle Sam caliber may be able to keep their citizens fed and sheltered but even that much might not be possible.
If I remember correctly , you are the first person I ever heard say
” GET THEE HENCE TO THE NON DISCRETIONARY SIDE OF THE ECONOMY.”
If there has ever been advice worth putting in caps this is it.
Don’t get caught in Egypt.
Well, if you are in an urban area there is very little you can do. If fuel supplies or banking access is interupted for even a day, it would be hardship. Without utilities your residence is nearly unihabitable. Without access to your money, or if that money is worthless, basic survival becomes your priority. I doubt people give this much thought. We see the chaos natural disasters cause. Im those scenarios, people from unaffected areas come in to help. What if everyone is affected?
I started reading up on US shale about a year ago, official production speculation combined with decline rates and massively expensive drills didnt make sense to me. Even ignoring that, the frenzy and optomism itself was worrying. You cant exponentially grow forever, and nice plateua havens dont often exist post peak.
Im in the canadian oil sands. Perhaps biased, or just hopeful this model has some life in it. Infastructure costs are large out of the gate, but opex is nominal after that. Well production is flat , limited really by horsepower above ground and they are projected to have years of life at constant rates. We are tied to natural gas though. We use a about 1mmBtu
Per barrel of oil extrated. We are also using about 2 barrels of steam (water) for every barrel produced. Alot of that is recycled, but not all. Its not just evap loss either, a certain amount is contaminated beyond treatment and is disposed, so there is a constant need for fresh water. The area I am at has a life prediction of 50-80 years. I think thats based on resevoir, but we will need more than that to keep the place online.
Another Drudge headline, UK bond fund manager urges people to hold physical cash:
http://www.telegraph.co.uk/finance/personalfinance/investing/11686199/Its-time-to-hold-physical-cash-says-one-of-Britains-most-senior-fund-managers.html
And an on point article on Resilience follows (interesting discussion in comments section between author and a former banker):
Why We Are All Now Cypriots-to-be in the New Age of Bail-ins
http://www.resilience.org/stories/2015-06-17/why-we-are-all-now-cypriots-to-be-in-the-new-age-of-bail-ins
SIXTH MASS EXTINCTION IS HERE: HUMANITY’S EXISTENCE THREATENED
“Biologists have use highly conservative estimates to prove that species are disappearing faster than at any time since the dinosaurs’ demise.”
http://www.sciencedaily.com/releases/2015/06/150619152142.htm
Read E. Kolbert’s book “The Sixth Extinction: An Unnatural History”.
Sadly I don’t see enough humans will be motivated by this info to change their behaviors.
The anticipated human die-off some posters here expect is probably the best chance for the rest of the world’s species to recover.
I will make a small contribution by increasing the amount of salmon I consume, and cutting the swordfish down to twice a month.
https://foreignpolicy.com/2015/06/18/russia-could-come-to-greeces-rescue-thats-bad-news-for-the-united-states-and-nato/
“Tsipras was set to meet with Putin on Friday at the St. Petersburg Economic Forum. Ahead of the meeting, Greece energy ministry officials said they would sign a pipeline deal with Gazprom, Russia’s national energy company, a sign of Moscow’s growing influence there.
At a previous meeting with Putin in April, Tsipras undermined NATO’s position when he said European and American sanctions on Russia for its actions in Ukraine would lead to a new cold war in Europe. At the same gathering, Russia said it would pay for infrastructure projects in the cash-strapped Mediterranean nation.”
Somebody really wants to control Europe’s gas supply.
SatansBestFriend,
To Russia Greece is an incredibly opportune investment, as you’re confirming. A cash strapped country whose current leaders are looking for any and every way of communicating “if you [Europe] don’t give us what we want we will let your adversary in through your back door, so appease us!”. Unfortunately, such coy threats will have the opposite of the intended effect – it will drive Greece’s bailout lenders, and their incredibly gracious bailout interest rates (lower than that of U.S. Treasuries) to turn away. not toward.
This seems to be entirely in Russia’s benefit; once Greece is dependent on Russia for financial stability Russia can keep inching its demands. If this does play out then a politically savvy move by Russia would be to say “Well we need to protect our essential infrastructure in your country, so we’ll need a naval base to make sure you and the pipeline are safe”.
I suspect the Greek public is divided, but would strongly oppose, and ultimately reverse, any shift to funding through Russia. The plurality of Greeks still want to be in the Euro, and inside the Eurozone. A surefire way to be kicked out of both clubs would be to defiantly welcome strong Russian influence in the country.
I suspect this is still part of a very short-sighted Game Theory plan to force the IMF, EU Commission, and ECB into giving Greece more favorable terms, which will only create animosity, not compromise. If… Ok, when, Greece defaults the populace will quickly tire of the consequences. The Syriza party will become less popular as the economy is squeezed into a deeper depression, referendums will be voted on, elections will be held, and Russia’s gambit, although savvy, will prove fruitless as Greece’s citizens realize what is happening.
Excellent points Brian.
I think Putin wants to destroy NATO by controlling Europe’s Natural Gas supply.
Russia is also starting a project with Nigeria to create a poorly named pipeline “Nigaz” that would dump into the mediteranean sea.
http://news.bbc.co.uk/2/hi/business/8118721.stm
Who has control of the switch to turn off the tap? That tells you what you need to know right there.
Greece won’t be dependent on Russia for stability. Building such a pipeline system takes 5 to 10 years.
And during that time…no one else will be building pipelines….
So where is Europe going to get their gas from?
Friend, I suppose they’ll get it from the usual suspects…Russia, Algeria, Azerbaijan, Qatar, Trinidad? I don’t track the detailed market flows. Do you think the Ukraine will heat up to the point the gas stops flowing? That would be bad for the EU.
Thanks for the dialogue Fernando.
I obviously have no idea what will happen. But I have no doubt that Putin sees value in having a strangle hold on Europe’s gas supply.
Well, if you were Putin you would love the ability to slap the Europeans around. I used to live in Russia, from what I hear the Russians feel they are under attack by Germans, French, British and Americans. Having the ability to sell gas and bypass Ukraine is a plus. They do plan to resist what they see as blatant aggression.
Fernando, I don’t know what the reality is, but I do know that it’s perfectly common for aggressors to perceive themselves as victims.
Just because someone feels victimized, doesn’t tell you necessarily whether or not they are truly being the aggressor.
For instance, I believe that you feel that Israel is an aggressor. Well, there’s no question that Israelis perceive themselves as the victim, as being on the defensive. Does that mean that they truly are the victims here?
As another example, many Americans feel on the defensive against the rest of the world. What does that tell us
I’m just explaining the Russian mindset. They feel they are the ones being slapped around. And they are the ones who got invaded on quite a few occasions by the same actors who lead the “enemy”. The fact is that France, United Kingdom, USA and Germany invaded Russia. And now they see a rather absurd aggressiveness by USA and Western European governments all around their frontiers. So of course they are signaling they do intend to fight.
they are the ones who got invaded on quite a few occasions by the same actors who lead the “enemy”. The fact is that France, United Kingdom, USA and Germany invaded Russia. And now they see a rather absurd aggressiveness by USA and Western European governments all around their frontiers
Very, very similar things could be said about Israel. The Holocaust was worse than all of the invasions of Russia. Israel has hostile neighbors.
Does that provide complete justification for anything that Israel might do? Does it tell us anything about whether or not Israel is being the aggressor in any particular situation?
Gazprom has agreed with Shell to build an expansion of the Nord Stream pipeline, Phase 3 and 4 of the Nord Stream would have a combined capacity of 55 billion cubic meters per year. Germany’s E.ON and Austria’s OMV also participate in the project
http://www.reuters.com/article/2015/06/19/us-gazprom-shell-exclusive-idUSKBN0OZ0IQ20150619
AlexS
That is a dance called “Pipeline Waltz” 🙂
The princess lady promise to dance with Prince called “Turkish Stream” and at the same time she promised a dance with the prince called “Nord Stream” from the different kingdom. Now, she only sits and wait 🙂
Nord Stream expansion is not a new project. From Gazprom CEO’s interview: “As far as Nord Stream is concerned – there was no politics at all. The decision was taken in November 2011 and all the work has been done based on the decisions taken 3 years ago,” he said.
what Gazprom says that is for mass consumption.
Nord Stream Phase 1 & 2 already have total capacity of 55 and only half is used.
Why build another Phase 3 and Phase 4 with additional 55 capacity when you are using half of existing capacity? That would be 110 total with the Nord + Yamal 34 , plus 3 pipelines through Ukraine 84 and proposed Turkish 63. Total export to EU is 119 in 2014. Numbers speak for themselves. That additional Nord 3&4 is overcapacity.
Russia will stop supplying gas through Ukraine’s territory from 2019
Yes. but that is 83 through ukraine,
but still just add the numbers Nord 1 & 2 is 55 + Yamal 34 + proposed Turkish 63 (of which 10 is just for solely for Turkey so let’s say 53 to the rest of EU) that is max total export of 142. Current exports 119.
So obviously that extra Nord 3 & 4 is just promised dance to soften the hand of Ottoman sultan in bargaining. 🙂
It’s redundancy. And I think they are expecting a European need to buy more gas. They’ll have to if they want to cut co2.
No redundancy. As I said Norde 1 & 2 is used at half capacity already. Euros are not getting more than what is allocated for them. Anyway the growth would be in east in Asia so Europeans will cut CO2 through depression.
In hunting terms Germans with proposed Norde 3&4 are playing the role of electronic rabbit. Turks are real rabbit.
Nord is at half capacity, but gas flows through Ukraine. If I were preparing to have a nice little war in Ukraine I would bypass ALL those pipelines.
No. War is only possible now while there are pipelines. And actually there is low intensity war right now. Remove pipelines, meaning there are no incentives for war, then there is no war.
http://www.theguardian.com/world/2006/dec/12/business.oil
“Russia is becoming a key source of natural gas to the UK and Gazprom has already made clear it would like to buy a company such as Centrica, which owns British Gas. One third of western Europe’s natural gas is supplied by Russia – a figure expected to rise over the next decade. The security of energy supply is now the main political issue between the EU and the Kremlin. Nervousness about the Russians was heightened last winter when the gas supply to Ukraine was cut off in the middle of a political dispute.”
Each time Russian gas supplies to Ukraine were cut off, that was because Ukraine stopped to pay for Russian gas. As soon as Ukraine resumed its payments, Russia resumed gas supplies.
I’ll trust you on that one.
But it got cut off right? That is obviously a weapon in the arsenal.
according to this logic, any supplies from one country to another could be viewed as a potential weapon
Yes. It always is.
Yup! That is why it is foolish to be dependent on another country for your energy.
NATO = Europe and USA (generally speaking).
Missile Shield = NATO (using USA tech) aimed at Russia.
Natural Gas pipelines & oil = weapon aimed at NATO.
No coincidence IMO.
Yup! That is why it is foolish to be dependent on another country for your energy.
Which is why solar and wind are the best solutions in some situations.
Why would Russia cut supplies to Europe, if it depends on oil and gas revenues?
The Soviet Union and then Russia have been supplying Europe with hydrocarbons for many decades, including the darkest years of the Cold War, without any disruptions
Good point.
Supply them to Asia instead.
India:
http://oilprice.com/Energy/Energy-General/Russia-India-Planning-30-Billion-Oil-Pipeline-Through-Xinjiang.html
China:
http://www.forbes.com/sites/kenrapoza/2015/05/03/russian-government-ratifies-huge-china-gas-pipeline-deal/
Still make the money, but screw your adversaries who are in massive debt and will be scrambling to find supplies.
And pipelines ensure that the product ends up in a certain country, and not bought by anyone (Europe and USA) on the free market.
The idea would be to cut the Ukraine pipelines, and ship gas using other systems as the shooting starts.
http://www.theguardian.com/business/2011/jan/14/bp-rosneft-deal
“The deal to transfer 5% of BP ownership to Rosneft immediately came under attack in America – currently its most important market – with one congressman describing BP as “Bolshoi Petroleum”.”
“In the US, Russian involvement is viewed with suspicion. US congressman Ed Markey put out a statement branding BP as “Bolshoi Petroleum”. BP already has close links to Russia, owning half of TNK-BP.”
TNK BP was sold to Rosneft. BP owns Rosneft shares. It’s a cross shareholding deal. I would trust Dudley.
Who is Dudley?
BP’s CEO
LOL! You mean the guy in the article I posted on…
Just out from the Bakken tribune:
http://bismarcktribune.com/bakken/oil-production-declines-in-april/article_ca675a55-b0fc-5823-9a09-9195785ceaca.html
http://www.theglobeandmail.com/globe-debate/munk-debates/robert-d-kaplan-the-south-china-sea-is-to-china-what-the-greater-caribbean-was-to-the-united-states/article25039063/
“The South China Sea is no less important for China. If China can gain dominance, it then can have access to the wider Pacific and, through the Strait of Malacca, into the greater Indian Ocean, which is the global energy interstate, bringing all the oil and natural gas from the Middle East to the population zones of Asia. So this is really big stuff.”
”
In 2009, Secretary of Defense Robert Gates appointed Kaplan to the Defense Policy Board, a federal advisory committee to the United States Department of Defense. In 2011, Foreign Policy magazine named Kaplan as one of the world’s “top 100 global thinkers.”
Kaplan is one of the most influential neocons, right?
See the section “9/11 and Empire Talk”
http://www.informationclearinghouse.info/article17194.htm
This is a good recap of the neocon imperial drive. Mentions Kaplan as one of the influential writers in their ranks.
I guess China is just pretending to build islands with military infrastructure on them.
No, China likes to play with sand. But I perceive their efforts to be defensive, they do need to secure their trade. And the idea that China is, at this time, threatening Malacca or extending its reach into the Indian Ocean is typical neocon-talk. I’ve been keeping track of the neocon tribe for almost 20 years, they have a fairly boring and monothematic approach.
It’s a joke. The Chinese navy is 50 years away from ever challenging the U.S. navy in any real capacity.
It is typical fear-mongering.
There is little doubt in my mind that the Chinese are not capable of seriously threatening the US navy at the present time or that they will be able to do so within the near future- so long as we keep it away from Chinese land based resources.
Fighting in one’s own back yard is an altogether different game than fighting a blue water war. In the South China sea and nearby areas, the Chinese will soon be able to bring enormous land based resources to bear.
Offensive tech generally moves faster than defensive tech. A simple large barrage of land based missiles might be enough to take out even the best defended ship with a captain foolish enough to bring it anywhere near enemy held land.
Ten or twenty years from now – never mind forty or fifty years we might be in a whole new ballgame. Technology, especially military tech, sometimes makes great leaps forward. We just don’t know what might be invented and deployed a generation down the road.
The navy probably has a good idea how many missiles a carrier group can intercept but the navy ain’t saying publicly. Suppose the Chinese are able to launch five times that many?
Will one side or the other escalate to nukes when it looks like losing a hot fight?
“The navy probably has a good idea how many missiles a carrier group can intercept but the navy ain’t saying publicly.”
Yes, I recall some retired US admiral being interviewed a couple of years ago who said something like: “Sure, we can intercept a few missiles but not waves of them.”
I doubt that the US wants a war with China and I doubt China wants a war with the US.
Building up military strength is good for the military industrial complex, but actually having two countries the size of the US and China going to war with each other is entirely a different matter.
Of course, if the leadership in both countries wants to reduce the population in their respective countries, fighting a massive war is one way to do it.
Navy’s role nowadays is not what it used to be, at least outside hollywood, cnn and alikes.
http://www.voltairenet.org/article185860.html
There are holes in this story. This articles points them out.
Russia Claims Its Bomber Jammed U.S. Destroyer — War Is Boring — Medium
Your source’s moto says it all: fighting above, on and below an “angry world”, & We go to war so you don’t have to.
As opposed to: http://www.voltairenet.org/article150341.html
Actually I would find it very interesting if Russia has found a way to totally stop US ships.
However, before I accept this, I’d want more verification. The fact that some of the story doesn’t add up makes me a bit suspicious about its truth.
I’ve been trying to post this response, but it doesn’t show up. Perhaps the link I have included in this comment is blocked. I’ll do it without the link.
If what Voltairenet is reporting is true — that Russia is now able to make the entire US Navy ineffective, then global military power has changed completely.
Before we accept that at face value, I think we’d need to do more investigating.
“27 sailors” doesn’t equal “all the 27 members of the crew”. Anyway, maybe a pentagon spokesCol is more credible to you:
http://www.cbsnews.com/news/russian-jet-makes-provocative-and-unprofessional-pass-at-uss-donald-cook/
“Unprofessional”? Lol
So you agree with me that the initial story had some holes?
Like I said, it would be of vast importance if Russia can make all US Navy ships ineffective. But before I’ll accept that story at face value, I’d want to see more info about this incident.
Right now it sounds like a half-baked story someone put out there to suggest that the Russians aren’t to be messed with militarily. But if they really have this advanced technology, I suspect they would be doing more than saying they scared a Navy ship to such an extent that crew members refused to serve any longer.
You do realize, don’t you, that a ship that size has about 280 sailors. Whoever thinks that 27 sailors is the entire crew is wrong.
I’ll try it again: voltairenet does not say 27 is the whole crew, what it says is “27 sailors from the USS Donald Cook requested to be relieved from active service”. One might think that would be clear enough.
But you haven’t addressed the issue of what such a story would actually mean. If the Russians can totally disable a US Navy ship by flying a plane overhead, then the Russians have a huge military advantage.
Are you going to accept one article on the subject without investigating further? If this is true, it’s the biggest military story since WWII. The entire US Navy would no longer work. The entire balance of military power in the world has thus changed.
I’m not buying it right now. It’s too profound of an event to rely on one story.
It would mean exactly what it meant: Russia easily occupied and (re)took possession of an US ally’s strategic piece of territory. What the future holds is a different story, antiwarfare and warfare systems are in constant “evolution”. But I doubt warships and aircraft carriers will ever have the same usefulness they had in the past. Submarines are a different story.
As for investigating further, not sure how to top your reading of WarIsBoring. But a pentagon admission worked fine enough, one can only wonder why they witnessed for NINETY minutes the lack of professionalism of the Sukhoi as it performed its 12 passes, without doing anything at all.
It would mean exactly what it meant: Russia easily occupied and (re)took possession of an US ally’s strategic piece of territory. What the future holds is a different story, antiwarfare and warfare systems are in constant “evolution”.
US military equipment upgrades take a very long time and a lot of money. If US Navy ships have been rendered totally ineffective now, we are currently defenseless.
Look, if current world military power is now in shambles, I’m not going to protest. But I don’t believe that is the case. If this article is true, there is major upheaval in the US military. I follow military discussions very closely. The Warisboring site is a legitimate military site. I read it.
I’m guessing you don’t read as much on current military strategy as I do or you’d realize how HUGE this story would be if totally true.
I tried to post a link to this article, but it didn’t show up. But here is a quote.
Our source tells us this is “actually the biggest story in the world,” because if Russia is capable of disabling the USS Donald Cook and the entire US Navy with their “revolutionary electronic warfaresystems,” then Russia has already won any type of traditional war.
And that is why I am saying. If it is true that all electronic systems on the Donald Cook were shut down by a Russian plane, this is HUGE. And you can’t take one article saying it happened at face value.
If it is true, then the US Navy currently doesn’t work. It would take a long time and lots of money to create a different, unhackable system.
Here’s another person saying what I am saying. We’ll see if this link works.
Aegis Jammed?: I don’t generally deal in rumors but this one is sufficiently interesting that I thought I’d pass it along as that—a rumor.
I can think of several possibilities:
The story is a fabrication, full stop.
The story is disinformation being spread by the Russian government, presumably to encourage the Russian people and those who sympathize with them in Ukraine and elsewhere.
The story is the truth. If so, I imagine there have been some sleepless nights lately at the Pentagon.
It’s not hacking, it’s jamming, completely different things.
But don’t worry, there’s also a huge difference between being defenseless at home or close to a base and being defenseless halfway around the world in the middle of the sea while exporting freedom.
It’s not hacking, it’s jamming, completely different things.
Ok. But if it disables the ships, it is a problem.
But don’t worry, there’s also a huge difference between being defenseless at home or close to a base and being defenseless halfway around the world in the middle of the sea while exporting freedom.
You have been missing my point. If this story is true, all of US military planning must be revised.
I don’t consider this one story to be sufficient proof.
As I mentioned, I do follow along with the workisboring website.
Here’s a recent article. It’s worth posting a link.
(1) Show you the quality of the articles at the warisboring website.
(2) Because it talks about developments in future warfare, which we have discussed at times.
(3) And illustrates some of the limits of using robots, which we have discussed in the past.
How America Broke Its Drone Force – The Daily Beast
The article is written by David Axe. He runs War Is Boring, a collective of national security reporters.
Agreed, BBC for example does it really well, or is at least much more believable for most shee/peo-ple.
Since you mentioned North Korea:
http://www.bbc.com/news/world-asia-17922021
PS
Refering to your comment down below, that is.
This article is spreading Russian propaganda…pure FUD instigation.
I offer no further elaboration.
This article is spreading Russian propaganda…pure FUD instigation.
Thank you. That’s what I think, too, and I keep wondering what Fabio is trying to accomplish by continually referring to it.
Lol I’ve only brought it up and responded to your posts, which kept fueling the continual reference.
I hope you realize we only identify the other side’s propaganda, but are blind to the one that molds our own belief system.
Of course one ends up believing what one wishes to believe. It’s all about mindset, unfortunately.
I haven’t been talking about Russia. I only called into question the article you posted because if it is true, it is a major deal and would need to be investigated beyond the article.
I’m picking it apart from a logical point of view. I’m not taking sides on this thing.
You are trying to suggest there is some sort of cover-up. I’m suggesting that if the Russians have this technological capability, it changes the dynamics of world military operations. Sitting here talking about some piddly article will be of little importance in the greater scheme of things in that case.
I don’t think you realize how profound it will be if this is true. It’s not a propaganda game if it is true. It is much bigger than that.
So right now I don’t believe it is true because the US military hasn’t undergone a major upheaval in naval operations.
I hope you realize we only identify the other side’s propaganda, but are blind to the one that molds our own belief system.
Here’s the deal. If you are trying to make this point, using that article as an example is a very bad one.
We are talking about whether or not Russia has the capability to jam the Aegis Weapon System. If the article is true, the US Navy now knows this and everyone in the Pentagon is scrambling to reinvent modern warfare.
And if it is true, then the entire world now knows the US Navy doesn’t have good technology. You think that is happening? And you think that is happening based on one article? Really?
If you want to cite how both sides use propaganda, find something that is more plausible.
I’m going to cite a few passages in the article:
As the Russian jet approached the US vessel, the electronic device disabled all radars, control circuits, systems, information transmission, etc. on board the US destroyer. In other words, the all-powerful Aegis system, now hooked up – or about to be – with the defense systems installed on NATO’s most modern ships was shut down, as turning off the TV set with the remote control.
The Russian Su-24 then simulated a missile attack against the USS Donald Cook, which was left literally deaf and blind. …
According to some specialized media, 27 sailors from the USS Donald Cook requested to be relieved from active service.
So either we have a Russian plane proving the Aegis system is a failure, which has profound consequences.
Or we’ve got some Russian bravado that is the equivalent of the North Koreans claiming they are prepared to take over the world.
So do you think this story is true? Or do you think it is an example of some amateurish propaganda? I mean, if you are going to play the propaganda game, you helps if you do it well.
No question the Chinese Navy is behind the US Navy.
11 Carrier groups to 0 for China.
They do have more submarines though, albeit of lesser quality.
With drones becoming a reality, you don’t really need aircraft carriers anymore. So that advantage of the US Navy will shrink much faster than 50 years.
The Chinese need to project power to secure their energy sea lanes.
They don’t have to beat the US Navy, they just have to make conflict costly and risky enough that they won’t get attacked.
They have nuclear submarines and it won’t be long till they start parking some off the coast of California.
With drones becoming a reality, you don’t really need aircraft carriers anymore
Why this would be so? I have the impression that drones have shorter range than piloted planes.
OTOH, I do have the impression that carriers are almost obsolete due to longer range land-based planes, as well as improved surface to surface missiles.
http://www.nationalinterest.org/blog/the-buzz/us-navy-may-turn-every-ship-aircraft-carrier-12722
You don’t need a ship as big as a carrier to launch drones.
The logistics of running a carrier is a steep learning curve as well. You need food, oil, entertainment, sewage, medical…etc.
Don’t need as much of that with drones.
Also, submarine technology is making carriers obsolete.
They are an expensive target.
PRESENT DAY drones may be shorter range than piloted planes but there is every reason to believe that future large ( as opposed to very small sneaky ) drones will have far longer ranges and be far harder to kill than piloted aircraft.
The computers that run current model drones are not yet capable of making all the decisions made by a pilot but that will change. And the newer computer will be far smaller, lighter, and in the end, cheaper than a pilot. It will withstand any g forces the airframe can stand. So the weight and bulk of the pilot life support systems can be eliminated and replaced with weapons or fuel.
The computers that run current model drones are not yet capable of making all the decisions made by a pilot but that will change.
See the comments elsewhere about AI and “killer drones” and “killer robots”…
If I wanted to challenge the USA navy within the South China Sea I would build me a very sophisticated hydrophone network with multiple redundancies, a zillion radar antennas multiplexed to scattered information centers and about 10000 supersonic smart self guided missiles with 500 kg warheads. That ought to do it.
Skip the hydrophones and radar. Satellites are good enough to get those smart missiles in the right enough place for them to do their work.
500 kg ten times bigger than needed when the target is a great big thin can of kerosene and HE.
Missiles are REAL cheap compared to a carrier group, and essentially unstoppable if enough and smart.
Sea war over in maybe half an hour.
Far better deterrent- let it be known in undoubtable ways, to each member of chinese decision group that, for certain, they themselves, nobody else, will become extremely uncomfortable by ten thousand sneaky cuts, if they vote for the wrong moves.
And, if they vote for the right ones, they themselves will find all kinds of delightful surprise goodies in their private mailboxes.
Fernando,
The idea of China threatening the Straits of Malacca is ridiculous, as you say, but China is very interested in avoiding the Straits where possible and has two pipelines operating, one for NG and one for crude, from Myanmar’s coast on the Indian Ocean to Yunnan, for starters. The NG pipeline was opened in January 2013 and has a planned capacity of 12 billion cubic meters of gas a year; the crude pipeline was officially opened (on a trial basis) in January this year, with a design capacity of about 160 million barrels of crude per year.
The oil pipeline is a joint China/Myanmar project, while the NG pipeline is “co-invested and co-operated” by China, Myanmar, India and South Korea, with some others (?). China is open to options, it seems.
The idea of China attempting to defend their sea lanes is not ridiculous.
They are not idiots!!!! The US oil embargoed Japan in WWII. It is not out of the question.
They don’t need to take them over or defeat other navies in war.
They simply need to ensure that nobody can cut off their supply without suffering consequences.
The island building campaign is an obvious attempt in this direction. How could you argue differently?
They simply need to ensure that nobody can cut off their supply without suffering consequences.
Those consequences would need to be done very carefully. As I mentioned before, I seriously doubt either China or the US wants a war with the other.
I just saw this. It is written by David Axe, the War is Boring guy I have cited in other comments.
Why China is far from ready to meet the U.S. on a global battlefront
Both of these statements are true:
1) China possesses a rapidly improving military that, in certain local or regional engagements, could match — and even defeat — U.S. forces in battle.
2) In military terms, China is a paper dragon that, despite its apparent strength, is powerless to intervene in world events far from its shores.
Strange as it may seem the investors are still flocking to oil, to the tune of almost 11 billion dollars so far this year.
The oil industry’s magic printing press from the Wall Street Journal
http://www.wsj.com/articles/the-oil-industrys-magic-printing-press-1434728672
Production estimates.
I guess there are 2 completely different ways to estimate production.
One consists in collecting production data. The bottom up approach. That may takes many months before we get a good grip on actual figures once all data are collected. And the rate at which data are collected vary: from state to state obviously but also during the year (less collection in december?)….All in all, as illustrated by the many discussions on this board, this method requires a relatively long time to be settled for good.
The other method is based on data available much sooner than actual production data.
After all, crude inventories (which is mostly what we are interested by) are the results of crude production plus imports minus refinery feeds. (Do I miss something?). The top down approach.
Imports and refinery feeds are known very quiskly as far as I know: one month delay max.
So this approach would have the merit of simplicity and rapidity on top of giving us the real important data: actual crude oil traded on the market as opposed to condensate which is a very different market.
Why not completing your very interesting analyses by this top down approach?
What do you think.
From that point of view, I must say that I was very disappointed by the relatively small decrease in crude inventories this week! Convinced among other things by your analyses that crude production in the US was significantly declining, I was expecting a much larger decline: 7 millions like the previous week and not the 2.9 figure….I am not aware of any one analysing the top-down methodology as you do for the bottom-up on a weekly basis. Has anyone got more info on that?
In any case thanks for your work. This is “The” contribution I read first every week!
Which crude inventories are you looking at? USA crude inventories?
Yes, sure
Ok. So let’s say we focus on USA inventory changes. What happens if somebody decides to move one million barrels from a Durban tank farm to a Texas city tank farm? It shows up as an extra million barrels in USA inventory.
It didn’t get produced, nor did it get consumed. I think (but I’m not sure) that’s why the USA inventory changes yield fuzzy point forward views. A really intensive look at the shale plays, out in the open, that we see here, gives you a sense of what may be happening point forward. And I like the way people disagree and complain. It’s fizzy, and that avoids getting lost in a monolithic crowd. However, the USA storage sure seems to have value in the sense that, if it’s increasing at a lower rate, it can mean there is less oil abroad to move into USA storage.
There are other items I sure wish I could see. For example, a detailed look at Iraq. The CIA must have a really nice report issued on a weekly basis, we need to see if we can get copies.
This is how the EIA explains delays in providing accurate data on oil production:
“Data lags complicate understanding of turning points
-Delays of several months between drilling, well completion, production, and administrative reporting
-Marked differences in reporting lag and frequency of reports among the states
-Recurring revisions months or years ago”
Alex
Exactly so. If you wish to get an inkling of the incredibly complex ‘stuff’ involved in the onsite infrastructure needed for pad development/production, the May, 2015 online edition of American Oil & Gas Reporter (aogr.com) describes how operators need to construct micro refineries to handle production. (Search phrase facility design on that site.,l
This is a primary reason the E&P boys in the Bakken have just been lighting a match to this stuff these past several years.
That’s a pretty good article, but they aren’t designing micro refineries. Their pad scheme could be simpler, and they could link up pads to a single facility, to allow a steadier facility utilization rate.
Let me ask you, has anybody considered using long flow lines to connect these wells and pads? What am I missing?
Fernando
As far as I know, that has been the primary method of capturing/transporting the associated gas.
Thing is, the Bakken is an oil play. The high decline rates apply every bit as much to the gas output as the oil … and at about 3 bucks/mmbtu, it just has poor economics.
A ‘good’ Bakken well may throw off 1 MMcfd at the outset … 3 thousand bucks worth. Six/twelve months on, output is less than half. A lot of logistics for minimal financial return.
That’s why they ought to pace their wells and daisy chain the pads. Designing for peak rate is nonsense in most cases.
Reported well completions
Source: EIA estimates
Hi AlexS,
Thanks.
Note that the drop in Permian Basin completions may reflect fewer vertical wells which have much lower output than the Horizontal wells. It may be that there has been very little drop in the number of horizontal wells completed. This is also true of the rig count in the Permian basin, most of the rigs that have been stacked there are vertical rigs.
I checked out the Baker Hughes pivot table for the Texas Permian Basin and horizontal rigs peaked around Dec 31, 2014 at about 280 and are now about 140 rigs. The vertical rigs peaked in May 2014 at around 224 rigs and these have fallen by more than a factor of 4 to about 50 rigs.
You are right, Dennis
And this shift from vertical to horizontal wells explains rapid gains in average IP rates and continued growth in Permian basin oil production
Estimated U.S. tight oil production was 4.6 million barrels/day in May 2015, 48% of total U.S. oil production
Sources: EIA derived from state administrative data collected by DrillingInfo Inc. Data are through April 2015 and represent EIA’s official tight oil estimates, but are not survey data
Note, that average U.S. tight oil production was 4.2 million barrels/day in 2014, according to the Annual Energy Outlook 2015
AlexS. Looks like US conventional has been flat since 2006.
All the focus is on shale. Do you have any data, or thoughts on where it is headed given steep drop in US conventional (vertical) rigs?
Hey, shallow
You may get a kick out of the two lead stories in the June issue American Oil&Gas Reporter.
The second one, in particular, goes into extensive financial and operational particulars regarding LOE from a small shale operator’s experiences.
Good stuff.
coffee. I read article about Endurance. If that is the one you are referring to, it is a good one. Thanks for the heads up.
It also brought up something interesting. Is it common for shale wells to produce with ESP and then after a year or two, switch to rod pumped? This is described in Endurance article.
I assume that is about a $200K expense to switch from ESP to rod pumped on a 10,000′ well?
Shallow
I don’t know that any one system of AL is being uniformly utilized, but there seems to be a bit of ‘chatter’ about improved styles of rod pumps that may be showing better returns.
Hi SS,
Are you talking about drop of horizontal from this last fall? Could you guess if that drop also occurred significantly in conventional plays or it is hard to delineate between tight shale areas and others?
Ves. I just noticed in Baker Hughes rig count numbers that US vertical rigs number was 100. Assume at least one is gas, so assume oil vertical rigs are under 100.
Historically, number of US rigs running in 1990s up to shale boom was 200-400. Assume a few of those were horizontal?
Anyway, vertical stood at 380 one year ago, is now only 100. Therefore, I assume conventional in US, which has stayed in a tight range, will being to fall, if not already.
We are all hyper focused on US shale, which accounts for roughly half of US production. However, conventional is still the other half. If it begins to drop 5% or so per year, due to limited drilling, won’t shale have a tough time making up the difference if and when oil prices rebound?
Exactly. This applies to all the conventional in other countries. I suspect they must be dropping steadily, but it’s hard to get a consolidated (open source) report for countries like Argentina, Congo, and Kazahstan.
Hi Fernando, this question is probably not directly related to your professional expertise but you or somebody else may know the answer.
Do tanker ships often take on less than a full load of crude before sailing ? Do they often visit two or more ports to offload?
It occurs to me that the movement of ships on the high seas is very well documented by lots of different people for various reasons.
So- Anybody who wants to spend some money can probably find out how much oil is leaving or arriving at any given location within a couple of percent over a period of a year if he knows whether ships usually sail fully loaded.
Somehow I just don’t think the big players have any trouble at all putting their hands on such data.
A well established sales rep who handles a line of drilling rig replacement parts could probably tell us almost as much about the decline in working rigs as we learn from government reports.
Industrial spying is what I am getting at. Any given company might be able to keep a lot of their own data confidential but most likely the data for any given country is known quite accurately to the larger oil companies and government agencies such as the NSA etc.
I doubt there is anything moving on the oceans bigger than a large pleasure boat that is not represented by a slow moving dot on numerous computer displays. Clicking on that dot is going to pull up the date the ship was built and where, the names of the owners, etc -as well as where it sailed from.
Mac, I think you give more credit to tracking devices and information than is truly warranted. Also nuclear submarines cannot be tracked. Of course you were not talking about submarines but I just thought I would mention that.
My point is I thing you give more credit to tracking devices and information than they really deserve.
Hi Ron,
When it comes to smaller craft , I am sure you are right, that most of them are not tracked due to the sheer number of them and the size of the job.
But insurance companies and banks and tax collectors and port masters and customs inspectors and Sky Daddy alone knows how many more people keep up with commercial ship traffic on a day to day basis.
So anybody who wants to know where every large ship is or where it has been or where it is going can potentially get this information from these sources , probably free of charge in a lot of cases.
I strongly suspect that the police and armed forces in just about every country with a seaport routinely get this information forwarded to them automatically. If the cops and the military have it locally then it seems reasonable to think that the NSA, the CIA, the FBI , Interpol, etc etc also have it at their fingertips.
Of course gathering it all up and organizing it on a timely basis would be a hell of a job and might not be worthwhile from a business point of view.
Mac, in some cases it’s fairly easy because one can track the tanker loads. In Venezuela’s case it’s a bit harder because the have been importing oil to use as diluent, and they also process in their refineries. We also noted one time they had a few tankers go to the Netherland Antilles, and it didn’t unload a full load. Then it returned and they reported it was taking on a full load, when it was half a load. This was done to inflate their production figures because they wanted to prop up their bonds by overstating their income.
Half loads aren’t frequent, and yes sometimes a tanke takes on a partial load and fills up elsewhere. For example, an 80ooo dwt tanker can take a quarter million barrels from Sharjah and finish the load at Ras Tanura.
SS,
I think just looking at solely at shale will not allow us to see what is going on. That is when you mentioned conventional rig count drop I thought that is real story. If market is localized and we operate in closed system than shale production could be adjusted with conventional part. But we do not have localized and closed market but global. Also I don’t think based on financial shenanigans of financing shale operations that the playing field is fair or even with the conventional. I think that is the reason why the downturn shocks are profound in conventional play downturn rig count as well. Shale like Tar is just boondoggle. One is just short term and the other long term.
I know how to make money from 8 degree API 2000 to 200000 cp oil. But I prefer a very fat sand with no water in the neighborhood. I suspect that in 20 years Canada will be making a tidy sum from that extra heavy oil.
I am sure with introduction of slave wages, total disregard for the environment, 0% interest, creation of money/credit from the thin air you could make a profit. But on the other hand we have all these things already with exception of slave wages but wages are going in that direction due to inflation of cost of living and they still can’t make profit. Ahh and then big honchos at these Tar operations say “But but if we have loong enough horizon let’s say 50-70 years we can make profit”. Well you know what let’s make horizon 1000 years and be done with all other nonsense.
My plan wouldn’t have “total disregard for the environment”. I’m very pro environment. Why would you assume producing extra heavy oil requires a disregard for the environment.
to cut the cost. environmental budgets are not set in stone.
There’s no such thing as an “environmental budget”. We have to design everything considering emissions and disturbances. It’s required. My preference is to be stricter than regulatory requirements to help create a positive image, which in turn allows better brand image and relations with natives.
I looked at historical oil rig counts in the US on the EIA website.
The lowest oil rig count reported for a month was 108 in 1999.
I don’t know if any of those 108 rigs in 1999 were horizontal. However, I would say that vertical oil rigs running have hit a low not seen since the 1998-1999 bust. Could even be below that, which would then take us back to pre 1970.
Therefore, US shale is really going to have to kick some major butt to fight not only its own decline, but the vertical (conventional) decline it wrought by going hog wild on the borrowing, thereby causing the conventional to drop by about 75%, due to price crash.
Keep in mind, many of the conventional are playing with their own money. So chances of a quick spike in conventional rigs not likely IMO.
About 175 vertical rigs were stacked in the Texas Permian basin in the past 13 months (225 to 50).
shallow sand,
Here is EIA historical data and projections (from AEO 2015) for Lower 48 onshore conventional oil production
The EIA projections imply increasing volumes from CO2 EOR
The numbers in 2 tables above are in kb/d
AlexS. Thanks! So to get to 4.5-5 million includes GOM and Alaska?
Here are the numbers from EIA AnnualEnergy Outlook 2015:
Lower 48 Onshore conventional: 2.45
Lower 48 Offshore: 1.50
Alaska: 0.49
Tight oil: 4.19
Total: 8,63
Am I correct that GOM and Alaska both have higher decline rates than US lower 48 conventional?
Deepwater offshore well decline rates are generally much higher than for conventional onshore, up to 15-20% p.a.. But there is a number of new projects coming onstream in the GoM this year and in the next few years.
Alaska’a production declined from 1 mbd in 2000 to less than 0.5 mbd this year and is expected to decline further to 0.2 mbd by mid-30s. As far as I know, the Transalaskan pipeline will likely have operational problems, if the volumes transported are below 0.5 mbd. I don’t know how this will be fixed. By end-30s the EIA expects (Shell’s) offshore Alaskan projects to start production
” Estimated U.S. tight oil production was 4.6 million barrels/day in May 2015, 48% of total U.S. oil production”
AlexS,
Does this info looks to you like scrapping at the bottom of the oil barrel?
Ves,
I don’t think so. In my view, after a likely decline in the second half of this year and the beginning of 2016, LTO production will rebound and could peak at 5.5-6.0 by the end of this decade. And this is a conservative estimate, which does not take into account potential technological breakthough, such as EOR in tight oil plays
It all depends on whether or not the price of oil recover to its former price. I think oil will need to hit $75 or perhaps $80 a barrel before shale starts to recover any at all and $90 before it really starts to grow like it did in past years. But if WTI stays below $70 a barrel then shale oil will slowly die away.
Hi Ron,
On this point I am in 100% agreement. If US output declines in the way the EIA’s Short term energy outlook predicts (and I am doubtful about EIA forecasts), I doubt that oil prices will stay below $70/b, but if they do LTO output will continue to decline until oil prices rise to $80/b or more.
Wow! I’m guessing that is going to take 35,000 more shale wells than we have right now and another 300 billion dollars. There goes the neighborhood.
According to Baker Hughes, about 37,500 onshore oil & gas wells were drilled in the U.S. in 2014. Of these, 18,000 – in the Permian, Bakken and Eagle Ford. Even assuming a decline in well count this year and the next, 35,000 new shale oil wells could be drilled in less than 3 years.
I am not assuming that companies’ cashflows will cover their capex over the next few years, even if WTI rises to $70-80 range. But I think that capital will still be flowing to the shale industry via debt and equity issuances, asset sales and M&A activity. At some point, the bubble may burst, but not in the near future, as it is in nobody’s interest
Alex, I want you to be right.
The bubble has already burst, however. In my opinion, and many others, the economics of shale oil development works only marginally at <80 dollar oil prices. The peak oil community must start addressing profitability and debt or all of its models and speculation about the our energy future are fruitless. Where the money is going to come from hence forth can no longer be neglected. Either that or we, as Americans, should begin the long arduous debate of nationalizing our hydrocarbon resources and eliminating private mineral ownership and enterprise. The LTO industry cannot stand on it's own two feet. When it begins paying it's debt back, and managing additional debt properly, I will happily retract that statement.
As to the possibility of that many more shale wells in America, I don't know where they will put them all, short of 10 acre spacing and 100 lateral distances. There appears already to be geological constraints to profitability.
Again, I hope you are right. Respectfully, I just don't know how you will be right.
Mike
If oil and gas production and minerals become property of the federal government, how much $ would the taxpayer have to pay? Surely the government would pay too much.
Or would Uncle Sam buy shale and try to put conventional out of business?
Would the US try to
produce all out and take a loss on the production, hoping to stimulate the economy, or regulate production?
Would those drilling and operating wells be government employees or work for private contractors?
I was kidding, Shallow. Kinda. Nationalism would never work, at least not in Texas. We’d string up wire around the entire state and put a no trespassing sign on ever fence post. I’ll bet you a dollar though that if put to a vote well over half of the American population would say hell yes to nationalizing our oil industry in a New York minute.
The point I wished to make, as always not very eloquently, is it is time to sort out how America is going to PAY for a sustained, predictable LTO supply. It’s fun to speculate about it’s future but at some point how you get from A to B matters.
There are many ways to handle this approach. First, the law has to take mineral rights from the landowner, and spell out how the income is split at the local level, as well as landowner rights to demand payment for surface rights (the land owner has to get paid for having access to the land).
Second, the government decides if it has a national oil company do it, or if it uses private companies.
Third, either the government or the national oil company needs to decide if it gets in the service business (drilling and workover rigs, and the other services).
Fourth, they have to decide the way private companies and service companies get contracts to do their thing.
And so on. It’s all very doable, and there are dozens of options. The best method seems to be what the USA, UK and Norway do offshore. The worst are Mexico, Venezuela, Ecuador, and countries like that.
Mike
With all the other factors involved, your comment about 10 acre spacing and 100′ distance between laterals may prove to be both correct and forthcoming.
EOG is presently planning 500′ spacing of laterals from two pads in the Bakken.
Carrizo has been successful in the Niobrara with 300′ spacing on at least one pad.
Right down there in the EF, operators have been targeting the thicker payzones with 100’/150′ vertical separation and about 150′ horizontal spacing in what they are calling ‘high/low’ well placement.
COP just announced plans to initiate ‘triple stacking’ in some areas of the EF to access the slightly shallower hydrocarbon bearing zones.
One big reason for the every diminishing distance between wells is the precision in both thoroughly stimulating the formation around the well, while effectively controlling both the vertical as well as horizontal extent.
EOG was the first, but now many operators are calling this approach high density fracturing, wherein 50 or so stages are frac’d with high volume proppant and water in rapid succession.
There are already advanced plans – and several field trials – to re-inject gas to maintain formation pressure.
Statoil is frac’ing a well in the Bakken right now with CO2. Many folks are waiting to evaluate the results of this effort.
The 90%/95% of the remaining oil in the ground after these shale wells are put into operation will not be left behind.
Coffee, you must get that stuff straight off a teleprompter. Stacking multiple laterals in different intervals is not new but I like the new shaleism, “triple stacking.” And I sure like 90-95% recovery rates of OOIP, imagine that! Leave no nanopore un-drained, uh?
Mike
Mike,
I totally agree with you about shale economics. But as the past few months have shown, investors and lenders prefer to ignore the poor financial performance of shale players. The bubble will really burst when Wall Street is unwilling to lend anymore. I may be wrong, but it can take several years before that happens.
The bubble will really burst when Wall Street is unwilling to lend anymore. I may be wrong, but it can take several years before that happens.
Investors think there is no other place to put their money. That shouldn’t be the case. Solvent companies could expand.
For that matter, cities could issue bonds and rebuild infrastructure. But I suppose with rates being so low, Wall Street would rather that its chances on junk bonds. And if it believes the government will bail them out if they make a mistake, why not throw all of their money at high risk oil debt?
Seems like the bubble might burst only if Wall Street is forced to cash out quickly. Isn’t that what brought mortgage derivatives down? Only if the lenders have to bail and repay someone else do they need to stop making risky loans.
I agree with you
Alex, I hope you are right. That raises a good question; how much additional debt has been taken on the past 9 months with rig counts now half of what they were a year ago? Debt increase v. wells drilled and completed, in other word’s where is the new money going, if indeed it is still being willingly loaned out. Are they borrowing money just to pay interest? CLR got some more, who else? That may give some insight into how many imaginary wells are being drilled, but not frac’ed.
Mike
From Bloomberg:
“Drillers’ debt ballooned to $235 billion at the end of the first quarter, a 16 percent increase in the past year, even as revenue shrank.”
http://www.bloomberg.com/news/articles/2015-06-18/next-threat-to-u-s-shale-rising-interest-payments
Note that shale players can also sell equity and assets
“Note that shale players can also sell equity and assets”
To whom?
It reminds me when Kramer and Jerry (Sainfield) argue about debt that corporation write off:
Jerry: What do you mean they write it off?
Kramer: (silence) But they write it off, Jerry? 🙂
Actually, over the past few years the shale guys have sold some pretty good conventional production to put toward drilling more shale oil wells.
Mike, I am only half way kidding about nationalization. I am very far removed from urban America and I think you are too. I think people in the cities have a different view, or a least a larger number than we’d hope.
U.S. oil independents have sold approximately $11.5 billion in new equity in February and March alone
http://blog.ihs.com/us-oil-production-continues-in-defiance-of-soft-oil-prices%E2%80%94but-for-how-long
And there were lots of equity issuances since then too
Ves,
– “Note that shale players can also sell equity and assets”
– “To whom?”
6 asset deals in just 10 days this June for combined $7.5 billion.
June 11, 2015: Hess Corp. has agreed to sell a 50% interest in its Bakken midstream assets to Global Infrastructure Partners for cash consideration of $2.675 billion.
June 11, 2015 – EVEP closes Utica East Ohio divestment for $575 million
June 9, 2015 – WPX ENERGY TO MONETIZE ADDITIONAL MARCELLUS HOLDINGS for more than $200 million cash
June 9, 2015 – Gastar Exploration Inc. has agreed to sell 19,000 net non-core assets in Kingfisher County, OK to an undisclosed private third party for approximately $46.2 million
June 5, 2015 – Apache Corp. has completed the previously disclosed sale of its Australian subsidiary Apache Energy Ltd. to a consortium of private equity funds managed by Macquarie Corporate Holdings Ltd. and Brookfield Asset Management Inc. Total proceeds – $1.9 billion
June 2, 2015 – Pioneer sells Eagle Ford midstream business for $2.15 billion
AlexS,
Well, I guess than when money is created from thin air then supply of greater fools are unlimited. But when they suck every barrel of oil than they will as Kramer says “just write all debt off”.
If Americans were worried enough about oil production to consider something as drastic as nationalization and subsidization of shale oil, they’d do something much cheaper and more effective:
Buy EVs.
If Americans were worried enough about oil production to consider something as drastic as nationalization and subsidization of shale oil, they’d do something much cheaper and more effective:
Buy EVs.
Yes, stop and think about this. On the one hand, we’ve got people saying climate data is rigged to force us into different lifestyles. On the other hand, we have people saying the oil situation may be so bad that we’ll need to nationalize the industry.
Why would either of these scenarios be more likely than just making lifestyle adjustments as needed?
Hi AlexS,
On your prediction of 5.75 Mb/d for US LTO, let’s assume currently LTO is at about 4.5 Mb/d, I think an increase of 1 Mb/d of US LTO output is optimistic, US LTO will peak at around 5 Mb/d in my view as Rune Likvern’s Red Queen effect starts to take effect in the Eagle Ford, Bakken, and eventually in the Permian basin. After 2017 Eagle Ford and Bakken output will be declining and the Permian Basin and other LTO plays might allow small increases in overall LTO output. A peak of 5.75 Mb/d of US LTO is very optimistic (even my view of 5 Mb/d is on the optimistic side though it seems fairly realistic to me unless the LTO focused oil companies are unable to borrow more money.
Another fantastically depressing paper on the ongoing mass extinction was just published:
http://advances.sciencemag.org/content/1/5/e1400253
The abstract:
The oft-repeated claim that Earth’s biota is entering a sixth “mass extinction” depends on clearly demonstrating that current extinction rates are far above the “background” rates prevailing in the five previous mass extinctions. Earlier estimates of extinction rates have been criticized for using assumptions that might overestimate the severity of the extinction crisis. We assess, using extremely conservative assumptions, whether human activities are causing a mass extinction. First, we use a recent estimate of a background rate of 2 mammal extinctions per 10,000 species per 100 years (that is, 2 E/MSY), which is twice as high as widely used previous estimates. We then compare this rate with the current rate of mammal and vertebrate extinctions. The latter is conservatively low because listing a species as extinct requires meeting stringent criteria. Even under our assumptions, which would tend to minimize evidence of an incipient mass extinction, the average rate of vertebrate species loss over the last century is up to 114 times higher than the background rate. Under the 2 E/MSY background rate, the number of species that have gone extinct in the last century would have taken, depending on the vertebrate taxon, between 800 and 10,000 years to disappear. These estimates reveal an exceptionally rapid loss of biodiversity over the last few centuries, indicating that a sixth mass extinction is already under way. Averting a dramatic decay of biodiversity and the subsequent loss of ecosystem services is still possible through intensified conservation efforts, but that window of opportunity is rapidly closing.
The really sad part is we do not even have a clear handle on the number of species actually out there, especially invertebrates and plant species. Taxonomy just does not have enough people to even come close to getting a true total. The tremendous destruction of the environment that has gone on in the last two centuries has probably wiped out many species that were never recorded.
We have been exterminating other species for a looong time. I believe Australians wiped out fauna when they reached it tens of thousands of years ago, Asian tribes entering the new world did the same about 13000 years ago, and so on.
Your post seems to imply that because we’ve been exterminating species for such a long time, we need not concern ourselves too much about this perfectly natural event.
Are you not concerned about the increased rate of extinction?
The difference between the extinctions then and the extinctions of the past 300 years (and especially the last 100) is that the latter seriously threatens humanity itself.
I think you nailed it.
EARTH ‘ENTERING NEW EXTINCTION PHASE’ – US STUDY
“The Earth has entered a new period of extinction, a study by three US universities has concluded, and humans could be among the first casualties.”
http://www.bbc.com/news/science-environment-33209548
Not really. I’m more concerned with the population growth which causes us to eat medusas and kill everything in sight.
@Fernando
Not really!
Your ignorance of the complexity and interconnectedness of the biosphere seems to be truly profound. You do realize that you are a great ape, right?! BTW, That’s a scientific designation, not an insult…
Fred, and you are a greater ape (that’s a compliment).
Hi Fred,
I believe the key to understanding Fernando is that his habitual intellectual time horizon is limited to about twenty or thirty years – judging by his comments. Of course he may have opinions about the long term he is not sharing with us.
How about it Fernando? You don’t say much about the LONG TERM.
When you get right down to it saying THIS MUCH on my part is a compliment considering that most naked apes seem to have an intellectual time horizon ranging from a few hours to a few weeks.My own wild ass guess is that well under five percent of us habitually think in terms of decades rather than years.
At least he does believe in peak oil and oil prices going thru the roof as the remaining oil gets to be harder and harder to get out of the ground.
So there is hope for him. 😉
How about it Fernando?
I myself believe that oil prices are going to go to at least a couple of hundred bucks a barrel in constant present day money within a couple of decades. Depletion will guarantee the supply being short enough to support the price, and dramatic gains in efficiency and changing lifestyles will enable us to pay the two hundred bucks.
Do you have an opinion you are willing to share with us on the demise of the ice car and its replacement by battery powered cars?
NOW I DO GET IT when you talk about the unaffordability of wind and solar power. I am waiting myself until solar power bottoms – as best I can estimate total system cost on small installations – before I buy a system of my own. In dollars and cents there is a hell of a lot I can do with the money that pays back faster by investing it in efficiency measures and in productive enterprises such as planting more fruit trees.
In the real world real people have to pay for real infrastructure in real time. Most of us are not rich enough to afford to go to wind and solar power in the SHORT term – even though going renewable is our only LONG term hope.
The truth is that I simply am not well enough off to spend a few thousand bucks for purposes of reducing my environmental footprint by going solar. More power to those who can afford to do so ! Especially as they are contributing to scaling up the industry so it will be more affordable to me later on.
Do you believe as I do that when things get really tight in terms of fossil fuel supplies that nimby and environmentalist interests will be overridden and pumped storage reservoirs built in lots of places now off limits?
This is a sledgehammer approach to solving the intermittency problem of wind and solar power but it WILL work.
You have mentioned geothermal power as being seriously scalable recently. Do you have an opinion as to long it might take for geothermal power to get up to say one percent of global supply ?
When I was small, we’d hear the story of the grasshopper and the ant.
I don’t hear it anymore. It doesn’t seem like many people talk about conserving today so that we’ll have something in the future.
Aside from consumers being told to buy today and put everything on credit, we’ve got companies only thinking about the next quarter. And US politics are determined by the every-two-years House elections.
Long range planning has totally fallen out of favor.
Boomer II,
I think you’ll find that this sentiment stretches back as long as capitalism was the dominant form economics/politics/sociology. So, since around the late 1700s in Britain, the 1800s in the rest of Europe and America, and everywhere else since. People have always felt the constant change of “modern (re: capitalism) life upsetting and confusing.
Capitalism by its very nature does not care about long term profits, especially the capitalism that exists now. Finance capitalism especially is not concerned with long-term growth, efficient planning, or productive use. The easiest way to get a high rate of return these days is speculation, or rigging the game in your favor so that you cannot possibly lose and knowing that even if you do the house will bail you out.
This isn’t exactly fair though. Finance capitalism “desires” more debt. With more and more income being used to service these debts, it can’t be used to purchase goods and services that provide the backbone of ANY economy.
As long as the financial instiutions in the United States and the world are THE center of power – or at least exercise an inordinate amount of it – this will be the case.
I think you’ll find that this sentiment stretches back as long as capitalism was the dominant form economics/politics/sociology.
Which is why some folks are questioning the effectiveness of capitalism. That doesn’t mean they favor communism. They just don’t feel capitalism works well enough at solving the world’s problems to leave it unexamined.
Mac
How long is long term? If you mean say 100 years, I’m not worried about the extinction of 26 frog species in Great Britain if it’s going to be crawling with hunter killer drones trying to wipe out British Homo sapiens.
I believe the key to understanding Fernando is that his habitual intellectual time horizon is limited to about twenty or thirty years – judging by his comments.
Oh, I think I understand Fernando quite well… I just have mostly diametrically opposed views to his on just about everything that I can imagine.
BTW, today being father’s day I spent it with my son. I don’t recall if Fernando is a father or not but I suspect that those of us who have children and can see the writing on the wall have different concerns about the future than he does.
What he doesn’t seem to get is that if amphibians should become extinct in Great Britain he won’t have to worry about drones at all. There won’t be any and there won’t be any humans either.
As for 26 species of frogs going extinct? Great Britain has a total of only 7 native amphibian species 2 of which happen to be frogs. There are a couple of non native introduced species as well.
BTW amphibians are a sort of canary in the coal mine species in ecosystems the world over and they are definitely not doing well.
I’m not too worried about the drones!
Im not going to describe my personal life, but I can confess I have a grandson serving in the U.S. Military in South Korea, I have a daughter who worked in China and speaks Mandarin, and my youngest son has the family record for visiting the most countries in a single calendar year (six).
LOL! Compliment accepted! At least I do understand biology, if little else.
Given that collectively humans participate in a considerable amount of self-destructive behavior (e.g, unhealthy habits, pollution, resource depletion), it’s very unlikely they will do much to save other species as well.
We do have some plant, animal, and habitat protection programs, and there are zoos and some seed and DNA libraries to preserve some endangered life, but I don’t see us getting mobilized to act on the scale suggested.
During the Siege of Paris in 1870 the elephants Castor and Pollux were eaten by hungry and fully “civilized” Parisians. The Siege of the World is just around the corner and delicious cells are delicious cells, whether they by pressed into the shapes of fish, birds, crocodiles, elephants or humans.
I have a question for the oil & gas industry experts out there [from a dumb ass accountant]. Looking at the oil and gas production numbers, it would seem that production is not falling as fast as expected. So, let’s look at Harold Hamm (CLR), and others, who late last year announced substantial budget cuts, but forecast no decline in production. It is easy to say Harold is a dumbass, but since he has made several billion $’s more than most of us, I reserve judgment. Looking back at drilling 1 and 1/2 years ago, I think that most drillers expected higher prices. And, after they fell substantially, Harold pulled the CLR hedges off, clearly thinking that they were near a bottom and expecting a quick rebound.
The question is: Is it possible some of these drillers had some of their wells choked back in anticipation of higher prices? If that were the case, then maybe that is why they were saying production would not decline with the budget cuts. They might have had a cushion in that they knew that they could increase production from some existing wells. So again the question is – is that possible [without addressing the likelihood]?
Accountants all the time [and given the chance] will set up reserves for losses during exceptionally good times in order to be able to cushion a bad future quarter, [by reversing a reserve]. This would be the operations side of the business doing the exact same thing.
Clue. My impression how Continental can keep production steady:
1) they had growth during 2014, so even while production is dropping in 2015, the AVERAGE production can still be quite easily higher, although the exit rate may be lower.
2) they admit that by the end of the year they expect fewer wells to be waiting for completion than EOY 2014. So basically they are reducing inventory.
3) they will spend 2/3 of CAPEX in the 1st half of the year, benefitting more this year (in terms of production, not profit..) from the production being brought online this year.
Besides that, they claim that 2015 wells will have a 800 kBOE EUR, but looking at how they missed the earlier claim of 600kBOE wells, I have my doubts.
From the data I don’t get the impression that wells are being choked on a wide scale.
With CLR specifically, also note that more focus is on SCOOP than Bakken at present. SCOOP appears to be primarily a gas field, Wood Mac stats are 22% oil/condensate. Therefore, CLR BOE could stay flat while oil falls.
From memory, CLR mix went from 70/30 to 69/31 in last quarter and stated gas reserves are higher than for oil.
Enno’s points are all accurate, IMO.
Hope I am not coming off as bashing CLR too much. I like looking at them because they are straightforward financially, making review of SEC stuff easy to follow. So far they have not raised money other than straight borrowing. No trusts, convertibles, equity issuance, etc.
Plus they pretty much sold out of all conventional production, so it is a more accurate proxy on shale than other companies, who have more older conventional mixed in.
I will admit, I am in the same boat with Harold Hamm on one thing (not net worth, LOL). I did not see WTI dropping below $70-75. We had actually discussed buying some puts when the strip started to get more backward dated. However, we didn’t because of our faulty low end price case, and we still do pretty good in that range. How we’d love to get to $75 WTI, because that $15 bucks per barrel is pure profit for us, except for our 2-4 well per year drilling, which we could then resume.
My criticisms of CLR are pretty simple. 1. Massive debt. 2. Significant rigs still running, with little hope of new wells hitting payout in five years, or less, which I think is critical for wells financed with borrowed funds. They are far from alone on either 1. or 2. Many are still active despite being in far worse shape than CLR.
Note the time lag between the decline in drilling and the decline in production in the Haynesville Shale Gas Play:
http://i1095.photobucket.com/albums/i475/westexas/Haynesville-rig-count-and-natural-gas-production1_zpsb1n95tiz.jpg
CLR et al are still hoping for a snapback in the second half of the year. None of the fracking is sustainable at these prices and you can only run your current assets and committed drilling so long with how these wells decline.
I don’t think that’s going to happen between Europe and China being messes and Iran possibly cutting a nuke deal.
The EIA’s International Energy Statistics has US Total liquids down 350,000 barrels per day from December to January but recovering slightly in February. February is only down 300,000 barrels per day from December 2014.
And US C+C output? Up 10,000 b/d from Dec 2014 to Feb 2015. A small decline of 14,000 b/d (or huge depending upon one’s perspective) in Jan and a small(or huge) rise of 24,000 b in February.
Test. Can’t seem to post at the moment.
From the BP 2014 profile Jeff posted somewhere, some things worthy of note:
Global consumption increase 0.8%. The China number at 11+ million bpd was up 3%. India up 3.3% and there’s a good chance they will eclipse Japan soon and become the 3rd largest consumer.
Some lesser places with signif numbers:
Egypt consumption up 8%. 814K bpd
Philippines up 5%. They are WAAAY behind in per capita consumption. 100+ million ppl, 312K bpd. That number has to increase 20X to get to US norms which would put them at 6 million bpd, which will also look tempting for seizures by China.
Vietnam + 5.6%. 412K bpd. 92ish million folks. They also will need a X20 to get to US norms. Similar temptation to China.
Brazil is a quiet one. +5.6% growth and now 3.2 million bpd. 200 million people. They have to do a X4 to get to proper US per capita norms.
Indonesia. Contradictory stuff.
-3.5% consumption. GDP growth 6.4%. Car sales about 1 million units 20% up from previous year and of course essentially all of them proper gasoline or diesel vehicles. 7.6 million motorcycles, ditto.
Despite GDP growth, budget deficit 2.25% of GDP. (US 2.7%)
Anybody ever wonder why almost nobody runs a surplus? KSA runs a deficit. So does Norway.
Qatar does. A surplus. And their budget this year is for $45 crude. Maybe this is why they have become hated.
If you don’t have private demand for lending, the govt steps in. This pushes money supply growth and is entirely manipulated.
According to the Economist Magazine estimate, total global public debt increased from $27 Trillion in 2005 to $54 Trillion in 2014, a 7.7%/year rate of increase:
http://www.economist.com/content/global_debt_clock
Over this 9 year time period, I estimate that globally we burned through about 30% of post-2005 CNE (Cumulative Net Exports), and as I have occasionally pointed out, so far the pattern we have seen is that the Chindia region has been consuming an increasing share of a post-2005 declining volume of Global Net Exports of oil.
So, global public debt has been increasing at about 8%/year, while we are depleting the remaining estimated volume of Global and Available* CNE at an accelerating rate of depletion.
Available = Global Net Exports less Chindia’s Net Imports
Jeffrey,
A quick look suggests to me that average inflation-adjusted world GDP growth over the last 10 years has been about 4%, and that average inflation has been very roughly 4%.
That suggests that nominal GDP has grown by about 8% per year. That matches the debt figures, suggesting that debt as a portion of the world economy hasn’t grown.
Nick,
The world bank gives nominal GDP in 2005 as approximately 47 trillion, and in 2014, they don’t have a figure for 2014 yet, but based on the trend of the last few years it might be reasonable to put it around 78 trillion. This implies that public debt/gdp has gone from 57% to around 70%.
Now personally I think that public debt has had to rise as a consequence of the financial crisis, because there was too much private debt being taken on and private balance sheets needed repairing, and as such private debt is the real problem. It continues to grow unabated, as the 16th Geneva report (summarised here: http://www.voxeu.org/article/geneva-report-global-deleveraging ) points out.
Given the situation in Venezuela, the close political connection between that country and Cuba, and the possibility that substantial amounts of oil might be found in Cuban territorial waters, this link is worth reading.
It is ironic that if we establish good relations with Cuba, Cuban citizens might find it HARDER to move to this country than at present. If a refugee sets foot on American soil, he or she is home free under the current rules.
http://latino.foxnews.com/latino/news/2015/06/12/caribbean-becomes-wild-west-as-cubans-race-to-reach-us-before-wet-foot-dry-foot/?intcmp=obinsite
There’s no significant onshore oil in Cuba, and the offshore pickings are extremely slim. Cuba’s geology is very interesting: it started out as an ancient land mass located in the Pacific, which moved west in the gap between north and South America, split into several pieces, one of which is located in the Paraguana peninsula in Venezuela, the other is the western portion of margarita island, and the large piece is Cuba. The oil is found in fractured volcanic rocks and in carbonates off the northern coast which weren’t part of the original land mass.
If you check my Twitter you will find a recent comment about Obama sitting down to chat with Raúl Castro, the Cuban dictator.
Federal government routinely hires internet trolls, shills to monitor chat rooms, disrupt article comment sections
I thought that was a little off (SatansBestFriend seems new, while others seem to have ‘disappeared’) but in any case, it made me again recall the governpimp shill thing in context with this energy blog (and its recent claim to top 10 fame) as well as both myself and Ron Patterson being impersonated hereon recently. Remember that, Ron? Do you think they just vanished into thin air? (Impersonating me is one thing, but the owner of the blog?)
And let’s face it, given peak oil and large scale centralized governments (and old farmer mac’s hopefully-die hard BAU) that predominantly run on the stuff and see their lives flashing before their eyes, their power slipping worldwide, what do we think?
And me writing stuff like and/or about peak government, anarchy, revolution, wage-slavery, tax-prostitution, governpimps and Nissan Leaf-Blowers, etc..
Calean, there was some malware that allowed someone to post on blogs impersonating someone else. But WordPress has corrected that problem. I don’t believe any government shills are posting here. That is just dumb. What would that gain anyone? Some people see a conspiracy theory behind every bush.
Fair enough/points, Ron, and while conspiracies, at least under every bed, are not my bag, I nevertheless like to keep an open mind– you know, like hunches, hypotheses and the like? The stuff good science is made of?
Nevertheless, the fact still remains of course of someone who leveraged this ostensible malware hereon.
I would shill for a government for the right fee. Say $25 per entry. But this offer is only open to governments agreeing to my political platform.
Caelen,
I can assure you that I am not a troll, a governpimp or I live in a prison, like your foolish posts suggest.
I am a human, with a brain, that can perform basic critical thinking skills.
That was part of a joke. Maybe it was funny only to me.
I use the word Satan in my name because of the absolute stupidity of believing there is an Evil Demon in the world controlling things. I grew up in the Bible Belt.
You wouldn’t understand what stupidity is, because you think the world would be better if we voluntarily implemented ANARCHY.
I am at a loss for words.
Caelan, do u listen to the feedback you are getting?
Have you changed your nickname?
How about you look up the definition of anarchy first and/or tell us what you think it means, speaking of feedback. That way we can first see if there is agreement on its meaning. I have already posted comments and quotes regarding its meaning as understood and specified.
Looking into what is being spoken about or taking it seriously seems to assume you actually care, such as about your planet, your community and yourself– topics very much relevant to a peak oil blog one would think, (except maybe you?). Or maybe they are not, and so the blog becomes of limited relevance, along with you.
A growing understanding of anarchy is of a concept that cares about such things as community and what to do about the decline in energy in a post peak oil world. This is why the co-founder of permaculture– you know, that concept that looks like it may help loads in transitioning to lower energy and more stable and permanent societies– David Holmgren has described himself as anarchist.
Of course the world would be better with voluntary anarchy. If you don’t think so, then maybe you have the elite corporate media’s definition and even allow them to do your thinking for you.
BNSF Week 23
Petroleum carloads at 9,754, a decrease of 2,051 from week 23 of 2014 which had a total of 11,805.
A 17.37 percent drop in oil shipped by the BNSF.
Gettin’ whittled down to a smaller size.
You can’t have your oil and burn it too.
A musical selection:
Twenty-first Century Schizoid Man
Ronald, railroads are more expensive than pipelines. As more pipeline volume becomes available the oil transport will shift away from railroads.
Canada:
http://www.theglobeandmail.com/report-on-business/industry-news/energy-and-resources/pipelines-winning-as-crude-slump-hits-oil-by-rail/article24866894/
USA:
http://oilprice.com/Energy/Crude-Oil/Crude-By-Rail-Falling-Out-Of-Favor.html
Here is another example of problem bugs expanding their range into areas farther north as the weather warms up. Of course it is possible it will cool off again in the Northeast but I am not betting on it.
http://news.yahoo.com/destructive-southern-pine-beetle-appears-northeast-states-132959239.html
I can’t immediately recall any mention of any pestiferous insect being frozen out of its previous range , at least not over the last couple of decades in this country.
Does anybody know of any examples of this happening?
Probably humans, but they’re not insects.
Peak Fish?
If the US Treasury would have Mae West on the new ten dollar bill, it would become the most popular currency in use in the entire world. You couldn’t print enough of them. If there is one woman on this earth who deserves to be on a piece of printed paper and is legal tender, it would be Mae West.
Mae West was one of the gifted children in Turman’s famous study, that is, not at all dumb. She wrote a lot of her own one-liners, which are classics and to my generation, a great introduction to the power of the real female.
“Is that a pistol in yo’ pocket, honey, or are yew jest glad t’seeme?
Amorous suitor knocks on bedroom door, She opens window and invites a passing billy goat into her bed “Now yew jest lie theah, honey, and don’t say nuthin”. Crawls out window.
Judge to defiant madam May–“For that, I’m holdin” you in contempt of court.”
“Why judge, I was tryin’ m’ best t’hide it.”
And, of course, the standard issue navy life jacket was a mae west.
The hemlock wooly adelgid has been attacking and killing the beautiful hemlock forests of my region for a long time now. These great dim cathedrals with sun beams lacing through them stared raining needles as one walked through the forest. Now there are bands of dead trees on the mountains and some trails have had to be rerouted since the deadfall is just too great to clear. No sign anything is stopping them, not cold or heat or even beetles released for the purpose. Until now.
Silver flies seem to help.
http://www.natureworldnews.com/articles/15232/20150617/flies-offer-hope-for-dying-hemlock-forests.htm
The other great migration is ticks. Over the last two decades they have moved into high altitude regions near me that used to be free of the diseased pests. No place is safe now.
Kudzu invasion: from Wikipedia
“In the 135 years since its introduction, kudzu has spread over three million hectares (ha) of the southern United States, and continues to ‘consume’ the south at an estimated rate of 50,000 hectares (120,000 acres) per year, destroying power lines, buildings, and native vegetation in its path. ” https://en.wikipedia.org/wiki/Kudzu_in_the_United_States
And just when you thought Kudzu was bad, here comes the Kudzu bug.
The march of the kudzu bug:
http://www.vmnh.net/blog/details/id/64/the-march-of-the-kudzu-bug-
I can’t recall any bugs being driven out of its habitat by colder temperatures, but the world seems to have hit a fairly balmy temperature around the year 0 ce, cooled down to say 500 ce, warmed up to about 1000 ce, cooled down during the little ice age, and has been getting warmer for 200 years. I suspect there may have been some species migrations during those cold spells, but nobody was writing papers about the subject.
Of Major Interest. The Top 10 market share is growing.
http://www.visualcapitalist.com/the-worlds-10-biggest-oil-and-gas-companies/
Lots to Digest in this Graphic: Six out of 10 Majors show Increase production of “Oil” since Likely Peak Crude =2004/5 for Overall Increase of 13.6% (for the Majors). 500,000+ employees for PetroChina. Just think, Trainloads of Rice and Noodles to include into the EROI calculation.
Leaf or Morgan – Take your Pick.
Mike,
Above you questioned how many new shale wells could be drilled in the U.S.
Below is the table based on data from the EIA “Assumptions to the Annual Energy Outlook 2014”. They assume that 2.2 million new shale wells could be drilled in the U.S. I think this comprises at least several hundred thousand of shale/tight oil wells. A trillion dollar question is how many of those wells are economic at $60, $70 and $80 oil price, i.e. how many new wells can be drilled in sweet spots.
U.S. unproved technically recoverable tight/shale oil and gas resources by play (as of January 1, 2011)
Note that their assumptions on well spacing and average EURs are quite conservative
Actually I don’t question how many shale wells can be drilled in the US; we could drill them everywhere, cover the entire country with limestone pads. I question where the money is going to come from to do that.
You lost me at EIA and technically recoverable anyway. Thanks, though.
Mike
The assumptions are optimistic, in the sense they assume those wells will be drillable. In the future we may see 20 to 30 thousand wells producing geopressured brines. Those wells may be profitable if we can dump the water in the Gulf of Mexico.
Angelina Jolie: We’re living in an era of Mass Displacement:
http://bigstory.ap.org/article/d4ea5553897443ad999a0eabb4b84cf6/actress-angelina-jolie-visits-syrian-refugees-turkey-camp
A global surge in refugees leaves Europe struggling to cope (April, 2015):
http://www.washingtonpost.com/world/europe/new-migration-crisis-overwhelms-european-refugee-system/2015/04/21/3ab83470-e45c-11e4-ae0f-f8c46aa8c3a4_story.html
In some of these areas across the world on the front lines of massive refugee movements, I wonder how close some of these areas may be to civil order breaking down.
It’s not that bad. I was a refugee in an UN financed camp when I was 14 years old, and I spent decades helping people escape this or that dictatorship.
What makes Europe a juicy target is the benefits. They let you hang around, feed you, give you medical care. So of course Europe has been digging its own grave. I say it’s like a death wish. But I’m pretty sure the policy will change around here, simply because the people will elect nationalists who will implement a more sensible approach.
From what I see Africa is well on its way to be grossly overpopulated. Pope Francis just wrote a pretty dumb comment about the subject, but eventually reality will bite.
I have this as the opening quote to the Permaea manifesto:
“One manifestation of this ideal of refusing geopolitical borders in favour of older or no borders can be seen in Hogan’s repeated references to the idea of Pangaea, the theorized ‘original’ landmass that eventually broke apart into the continents… Through their reconnection with Native understandings of space and their successful creation of an effective coalition, Hogan’s characters claim citizenship as Native subjects who have a different but valid knowledge of the world and can forge the political power to help shape that world.” ~ Dreaming of Pangaea: Decolonizing Strategies in Linda Hogan’s Solar Storms
NYT article, with several maps:
http://www.nytimes.com/interactive/2015/06/21/world/map-flow-desperate-migration-refugee-crisis.html?_r=0
I wonder too.
This time it really is different in terms of refugees being willing to run the risks of emigration without permission to enter their chosen new home country. A couple of generations back the grandparents of the current generation of refugees would in many or most cases have hardly even known the name of any place worth migrating TO.
Nowadays even the most backward village probably has at least one battery powered television and a radio or two and at least a couple of residents who have either seen or know somebody who has seen the western world.
Business and life moves faster every generation. The people who traffic in people are just as quick to take advantage of modern transportation and communications as any other businessmen.
And the ” back home” situation is worse than ever , given that population has kept right on growing in the countries the refugees are from.
My guess is that the refugee situation is going to get progressively worse at an accelerating rate- and that within the lifetime of most of the current members of this forum refugees are going to be met at some borders with troops ordered to shoot first anybody crossing a no man’s land and ask questions later if there are any survivors.
My reasoning is simple and blunt. Times are most likely going to get progressively tougher for the lower classes and the middle class – and even the rich in some respects – just about everywhere. I am as soft hearted as the next old curmudgeon myself and could never turn away a small child personally.
But if the scenario is different – if I have neighbors and relatives who are near destitute -then naturally I am going to insist on looking after them FIRST. Charity begins at home. Security begins at home.
Really desperate people will resort to theft or just about any sort of illegal activity in order to survive. I don’t want to give up my Medicare and my SS etc or to have to start habitually going armed. Thankfully I don’t anticipate the refugee situation getting to be desperate in my part of the USA within my own remaining lifetime.
But things are already dicey for people living in some rural areas close to the southern border even here in the USA.
We have a lot of new Mexican citizens or wannabe citizens in my community already. Most of them are the salt of the earth and the sort of people who make great neighbors – not to mention formidable competitors in any small business.
But a few of them are the sort who when they are finally caught wind up pulling ten to twenty.I don’t think they are born bad . I have relatives who are no better behaved, and with a lot less excuse. They just come from places in Mexico where REAL violence is the day to day norm, places where society has already fallen apart. They don’t give a shit about driving on the wrong side of the road without a license or insurance or dealing in stolen goods. A knock down drag out fight is entertainment to this sort of young men. Shooting somebody over a point of honor is quite common.
( This kind of behavior was perfectly ordinary and unremarkable in this area sixty to a hundred years ago when there were NO Mexicans but only Scots Irish and other western European descended mountain hillbillies. It was still pretty common when I was a kid.I know a couple of dozen stories about knifings and shootings that were never investigated never mind prosecuted that I heard from my grandparents and parents generations. I know a some more from my own time but the people involved are all dead of old age now. IT IS ironic that for thirty or forty years now this area has had a relatively low crime rate but it has been creeping up recently. )
As things get progressively tougher in countries that are already in desperate straits, more and more of this uncivilized and un assimilate able type are going to show up in western Europe.
Some regulars here are probably going to flame me for saying these things but anybody who believes in economic and ecological collapse MUST realize that I am NOT talking right wing bullshit.
What are the politically active but relatively poor citizens of western European countries going to do when they see their own living standard falling in order to support large numbers of refugees?
Life IS a zero sum game under some circumstances.
My liberal acquaintances are almost exclusively insulated from any direct competition with poor immigrants legal or illegal given that they have good jobs requiring extensive training as well as extensive documentation. So naturally they can afford to be more generous in their opinions when it comes to dealing with refugees.
People like some of my middle aged cousins who lack a decent education and have problems with criminal histories for offenses ranging from smoking pot to armed robbery hate immigrants guts because every job landed by an immigrant is one job opportunity less for them – as they see things.
In the short term they see things accurately. Life is all about the short term when you are hard up.
So -the good citizens of the nearest small city where a few manufacturing companies still operate hate the guts of immigrants. When a few unskilled or semiskilled jobs open up the number of applicants is generally several multiples of the numbers of openings -BEFORE considering the immigrants who are willing to work for less and live three times as many in a house or apartment.
AND NO -I HAVE NOT FORGOTTEN that I am descended from immigrants myself. We live in a Darwinian world.
I am not passing judgement but rather trying to explain reality as I see it. The only reason my ancestors a few generations back did not murder the local Americans and take their land is that they got here a little too late to be involved . Earlier arrivals wiped out the local people a generation or two sooner. A few family members probably had a hand in the murder and dispossession of American Indians farther west. Some southerners went west after the Civil War and a few northern relatives were regulars in the UNION army which was involved in the forcing the American Indians onto reservations – the ones who survived .
Collapse is going to be a brutally darwinian process. Shooting people at borders is going to be only a small part of the overall violence involved. Troops are going to CROSS BORDERS and murder or enslave people in order to take their land and water and other resources.
Anybody who has trouble understanding this sort of thing either has no knowledge of history or else has no conception of what ecological and economic collapse REALLY mean.
Some news about global coal industry.
China’s coal production in January through May this year was down by 7.6% from the same period last year; China’s coal sales by volume was down by 8.8% from the same period last year.
In April/May, India’s coal imports surged by 9.6% from one year ago.
In global climate talks, Japan opposed eliminating fossil fuel subsidies due to its growing dependence on coal to replace nuclear power.
In January through May this year, China’s total electricity generation increased by only 0.2% from the same period last year; hydro electricity increased by 11.5%, and fossil fuels electricity was down by 3.1%.
In January through May, China built 32 GW of generating capacity, including 4 GW of hydro, 1 GW of nuclear, 4 GW of wind, 4 GW of solar, and 19 GW of fossil fuels power.
In January through May, China started the building of 23 GW of new generating capacity, including 17 GW of fossil fuels power, 1 GW of nuclear power, 5 GW of wind power.
In January through May, China invested 98 billion Yuan (6 Yuan = 1 US dollar) on generating capacity and 118 billion Yuan on electric grid.
The investment on generating capacity included 22 billion Yuan on hydro, 30 billion Yuan on fossil fuels power, 27 billion Yuan on wind, 16 billion Yuan on nuclear. Total non-fossil fuels investment accounted for 70% of the total investment on generating capacity.
Well, no one can say China isn’t serious about dealing with CO2 emissions, when 70% of it’s investment in generating capacity is non-fossil fuel.
Chinese coal consumption fell by 8.8% Year to Date? Wow.
So much for “There is no renewables revolution in China. Here are the numbers that show this”!
The fact that “In January through May this year, China’s total electricity generation increased by only 0.2% from the same period last year” while ” coal sales by volume was down by 8.8% from the same period last year”, suggests something is afoot!
That “something” could quite plausibly be a recession, or at least a sharp economic slowdown. It could also quite plausibly be bad data and a lot of under-reporting. BP have many times revised Chinas historical coal consumption up quite considerably.
I would caution against trying too hard to fit the data into a story that you badly want to believe.
If “Political Economist” is correct that China is spending 70% of it new generation capex on non-Fossil Fuels, that’s a very clear statement about China’s priorities.
You guys are really fooling yourself if you think china is doing this to cut CO2 or to decrease the use of fossil fuel. They are doing it because they are choking on their own smog. They are cutting coal consumption in hopes they can continue to breathe.
China Smog War Seen Dooming Coal on ‘Cheap But Dirty’ Purge
China is turning to alternative energy sources as it races to meet emissions targets and eradicate the smog that’s enveloped cities and become a major cause of social unrest. President Xi Jinping has vowed to punish “with an iron hand” those who destroy the environment and his government is abolishing outdated capacity in the most polluting industries while promoting the use of electric cars and solar rooftops.
Smog is causing social unrest, imagine that. And you guys thought they were doing it purely out of the goodness of their hearts.
In March of this year a Fire was lit at the municipal landfill for the city where I live. I noticed the smoke on the same evening as the story at the link and the following day the story in one of the local papers was Riverton dump fire spreads. After burning for 11 days the same paper ran the story Riverton Fire Update- Reduction in smoke levels evident. For the duration of that fire most of the city was blanketed in smoke so, based on that experience I cannot imagine what it is like to live with that all the time and I can understand social unrest as a consequence.
Be that as it may, since I will be the first to admit that this is “a story that” I “badly want to believe”, it isn’t all that important to me why the Chinese government is “promoting the use of electric cars and solar rooftops”. What is more important to me is that, if they didn’t think that these are practical alternatives, they would not be on the table.
One of the things I hope to see in my lifetime, is a reduction in the tendency for Homo Pyromanius (the fire crazy ape) to just burn shit. Below is a picture from the hills overlooking the city of Kingston with the plume of smoke from the fire in March.
edit: One might also ask why the Chinese have not opted for combined cycle gas turbines like US utilities have?
Why do you think China hasn’t adopted cycle gas turbines? In fact, China is using every tool available.
“Alstom’s world class gas turbine technology enters commercial operation in China.”
http://www.alstom.com/press-centre/2014/3/alstoms-world-class-gas-turbine-technology-enters-commercial-operation-in-china-/
Who said China hasn’t adopted cycle gas turbines?
“Political Economist” is talking about Fossil Fuels as a category, not coal.
The deniers have it tough these days.
If it’s not Peak Oil, then they have to contend with Global Warming, and if neither of those two, they have to defend stifling smog caused by coal combustion.
Getting off of FF is essentially killing 3 birds with one stone.
Who said anything about China “doing it purely out of the goodness of their hearts”??
Transitioning away from Fossil Fuels saves money, improves health, improves national security, etc., etc.
It’s simply enlightened self interest.
I’d say they are interested in cleaning up the air, energy security, and convincing the EU and USA they are serious about CO2 so those two will hand over their economic power to the people’s republic. Chinese are very smart.
I’d say they are interested in cleaning up the air, energy security, and convincing the EU and USA they are serious about CO2 so those two will hand over their economic power to the people’s republic. Chinese are very smart.
Companies have been handing over their economic power to China for decades. That’s nothing new.
How would “convincing the EU and USA they are serious about CO2″ help convince them to ” hand over their economic power to the people’s republic”?
“How would “convincing the EU and USA they are serious about CO2″ help convince them to ” hand over their economic power to the people’s republic”?”
The US and EU would be forced to de-industrialized. All energy intensive manufacturing will move to asia. Thus making the West completely depend on Asia for everything.
The US and the Soviet Union became the global superpowers after WW2 because they were the only industrialized nations that have any operating factories after WW2. Europe and Japan had their industry destroyed during the war.
Even if the US & EU replaced fossil fuel energy with renewables, it still not going to be cost completive with China’s dirty coal systems. China can simple undercut pricing of US/EU manufactures and drive them out of business.
You’re assuming that coal is cheaper. It’s not, at least in the U.S. New coal is substantially more expensive than wind.
Old, dirty coal is a little cheaper in the short run. Maybe. But China is getting rid of their old, dirty coal as fast as they can. They like to breathe, too.
If China stayed with old, dirty coal, how would they convince the EU and US they were serious about CO2??
Finally, you’re greatly over estimating the value of cheap energy. Japan after WW2 never had cheap energy – it never slowed them down.
China’s edge is cheap labor, not cheap energy.
Sorry, Nick Coal is definately much cheaper than Wind. China is also not getting rid of coal.
http://www.energytrendsinsider.com/2013/08/20/king-coal-gets-fatter-while-the-us-goes-on-a-diet/
US consumption of coal is falling because of regulations that make it expensive. On a energy basis and infrastructure cost Coal is much cheaper. Much of the coal that used to be consumed domestically for electricity & Industrial use, until very recently, had just been shipped overseas. Thus, little net change in reduction globally for US coal. The only reason why coal consumption is now dipping is because the global economy is tipping back into recession so demand is falling.
In the US, Wind has gotten substantially more expensive since 2012, as the tax incentives disappeared.
Boomer wrote:
“How would China becoming serious about reducing CO2 emissions encourage the West to send even more of their intensive manufacturing to China?”
Are you serious? Quite simply, they aren’t serious about cutting. The keep on postponing the date on cutting emissions. They are only stating they “plan” to cut back in order to avoid confrontation. Much as a Junkie hooked on heroin promises to stop using in two years. Its a classic delay tactic. Why do you believe anything that any politican says? I hear China is wants to sell you a bridge real cheap Boomer are you, go to buy it too? Pardon by English, but “Please Wake the F*** Up!”
“China agrees CO2 peak by 2030, US to cut emissions by quarter”
http://uk.reuters.com/article/2014/11/12/china-usa-climatechange-idUKL3N0T17FC20141112&rct=j&q=&esrc=s&sa=U&ei=w4SJVcvdC4Ts-AG3v7lo&ved=0CCIQFjAC&sig2=30hc09AZf3s_pB2UCNMF1Q&usg=AFQjCNF5RRvs1dgB68G_gMb8aUPXL0c6Yw
“According to a joint announcement by President Xi Jinping and U.S. counterpart Barack Obama in Beijing on Wednesday, China will aim to reach peak CO2 emissions by “around 2030″ and strive to achieve the target earlier, while the United States would slash emissions by 26 percent to 28 percent from the 2005 level.”
[Back in 2011 or 2012 China said they would peak in 2025. Now its 2030, in five more years it will be 2035]
Are you serious? Quite simply, they aren’t serious about cutting. The keep on postponing the date on cutting emissions. They are only stating they “plan” to cut back in order to avoid confrontation. Much as a Junkie hooked on heroin promises to stop using in two years. Its a classic delay tactic.
But your logic didn’t make sense. There’s no reason for us to send them more industrial jobs because they are cutting back on CO2 emissions or even because they say they are cutting back on emissions.
I don’t see how China getting more industrial jobs and CO2 emissions are linked.
Coal is definately much cheaper than Wind.
Very dirty coal is cheaper. But the US hasn’t been building very dirty coal plants for quite some time: we’d prefer not to have mercury in our fish, and sulfur raining on our forests.
New coal is more expensive than wind power. Wind power tied with natural gas as cheapest:
“U.S. average levelized costs (2013 $/MWh) for plants entering service in 20201”
Wind: 7.4 cents
Natural Gas: 7.3-7.5 cents
Conventional Coal: 9.5 cents per kWh
http://www.eia.gov/forecasts/aeo/electricity_generation.cfm
China is also not getting rid of coal.
That article by Robert Rapier is two years old – things have changed since then.
According to Political Economist, coal consumption fell by 8.8% in China, in the first 5 months year-to-date. And, it fell last year:
“For the first time this century China’s coal consumption has fallen, according to preliminary data from both the Chinese Coal Industry Association and the National Energy Administration.
…News of the coal fall represents a major step-change on two fronts: China’s war on air pollution, and global efforts to peak CO2 emissions.
China burns half of world’s coal and has been responsible for well over half of total CO2 growth globally for the past 10 years.
How did this momentous drop happen? There are six key reasons: 1) record increase in CO2-free power generation capacity and 2) better-than-usual operating conditions for hydropower, resulting in a very large increase in CO2-free power generation; 3) implementation of ambitious coal reduction targets in key economic regions as a part of air pollution action plans; 4) slower growth in heavy industry output, resulting in slower growth in power demand and direct coal demand; 5) ongoing improvements in energy efficiency; and 6) increase in the use of natural gas.
Only one of these six factors – high hydropower utilization rates – is a yearly fluctuation, the rest potentially reflecting long term structural shifts.”
http://theenergycollective.com/lauri-myllyvirta/2187741/it-s-official-china-s-coal-consumption-fell-2014
US consumption of coal is falling because of regulations that make it expensive.
No. Those regulations happened some time ago. Coal consumption is falling because it can’t compete with gas and windpower.
On the other hand….are you a big fan of coal-particulate-induced asthma?? Acid rain? Mercury in fish?
The US and EU would be forced to de-industrialized. All energy intensive manufacturing will move to asia. Thus making the West completely depend on Asia for everything.
How would China becoming serious about reducing CO2 emissions encourage the West to send even more of their intensive manufacturing to China?
When I first became aware of Peak Oil back in late 2007/early 2008, I watched a few of documentaries on line and lot of shorter videos on Youtube. Included in the videos I watched were:
An Inconvenient Truth
End of Suburbia
Crude: The Incredible Journey Of Oil
A Crude Awakening
Crude Impact
Oil Smoke and Mirrors
Having watched all the above, I was very depressed and close to a state of panic. I made some investments that have proved to be not so sound but, I still have the PV modules so all is not lost.
Time went by and I found and watched:
If The Oil Runs Out (BBC 2006)
This one was quite good and placing TS hitting TF in 2016. Prophetic? We’ll see. While Blind Spot was made in the meanwhile, it didn’t show up on-line untill March 2013.
Also Watched
World Without Oil: What If All The Oil Ran Out?
This National Geographic program was rather silly, with oil just disappearing over night. Really ridiculous that all the oil wells all over the world could just go to zero overnight. Worth watching just to see how unrealistic a scenario the producers could come up with.
I’ve spent most of my time today watching some new stuff.
Oil Apocalypse: Peak Oil – What If the Oil Runs Out?
Earth From Above: The End of Oil
Energy 2050 Life After the Oil Crash [2009] – Full Documentary
So what’s the point of this post? When I first became aware of Peak Oil, the world was absolutely unprepared. No EVs on the market with the first ones more than two years away. Solar PV made up 0.01% of the total electricity generated in the US in 2007, doubling to 0.02% in 2008 according to the table near the bottom of this Wikipedia page.. Yes folks, that was 0.01%, one hundredth of one percent and people were saying, “Solar will never work. Look it’s only contributing one hundredth of one percent to the national total!” It was only a little better for wind at 0.8% contribution.
In the intervening years, since 2007, a lot has happened. PV generating in Germany has grown from a little over 4 GW to a little over 38 GW and in the US solar (PV and Thermal) has grown from 0.83 GW to over 20 GW and is on track to produce over 1% of the US total in 2015. Wind contributed 4.4% to the total in 2014 and combined with solar and other non-hydro renewables, should exceed the contribution from conventional hydro (~7.5%) in 2015.
On the consumption, side LED lighting has improved considerably, to the point where, as any compact fluorescent lamps that I have fail, I am replacing the with LEDs. (Anybody in my neck of the woods who still uses incandescents, is either woefully ignorant or not paying for (stealing) their electricity.)
With sales staring in 2010, there are now over 300,000 series production, plug in electric vehicles roaming US streets. (see Cumulative US Plug-In Electric Vehicle Sales – Model By Model Breakdown With Market Share Data – December 2014) Year to date, almost 44,000 Plug in vehicles have been sold in the US and over 122,000 worldwide. Heavy duty, commercial vehicles and buses are not included in the above totals. In the bus category several major cities world wide are experimenting with battery powered buses that, did not exist back in 2007 and a certain Chinese manufacturer has thousands of orders for it’s battery electric buses, mainly from Chinese municipalities. Volvo is Introducing a new battery electric bus for trials in Gothenburg.
In my own neck of the woods, the relevant parties finally seem to be getting their act together, as it regards transitioning electricity generation from petroleum based fuels (bunker C and automotive diesel) to Natural Gas. Hydro capacity additions have been done, with feasibility studies having been done for more. Wind has had additions with more under construction as we speak. There now three high profile solar PV installations (2x100kW an a 1600kW) with approval finalized for a 20 MW utility scale plant to be connected to the national grid, hopefully before the end of this year. More and more PV panels are popping up on roofs little by little. In general, I get a sense of an increasing awareness that at some point there is going to be a significant change in how we get and use energy.
The point is, when I first became aware of Peak Oil, I thought we were screwed for certain! Now I’m not so sure. We’ve managed to kick the can down the road a little, thanks largely to the efforts of the oil guys. In the meantime, the renewables guys seem to be stepping up to the plate and at least one or two people in the automobile business seem keen to disrupt the status quo with battery electric vehicles, so much so that quite a few of the big, old school companies appear to be accelerating their EV research and planned new model introductions.
Am I bargaining here? You bet I am! Do I think we’re nearly out of the woods yet? Not by a long shot! If Peak Oil doesn’t do us in there are a lot of other limits to growth waiting in the wings!
Hope you all enjoyed your weekend!
If Peak Oil doesn’t do us in there are a lot of other limits to growth waiting in the wings!
Yeah, and how have the coral reefs been doing around Jamaica recently?
http://www.globalissues.org/article/173/coral-reefs
But according to Fernando worrying about an invasion of drones should be a much higher priority…
I like to read diversified material. I’m also quite familiar with reefs because I used to snorkel in Cuba before I was forced to leave the island when I was 14, and that led me to study and read tons of material about the oceans over the last 50 years.
Here’s an interesting article with information about reefs and how they are impacted by lower ph seawater
http://www.sciencedaily.com/releases/2015/06/150605182812.htm
Yes, it is an interesting paper, thanks for the link. I like to read diversified material myself. Especially about coral reefs since they are one of my favorite ecosystems.
The paper doesn’t exactly paint such a rosy picture as you seem to be implying and furthermore low pH levels are not the only stressor impacting coral reefs.
‘Our study revealed increased bioerosion to be the only consistent community response, as other signs of ecosystem health varied at different locations,’ Barkley says.
‘This is important because on coral reefs, the balance between calcium carbonate production and removal by bioerosion and dissolution is very tight,’ adds Cohen. ‘So even if rates of production are not affected by ocean acidification — as we see on Palau — an increase in bioerosion can shift reefs to a state of net calcium carbonate removal, threatening their survival.’
I get the impression that you really don’t understand complex systems such as coral reefs!
Hey Fred, To be honest I can’t really tell you anything useful about the reefs around Jamaica. The last time I went snorkeling was a couple of years ago when my sister and her family were on vacation from the UK. Otherwise I never go to the beach. I wasn’t impressed with my last experience, the water being somewhat rough and sort of murky as a result. The reef wasn’t teeming with life as I expected. Didn’t see any of the invasive Lion fish though.
As far as drones go, I’m waiting to be able to buy a drone that can autonomously go out and make video recordings of people stealing stuff of the homestead. As it is right now, even if my neighbors do witness theft, nobody wants to be a snitch and have to go to court to testify! My drones would only be armed with cameras though!
Thanks for some relief from the gloom here.
I look out the window and see a non-gloomy scene. People are putting up PV at a rate keeping the installers over-worked, they are getting together to buy used EV’s, and assure everyone gets a longer range thing any time they want.
The town has set targets for carbon reduction, and plans on how to do it. They even welcome my op-eds, which until recently seemed to have been ignored. I now get space for one bi-weekly.
And so on. And, the faith groups have had a big meeting to discuss the Pope’s words, and do something proper.
Here, hope. Not gloom. Does not at all reflect the stereotype usually portrayed here as typical man-on-street. Average sort of place, can’t be all that unique.
Don’t get your hopes up. We are in the process of inventing our replacements. I’m starting to get really worried about killer robots and things like that.
Elon Musk too! He is on record, not being a fan of AI. Something along the lines that, any fully competent AI will quickly figure out that we are the problem, a plague species in need of control, if you will. Combine that with Wacher’s (?) idea that the 1% no longer need most of the 99% for their well being and killer robots/drones might not be out of the question!
Killer Robots? Are you guys serious? And how can anyone mention killer robots and drones in the same sentence. They are not even remotely related. Drones are unmanned but completely remotely controlled by human beings. They don’t think for themselves.
Are you guys serious? Short answer.No.
On the other hand, when I think of a drone, I think of the little quad copters that the news media have started using to get aerial footage. They are becoming less expensive and more capable. Autonomous capabilities are being added to the point where, I envisage that one will be able to use mapping software to tell the drone where you want it to go and it will go there by itself, maintaining a safe height and avoiding obstacles like, trees, buildings and power lines. Most of these quad copters will return to base autonomously if they detect that their state of charge is approaching the minimum level to reach back to base safely.
With a camera on board it should be quite possible to engineer an autonomous, remote surveillance system. Monitor and record activity at a facility, without any human being present. If such systems already exist, they are probably quite expensive. If not, they will be available within the next couple of years.
They are not even remotely related.
Take a Predator drone, add in sensing systems and a computer only a little more complicated than a Google car and -voila!- Killer Robot.
The computer stuff is not that big leap from current technology. The Predator drone and its cousins are an incremental step on the path to killer robots.
-Lloyd
Ok, so take the killer robot’s head and place it inside the drone. That yields a killer drone.
Hey Wimbi, Don’t know if you got a chance to view the last two videos I linked to. The second to last one, produced by a French outfit with a considerable amount of the narrative in French with English subtitles, went back and forth between the issue of Peak Oil and what actions are being taken in response. All very much stuff you can relate to. The last one spends less than four and a half minutes covering Peak Oil. The next forty minutes covers responses to Peak Oil including all the usual suspects, including something I credit you with making me recognize, the idea of generating electricity, very efficiently, using modern biomass technology. This idea appeals to me, since a lot of stuff is burnt around here to no good effect. (See my post further up about a fire at the local municipal landfill).
Which reminds me, I need to get out and go buy a 55 gallon steel drum to make myself a retort kiln, so I can use the abundant, fast growing biomass at the homestead to make charcoal and bio-char.
Thanks for the heads-up on the video. I spend little time here, and like to skim written material, but videos are harder to skim, so I tend to avoid them. I will go back and see what they say.
My own back-yard pyrolyzer has got me excited, since, obviously, it is entirely omnivorous and will take any plant material whatsoever and turn it into electricity via any engine-generator to back up my PV in cloudy periods. That makes me entirely ff-free, at least in my house.
In fact, carbon-negative.
It works ok right now, and I am making it better daily- lotsa fun.
Shale CEO’s hitting the airwaves in support of lifting the oil export ban.
Not sure how much that would help them, but they sure seem to think it would. Brent has typically traded higher than WTI.
I suppose US exports gasoline and other products and is trying to get set up to export gas.
Harold Hamm’s OpEd in the WSJ:
America’s Self-Punishing Oil Export Ban
More than 126,000 workers have lost their jobs, and that will double if the ban isn’t lifted.
http://www.wsj.com/articles/americas-self-punishing-oil-export-ban-1434922352
Excerpt (emphasis added):
They are hitting the allow Iran to export oil, but not US producers, argument hard.
My three comments following the OpEd:
#1:
I don’t have any problem with lifting the export ban, but some context is in order. The US remains a large net oil importer. Based on most recent four week running average data, US refineries were dependent on net crude oil imports for 40% of the Crude + Condensate (C+C) processed daily in US refineries.
Globally, we have seen a post-2005 decline in what I define as Global Net Exports of oil (GNE*), with the developing countries, led by China & India, so far consuming an increasing share of a post-2005 declining volume of GNE. The volume of GNE available to importers other than China & India fell from 41 MMBPD (million barrels per day) in 2005 to 34 MMBPD in 2013 (and preliminary 2014 data suggest another decline).
*GNE = Combined net exports from top 33 net exporters in 2005 (EIA data, total petroleum liquids + other liquids)
#2:
EIA data show that virtually all of the post-2011 increase in US Crude + Condensate (C+C) production has been 40+ API gravity C+C, i.e., very light crude and condensate. As API gravity exceeds 40, the distillate yield begins to drop tremendously. And I’m not sure how much demand there may be globally for very light crude and condensate, because of the very limited distillate yield.
In any case, EIA and BP data suggest that actual global crude oil production (45 API gravity and lower crude oil) probably peaked in 2005. From 2005 to 2014, global gas production increased by 24%, global natural gas liquids (NGL) production increased by 27%, but global C+C production only increased by 5%.
Condensate, like NGL, is a byproduct of natural gas production. The only reasonable inference one can draw from the foregoing is that global crude oil production probably peaked in 2005, while global gas production and associated liquids (condensate & NGL) have so far continued to increase.
#3:
An excerpt from the OpEd by Mr. Hamm (emphasis added):
“If the ban is not lifted, prices will likely shoot up as a short-supplied market is created. Manufacturing will slow down, America will again become dependent on foreign oil, and our allies will be forced to get supplies from Russia and Iran.”
The clear implication is that the US is not currently dependent on foreign oil and that unless the law is changed, our allies will be forced to get oil from Russia and Iran, instead of the US.
As I previously noted, US refineries, based on most recent four week running average EIA data, are dependent on net crude oil imports for 40% of the crude + condensate processed daily in US refineries.
From a technical point of view the trick is to count oil component molecules. We probably have too much light stuff and are missing the middle and heavy stuff. An export ban is sort of stupid. But the USA government isn’t firing on all cylinders.
Molecules 🙂 well yes of course. Then you stop drilling this unwanted molecules 🙂
Fern, the guy is saying: “Please somebody subsidize me so I can drill my planned qadrizilillion shale wells”. That is all he is saying.
Selling oil abroad doesn’t imply receiving a subsidy. The word subsidy seems to be thrown around quite carelessly.
well conventional producers are subsidizing shale producer at this moment. shale are freeloaders. Didn’t you tell the Greeks to pay their debt & bills first?
That’s not a subsidy. You are misusing the word.
The historical population of North Dakota is a real study in migration and industrialization. First there is a tremendous rise as migration of Europeans take advantage of the fresh, fertile soils for farming and then the opening of railroads. There were 2405 residents in 1870 which rose to 319,146 by 1900. The graph below takes it from there. The peak was hit about 1930 at 680,845. Population fell, for weather and economic reasons. Although North Dakota started as a primarily agriculture economy, now only about 10 percent of it’s population works in agriculture. The mechanization of agriculture helped keep the population stable until lately. Of course the obvious influx causing the sharp rise lately is the oil industry. This sharp rise is mimicking the 19th century rise, at least in rate. Estimates indicate a 2014 population of 739,482 with a 9.9 percent increase since 2010.
I wonder how long it will be before the boom fades and population descends again. Maybe it is already falling.
The graph disappeared when I made a small edit (period to comma). So here it is.
Images don’t initially appear on the edited comment, but they are still there.
Thanks, figured that one out already.
And then it magically reappeared.
In the future after editing just refresh the page and your graphic will reload, just a glitch in the comment editor.
As stated above, I figured it out very quickly.
[…] initially pointed out by Peakoilbarrel.com in a recent article, discrepancies between actual data for oil production in Texas vs. what the EIA claims are so stark […]
[…] initially pointed out by Peakoilbarrel.com in a recent article, discrepancies between actual data for oil production in Texas vs. what the EIA claims are so stark […]