GoM Reserve Revisions for 2019

A Guest Post by George Kaplan

Overview

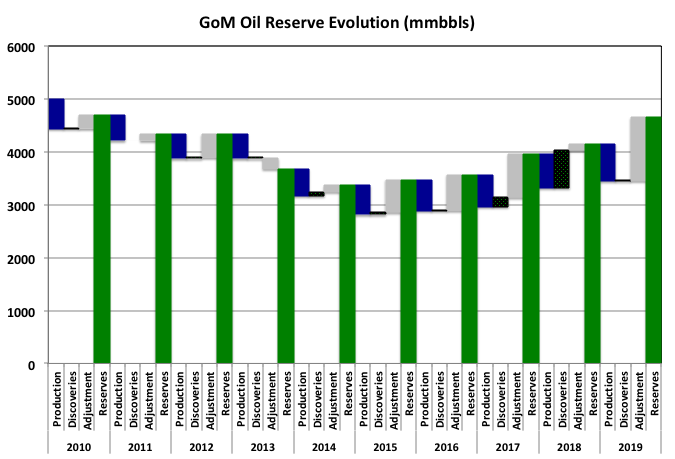
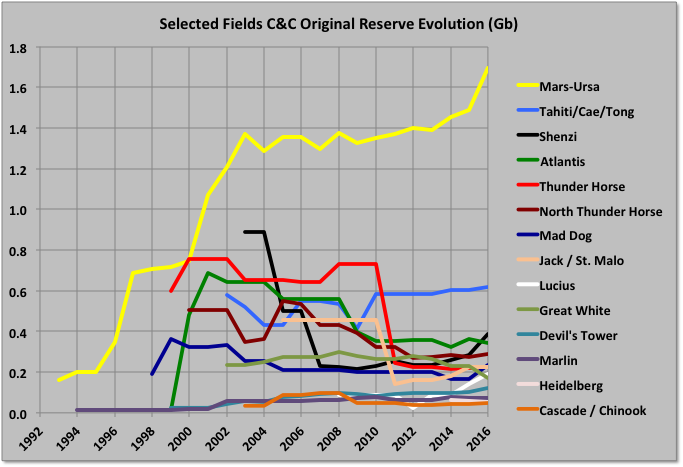
For 2019 BOEM showed a large increase in remaining reserves of 1.3Gboe,  91% of it oil, from newly discovered oil with Appomattox/Vicksburg and Vito the largest contributors at over 400mmboe each, followed by Buckskin and Kaikias, which are fairly large multi-well tie-backs, and smaller, one or two well  tie-backs of Blue Wing Olive, Constellation, Claibourne, Red Zinger and Stonefly. These discoveries were made with exploration wells between 2006 and 2016 but were only counted as reserves once firm development plans were put in place. Even given this the year in which BOEM includes the reserves is rather opaque and idiosyncratic, for example some of theses fields started production before 2018, and some developments, notably Kings Quay, are more advanced than Vito but are not included. 

Other additions came from revisions to Thunder Horse, Atlantis, Mars-Ursa and Jack/St. Malo, which had major brownfield developments. The fields were not all added as discoveries or adjustments for 2019, but were spread over 2016 to 2019. Some other discoveries under development, such as Anchor, Whale and Ballymore, or in pre-FID studies, such as North Platte and Fort Sumter, will likewise be added against their discovery years as their estimates are finalised. Several of these projects are among the first to use new 20ksi wellhead equipment and it will be interesting to see what teething troubles are experienced.

Read More

US January Oil Production Continues Slow Slide

A post by Ovi at peakoilbarrel.

All of the oil (C + C) production data for the US state charts comes from the EIAʼs Petroleum Supply monthly PSM. After the production charts, an analysis of three EIA monthly reports that project future US production is provided. The charts below are updated to January 2020 for the 10 largest US oil producing states.

Note: This post is not an April Fool’s joke. I really am publishing the latest official EIA information available, January production in April.

Read More

GoM Reserves and Production Update, 1H2018

A Guest Post by George Kaplan

Crude and Condensate Reserves

chart/

BOEM remaining C&C reserve estimates for GoM increased by 649 mmbbls for 2016 (i.e. to 31st December 2016). This was 112% reserve replacement and followed a similar growth of 618 mmbbls (111% reserve replacement) for 2015. The BOEM reserve calculation method appears to give highly conservative estimates. The increasing reserves followed several years, from 2006, of less than 100% reserve replacement, and actually negative numbers in 2006 and 2008. Current total original reserves (i.e. ultimate recovery) are a new high beating 2006 values, though deep water numbers are still below that year with the main growth appearing to be coming from: 1) older fields that were downgraded because of changes in SPE rules in 2007 (i.e. that reserves could only be booked if there were clear plans for their development within five years); and 2) newer discoveries, mostly smaller fields that are developed through tie-backs to existing hubs. These newer fields often do not get shown as new discoveries because BOEM records production and reserves against leases and each lease is recorded against a single field, even if there are deposits of different depth, age, geology and significant spacial separation within in it.

Current oil reserves are 3.569 Gb, which is 15% of the estimated original reserve (aka ultimate recovery). BOEM give the reserves as 2P (i.e. proven and probable) but they look very conservative and are actually lower than the EIA numbers, shown below, given for proven only and based on the operators own numbers, although the two are converging. The historical reserve histories look closer to how 1P (proven) numbers often appear, for example with some fields maintaining near constant R/P numbers, some showing large early drops that then come back over time, and some numbers being suspiciously low on fields obviously not near run out production rates (e.g. Mad Dog and Son of Bluto 2). I think the reserve calculations methods are fairly basic, given the amount of work required they couldn’t be much else, and use volumetric methods (i.e. reservoir area, depth, porosity, recovery factor) and previous decline data (I don’t now if the operators give them additional data such as well pressures).

chart/

Reserve Evolution History

The Mars-Ursa fields have big original reserves, which have shown continuous growth. Other, large deep-water fields have mostly shown negative revisions from original reserve estimates, some quite large, though some of that is due to development timing (e.g. Mad Dog II reserves, when added, will likely recover all the earlier drop, and more). Shenzi has grown recently, and Atlantis will next year, both from new near field discoveries.

chart/
Read More