Seems we don’t know what future completion rates will be in the Permian basin or anywhere. There are many different opinions on whether the completion rate might increase, decrease or stay the same. In my view, the conservative assumption is to assume they will not go up or down, but that the completion rate will remain constant. I have created three different scenarios: in the first, the completion rate increases; in the second, the completion rate decreases; the third scenario has a constant completion rate.
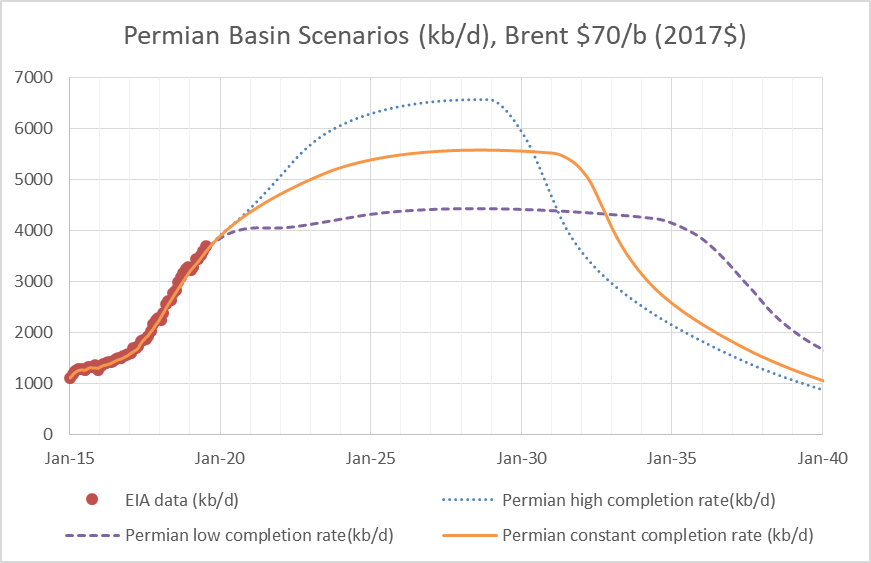
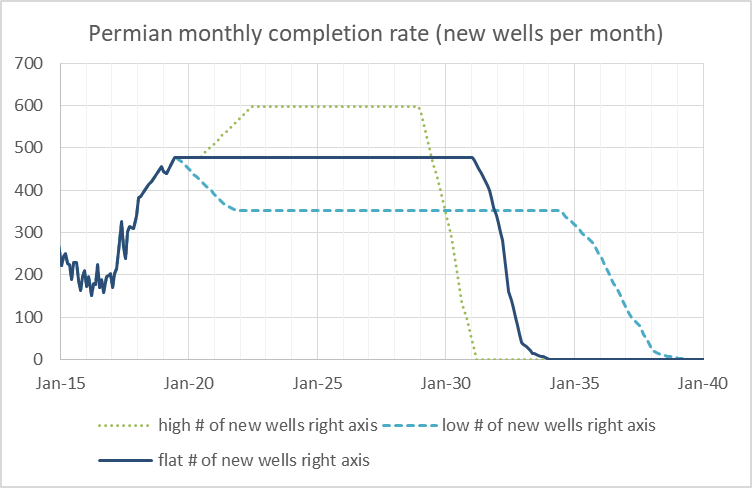
For all three scenarios the URR is about 37 Gb which is about 50% of the USGS mean TRR estimate for the Permian basin. I assume the price of Brent oil remains $70/b in 2017$ or less from 2020 to 2080 in these scenarios, the price rises from $55/b in mid 2019 to $70/b in mid 2020. The low completion rate scenario peaks in 2028 at 4400 kb/d, the constant completion rate scenario peaks at 5600 kb/d in 2028 at 5600 kb/d, and the high completion rate scenario peaks at 6600 kb/d in 2028. I expect reality will fall somewhere between the high and low scenarios. The completion rates are shown in the next chart, clearly in the past the completion rate was highly variable, this will continue in the future in some unpredictable way. Simply imagine random squiggles around these stylized scenarios to get an idea what the future might bring.
Nice work Dennis.
This is a response from an oil geologist named “Dave” on a climate change blog, after I said that no one understands the Red Queen effect:
The response is puzzling because not everyone is an oil professional and that’s essentially why we are doing what we are doing — to get the word out.
He is a firm believer in global warming but won’t let go of the fact that depletion is an important consideration. They essentially don’t want to listen to a trajectory that might be more complicated than anticipated.
https://andthentheresphysics.wordpress.com/2019/08/23/high-emission-scenarios
Paul,
Based on a quick reading of the comments, it seems Dave the Geologist doesn’t think peak fossil fuels will be any time soon. I think 2023 to 2027 for oil is a pretty good guess and perhaps 2030-2040 for all fossil fuel, we could do better than this if EVs, wind and solar grow rapidly, but that’s probably a pipe dream.
Dennis, It’s hard to get people with climate change tunnel-vision to understand the nuances. That’s why there should be emphasis on the production levels and frequent forecasting — otherwise you get Trump telling lies at the G7 and all anybody can respond with is “… but climate change !”
https://twitter.com/resistbot/status/1166023552866426881
Odds are that ANWR is a bust, and Trump spreading the myth of Saudi America is just that.
I generally agree with this post, except it doesn’t quite apply to the stripper wells, if one buys them when they are strippers. Maybe bought 50 BOPD in 2000 and without any new wells might still be at 35-38 BOPD 19 years later, especially with some workovers.
The price falling by 1/2 or 2/3 still applies though.
An individual selling 10K BO per year saw a drop in gross income from $900,000 in 2014 to $370,000 in 2016. Assuming $35 “all in” expenses, the net fell from $550K to $20K.
shallow sand,
I think the comment Paul refers to is talking about a new well. I would think if you drilled a new conventional well the first few years would see a steep drop in output. The old wells will be on the flat part of the hyperbolic where exponential decline is probably a decent approximation with maybe 4% to 8% annual decline rates.
Dennis.
It is true that conventional wells also tend to have a high IP, and then drop fast. At least a decent amount. But not all do.
My point is that there seems to be an idea among many that we should start shutting in fields, because they have passed being economically useful. I do not agree, of course and have made that point with you before, using our field as an example.
I’ll say it again. We operate in a shallow conventional field that has a small footprint, and very few wells are added each year. Methane emissions are minimal. No gas is being flared. Water is reinjected into the producing formation at low pressure.
The field turned 114 recently. There are many wells around that age still economically producing oil. Decline varies, but is generally low, especially for wells that are 20+ years old.
Our field produced over one million barrels per year for almost 100 years before falling below that amount. Adding no new wells, fieldwide decline has been running about 3 %. During 2010-15, production slightly increased each year due to more wells being added. Rationally, after early 2015, new wells all but stopped being added. We were adding 2-4 new wells a year during the high price era and slightly increasing our production. Considering that was being added to over 200 producing wells, not a lot of CAPEX to do that.
Our small field is good for over 100 jobs. Rarely does anyone make under $15 an hour, most make over $20 an hour. Few have any college education. A kid just out of high school might start at less, but if he learns and does his job he or she will make over $40K per year quickly.
There are many service companies. All are small businesses, like the producers.
Policy makers may think there is no reason to keep our field operating. I do not agree. It is no flash in the pan. And there are thousands like it across the lower 48 states.
I am certain there are many reading this blog who disagree and think our field should start being plugged out tomorrow. So I at least feel it worthy to argue the stripper well case. So many small businesses that few have any idea of. The back hoe operator, tank truck company, electrician, service rig company, acid company, accountant, insurance agent, tubing testers, supply store, etc. You should see our accounts payable, the many varied businesses our industry supports. I might add, in rural America that isn’t having the economic success of the cities.
This is the way I think of the physical process of unconventional fracking. When a fracking event happens, the number of new flow pathways created can just as likely lead the oil further away from the source as toward the source. This is the definition of diffusional random walk and explains why there is an initial strong flow followed by a transient steep decline and long tail. In contrast, in a conventional well, the flow pathway is set from the start and any long-term stripper-like flow is allowed for a diffusional flow only into the collection area.
There is a strong difference between conventional flow and fracked flow and there should be a way to explain it as a physical process, otherwise it’s just a case of reliance on fortuity.
Mr. Pukite
From the 2016 Science Direct article (link sciencedirect.com/science/article/pii/s2096249517300273)
“Viscuous flow is present, for example, when the architecture of the rock is dominated by mega pore throat, macro pore throat, meso pore throat, and sometimes micro pore throat.
Diffusion flow on the other hand is observed at the nano pore throat level.”
There are significant differences between viscuous and diffusion dominated flow. (This previous sentence is a quote from one of the numerous articles I just speed read through. Cannot source it atm).
In a grossly simplistic description, a circular, hydrocarbon bearing pore may have a throat between the 1 o’clock and 5 o’clock position, thus providing large exposure to the newly opened pathways via frac’ing.
A long, French bread shaped pore with pinprick throats/openings at one end (relative to the newly created pathway) would be another, quite different example.
(Petroleum engineers would understandably spit their beers out laughing at these descriptions).
There are numerous conversations, debates, arguments/papers ongoing in this arena.
Much attention continues to be placed on the build up of the larger asphaltene molecules blocking these tiny throats … especially as the pressure drawdown promotes phase separation.
Still early stages in this unconventional field.
Coffeeguyzzzzzz,
Much too limited a view of what diffusion entails. Diffusion is a model of random walk, and that random walk could be composed of random pathways that extend in all directions.
The process of fracking is nowhere near controlled and so the pathways created by a fracking event will radiate in all directions, creating multiple pathways for the oil to flow. Some of the oil will flow in a direction whereby it will be collected while some will flow in deeper directions. Eventually, some of that oil going in the wrong direction may circle back and get collected.
This is not the same as molecular diffusion which does indeed happen on a nano-scale dimension, but the math happens to be the same.
Mr. Pukite
There is no way that I would attempt to engage in a high level discussuion of the physics involved in hydraulic fracturing, but I would take exception to your statement starting with “The process of fracking (sp) is nowhere near controlled …”.
In fact, several prominent factors are long recognized and continue to be addressed by a wide array of tools, tactics, and procedures.
As there is an upwardly preferential direction towards which the pressurized frac fluid will flow, identifying the optimal landing point is a first order of business.
(The “oreo” type situation of the 3 Bakken benches has greatly aided in controlling the vertical propagation of Bakken fracs).
The flowing into natural fissures and larger, induced fractures has been addressed with high success using degradable diverting agents – both near wellbore and far field – so as to help maintain an ever expanding “pressure bubble” within which a MUCH higher volume of rock is stimulated.
Real time monitoring, varying pump pressures and volumes, employing micro proppants are exposing significantly higher percentsges of the matrix to the wellbore.
Stress shadowing is another factor in steering a frac.
That is, frac’d stages towards the toe impact newer stage fracs as the matrix is now pressurized. Effectively avoiding interference between stages is one more aspect engineers face as they control the geometry of frac propagation.
Recently, the emphasis on identifying somewhat homogeneous rock vis a vis pressure needed to frac is leading to stage placement where pressures are able to be kept within ~500 psi range without major breakthrough.
The implications of this last are profound as well as far reaching for several reasons.
Some consequences – not all – are the growing abilities to propagate a 1,500/2,000 psi ever expanding pressure bubble out 500 feet each side laterally from the wellbore.
Having the ability to “control the frac” that distance, while simultaneously obtaining much higher hydrocarbon contact, is a reason that both Whiting and now EQT are planning on increasing the distance between wellbores … essentially recovering more gas/oil while needing less hardware.
On a somewhat related note, the test EOR project in the Bakken by Liberty Resources is bringing to the fore enormous attention on the particulars of rich gas impact on existing fractures, underground movement of material in producing areas, and – coming back full circle to your comment regarding controlling fracks (sp), engaging in precisely detailed/monitored activities in areas that have already been fractured.
Without the ability to effectively control frac’ing, this past decade of multi billion barrel/multi Trillion cubic feet of US hydrocarbon production would not have been possible.
If fracking was well controlled, it wouldn’t be setting off earthquakes.
QED
As to the rest of your comments, easy to deal with
Shallow sand,
I am not one who advocates for shutting an oil field that is economically viable. Nor do I think we should get into the business of subsidizing oil producers in rural areas (my understanding is that there are quite a few subsidies available to farmers, perhaps only the bigger farmers, it is not an area I am familiar with).
For you personally, at what price for oil do your wells become unprofitable? Some have suggested OPEC/Russia can be profitable at oil prices as low as $40/b (2019$). In the past you have suggested $50 to $60/bo works for you (I think that was 2016 or 2017), don’t know if costs have changed so that that number has changed.
Another thing on conventional wells older than 3 years, what would you guess the average annual decline rate is? For example if you have 100 wells that you are operating (and all of them are at least 3 years old) and you just take the total monthly output of your 100 wells (or whatever the actual number is), take the natural log and then run a trendline through that data set you should get a slope which would be the decline rate (use years on the horizontal axis). I am guessing it would be maybe 4 to 8% annual decline rate, perhaps lower, but you no doubt know.
I ask because I try to estimate the decline for the vertical wells in the Permian basin, but have no actual data, your decline rate would be used as a proxy for all the vertical Permian basin tight oil wells.
Currently I am assuming a decline rate from all vertical producing tight oil wells in the Permian basin of 24% per year, which is likely too high.
Dennis:
I am not advocating a subsidy for upstream oil and gas. Percentage depletion applies to other mineral deposits, and is limited to small producers only with regard to oil and gas. It has been on the books for decades. It is not a direct payment like farm payments, but is a deduction against taxable income.
As to farmers, they are not limited to big farmers. Actually, this year if an individual’s AGI is over $900,000, disqualification for farm subsidies occurs. I am sure it is more complicated than that, but there is a question on the farm program application asking if one’s income is over $900K or not.
As to an annual decline, I have shared some data with you in the past, and it is tough for me to make a good stab at decline rates for conventional wells, because they vary, even within the same field and in the same geological formation. Also, waterflood patterns change, and we see wells that increase, and wells that decrease, based on changes in the waterflood. Some of these changes are easily explained (new or reactivating a water injection well) and some are not easily explained.
Here is another anecdotal example. Operate a three well lease, two producing wells, one injection well. Injection well developed a casing hole and had to be plugged. Converted on producing well to injection. Lease production increased from just 3/4 barrel per day from two wells to 1.4 barrels per day from the one well, with the former producing well now serving as injection well. This production has held steady for over two years at 1.4 barrels per day.
Of course, LOE is also all over the board. But we did really well with an average WTI price of $65 in 2018. Not doing as well with prices about $10 below that, because the $10 is all pre-income tax profit.
Conventional fields vary too much, even lease to lease, for me to give you any accurate information. I had thought about trying to put together data on new wells drilled in our field 2005-14, but even that was going to be more than I could handle.
I would say 4-8% is not a bad guess. In our field I would guess 3% for wells that are more than a few (10?) years old.
Thanks.
I was not looking for individual well data just total yearly oil output for all your wells from say 2005 to 2015.
Figured you might have such data. The 3% helps. For a fracked vertical well would you expect a higher decline rate than 3%?
Dennis.
I will email you some field wide info.
Also, we frac wells. However, the magnitude is tiny.
For example, I have read Permian Wolfcamp average sand usage per well is 13 million pounds, over 300 semi trucks full. Water is about 500,000 barrels.
I looked up a well we drilled in 2012. 5,500 pounds of sand. 500 gallons of water/15 % acid.
Just no comparison at all. This is why I hope the politicians wanting to ban fracking will take into account the difference between shale and conventional.
shallow sand,
I doubt fracking or conventional output of oil will be curtailed by anything except profitability.
Shallow sand
Do you see any significant difference in decline rate for fracked wells compared to wells that are not fracked? Mostly in the tail after 5 years of output.
Your best work! It’s constant, long term. Majors have made their desires known. Their production will eventually match their downstream increases. Some will continue on, the rest, who knows. It’s flat, I don’t see it decreasing. Wow! Middle is exactly as I was thinking.
Flat for a multitude of fundamentals. Water, employees, capital, roads, schools, ad naseum. Oil price is no longer the driving force. Unless, the idiots keep it at $55, then your lower scenario is more than possible. But, I hardly see that as possible, due to simple supply/demand pricing for the next barrel.
If we pick the second scenario, when do you see peak oil?? Keep in mind, other plays will not fare as well as the Permian. Ah, never mind that question, we are in a plateau, no matter what the year. Demand will never be less than supply. I call peak demand, whenever is peak oil, which can’t be too far away.
Since I’ve been posting on this board, I’ve eaten a lot of crow, and have learned from everyone. Thanks to everyone for putting up with me.
Good lord! Has anyone considered what this could do do the demo party at Nov 2019? Every one of the Dems want to bury oil. Ok. Shit. Four more years with the clown. If you can continue putting gas in your F150 is going to be the decisive vote. As gasoline prices by then, will be an eye opener. The basic car owner does not have the luxury of financing a Tesla Model three. They tote the note, or a little better for a 4K used car. Been in that business for ten years, been there, done that. A 650 financing score is NOT average.
The inadequacies of EIA will obviously benefit the re-election of the clown.
Thanks GuyM.
Essentially it is what you have been saying for a while, which I mostly agree with, just a picture to go with the words. Glad that not everyone thinks the “constant completion rate” scenario is wildly optimistic. I would agree the high completion rate scenario is optimistic and would deem the low completion rate scenario as pessimistic, but any of the three scenarios is possible, my guess is about 2 in 3 odds the output will fall between the high and low completion rate scenarios.
If gas prices are substantially higher a year from now than they are today, the electorate will blame the party in power. They always do. That is as deep as their analysis goes. And there would be plenty of justification for it. More than enough to muddy waters with Ding bat’s foreign policy craziness, the scraping of fuel efficiency targets. Of course the R’s will try to blame green policies. But it will ring hollow because everyone knows that for the last four years they have been dismantling federal green policies at a furious pace. If the result is energy insecurity it will be easy to make the counter argument that it was the wrong way to go.
“If you can continue putting gas in your F150 is going to be the decisive vote.”–GuyM
“If gas prices are substantially higher a year from now than they are today, the electorate will blame the party in power. They always do. That is as deep as their analysis goes.”–SW
This two comments are nauseatingly correct assessments of the current hideous state of US politics.
“If gas prices are substantially higher a year from now than they are today, the electorate will blame the party in power. They always do. That is as deep as their analysis goes. . ”
“But it will ring hollow because everyone knows that for the last four years they have been dismantling federal green policies at a furious pace.”
Right up top, off by about eighty percent of the voting public, maybe ninety percent, next paragraph down.
Hardly anybody except hard core environmentalists and people such as the handful that hang out on energy sites such as this one knows shit from apple butter about energy and energy policies, etc.
“Hardly anybody except hard core environmentalists and people such as the handful that hang out on energy sites such as this one knows shit from apple butter about energy and energy policies, etc.”
Exactly. But they do know what they have been told by The Donald at the signing statements for his Presidential Orders. Undoing all these pesky regulations and doing all this environmental damage was supposed to have a pay-off. We were supposed to swallow it because in the end we would be better off. If the result ends up that we have trashed the environment for gas lines or $5 gas, regardless of the ignorance, there is going to be hell to pay and I don’t think it is the party out of power that is going to suffer the consequences.
On peak oil, for the US I see 2025 for the middle scenario (I have presented that “flat completion scenario in the past.) World peak about the same (perhaps a year later), depends on the price of oil, wars, and a bunch of factors I haven’t thought of, probability is 1/infinity that I will be correct.
An example of a constant completion scenario with random fluctuations in completion rate added to model.
There are an infinite number of possible variations.
second example
Dennis
How much production is added in the second month, peak production month of the well, in your constant completions model. I am guessing around 375 kb/d/mth.
Ovi,
First month is 342 b/d, second month is 677 b/d. So in second month the new wells from the previous month add an extra 677 minus 342 or 335 b/d.
well profile at link below for Permian basin 2017-2023 as in my model.
https://drive.google.com/file/d/1PQCSsF2qMpi4o62eexHbwgw2woFsBB_K/view?usp=sharing
Dennis
If in the second month, the new well from the previous month adds 677 b/d and the new well in the second month adds 342, isn’t the combined output in the second month 342 + 677 =1019 b/d.
Ovi
We are looking for the incremental increase in the most recent month. Probably simplest to just use the maximum at 677 if you aren’t seeing the incremental increase. They are roughly equal in any case.
How much extra output do wells from last month contribute over their first month of output.
Indian oil consumption growth: Chief honcho of state oil refinery company says numbers to date (late June this year) suggest consumption growth 4.5% with gasoline and jet fuel increasing 8% and diesel at 3%. LPG up 14%.
He says there’s uncertainty because there was an election in July and it was expected there would be frantic travel by political parties, but how much he could not know. He called his 4.5% number conservative.
Last year’s consumption growth was 5.9%.
It’s pretty clear that despite talk of India weaker economy, growth isn’t going to stop. Population growth rate is over 1%, and their life expectancy is an astonishing 68.5 yrs. As their oil consumption elevates their society further one could expect increases in that 68.5 number, which will increase population (and oil consumption) further.
Along these lines, India electrical generation capacity has increased from about 100,000 GWh in 2015 to 125,000 Gwh in 2019. No sign of a dropoff in capacity addition.
Plenty of demand growth for oil, coal, and nat gas.
https://indiapowerreview.com/indian-coal-production-dispatch-stocks-consumption-july-2019-update/
India is the #3 largest oil consumer in the world and grows north of 5%/yr. Total oil burn presently is about 5.3 mbpd.
Japan distant 4th at 3.854 mbpd and falling. Why? Population is falling. -0.7%/yr.
Top 3 consumers are 41% of the world’s total burn.
The USA supported supplied most of the oil used by the Allies as well as our own in WW, less than five million barrels a day toward the end of the war.
Now one country up until recently thought of as a third world backwater is using over five million barrels. That’s the sort of information that makes an impression on right wing rednecks, and even causes them to stop and think for a minute that maybe someday we really will run out of oil.
But ONLY for a minute!
India will be the largest country in the world by 2027, according to current projections.
There are 164 countries that consume more oil/capita than India.
India is growing at over 5%/yr and has done so for a long time.
They are very dysfunctional, but have tremendous momentum.
For a short time only, if one is paying attention.
Not even remotely survivable.
Iran consumption is circa 2mbd. Iran just sold 1 mbd to China in July. There was an article on oilprice.com which has been just taken off the portal, here URL from the browser’s history (have read today):
https://oilprice.com/Latest-Energy-News/World-News/China-Imports-Close-To-1-Million-Bpd-Of-Iranian-Crude-In-July.html
So sanctions took off no more than 1mbd off the market, if at all. Just checked the position of the infamous tanker Grace 1, between Cyprus and Greece, and the Italian tanker with a poetic name “Neverland” was suspiciously close, but speeding off at 15 knots to Italy. Some illegal ship-to-ship ??! Well, if it happened in Neverland, it did not happen! That’s the sense of humour!
Europe dying for 1mbd, leftovers after China. That’s pathetic, that’s the true measure of our oil starvation.
I remember reading somewhere that sanctions are fake, and designed to cover the collapse of Iranian oil production…[?!]
Has there been a change to the spam filter. I am consistently having information about oil in India fail to post.
I think it’s out of spam, see above.
Hi Dennis,
If you try an even higher completion rate, you will eventually end up with a Hubbert curve, peaking in ~2026 at ~10000 kb/d 😉
I love your efforts, Dennis: someone has to do the dirty work to make this kind of scenario’s.
Best regards,
Verwimp
Thanks.
Doubt the shape for these tight oil plays will look like a Hubbert curve. You might be right that a bery high completion rate would be steeper up and down. Pipeline and other constraints probably makes it unrealistic.
I like the idea you only took “about 50% of the USGS mean TRR estimate for the Permian basin.” “Pipeline and other constraints” may indeed be an important issue too. Perhaps rather sooner than later! Time will tell.
Verwimp,
I use the mean estimate for TRR then use economic assumptions to arrive at ERR using DCF analysis and the oil price and other economic assumptions laid out previously. The low oil price assumption (oil prices remain $70/b in 2017$ or less long term) results in low ERR, higher oil prices ($100/bo) raise the ERR from 37 Gb to 50 Gb), if the oil price is raised enough ($250/b) we approach the TRR.
From HFI Research
https://seekingalpha.com/author/hfir#regular_articles
We are seeing the Permian basin starting to stall, While we still expect the Permian to be the biggest growth contributor going forward, the speed and pace of the growth will start to level-off materially. By our estimate, if the Permian doesn’t see a sizable step change upward in well completions, then we will see production growth level out by 2023/2024.
https://finance.yahoo.com/news/permian-slowdown-could-start-2020-210000268.html
Tony,
In the yahoo finance piece the most pessimistic projection has Permian output leveling out in 2023 to 2024. I will reproduce the chart from my post for the flat completion scenario, also note I have assumed flat productivity for Permian well EUR through 2023 with declining EUR from 2023 to 2032.
In my scenario output levels out in 2024/2025, based on the estimated completion rate in June and July of 2019 of 478 new wells each month from June 2019 to Dec 2031.
Link to Excel spreadsheet with model below (it’s a bit messy sorry). File is large.
https://drive.google.com/file/d/16fLGddIJky8X9jT8jPH3zat1JcfSWpS8/view?usp=sharing
For those that like bell shaped output curves. the completion rate can be modified to accomplish that as in chart below (only change is the rate that wells are completed after the peak.
How many wells will the Permian’s surface area allow before communication or a fall off of production because too near edge, and what is the standard deviation of wells IP?
By year end there will have been over 25,000 horizontal PB wells completed for the years 2009-2019.
There have been over 400,000 vertical wells drilled in PB since discovery.
Think of a 1,280 acre DSU. At 660’ spacing with two mile laterals, that is 8 hz wells. It appears 330’ may be too tight.
At 40 acre spacing with vertical wells, that would be 32 wells.
Probably in the ballpark of 100K total hz locations in PB?
assuming no known dead spots, which one would expect. one would expect some exploratory wells among the production wells, just to take measurements.
Watcher,
For 24 month cumulative output for wells with first flow in 2016 and 2017 the 68% “normal” interval is 70 kb to 280 kb with a mean of 183 kb and a median of 166 kb, this is based on shaleprofile data on 3535 wells with first flow in those two years. Older wells were less productive. Model uses and average EUR of 413 kb over 16 years based on a hyperbolic fit to 2017 well data and an assumed exponential decline at 16% per year when the hyperbolic falls to that level at about 5.5 years. My model has about 96,000 horizontal wells drilled in the Permian basin at the $70/b oil price assumption. At the higher oil price scenario peaking at $100/b in 2017$, 136,000 total wells are drilled, note that it is assumed that new well EUR gradually declines starting in 2023 and falls to 241 kb by 2042. URR for $100/b constant completion scenario is 50 Gb and 37 Gb for the $70/b flat completion scenario. Through July 2019 the model has about 23,000 horizontal tight oil wells flowing in the Permian basin.
We can read in the mainstream market rumors that US shale has already peaked, should we take seriously those declarations ?
https://oilprice.com/Energy/Crude-Oil/The-Real-Reason-Why-US-Oil-Production-Has-Peaked.html
Alicante, you are correct. I am going to cover this subject in depth in my post on August 31st. I have saved your link until then.
Alicante,
The author of the piece is an accountant. It is incorrect to assume that number of completed wells has to remain at current levels or output will decrease, at the current completion rate we have seen output rise, legacy decline will gradually increase of the completion rate is held constant, but currently legacy decline is considerably less than the output from newly completed wells (that is why output is increasing). A fall in the completion rate would be needed just to keep output flat, in the Permian basin the completion rate would need to fall from 478 new wells per month to about 350 new wells per month and even at that level after a brief fall in output the overall output level will rise as the legacy decline rate decreases over time due to the drop in the completion rate (because as completion rate falls so does the legacy decline rate).
Chart below shows legacy decline rate for Permian basin for low completion rate scenario.
Dennis, as I said, I will have comment and charts concerning shale oil production in my August 31st post. Here I will simply say that you are mistaken. Proof will follow August 31st.
Yes, if you keep new wells constant, and production per well constant, then production will level out. But if you wish to continue to increase production until 2025, you will need to continually increase the number of wells per month.
Looking forward to it. That’s what makes this blog interesting.
Hi Ron,
The numbers don’t lie Ron. Check spreadsheet below
https://drive.google.com/file/d/1oP5iAq1SrycGc1ELNmhs_-J0eZcW4xv7/view?usp=sharing
based on
http://peakoilbarrel.com/oil-field-models-decline-rates-convolution/
The wells added was modified so that completion rate is constant from month 34 to month 129 in the model.
A constant hyperbolic well profile was used with a wells completed function that was a straight line increase from month 1 to month 34 flowed by a constant rate of completion.
The spreadsheet is very simple, only arithmetic needed.
Well profile used in simple model above.
Ron,
The following adjusts the simple model to the Permian well profile and has new wells added increase from 0 to 480 over 30 months (linear increase at 16 new wells increase each month), then constant completion rate from month 30 to month 129, added decrease in EUR from month 80 to month 129 when model ends at rate similar to Permian model. Note increase in output for 8.25 years (99 months) with completion rate held constant.
Hi Dennis, You do realize that we are not starting today from zero. The US has been running around 450 frac spreads every day for the last 3 years, and substantial numbers for over ten years. Parshall and Sanish were booming in 2007, now in decline. We have dropped from an average of 462 spreads in Q 2 2019 to 405 at 8/23/2019, per primary vision.
https://twitter.com/PrimaryVision
DCLonghorn,
Yes I do. The simple model ignores that. If you look at the big spreadsheet the model goes back to 2010, prior to that there was not a lot of horizontal drilling in the Permian basin. I approximate the vertical wells using a simple comparison of shaleprofile data with EIA data, as of 2019 the difference is quite small (23 kb/d of vertical well tight oil output in Permian basin).
Model matches data pretty well considering how simple the model is. The Correlation coefficient from Jan 2010 to July 2019 (see chart below) is 0.999482. R squared would be about 0.99896.
Dennis – although I understand the point you’re making (and largely agree) the point will be much clearer if you put Axis labels on your charts!
Fraz
He typically places the units with the legend. And the time axis is self-evident.
Sorry limited space for charts only 50 kb. Axis labels sometimes push me over this limit.
Production stops increasing when the decline rate equals the monthly addition.
That is why in the previous post I was comparing the Permian decline rate with the monthly additions.
From a post earlier in this page the link show estimate off shale production compared to funding, that shows all increase for many years have been possible with borrowed money. If that money / funds from banks, investors not have exsisted and Company should payed all new wells from profit after tax, dividend, loan ballons, interest the production would have been flat or in decline and that with significant higher oil price than today. As seems quite clear it is now very difficult to get investment, loan for shale or oil and gaz buisiness as a whole. It simply means every thing now is a question if the majours are willing to spend enough to keep up and further increase the production that before have been driven by borrowed money. The trend is now majours sellibg off assets they not see give enough profit for their owners and this is because all Companies fight for the same investors that will choose the Company that give highest dividend , deliver profit in line with exspectations. So far the ballance sheet of Exxon shows they spebt a lot in US shale and what they get back in income is much less than it would be if same money was spent in their international Buisiness…
But legacy decline rate changes over time. So we need to find how it will change in the future. The model gives us that info for any assumed completion rate.
Why do I get the impression that the timing of this, sure to be interesting post, coincides with June monthlies by EIA?
Not to take anything away from this post, as Dennis has significantly revised his expectations. All really interesting. Thanks.
Ron’s posts are always interesting.
https://www.multivu.com/players/English/8585751-hastings-equity-partners-opportunities-challenges-in-the-permian-whitepaper/
Very much in question now. With the majors positioning themselves for the next moves. Independents want to export, with a lot of obstacles. Probably too much to counter the majors wanting to process the oil here. Stay tuned, the Borg are coming. Resistance is futile.
GuyM,
The article forecasts the majors producing 2 Mb/d within 4 years, that still leaves quite a bit of room for the bigger and better run independents. In what time frame do you see the majors producing 90% of Permian output, maybe 8 to 10 years? You seem to favor my low completion rate scenario which would be about 350 new wells per month, that’s a fall of 36% from the current completion rate of about 478 new wells per month. If oil prices remain under $60/b, perhaps that scenario occurs, I just doubt oil prices will remain that low for long, if oil prices rise, within 12 months we would see completion rate rise in my opinion, perhaps not back to 478 completions per month but perhaps to 415 completions per month.
Yeah, your projections are within reality. All I am saying is what Bubba wants, he gets. And, if you think that big oil and Trump have not been in constant communication, then I am wrong. It all makes sense for big oil to take over, and extend the graph. Why is oil still at $55. The independents are dead at that price. With the Dems (all of them) proposals oil is dead. Somewhat prematurely, no doubt.
GuyM,
Among the things you have been saying is that oil supply will eventually be short at $55/bo. I agree (if I am understanding you correctly) 100%. Eventually oil price rises to $80/b (perhaps by 2021 or 2022), at that point a well run independent may be able to compete in the tight oil space with the majors, perhaps not, but even the majors may be enticed to produce more oil and export what they do not have the capacity to refine themselves.
Do you think completion rate would remain low (350 new wells per month) even at $80/bo in 2017$? I think the profits would be too difficult to pass up.
My assumption is that after initial ramp up, the majors will use the oil for their downstream. Doesn’t make any sense to put billions into downstream, and wind up running it out faster to make a slight profit on the sale of exports. Just my guess. And if it takes that long for prices to increase, not many left standing, my guess.
GuyM,
I agree too much downstream investment would be a mistake. You may be correct that majors will not want to export light oil so they can use it in their refineries. Are there plans to refit refineries to handle the lighter crude? That seem like it will be a bad investment based on my scenarios for tight oil. It would make more sense to simply export it to places that can handle the lighter grades of crude. If it were my company that’s how I would do it, a big downstream investment to handle light crude is not a smart plan at all.
I thought some more on this. If output from the tight oil plays is low, then it might last for a number of years, perhaps 10 or even 15 years. The problem is that a refinery investment usually is planned for a 30 year life. It is highly unlikely that tight oil output will remain on a plateau for 30 years.
Hopefully the majors know better than to believe the hype from the EIA, Rystad, the IEA, and others. Downstream investments in refinery capacity for light oil will become a stranded investment after 10 years.
GuyM,
What do you expect the oil price level will be in 2022, assuming economic growth continues as it has for the past few years? It seems you think $80/b in 2017$ in 2022 is too low, though I am reading into your comment, perhaps incorrectly.
I have no idea. Probably higher than $55.
Am I incorrect in thinking that you expect it may be more than $80/b or do you expect all the tight oil producers are toast? This is not clear to me, just trying to understand your thinking. Usually you are right.
No, it’s a wag, but within the $90 to $100 range. Depending on the economy. Most producers are toast, period. No matter what the oil price goes to. They are dragged down by their poor past performance, and they are unlikely to get capex to drill. There are good companies that can rise above the ashes. But, let’s get serious, there are few independents that have enough tiger in the tank to go past 7 to 10 years. They all need a new daddy. Or else, the officers and shareholders will be toast. The smart thing, would be to merge. All of them.
And the majors are well aware of this, and would prefer not to merge, if they can pick it up for fire sale prices. It’s a game, right now. The independents hope oil price will go up to get a better deal. The majors want to keep it within this stupid $55 price, as zombies are easier to kill than someone who can shoot back.
The inventory just dropped 10 million barrels, with consumption increasing. The imports are decreasing, the exports sure will. The production is stagnate. The price went up a buck fifty. Yippee, Kay, yah. It don’t compute. Who is in control?
You asked earlier, if the majors have increased downstream. Apparently you missed my earlier posts. Yeah, Exxon and Chevron have planned enough downstream capex to account for processing all the oil increase they plan by 2022. Everything else they pick up is gravy. They may have to exports some prior to completion of the downstream. However, if you control start to finish, how much would you make at a $100 oil price. Duh.
And, they are planning on the long haul. Everything I read in the Midland newspaper is positive on the majors concerning how much they are dropping on helping the local economies. Yes, I am sure the independents would increase production, if they had a chance. They don’t.
There has been an excellent number of posts with highly difficult math computations, but it boils down to one thing. What Bubba wants, he gets. He don’t have to play fair, he just needs to look like he is.
GuyM,
So there is a bit of a contradiction here.
On the one hand majors want oil prices to stay low to drive independents out of business. How might they accomplish that?
Increase production to keep prices low. Once they have driven most of their competition out of business, then it would make sense for them to slow down so that output stays flat or even decreases so that oil prices rise.
https://www.petroleum-economist.com/articles/upstream/exploration-production/2019/dog-days-for-the-wildcatters
It’s here. At one time I read the small producers were responsible for about half the drilling. Doubt production was to that scale, however, it is far from insignificant.
The American Petroleum Institute (API) has estimated a staggering crude oil inventory draw of 11.1 million barrels for the week ending Aug 22, compared to analyst expectations of a 2.112-million barrel draw.
https://oilprice.com/Latest-Energy-News/World-News/Colossal-Crude-Oil-Inventory-Draw-Carries-Prices-Higher.html
Dennis – what’s your EUR assumption for those future drilled wells?
When, in your models, is the Tier I all gone, then Tier II, and finally Tier III? What are the EUR’s for each?
I’ll note that my view is that the EIA and the industry have EUR’s that are ~2x what the data supports.
The fundamental truth that renders all projections invalid is the definition of well has changed over years. Early wells had shorter laterals. This makes later wells look like there was some techno miracle. It also makes production per well meaningless.
The correct way to do this is look at wells that are capped and abandoned and what they produced in their lifetime Per Lateral Foot. Then you have some real information about what can be expected per lateral foot in other wells.
Watcher,
The model adjusts by using a changing well profile. I do not have the information on output per foot of lateral, but well profiles vary over time as shown in chart below.
If I had the data I could do the analysis, it is not freely available.
Well profiles above are for Permian.
Dennis thank you for the insightful post and for your comments. If I understand well you are assuming stagnant productivity improvement from 2017 to 2022?
Ivan
Yes that is correct. This is a guess of course. It will be modified as I get more data.
Thanks. Is that BOE or oil?
In other words, if you do a Berman adjustment separating out the value propositions for oil vs. NG vs. NGL then the economics change quite a bit.
In other words, at today’s prices a BOE is actually worth less than a barrel of oil itself.
I usually just count the oil itself. That might be unfair going forward if/when more of the NG is actually captured and used/sold.
Chris
Barrels of oil.
I should have said kbo which means kilobarrels of oil.
Chris,
The EUR for the average Permian basin well is 403 kb from 2017 to 2023. Starting in August 2023 the EUR decreases for the “constant completion rate scenario” from the post as shown below. The slope of the line depends on the number of wells drilled. Higher completion rates would result in a steeper slope and lower completion rates in a less steep slope.
Okay. Thanks.
I wouldn’t have any way of advancing or disputing your assumptions, it’s good to know what they are.
Seems like a place to start.
I’m still scouring trying to find out any particulars about how much Tier I is left but have come up short. Complicated by the stacked zones and other complicating factors.
Chris, you can start there but don’t waste a lot of time there.
When the E in EUR does not stand for estimated it stands for exaggerated; it is unrealistic, at best, to suggest EUR’s are constant and will be that way for the next 4 years. Already EOG, the poster child for LTO development, is seeing a significant reduction in initial productivity in the Permian. Then there is the matter of rising GOR, politics, water, which everyone just assumes is as plentiful as money, climate change and flaring (the worldwide LNG market is on pause), accelerating decline rates, ASTOUNDING terminal decline rates at post 50 BOPD (who was the knucklehead yaking about long fat tails in DCA?) and a host of other reasons we don’t know what EUR’s will be.
And, just to be sure, 420K BO EUR’s (not in the EF!) at $<65 oil does NOT provide sufficient ROI, fast enough, for the shale oil industry to pay down debt AND continue to drill wells from net revenue; as a whole it is STILL outspending revenue by a wide margin. So, as I said, there is this inconvenient matter of where in the hell all the money is going to come from to make these limitless supplies of predictions come true. Trees? Heaven? Lower oil prices are good for the US economy and good for November 2020; whoever thinks the current administration is going to allow the price of oil to go to $70 got bit too many times this summer by black flies.
Mike
In the Bakken EUR stayed roughly costant from 2008 to 2017. Enno’s analysis suggests that productivity per foot of lateral has been roughly constant from 2016 to 2018. If we further assume the average lateral length remains constant and the productivity per lateral foot remains constant then my assumption would be correct.
Note that for the Bakken I assumed EUR would start decreasing in 2013. I have been wrong on this for the past 6 years. Currently I expect the EUR in the Bakken will start decreasing in Jan 2019. Up till now it has continued either flat or slightly up.
Assumptions about the future are often incorrect. Typically my assumptions have proven conservative.
Those were Permian EUR I thought it was stated.
EUR for EF is about 245 kbo. I expect EUR will decrease in Jan 2019.
It was not stated; you added that after the fact. Where in your 2nd chart do you show Permian EUR’s “decreasing” until after year ’23? Its September 2019, January was 8 months ago.
“If we further assume the average lateral length remains constant and the productivity per lateral foot remains constant then my assumption would be correct.” Yikes. “I doubt fracking or conventional output of oil will be curtailed by anything except profitability.” Double yikes.
Mike
The scenarios for Permian have assumed constant average EUR from 2017 to 2023. I did fail to mention that in this post but have mentioned this assumption many times in the past.
Mike
I meant that it was stated in my replies to Chris. If you check you will see that is the case.
Mike
I will try the scenarios at 60/bo for Brent in 2017$. If spread remains what it has been for past 5 years this would be $52/bo for WTI in 2017$. Note this scenario seems low to me.
Mike
My EUR estimate for Permian has been revised lower to 400 kbo for 2017 to 2022
I assume EUR decrease starting in 2023, the start date varies depending on the completion rate of the scenario. Basically I assume the decrease starts at 46000 total wells completed in Permian basin.
You are correct that I failed to state this clearly.
It has been my standard assumption for Permian basin scenarios since Dec 2018.
The revised EUR is due to steeper terminal decline of 16% rather than 10% in earlier estimates.
The Earlier EUR estimate was 420 kbo for average Periam basin well from 2017 to 2022. From 2012 to 2017 Permian basin average EUR was increasing. I assume this ends in 2017.
Chris,
For Permian basin wolfcamp and bonespring in the Delaware you can use
https://pubs.usgs.gov/fs/2018/3073/fs20183073.pdf
It breaks out various portions of wolfcamp and bonespring.
Some consumption items:
Russia oil consumption is growing. +0.7%. Population is flat, a tiny tick negative, but only if Crimea is not counted. There is inconsistent data on Crimea out migration to Russia vs how Russia labels that. Crimea population is only 2 million so it would not be a large increase in the Russia number (144M), fractional %.
Kazahkstan oil consumption is growing strongly. +12%, though still well under 1 mbpd. It appears that most exporters grow domestic consumption. Iraq +6% approaching 1 mbpd. KSA the exception as they were in danger of surpassing Japan’s consumption, the optics of which would have been poor. So they report a -3%.
Indonesia +5.2% and that’s on 1.8 mbpd. Worth noticing. Pop growth 1.5% and we’ll give that a !
Norway consumption growth 5.1%.
Watcher
You seem to be one of the few people keeping an eye on the Vaca Muerta.
(Somewhat surprising, this, as an overseas success story in unconventional development would portend huge ramifications … meriting more attention, I would have thought).
Anyway, in addition to 2 Super spec rigs from Helmerich & Payne shortly heading down Argentina way, the world’s pre-eminent (supposedly) snubbing unit outfit – Deep Well Services – just announced that they are also sending a newbuild down that way.
These are examples of how the incremental adoption of cutting edge US unconventional technology can much more rapidly boost LTO production worldwide far faster than folks might ever think.
It may develop into something. I just have a hard time getting too excited over a formation called dead cow. Expired dinosaur, yeah. Preliminary indications, is it a lot of cow farts, very little oil.
Coffeeguyzz,
Little analysis is possible without data. Seems Vaca Muerta is mostly shale gas, so crude output is minimal, perhaps a bit of NGL. There is a lot of natural gas at present, seems output so far is about 1 BCF/d, not really a big deal when World natural gas output was 374 BCF/d in 2018. Perhaps that is the reason not many are paying attention.
Let us know when they get to 10 BCF/d.
Guy/Dennis
No doubt that Vaca Muerta is a gas heavy resource.
That said, the info from that article that was posted on this site (from Kalanish?) contained some very impressive production numbers.
More to the point, perhaps, is the potential that Argentina may mimic the American trajectory of targeting and developing gaseous areas before ramping up the oil resource.
This movement of US hardware south could possibly encourage the road, rail, pipeline, sand mine, etc. buildout that future potential fulfillment would require if it were ever to be realized.
Countries such as Colombia and Brazil- to mention just 2 – are looking on and waiting to see how all this plays out.
Coffeeguyzz,
How much LTO is produced in Vaca Muerta? It seems to be a shale gas play.
Dennis
I do not know.
As you mentioned, there does not seem to be great deal of data readily available.
I will do some digging and try to find out.
Read an SPE article that says current oil production is approximately 75,000 BOPD in early 2019, with Rystad estimating at the end of 2021 oil production being 160-200,000 BOPD.
It appears that well cost is about double per lateral foot compared to US shale basins. Again, got that from SPE article.
We’ll see.
The other complicating factor is that ARG has been subsidizing oil by buying it at a very high price.
Given their recent economic collapse, either the ARG government has to really scour the Treasury to keep that going in dollars, or they’re going to have to pay in pesos.
Not saying the Vaca is a dud or anything, just saying that economics and politics have a way of interfering in ARG.
The story of the Vaca Muerta is that of harbinger. Argentina made a decision to ignore international money definitions and just make oil flow (because their government collects a royalty on flow and it impacts the fiscal budget).
People, wake up. Argentina declared a price of oil. That’s why the gas and oil flows. They said here’s the price of what you produce, and that declared price is sufficient to pay the domestic workers their domestic pay. Chevron went along with it. It doesn’t cost them anything because their labor is paid domestically. And they get to declare more production on the quarterly report. That, plus a possible future global oil price surge, was apparently worth their 3.5B invested there so far.
That’s $3.5B with a B.
The reason for watching the Vaca Muerta is that it demonstrates how global economics will not decide oil flow when you desperately need to have oil flow. Their desperation is fiscal, but the same thing will unfold when the desperation is for calories. It’s a methodology for . . . not destroying the system . . . rather doing something perhaps more devastating. It’s a methodology for ignoring the system. This is at the core of the IMF’s rage.
The wiki lays out a lot of YPF quotes about their partnership with Chevron. Chevron has put in billions, but I suspect those billions are defined by the locally decreed price of oil so that the labor “pays for itself” and thus really doesn’t cost the shareholders anything beyond the drill rig transport costs.
At some point the IMF will have a talk with Chevron. That will be interesting. It’s a very dangerous precedent to get oil to flow regardless of what the IMF thinks the cost should be.
Watcher, on the oildrum we had the “westexas” ELM calculations.
Impressive, especially with crude oil exporting countries that export a small amount of oil and because of rising consumption rapidly turn into an oil importing country.
I remember that. Weird name — Export Land Model — it was exporting oil, not land. It also wasn’t much of a model, more of a zero-sum allocation observation. Yes, countries will eventually stop exporting when they realize they need to keep whatever is left for themselves.
Argentina is presently pretty close to break-even in terms of production and consumption. Their recent shipping of some Vaca Muerta oil was therefore not absurd.
Consumption has fallen about 8% over the past 3 years in total, not per year. Presently 458K bpd. Production is a bit over 500K bpd. ( that’s all fields, not just the VM).
Another excellent posting by Matt
“2005-2018 Conventional crude production on a bumpy plateau – with a little help from Iraq”
http://crudeoilpeak.info/2005-2018-conventional-crude-production-on-a-bumpy-plateau-with-a-little-help-from-iraq
Tad Patzek has also some recent posts on fossil fules and estimates of future production:
Global peak oil estimate http://patzek-lifeitself.blogspot.com/2019/08/global-fossil-fuel-production-and.html
US oil production: http://patzek-lifeitself.blogspot.com/2019/08/us-and-global-oil-production-and.html#US%20Oil
Global fossil fuel production (coal and gas) and forecasts http://patzek-lifeitself.blogspot.com/2019/08/global-fossil-fuel-production-and.html
Patzek is projecting well below a RCP8.5 scenario
Interesting perspective he has. I can’t confirm or refute his global fuel projections/assumptions with any accuracy, but regardless of that, his discussion of ramifications seems generally clear and uncluttered.
Enno Just posted the Permian April update. April and May production shown in chart
Thanks for this info from Enno Ovi. If I understand this correkt was there from April to end of May set in production 343 more wells that result in a a decrease in oil production from Permian at 24 079 bo/d because of decline rate from 22 473 wells that already is drilled there .
Note that Enno says he expects with revisions that May output will be 3.5 Mbpd for Permian tight oil output.
Dennis,
What will April be with revisions? Does he have an estimate there also?
Baggen,
Enno expects about 3.4 Mb/d in April after revisions see
https://shaleprofile.com/2019/08/01/permian-update-through-april-2019/
https://oilprice.com/Energy/Oil-Prices/Saudis-Need-Deeper-Cuts-To-Sustain-60-Oil.html
Here it comes!
1 mbd OPEC cut.
I suppose it will just legalize, so to say, the current low Saudi production, together with a programmed future decline quota, probably 0,5mbd per year.
Important Notice
The EIA’s Petroleum Supply Monthly was due out today. I was to have a post tomorrow based on that report. But apparently it has been delayed. Therefore I cannot have the post until it posted.
Sorry about that.
Ron
On second thought, I will try to have a short abbreviate report tomorrow. But it will no state by state data other than something from Texas.
I will have another report when the Petroleum Supply Monthly is released.
Ron
Ron
I saw a similar thing last month. This is what I just saw when I went to the EIA site.
Ron
There is some EIA data released not only for June, but also for July.
https://www.eia.gov/totalenergy/data/monthly/pdf/sec3_3.pdf
There is another web source for USA , JODI , with a wild discrepancy for USA oil production for June:
http://www.jodidb.org/TableViewer/tableView.aspx?ReportId=93906
12.2 Mbbl/d (EIA) vs. 12.6 Mbbl/d ( JODI ) for the same month of June.
What’s going on? Who is sending to JODI fake data ?
https://www.eia.gov/petroleum/production/
EIA monthly out, looking sicker. Take out Alaska and Fed offshore, we are close to FLAT. Doesn’t bode well for the rest of the year. Any Permian increase is not going to keep up with the other formations drop. IMO.
Seems North Dakota have increase of 36 k bo/day , Texsas 13 k bo/day. Could it be lack of pipeline capacity from permian that Texas have very limited increase.? Or is it lack of borrowed money …?
Pipelines increased by about a million barrels a day last month. So, second guess is probably valid. New Mexico, the other side of the Permian decreased 14.
Rig count, down by 12.
https://bakerhughesrigcount.gcs-web.com/static-files/566bc13a-bb3c-4a72-b96c-7839d07691d9
Texas rig count down over 16% from last year, already. More to come. Why can I guess this? Rig counts eventually will line up to what is permitted. On an average, you need less than one rig per permit per month. Many are drilled on platforms with multiple wells. In that case, they take a little over a week to drill. For one well locations, it averages about one a month.
So it wouldn’t surprise me if we dropped another 100 rigs in Texas by year end.
I guess they try to still increase the lenght of the horizontal latheral to increase the production each well but according to Schlumberger they believe they already reach a limit. A drop in additional with 100 unthil year end if this oil price level continues will be dramatical and a significant reduction from EIA estimate will be the result. Think it was increase of about 2 mill bo/ day , it might be a decrease of 2 mill instead… Than the world need to relay on Saudi Arabia and that could have been interesting…
There is no way there will be that much of a decrease. Knocking off a 2 million plus increase will still make a heck of a difference. OPEC can’t get there.
GuyM
If you look at permits since 2015 there are about 10,000 oil permits outstanding in Texas. Not sure permits tell us much.
Dream on. All reports I have read is that completions are following drilling and permits, we can’t revive dead ducs. Or, just follow EIA monthlies if you insist on being left behind. No disrespect intended. For example, are your EIA and other info telling you that there should be a flat output for June? No, everything I have read in all the hype, is that June should have sparking completions. It’s fritzing hype, it ain’t real. It may look like for a while longer, but the info in EIA monthlies is the only thing that is not complete shit.
It’s June, the die has been cast, and there are no winners. It’s going nowhere, zip, nada. In the four years I have been following the EIA monthlies, I do not recall a time when there has ever been more than a few thousand barrel a day adjustment. Usually, there are none. The only slight highlite is the Bakken, and I don’t see that as continuing, because of Whiting results, and Hamm crying we have to decrease production. Some, Permian increase may be hidden by EF drop, and probably is. Net -1k out of Texas and NM, but Permian is getting ill, too.
My biggest guess is that initial completion rates are dropping like a rock. Too early to tell from the crap you are leaning towards.
And, I understand why you use it. Much easier for mathematical calculations. But, its garbage in, garbage out.
It worked as good as any, when production was going up. A bit faulty when it is going down. Ok, maybe not the Permian, but I don’t think it is as healthy as you think.
Ok, keep looking. However, I don’t think you will find anything on Enno’s site, or the EIA that will support EIA monthlies for June.
The King is actually very much buck naked.
North Dakota Bakken showed increase of 31kbd from May to June, which shows some consistency with EIA North Dakota total being 36kbd.
https://www.dmr.nd.gov/oilgas/stats/historicalbakkenoilstats.pdf
EIA monthlies state US crude oil production
Nov 2018 12.0 mbd
Dec 2018 12.0 mbd
Jan 2019 11.9 mbd
Feb 2019 11.7 mbd
Mar 2019 11.9 mbd
Apr 2019 12.1 mbd
May 2019 12.1 mbd
Jun 2019 12.1 mbd
Average over the eight months 12.0 mbd
EIA monthly averages, from weeklies released 28 August, states
https://www.eia.gov/dnav/pet/hist/LeafHandler.ashx?n=pet&s=wcrfpus2&f=w
May 2019 12.2 mbd
Jun 2019 12.2 mbd
Jul 2019 12.0 mbd
Aug 2019 12.4 mbd
If Permian production growth can’t compensate for decline from other US basins, then it’s looking likely that US crude oil production has hit a 12.0 mbd peak plateau.
Texas rig count has fallen over the past year
https://bakerhughesrigcount.gcs-web.com/na-rig-count
Hfir which seem to know what they are talking about still predict significant growth in H2
Yeah, read on another Twitter post, pipeline costs in Permian now down from 5$ to 1,3$ a barrel, with the new pipes online.
With removed transport limitations this also should improve economics and may incentive some additional Permian production in 2nd half of the year.
Didn’t find the original post, but this:
https://pgjonline.com/news/2019/08-aug/new-pipelines-hurricane-drive-wti-inventories-down-prices-up
“Things have changed drastically in just two or three weeks. And you’re going to have another big pipeline that’s going to continue to change the math.”
Along with falling rig counts we have falling frac spreads, 395 at August 30 down from 457 on May 31. Almost 14% drop in the last quarter. Per EIA monthly data, US crude production was virtually steady from Dec 18 to Jun 19 (up 45,000 bopd over 6 months). With a 14% drop in fracs, production will be declining soon.
DC and Tony thanks for the input. I’m not ready to call US production down, just yet. It should be stabilized by majors production. But, it’s not going anywhere for about a year, anyway. But, I am getting tired of the Permian bullshit. Peak oil is here, now. Actually, it was here in 2018.
GuyM,
EOG is a major oil producer in the US and their US crude and condensate (C&C) production may have peaked in 2019Q2 at 455 kbd, which is almost 4% of total US C&C. The quarterly peak of US C&C, so far, is also 2019Q2 at 12.1 mbd, according to EIA monthlies.
EOG C&C quarterly production has increased almost every quarter since 2016Q1. EOG US C&C guidance for all of 2019 is 450-455kbd. EOG average US C&C production for 2019H1 was also 445kbd which implies that 2019H2 guidance is at least 455 kbd. This means that, if EOG guidance is correct, that EOG peak US C&C happened in 2019Q2 or maybe 2019Q3.
http://investors.eogresources.com/Cache/1001255215.PDF?O=PDF&T=&Y=&D=&FID=1001255215&iid=4075407
http://investors.eogresources.com/Cache/1001255213.PDF?O=PDF&T=&Y=&D=&FID=1001255213&iid=4075407
EOG US C&C production is also mainly from shale with 242 kbd from Permian in May 2019 and 285 kbd in April 2019 from Eagle Ford.
https://shaleprofile.com/2019/08/29/permian-update-through-may-2019/
https://shaleprofile.com/2019/08/05/eagle-ford-update-through-april-2019/
If you drop your capex by over 400 million, good chance production slows.
https://csimarket.com/stocks/single_growth_rates.php?code=EOG&capx
Red queen is faster than some imagine.
This is what the shale pionear Mark Papa told in 2015 and it seems now this will became true.
https://youtu.be/vtBXe0yVYT4
As Mark Papa highlight there would come a decrease in oil riggs , fracking as result of rock quality and profit goes down. What is interesting he see a decline from EIA exspectation first year at 700 k bo/d. If June production was down 33k , increased by 10% monthly as result of still rigg , frack decline we might get decline July 36.3 , August 39.9 , Sep 43.9 , Okt 48.3 , Nov 53.1 , Dec 58.5. In total that is decline at the remaining 2019 at 231k bo/d. Latest EIA report stated US production in June was 12.08Mbo /d. Think EIA prediction is about 12.5 at end of 2019. That would mean a difference at 733k bo at end off 2019 and the 700 kbo/ day increase that EIA and Rystad sees in 2020 might instead be a decline with 1Mbopd. That means a difference from EIA , Rystad estimats at 700kbpd in 2019 + 1.7 Mbpd in 2020. Think this is much in line with what Mark Papa predicts in 2015 but wall street denied. .
From EIA monthly data.
Permian :
June 2018 4359 k bpd
May 2019 4969 k bpd
Increase in 11 month average 55k bpd monthly.
June 2019 4982 k
That is only an increase of 13 k bpd or reduction of 76% related to average increase 11 months June 2018 – May 2019. Consideribg this together with the other shale plays in US , GOM it seems increase decline in US production unthil the oil price WTI reach 75 + usd pr. barrel is what the future will give and US will after this be a sving producer as Mark Papa sees. The only that have funds ( if use from cash , selling assets as very few investors believe in shale oil as they already have lost enough) and can change this is the majours like Exxon , and that will be very intetesting to see if the board and stock holders will aprove to use massive capital in US shale with the knowledge they now have.
“Exxon Mobil Corp. is poised to drop out of the S&P 500 Index’s 10 biggest companies for the first time since the index’s inception some 90 years ago.”
https://finance.yahoo.com/news/exxon-poised-drop-p-500-214917414.html
Stockholders like stock price to go up. XOM share price continues its downward trend since it was just over $100 in early 2014 is now below $70. There may be pressure from stockholders to ration capital investment which means less for shale.
https://www.marketwatch.com/investing/stock/xom
Same for EOG which is mostly shale. EOG stock price was $132 in Oct 2018 and now it’s $74.
https://www.marketwatch.com/investing/stock/eog