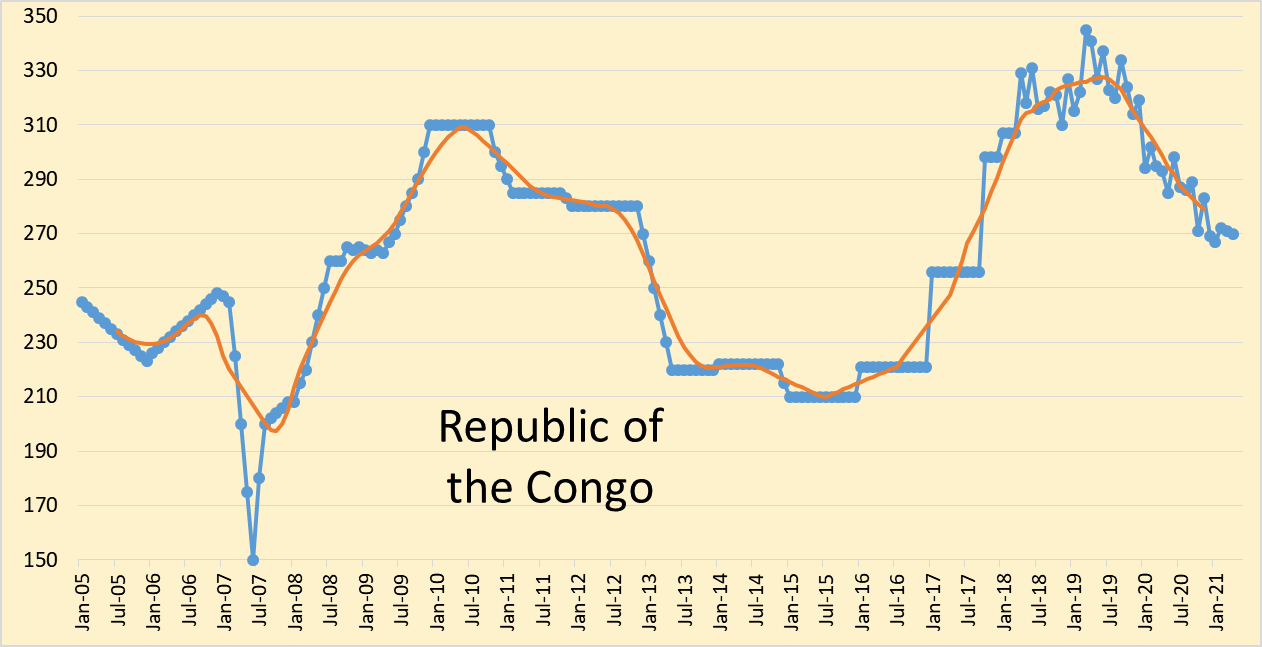
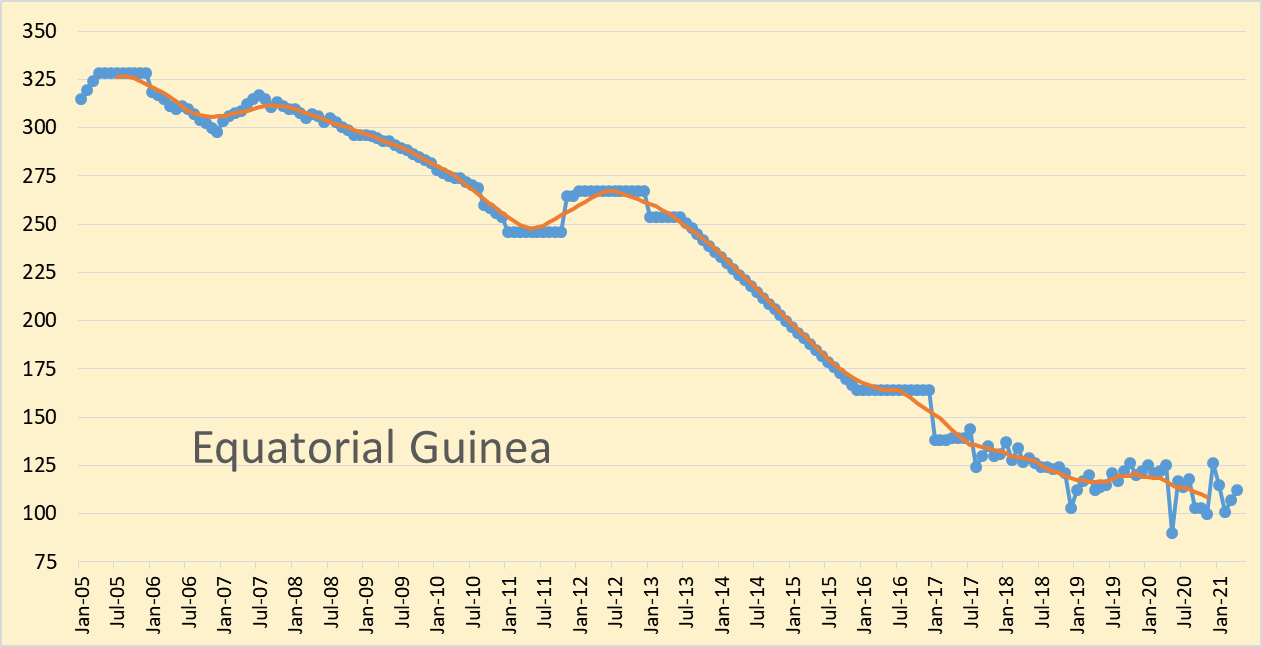
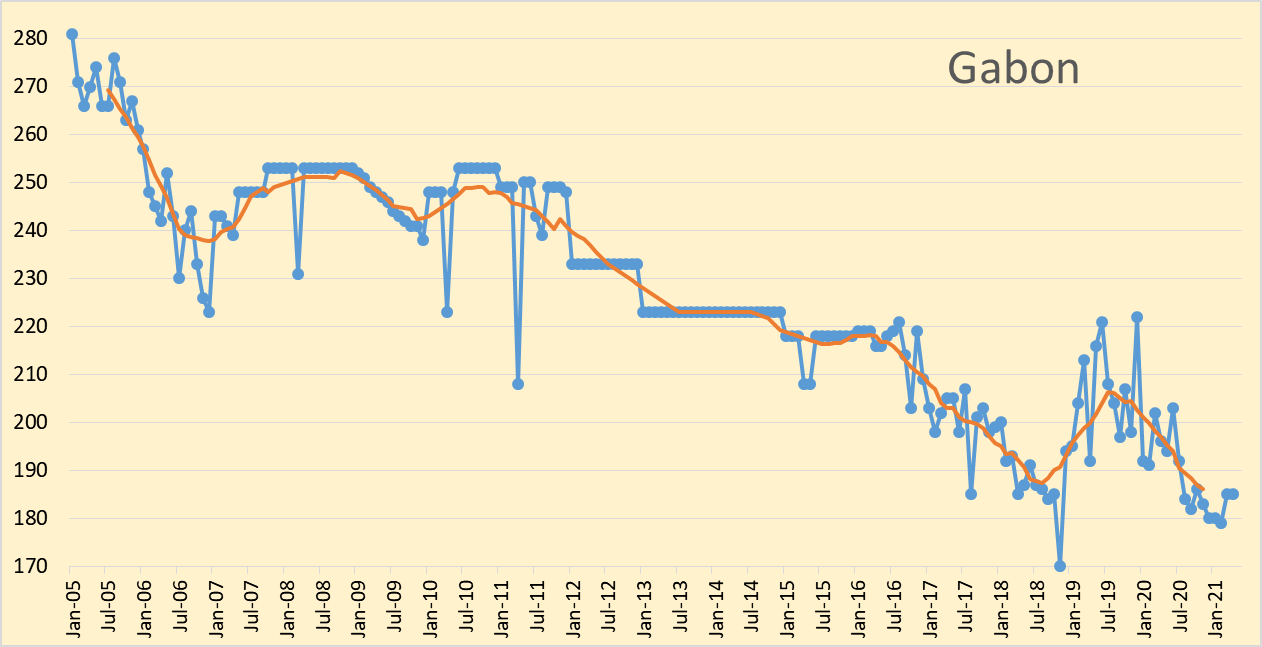
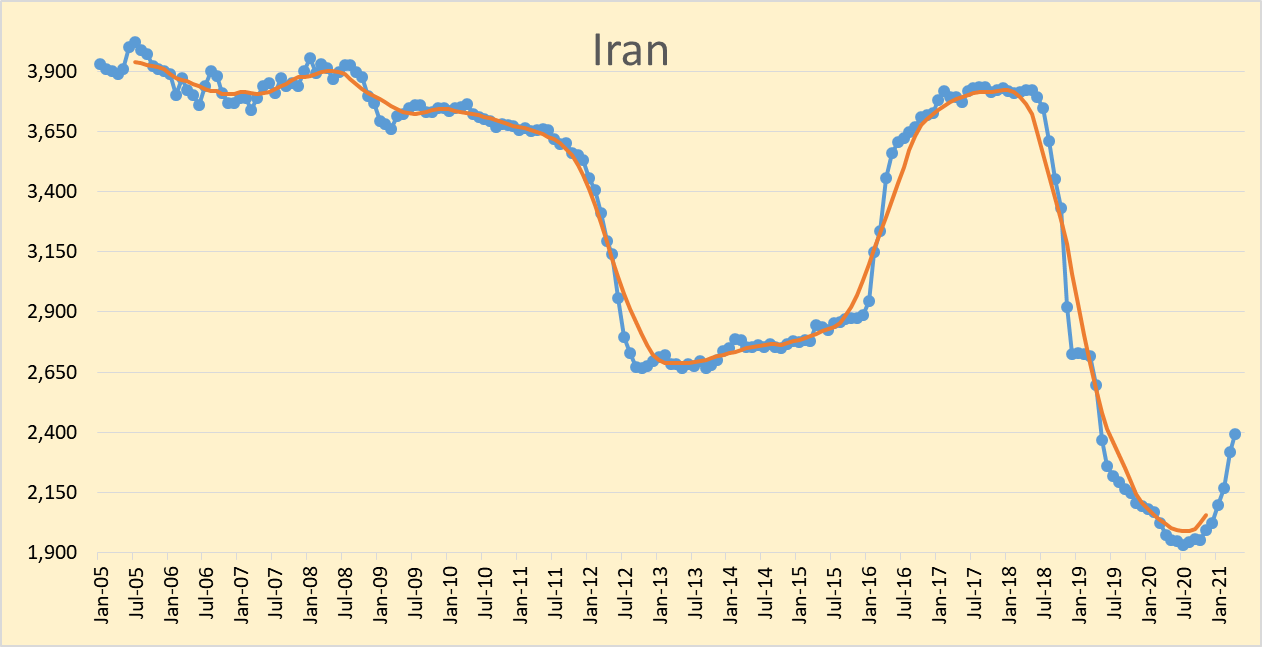
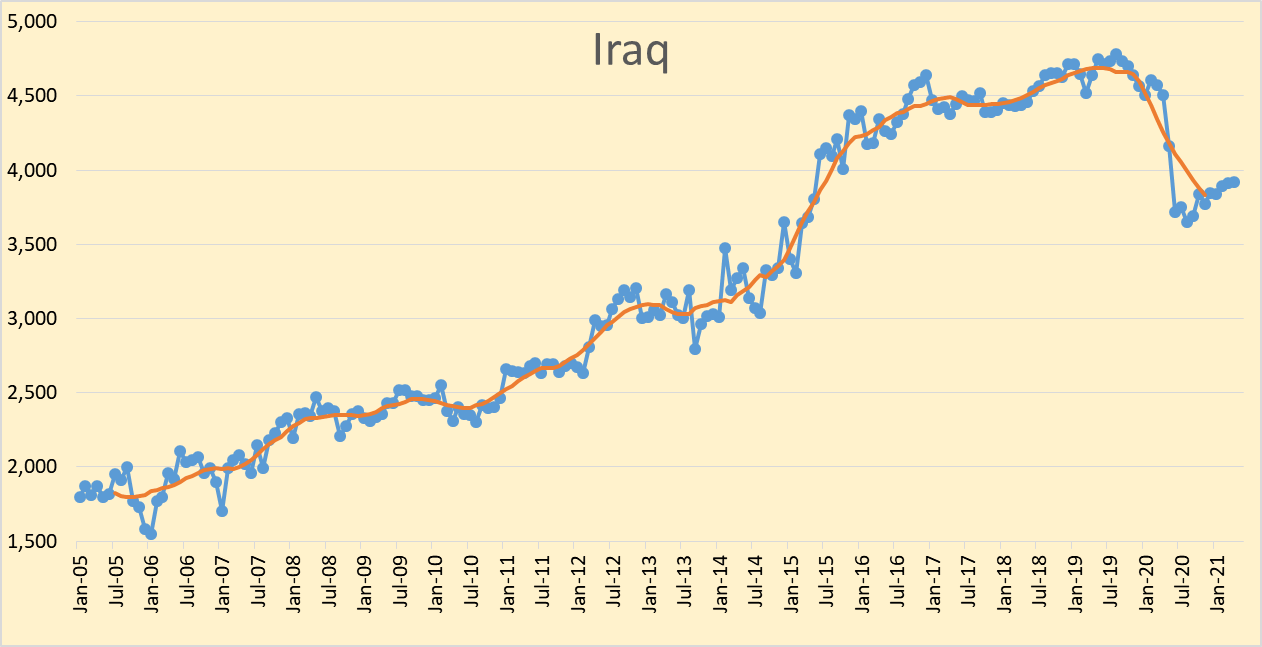
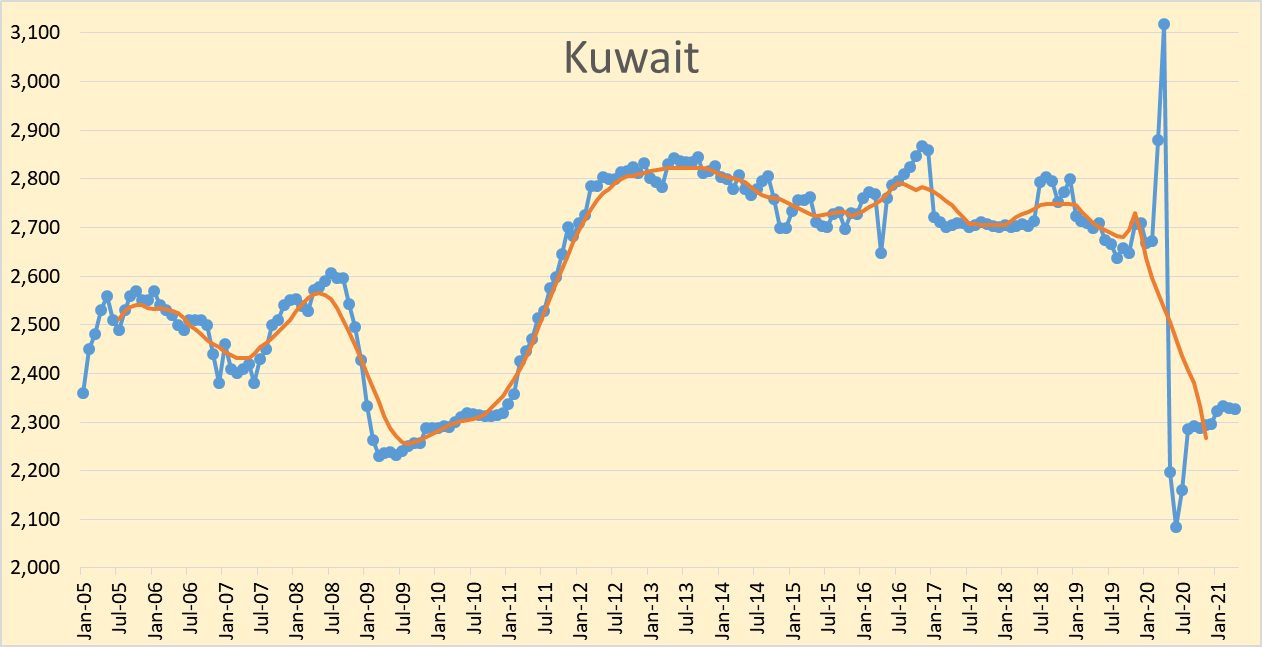
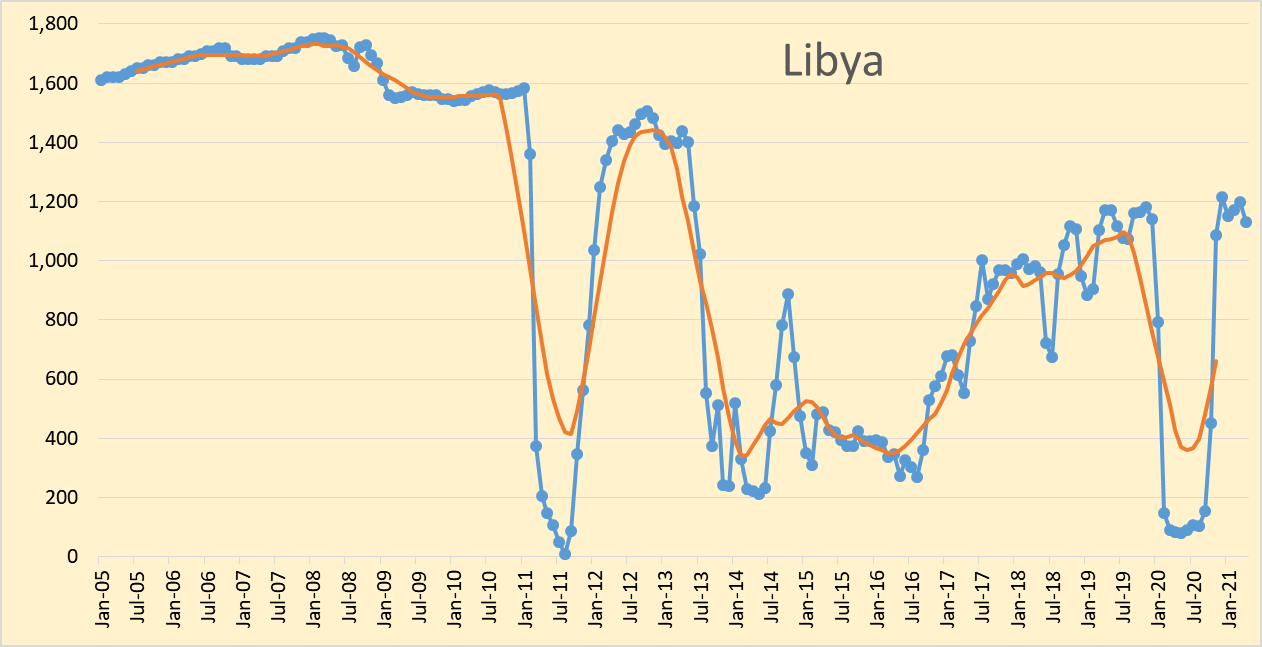
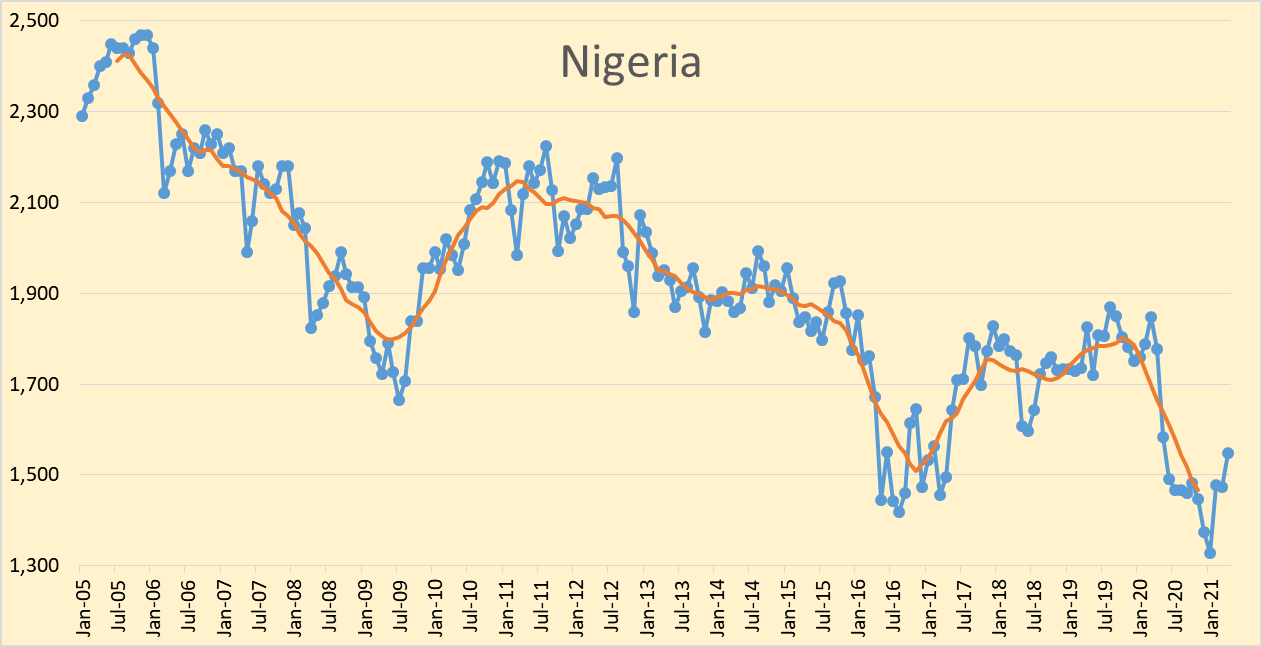
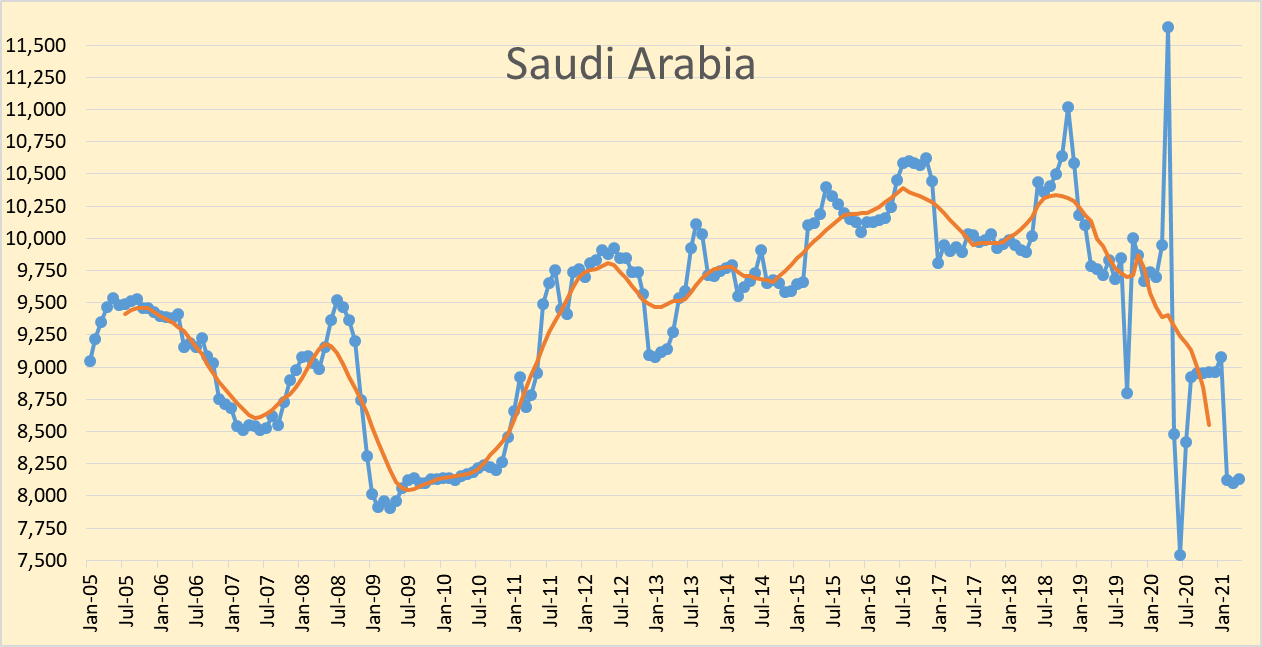
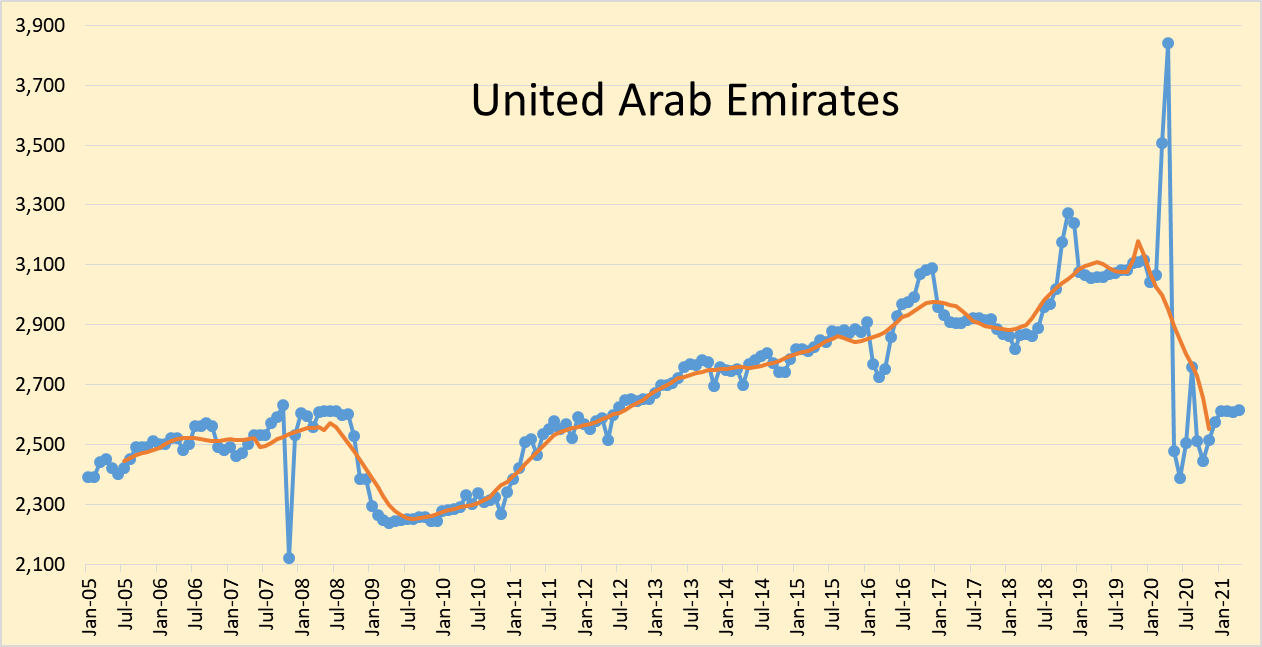
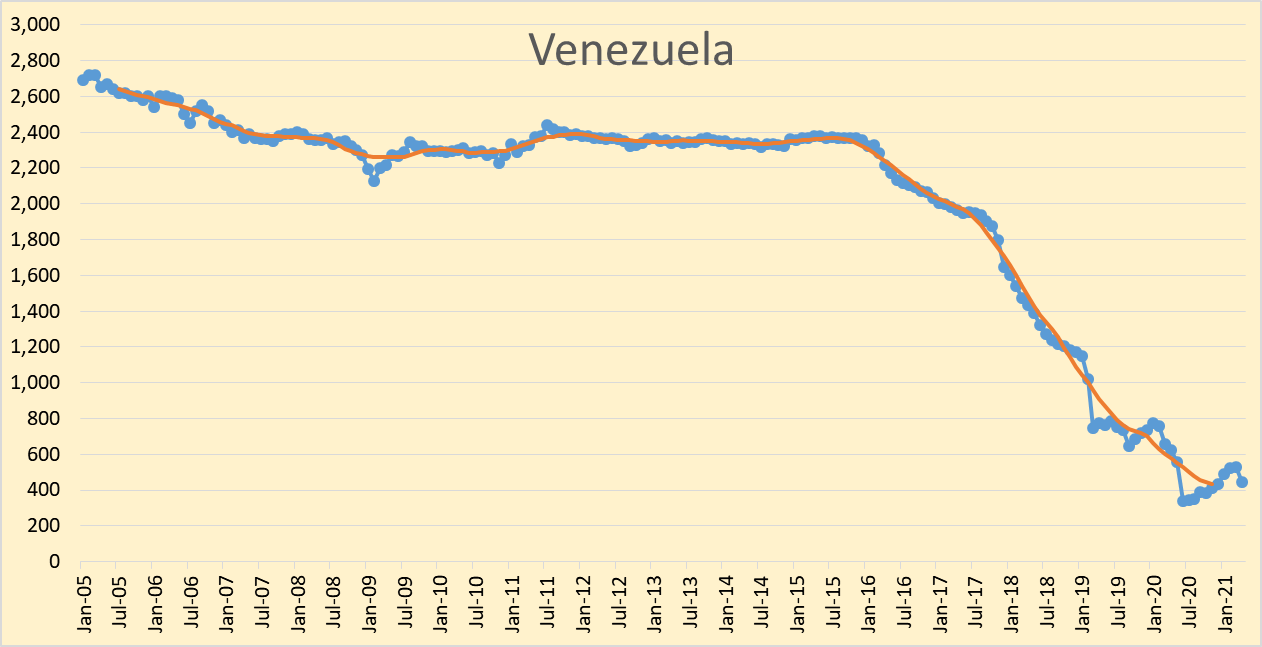
The OPEC Monthly Oil Market Report for May 2021 was published this past week. The last month reported in each of the charts that follow is April 2021 and output reported for OPEC nations is crude oil output in thousands of barrels per day (kb/d). In most of the charts that follow there is a red (and in one case yellow) line without markers which is the centered twelve month average (CTMA) for output. Note that this a change from the way Ron Patterson has reported the average data for many years which used a trailing twelve month average. Essentially the curve shifts back in time by 5 months as I choose July as the center month for the January to December 12 month average.
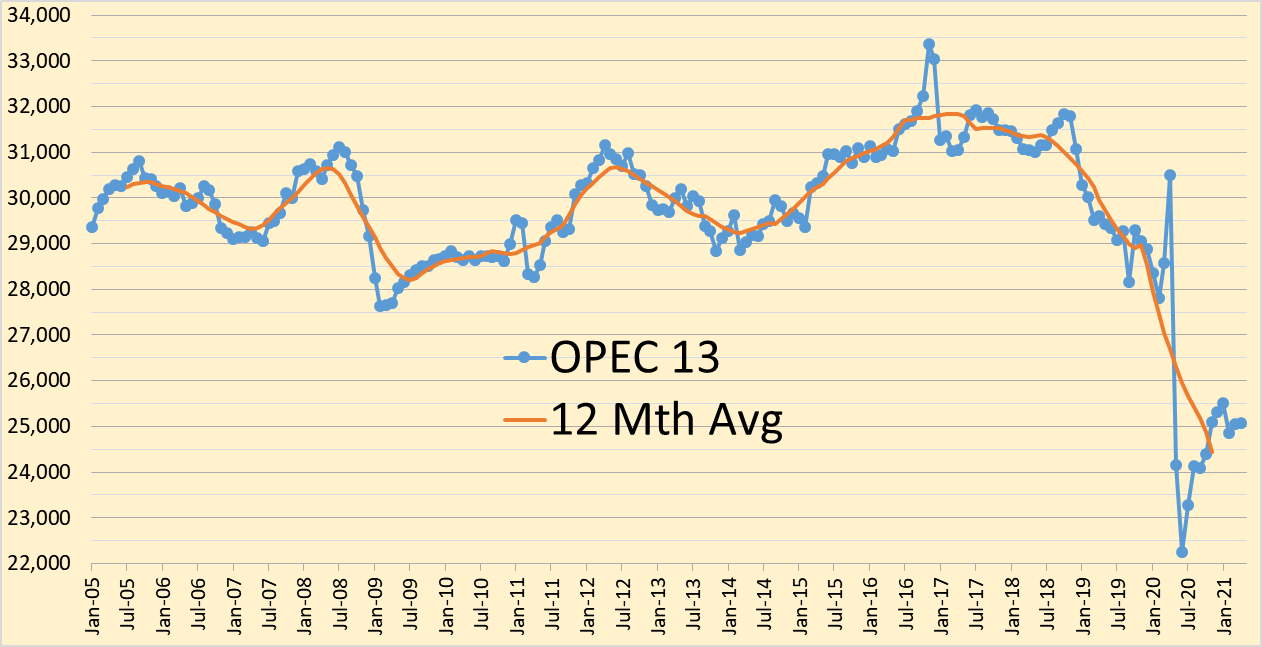
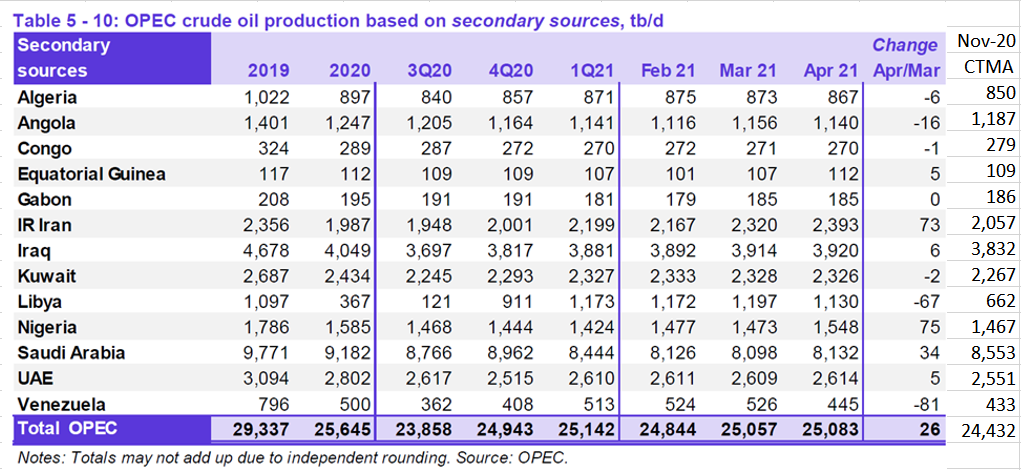
Only a small revision in OPEC output from last month’s March estimate (+15 kb/d), OPEC output was up by 26 kb/d in April. Next to the OPEC Table 5-10 I also show the most recent 12 month average for each OPEC member and all of OPEC. In 2018, when World C + C output peaked, the OPEC 12 month average crude output was 31,336 kb/d.
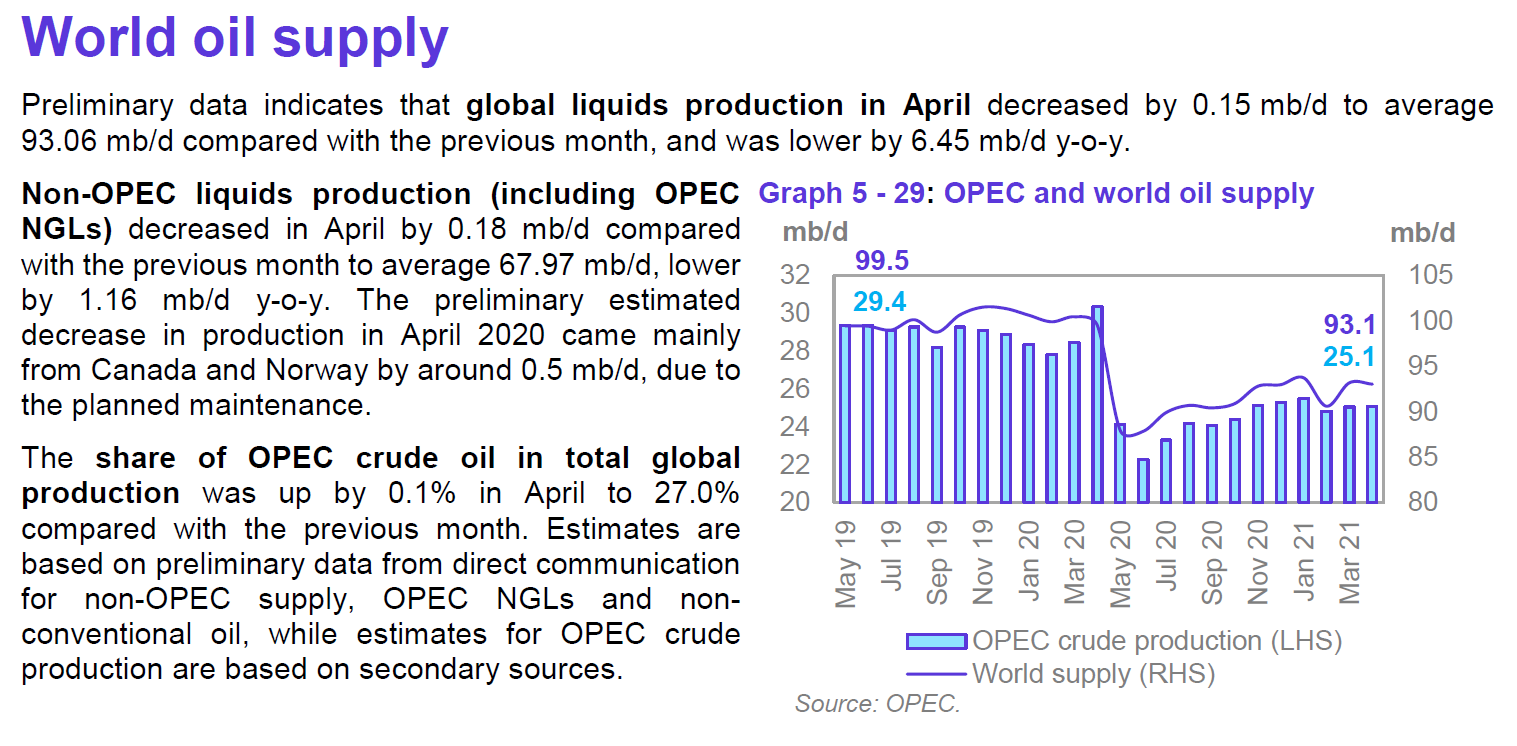
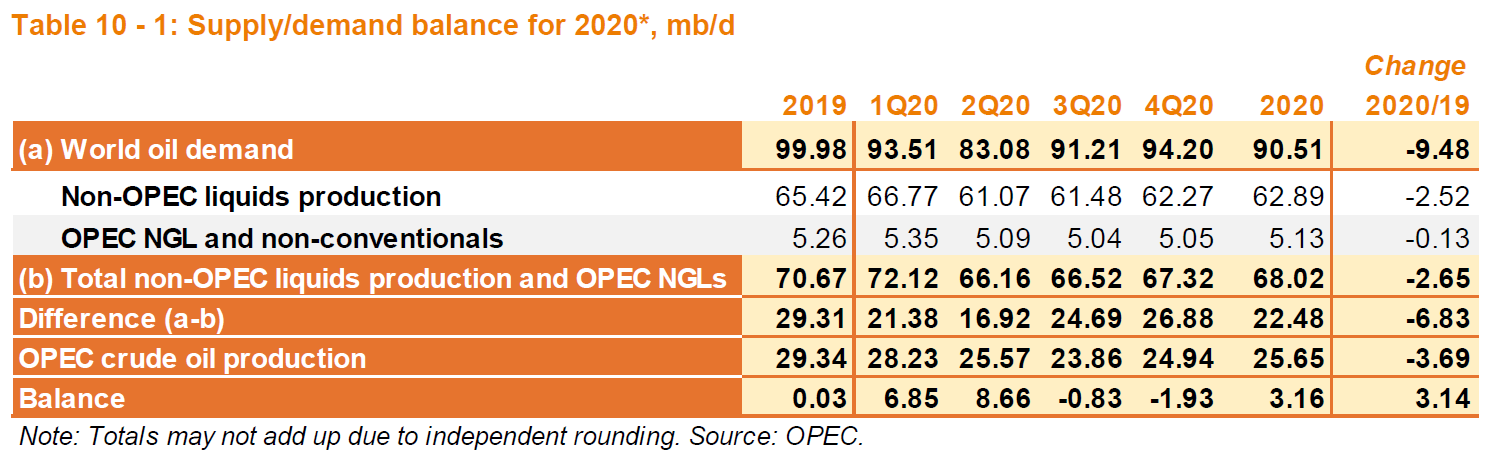
From the IEA Oil Market report in May (excerpt below) we have a higher estimate of 93.4 Mb/d.
Both reports are likely using preliminary data which will be revised in the future, the difference is 340 kb/d of a 93,060 to 93,400 kb/d total an error of 0.36%. The OPEC world oil supply estimate for April 2021 is about 6.5% less than the current World oil supply estimate for April 2020.
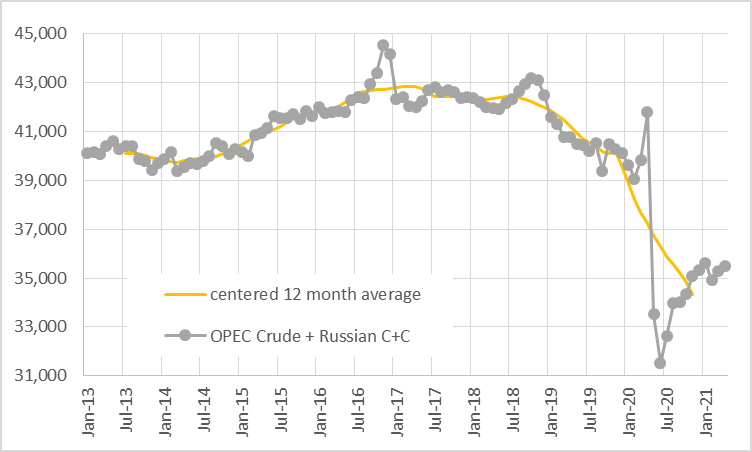
The chart above uses data from the Russian Energy Ministry and converts from metric tonnes to barrels at 7.3 barrels per tonne, the combination is OPEC crude plus Russian C+C output. Russian output increased by 196 kb/d in April 2021 to 10417 kb/d, OPEC13 crude + Russian C+C output increased by 222 kb/d in April 2021 to 35500 kb/d. The centered 12 month average OPEC crude plus Russian C+C output in Nov 2020 (most recent data point) was 34310 kb/d a decrease of 524 kb/d from the Oct 2020 level.
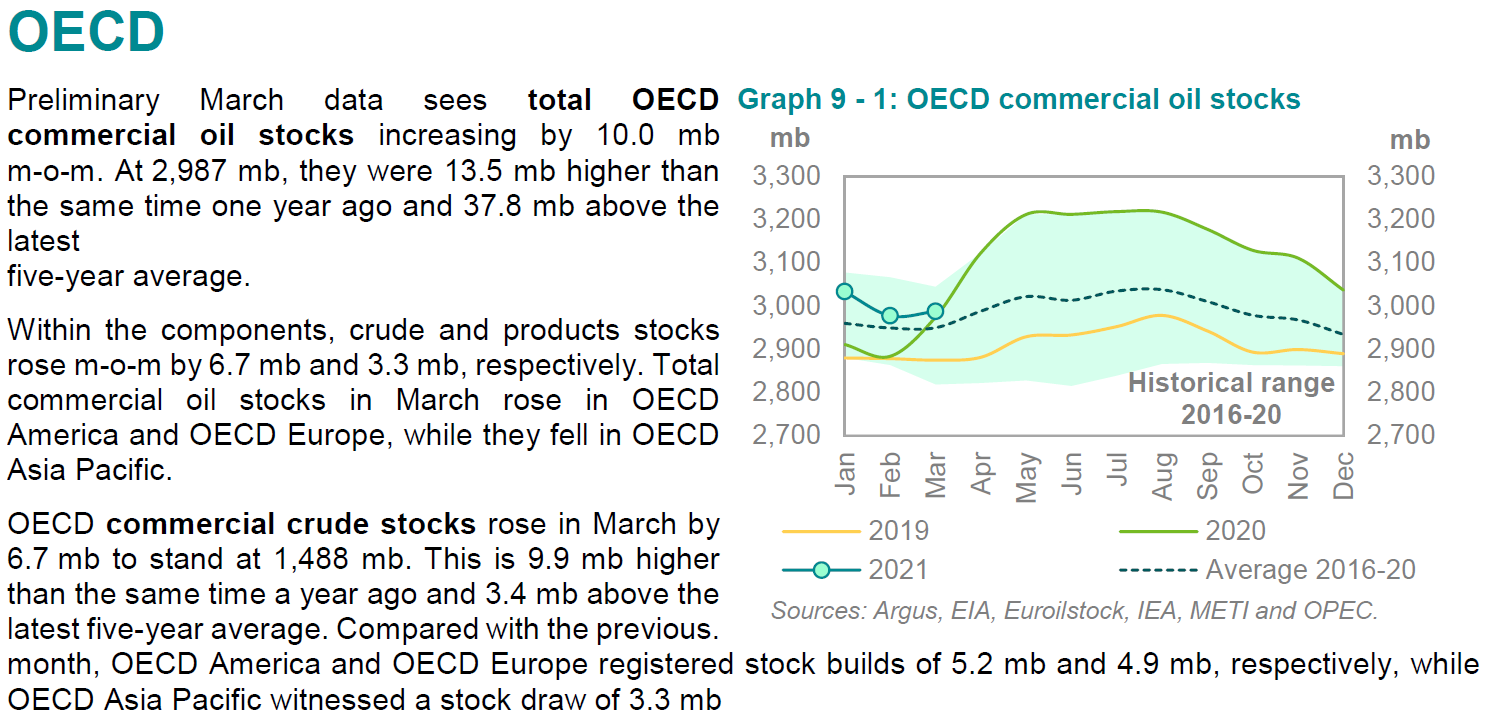
The OPEC stock estimate for March 2021 above is different from the IEA estimate below, the average of the two estimates is a commercial stock draw of 7.5 million barrels and put OECD stocks at about 20 Mb above the 5 year average.
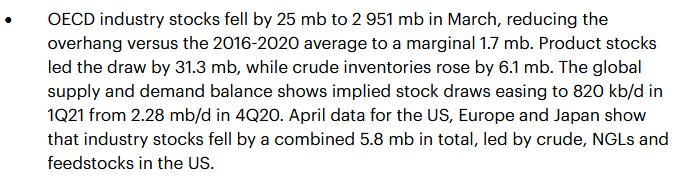
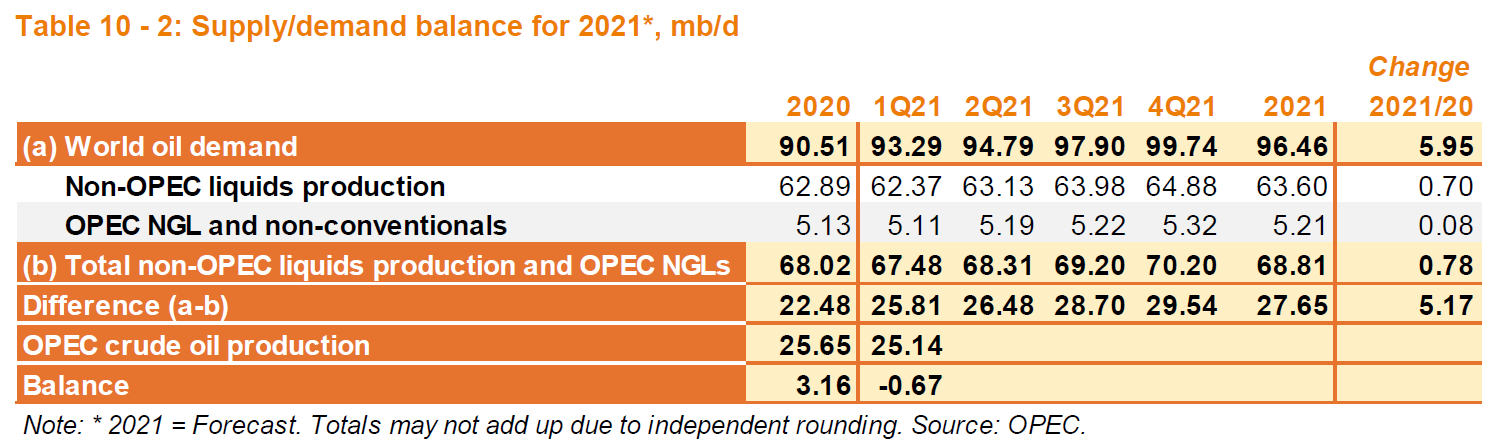
If the balance between supply and demand were to remain at 670 kb/d deficit as OPEC estimates for 2021Q1, then we would be at the 5 year average OECD commercial stock level by the end of April 2021. This may explain the rising oil price level. My guess is that if the OPEC demand estimate for 2021Q4 is correct, that OPEC could easily meet the 29.54 Mb/d output level needed for 2021Q4. As oil prices rise, the estimate for non-OPEC output in the May MOMR may prove conservative, so a spike in oil prices (to over $85/bo for Brent) seems unlikely in 2021.
Tks Dennis for the post . In the meanwhile problems continue to mount .
https://oilprice.com/Energy/Energy-General/First-Venezuela-Now-Ecuador-US-Refiners-Need-A-New-Source-Of-Heavy-Crude.html
hole in head,
You’re welcome.
I think Canada has all the heavy oil the US needs, even without pipelines it can be shipped by rail, though pipelines are both safer and more efficient, so the rail option is not ideal.
The US has all the heavy oil the US needs for that matter.
USGS calls about 170-270 BBO of Bitumen and Heavy oil resources remaining. People here just havent thought about it nearly as much.
An interesting one here
THE BAKKEN, A SNAPSHOT FROM 40 000 FEET AS OF END 2020
https://runelikvern.com/2021/05/10/the-bakken-a-snapshot-from-40-000-feet-as-of-end-2020/
This was posted by Survivalist at the fag end of the last post . An excellent find so I am bringing it forward so for those who missed it
Yeah thanks for keeping that one in the mix. US LTO looks more like a wealth redistribution program than it does a wealth creating enterprise.
Mr Likvern is well worth following. I like his spicy takes too!
Comment by Rationalluddite on OFW on Rune’s article . Simple and easy to understand .
“Bakken needs min of $120 USD per barrel to be viable, before even including investment in new fields.
It’s so bad in general in US tight oil that the “nationalise the oil industry top rpretend and extend” may not even be an option.
Unless a miracle occurs, the USA will be down 6 million plus barrels a day from August 2018 levels by late 2024. Better hope people are still accepting the ponzi $ or it’s Great Reset (aka Western final great bankruptcy) replacement or things will get … jiggy. “
Hole in head,
Permian basin is quite profitable at $80 per barrel, doubtful that US output is 6000 kbpd in 2025, but perhaps 10000 kbopd would be a more reasonable guess for 2025.
Dennis , the $ 120 figure is from Rune’s article . You can read about how he came to the conclusion . 6000 Kbpd by 2025 , I give it a +50% chance . 2021 the average will be +/- 11000 kbpod and will drift downwards . As I have already said 12.896 mbpd never ever again .
Hole in head,
If oil prices are low, US will never reach the 2019 peak again, if they are higher it is possible imo. I was referring to the comment you referenced, Likvern made no mention of 6 Mb/d for US output in 2025 and yes he believes $120/b would be needed in Bakken for output to expand, I think output in the Bakken will mostly be lower, especially at a low oil price. I think $75/b might be enough to raise output in the Bakken, but only by a small amount above the current level, URR will probably be around 7.5 Gb, if oil prices rise to $71/bo or so for WTI (in 2020 $). Lower oil prices will lead to lower output.
Rune called the BS on PDP . He is not the only one . There are other’s also . Shale is a scam . What scam ?
1. Investment scam . Lost $ 300 billion .
2. Employment scam . Better to pay workers than for them to pump up the unemployment figures .
3. Income distribution scam . That is what the governments do anyway .
4 . ” Loot and scoot ” scam . Leave the investors ( pension funds ) holding the ” s^^^ bag” while the executives earn five figure salaries along with a golden parachute .
https://www.oilystuffblog.com/single-post/too-much-by-half?postId=94be4903-bb60-46ce-bfd2-19a67b3ef928
Disclaimer : I approve of the scams because they enabled kicking down the can of the collapse of industrial civilisation by 10 / 12 years and we all benefited from it . It was a party but unfortunately all parties must end . Enjoy it while it lasts .
40 % collapse in demand expected .
https://www.argusmedia.com/en/news/2215138-indias-fuel-use-to-take-bigger-hit-as-covid-spreads
Thanks Dennis! Much appreciated 🙂
You’re welcome
Bakken (Not ND) March output was reported on Friday. Production was up by 24 kb/d and the number of wells increased by 324. Output per well was 76 b/d down from a high of 108 b/d in November 2019.
Ovi , the red queen effect . The treadmill is catching speed .
HH
She may be running faster but she is still around.
Bakken scenario for Brent oil price scenario which rises to $75/b maximum in 2020 US$, cumulative output to 2040 about 7.4 Gb and 22 thousand total wells completed for the scenario. Clearly this is one of an infinite number of possible scenarios for future Bakken output, odds of correctness = zero.
Good production modelling, bad price modelling. I believe we’ve passed peak oil demand; the pandemic accelerated it by a few years. It was originally scheduled for 2025-2030, but the crash in demand due to the pandemic happened, and the pandemic is not over, and will not be over this year. By the time world demand recovers from the pandemic the long-term effect of switching to electric vehicles will be dominant.
The US is a laggard in EV sales (probably because of domestic oil production), so look at the rest of the world for the trend. Cars which plug into the wall are over half the new car market in Norway, 16% in Europe, 11% in China, and accelerating, increasing about 45% per year in most markets. Global automobile sales peaked in 2017; the plug-ins are replacing scrapped gasoline cars. Even in a year with a big boom in car sales, such as the one when there’s a rebound from the recession, global sales are only expected to grow 10%, less than the plug-in marketshare. This means total oil demand from automobiles drops every year from now on, at an accelerating rate.
Almost all oil demand is for automobiles. Scrappage runs at 5% of the cars on the road each year in the US; it is probably similar elsewhere. When 25% of new cars sold are plug-ins (likely true in 2022 for Europe), you get a 1% underlying drop in oil demand that year. It’ll take a little bit longer for the varying global markets to reach there (maybe 2023 or 2024 — it’s mostly limited by how fast factories are built). As the EV percentage increases each year, four years later you have a cumulative 12% drop in demand. After that, all new cars are electric and it stabilizes at 5% drop in oil demand each year, equal to the percentage of old cars scrapped.
I think you know just enough about oil economics to realize what a 5% drop in demand each year does to the oil price. It requires massive cuts in production to prevent the price from crashing through the floor below $0. $66 Brent is unsustainable — right now it’s only sustained by OPEC cutbacks — and $75 Brent is a fantasy.
Nathanael,
We will see, I have a slight update of price profile in chart below. Prices rise to $75/b (2020$) by 2024 remain at that level until 2035 and then decrease. I think the transition to EVs will take longer than you imagine. The future is not known, we are both likely to be wrong.
Passenger demand is tiny. You could replace most of the world with EV and still use 80 MMBOPD.
Dennis
Looking at the middle of 2021, the model is showing 60 new wells per month. As of May 14th, there are 16 rigs operational in ND. Can 16 rigs drill 60 wells in one month?
Ovi,
Rigs can increase and DUCs can be completed, also the scenario is likely incorrect, the future cannot be accurately predicted. In March 2021, shaleprofile estimates 51 wells were completed (first flow wells) in North Dakota Bakken. My scenario has 52 wells completed in March 2021, increasing to 60 wells per month by July 2021. It is a guess about the future, based on rising oil prices.
Since you are good at production modelling, I would appreciate it if you made a model based on declining oil prices, which is what’s actually going to happen IMO. Humor me?
Nathanael,
I will do it one time, give me a list of annual average oil prices so I get it right.
You do see the trend in Brent oil prices is up with an increase of $20/bo over the past 6 months.
A low price scenario below with max Brent price of 62.5/b (2020 $) from 2025 to 2030 and then falling to $40/b by 2041, low probability that prices will be lower than this (less than 10% imo).
Dennis
So it looks like one rig can drill somewhere between 3 and 4 wells per month in the Bakken.
I note that ShaleProfile says that at least 30 rigs are needed to keep output above 1 million b/d. That is almost double the number they have now.
Ovi,
In the scenario below, I have completed wells gradually increasing to 90 wells per month in July 2024 from a guess of about 48 new wells completed in Jan 2021 (an increase of 1 extra well completed each month over the period). Output for the North Dakota Bakken increases from a low of 945 kb/d in Nov 2021 to a high of 1031 kb/d in Jan 2025, well below the previous peak. The 90 wells could likely be completed with the 30 rigs which Enno Peters has estimated, a quicker ramp would lead to a higher peak of about 1100 kb/d, still well below previous peak output. The scenario is conservative in my view with URR of 7.2 Gb (about 3.8 Gb cumulative output to date) and a total of 21000 tight oil wells completed (my estimate is about 15500 tight oil wells have been completed through March 2021) in the North Dakota Bakken/Three Forks.
Ovi,
I have not looked at that, I imagine some completed wells are from DUC wells, the inventory will deplete and more rigs will be needed in the future. They will add rigs as needed, I would guess 25 rigs might be enough to get output to 1000 kbopd, but I may be wrong. My scenaro has a max completion rate of about 78 new wells per month, 26 rigs could do it imo.
As they move on to tier 2 locations the rigs required will increase. Can’t be much core left now.
Too add to Lightsout , what if they are drilling children wells as per LTOS ? Flogging a dead horse ?
If we look at Bakken well quality at shaleprofile, there is little evidence that well quality has decreased significantly, in fact at 5 months cumulative production for the average 2020 well was above 2018 and 2019 wells. At 12 months the average 2020 well was at 186kbo cumulative output and the average 2018 well was at 174 kbo cumulative output at 12 months and the average 2019 well was at 169 kbo cumulative output at 12 months. Output went down a bit in 2019 and back up in 2020. See well quality tab at
https://shaleprofile.com/blog/north-dakota/north-dakota-update-through-march-2021/
Dennis
According to today’s May DPR, 69 DUCs have been completed in the Bakken since December 2020. So I will have to relook at the data regarding time to drill a well in the Bakken.
Looks like the Permian is going to carry on adding roughly 50 kb/d/mth.
Ovi,
Shale profile has 38 DUCs completed from Dec 2020 to March 2021 in North Dakota Bakken. So roughly 13 per month for the first 3 months of 2021. So if we assume 16 rigs can drill 48 wells in a month and DUC count continues to decrease at 13 per month, that would be 61 new wells per month. DUC count was at 631 in March so we might assume the 13 wells completed per month from DUC inventory might continue for a while. My scenario has a maximum completion rate of 82 new wells per month ( a level reached in June 2022.) So deducting the 13 wells from DUCs, we would need 69 wells drilled per month, at 3 wells per month per rig we would need 23 rigs, if the DUC count was stable we would need 27 rigs. Note that my scenario does not have stable long term output at 1000 kb/d, that scenario is not feasible based on the economic assumptions I have made. Note also the EUR for my scenario for the average December 2020 ND Bakken tight oil well is about 353 kbo. I assume the average new well EUR started to decrease starting in July 2019 (when EUR is estimated at about 370 kbo), by 2030 the average new well EUR falls to 258 kbo in my scenario, though clearly we do not know what the EUR of wells drilled in the future will be.
JODI data for March is out:
https://www.jodidata.org/oil/database/customisable-charts/jodi-highlights
Saudi crude oil closing stocks in March fell month-on-month again by 1.24 MBBL to all-time-low of 133.34 MBBL since monitoring began in 2002.
Saudi Arabia Crude Oil Exports:
Saudi Arabia Oil Rig Count (Source):
April 30, 2021: 30
March 31, 2021: 31
April 30, 2020: 59
Thanks Pollux, interesting stuff.
Pollux
Thanks for the info and link. Why are stocks going down is an interesting question. Clearly exports and internal consumption are the result of production plus inventory draw. What is the message.
Is the ground work being laid for an upcoming crises?
Now I wonder why ? Things that make you go —hmmm .
https://financialpost.com/commodities/energy/oil-gas/saudi-wealth-fund-loads-up-on-video-game-makers-and-exits-suncor
The Saudis know oil investment is trash and are getting their money into things of value ASAP. I doubt this will save them from revolution as the oil money disappears but it make keep them personally safe.
The State of Canadian Oil Sand Companies.
Oilsands firms expected to spur $60 billion in cash flow over two years: analyst.
The five companies, Canadian Natural Resources Ltd., Suncor Energy Inc., Imperial Oil Ltd., Cenovus Energy Inc. and MEG Energy Corp., are expected to bring in $59 billion more in cash than they spend on operations, from which about $23.2 billion will go to capital budgets and about $9 billion to dividends.
The report says that will leave about $26.8 billion to pay down debt, buy back shares for cancellation and use to increase dividends.
More details here.
https://www.bnnbloomberg.ca/oilsands-firms-expected-to-spur-60-billion-in-cash-flow-over-two-years-analyst-1.1604915
Here is the IEA Roadmap to zero emission by 2050.
https://www.iea.org/news/iea-to-produce-world-s-first-comprehensive-roadmap-to-net-zero-emissions-by-2050
“From 2021 on no new oil and gas fields approved for development; no new coal mines or mine extensions”
“[Electricity] will play a key role across all sectors, from transport and buildings to industry. Electricity generation will need to reach net-zero emissions globally in 2040 and be well on its way to supplying almost half of total energy consumption. This will require huge increases in electricity system flexibility – such as batteries, demand response, hydrogen-based fuels, hydropower and more – to ensure reliable supplies”.
——-
Absurd fantasy! And a couple of years ago IEA said that we need to find more oil fields so that we do not run short soon.
IEA publishes reports that identify the policy needed to guide countries where they want to go. When the agency was created after the 70s oil crisis, its main purpose was to ensure energy’s availability. Lately IEA has extended its mission into guiding countries through the decarbonization path.
Those two missions are sometimes antagonists and the message becomes a bit puzzling. On the one side they say: “If you want to ensure energy stays available in the mid-term, far more investments are needed ASAP. And even that may be too little, too late.” On the other side, they say: “You committed to carbon neutrality, Paris agreement and so on; if you want to be consistent with this goal, you need a massive change of policy. Starting by stopping all investments in fossil fuels.”
Reading through the lines, this means that a clear choice shall me made urgently to avoid cognitive dissonance. Signing for ever-higher goals is not a policy.
As I read it, the main message of the latest report is the urgency of the needed changes.
Everyone wants to go to heaven but no one wants to die in order to get there. The lack of investment for replacing hydrocarbons coupled with investors demand for dividends sounds a lot like the business model of the failed MLPs in the early 2000’s. There is no way to distribute cash and grow except for the Majors who enjoy other income sources. We haven’t begun to see the ramifications of the past year and a world economy opening up. Lumber prices, labor sitting on the sidelines (stimulus heroin), steel prices and everything is in short supply. Energy in whatever form will be in short supply as well. I anticipate much higher energy prices coming our way soon.
LTO Survivor,
I agree energy prices are likely to rise, if demand increases as the pandemic subsides, my guess is $71/b for WTO by the end of 2021 and perhaps $80/b for WTI by the end of 2022 (both in constant 2020 US$).
Do you have a WAG for future oil prices?
My “WAG”
Oil pricing has been on a upward run since late October. I’m expecting it to continue until late summer or early fall when the driving season ends. Bumping up against $80 at times as inventories tighten before a pull back from lower winter demand. $70 plus or minus $5 at the end of the year should be within one standard deviation. Ending the year below 60 must be more than a two percent chance.
Frankly it’s hard to imagine energy prices rising with electrification and zero marginal cost renewables spreading as quickly as they are. A more probable outcome is reduced reliability.
For example, it is sometimes claimed that solar is inferior to coal because it doesn’t produce energy at night. That depends on your definition of inferior. The interesting question is whether this argument will save the coal (and gas) industry from bankruptcy.
In the same way, batteries shortages and deficiencies are often upheld as reasons why the current internal combustion engine and liquid fuel industries will not die.
It’s important to keep in mind that a new technology doesn’t have to replace a previous industry to kill it. It is enough to make it unprofitable.
A good example of this is the album business that kept the music industry afloat for decades. Bundling singles into albums with a lot of lower quality music forced fans to pay thirty bucks for two singles. Apple forced the industry to sell singles instead. Total sales collapsed, but the old business stayed dead.
Another example is services like Zoom, which are much better in many ways than traditional telephony, but much less reliable. In fact, in terms of reliability, telephone service is horrible compared to what we had in America back in the 60s. But nobody wants to go back. And whether some diehards do or not, old fashioned telephony is no longer a viable business model.
Is there a reliable business model around vehicles with longer range than a battery can offer? Does it really matter if the power goes out at night? I mean does it matter enough to accept old the style utility business model?
One way or another it seems hard to imagine energy prices going up.
“One way or another it seems hard to imagine energy prices going up.”
I think it has to do with timing. Energy (oil) prices could go very high in this decade since most of the world does not yet have access to electric vehicles. It will take a long time to replace the current global fleet of ICE vehicles with the more energy efficient electric versions. For a very large fraction of the population, it makes economic sense to extend the life of their current [ICE] vehicle as long as possible.
Hickory —
Fuel consumption is highly skewed among vehicles. some are heavily used, and some rarely.
Because electricity is so much cheaper than liquid fuel, and EVs have lower maintenance costs, owners of vehicles that are heavily used will have a strong incentive to switch. Owners of lightly used vehicles will hang on to them.
In the coming decade, battery availability will continue to constrain EV production, but oil consumption will fall faster than EV market share rises, because heavily used vehicles (like delivery vans and taxis) are more likely to switch than lightly used vehicles.
But I agree that the oil industry is still insulated against change by the large existing fleet and will be for a few more years. It’s the vehicle industry that is feeling the pain of electrification now.
Alimbiquated,
I agree over the long term (15 to 20 years) energy prices will fall rather than rise, shorter term (next 10 years) I expect we will see rising oil prices and natural gas prices as the transition won’t be fast enough to bring demand below the level of supply and rising prices will be needed to destroy enough demand to balance supply with demand. Coal might see falling prices as demand might fall faster than supply as natural gas, wind, and solar take market share from coal in the electricity sector, even over the short term.
Timescale is tricky here; I’ve spent a *lot* of work and time working out the timing of EV, solar, and wind adoption. Oil demand has already passed its peak, worldwide. It is going to appear flattish for a few years (with wobbles), but will start dropping visibly and quickly by 2025 (possibly 2023).
In order for oil prices to rise, oil supply has to drop really very fast. The people who know production-side stuff may understand this better but I’m not seeing OPEC or NOPEC having the ability to reduce supply fast enough to raise prices after 2025.
That IEA Roadmap is not a prediction.
Simply, it said that if net zero emission was goal, than these kind of changes need to be made.
I think that for close to 100% [99.99] of people, net zero carbon emission is a weak secondary goal (if even a goal at all) compared to the goal of having plenty of energy available at a whim.
There does seem to be a disconnect among many, not realizing how fragile is the flow of energy to their local pump or plug.
The idea of net zero carbon emissions is still a far off theoretical thing for almost everyone. Maybe someone along the gulf coast gives the concept a 20 second thought when a hurricane dumps 40 inches of rain and their drywall is soaked up to waist level.
Many companies or countries are saying they will have netzero carbon emissions policy by 2040 or 2050. Thats the equivalent of saying that when there is not much oil available, that we won’t use much oil. And besides, someone else will be in charge then- they think to themselves.
Hickory,
The key is to enact good policy that puts needed infrastructure in place and supports low carbon sources of energy.
Before long carbon intensive energy becomes more expensive than low carbon energy and the magic of the market will cause carbon emissions to plummet.
As you know, that whole transition is a project unparalleled in human history in such a short time (a couple decades) and at such scale. The ‘good policy’ and market magic are unlikely to guide this transition in any sort of smooth manner even if it is theoretically possible, I suspect.
Hickory,
I agree it is unlikely to be smooth, but with good policy (carbon taxes and infrastructure investment) a transition can happen quickly when costs are pushing that way. Consider the speed of the transition from horses to autos, in 20 years ICEVs will be like the horse was in 1940, most land transport will be electric. Likewise electricity from coal and natural gas will no longer be able to compete with wind, solar, and hydro in 10 to 15 years, their use for electricity production will plummet and heat pumps will replace natural gas heat in most climates, ground source heat pumps in near arctic.
Colombia oil producers closing taps as unrest persists
“Anti-government protests and roadblocks are forcing oil producers in Colombia to shut in wells, dealing another blow to the non-Opec exporter.”
More bad news about Colombia.
Colombia’s Oil Industry Is On The Brink Of Collapse
Colombia’s oil industry is yet again under considerable pressure, despite the national government in Bogota attempting to reactivate the economically crucial sector. The March 2020 oil price crash, COVID-19 pandemic, rising security risk and now significant political turmoil are weighing heavily on the oil industry’s performance. After a rough 2020 where Colombia’s five-month long quarantine lockdown sharply impacted operational activity and crude oil production, there are signs that the Andean country’s oil industry is struggling to recover. This comes after a moment of optimism in late-2020 where it appeared that Colombia’s hydrocarbon sector was on track to return to a pre-pandemic tempo of operations. The latest data from the energy ministry for Latin America’s fourth largest economy indicates that is not the case. During March 2020, Colombia pumped a daily average of 744,715 barrels of crude oil and 1.2 million cubic feet of natural gas, which is a 0.14% and 5% less than a month earlier.
More worrying are signs that Colombia’s hydrocarbon sector is struggling to recover from a devastating 2020. A reliable de-facto indicator of industry activity is the Baker Hughes rig count. The latest data shows that by the end of April 2021 there were only 16 active drill rigs in Colombia, which while 2 more than a month earlier is nearly half of the 30 operating at the end of April 2019.
A key reason for the sharp decline in drilling activity is a lack of investment. According to Colombia’s leading industry body the Colombian Petroleum Association (ACP – Spanish initials) oil companies will invest (Spanish) $3.1 to $3.45 billion during 2021. While that is significantly higher than the $2.05 billion invested in 2020, it is still substantially less than $4.03 billion industry investment made during 2019. Colombia’s high breakeven prices, estimated to be around $40 to $45 per barrel after-tax, are a deterrent to investment. Breakeven prices for onshore oil projects in the Andean country is significantly higher than many other Latin American jurisdictions including offshore Brazil and Guyana.
There is more to this article, and graphs, and a video.
You know, shutdowns of Venezeula and Colombia are pretty much the only things propping up the oil industry. Other oil executives should cheer.
Oil Markets Will Face A Supply Crisis Before Demand Peaks
Peak Oil Supply
Though less frequently discussed seriously, Peak Oil Supply remains a distinct possibility over the next couple of years.
In the past, supply-side “peak oil” theories mostly turned out to be wrong mainly because their proponents invariably underestimated the enormity of yet-to-be-discovered resources. In more recent years, demand-side “peak oil” theory has always managed to overestimate the ability of renewable energy sources and electric vehicles to displace fossil fuels.
Then, of course, few could have foretold the explosive growth of U.S. shale that added 13 million barrels per day to global supply from just 1-2 million b/d in the space of just a decade.
It’s ironic that the shale crisis is likely to be responsible for triggering Peak Oil Supply.
In an excellent op/ed, vice chairman of IHS Markit Dan Yergin observes that it’s almost inevitable that shale output will go in reverse and decline thanks to drastic cutbacks in investment and only later recover at a slow pace. Shale oil wells decline at an exceptionally fast clip and therefore require constant drilling to replenish lost supply.
Indeed, Norway-based energy consultancy Rystad Energy recently warned that Big Oil could see its proven reserves run out in less than 15 years, thanks to produced volumes not being fully replaced with new discoveries.
According to Rystad, proven oil and gas reserves by the so-called Big Oil companies, namely ExxonMobil, BP Plc., Shell, Chevron, Total (NYSE:TOT), and Eni S.p.A are falling, as produced volumes are not being fully replaced with new discoveries.
There is a lot more to this article than I quoted here. This section came near the end. But I am quoting it because there are just not many articles on Peak Supply anymore.
On one hand the author states “Luckily, this is the scenario that’s likely to dominate over the next decade” referring to business as usual scenario, with “loss in demand of less than 1% per year through 2050.”
On the other hand he points out that oil reserves are not up to the task of supplying that demand-“Indeed, Norway-based energy consultancy Rystad Energy recently warned that Big Oil could see its proven reserves run out in less than 15 years, thanks to produced volumes not being fully replaced with new discoveries.”
These two scenarios cannot coexist. If they were both to be true, there would be massive shortage of oil before too long. Consumption cannot be higher than production (once storage is exhausted), obviously.
The speed of oil depletion, the degree of disruption of oil production by various human factors, and the speed of electric transport introduction are all now the big players in the race. The new entry into the race is the electricification transport, just as shale oil/gas was 10 years ago. Except that electric transport is a not about to deplete in anyones here lifetime, and will be a viable mechanism in every single country, not just USA and Canada.
Fracking, and then Covid pandemic both kicked the crunch time can down the road.
Whats next. South China Sea?
The business as usual scenario by BP might be correct through about 2030, after that output will fall, but demand will be falling as well by that time, if demand falls faster than supply, oil prices will start to fall until the fall in demand slows to match supply, but supply will fall faster at low oil prices as less of the resource will be profitable to produce. If supply falls faster than demand, then prices will rise so that demand falls more quickly and supply falls a bit more slowly than a low oil price environment.
My guess is supply will follow one of the demand curves in the chart below, depending on the speed of the transition to electric land transport (which depends in part on policy choices made by governments, along with technological developments).
One factor in this not often mentioned is the effect that higher oil prices will have on the rate of shift toward electricity. If the price of oil goes up too quickly, the cost-saving incentive for people to shift more quickly towards electric vehicles becomes greater. We see that already in many countries of Europe. In Germany, for example, April new vehicle sales included 22% of the total having plugs.
Hickory,
Yes we will see oil prices rise while cost of electric vehicles will fall as battery production ramps up, so both effects will accelerate the move to electric vehicles and reduce oil use.
Your out-year modelling is far too pessimistic; oil demand will drop much, much faster than that. 2025 is roughly the correct starting point for the visible crash in demand. My pre-pandemic model would drop 12% from there to 2030 and then 5% per year thereafter, leaving a residual for non-fuel uses when you get out to 2050.
Since we’re currently at the demand level my pre-pandemic model predicted for 2030, we might see more of a flattening for the next 10 years…
Nathanael,
I doubt the transition happens as quickly as you imagine, if AVs get approved in the next 5 years for widespread use, you could be right, but in my view the odds are low that will be a correct scenario.
I hope you are correct, but think you are wrong.
Try 2040 or farther out for peak demand. You could put 500 million EVs on the road in the next 10 years, and there will still be more combustion engines on the road in 2030 than there are today.
And we are nowhere close to making that many EVs
NET ZERO BY 2050. THE WORLD HAS A VIABLE PATHWAY TO BUILDING A GLOBAL ENERGY SECTOR WITH NET-ZERO EMISSIONS IN 2050
“The world’s first comprehensive energy roadmap shows government actions to rapidly boost clean energy and reduce fossil fuel use can create millions of jobs, lift economic growth and keep net zero in reach.”
https://www.iea.org/reports/net-zero-by-2050
The headline news for all MSN and the trade blogs is that the goal requires all new fossil fuel developments to stop this year or next. Many blogs, not least this one, said this in 2015, immediately after the Paris charade. How the hell they think this is going to happen I’ll be interested to read – it would be orders of magnitude more complicated than handling Covid (e.g. many pension pots would be worthless overnight, stock markets would collapse, house prices in some areas would head towards zero as in Detroit)) and look at how that’s gone (and actually I think, as bad as it is in places, it’s much better than it might have been). Normally I don’t get too far in such reports when the first paragraphs include “growth” and “create jobs” as it means they’ve been written from economist la-la-land.
George.
I posted in the non-oil thread and you responded. Thanks.
The amount of mining required is astounding and the concentration of the materials in a few (not friendly) countries is troublesome also.
We are pondering a solar lease right now. The problem it would take several hundred acres of prime farmland out of production for decades, maybe forever.
With all of the arid desert, waste lands and rooftops in the USA, why are we locating solar in places merely because that is where the present power lines are?
Just like there has been little to no planning regarding US shale development, is the same holding for the energy transition?
Shallow sand,
I agree solar on prime farm land seems a bad idea, but perhaps wind power makes sense.
Shallow Sand. Consider this.
About 27 Million acres of Prime Farmland in the USA goes to corn for ethanol, providing about 1 Mbpd petrol equivalent.
I have seen many reports that the entire USA electricity current consumption [4 Petajoules] could be provided by Photovoltaics on roughly 1/2 of the corn ethanol acreage [I am not suggesting that the corn ethanol cropland be converted to photovoltaics]
For context- the total USA electricity production in 2018 was 38 quadrillion btu equivalent, and the total Petroleum energy content consumed (not just for transport) was 36.9 quads btu equivalent.
https://www.visualcapitalist.com/visualizing-u-s-energy-use-in-one-giant-chart/
And also consider than none of the Photovoltaic needs to be deployed on prime cropland, or even good grazing land. There is a huge amount of land in this country with excellent solar input (insolation), and which is also ranked poorly for agricultural purposes (poor soils or too dry).
Also, consider that grazing can be integrated with Photovoltaics, if the intention is there.
The Solar energy reserves of this country are huge.
Of course, I make no presumptions about your particular land or area.
Hi George,
Can you point me to any posts at peak oil barrel in 2015 that have specifically said there would be no future new fossil fuel development starting in 2015 or 2016? I am not including comments here, but just the posts by various authors, in the comments we let all sorts of discussion take place, much of it I would not agree with. Ron had a different take and thought 2015 would be the peak for World oil output, but I do not think he has ever said that he expected all future new fossil fuel investment in new projects would cease (or not to my recollection.)
https://peakoilbarrel.com/doubting-the-peak-of-world-oil/
see also my comments at link below
https://peakoilbarrel.com/all-roads-lead-to-peak-oil/#comment-552078
Below is a chart I posted in Dec 2015, Ron thought the scenario was absurd (that is, too optimistic). As has often been the case my scenario proved too pessimistic for peak C plus C world production (80 Mb/d peak in 2023 and about 79 Mb/d in 2018) about 3 Mb/d less than actual output in 2018.
At present I expect a peak in World C plus C in the 2028-2032 time frame at about 84 to 85 Mb/d, that too may prove to be lower than the eventual peak in World C plus C output.
https://peakoilbarrel.com/all-roads-lead-to-peak-oil/#comment-551958
No, and I’m not going to waste time looking. I know that at least one poster commented that the rate of decline needed to meet the 1.5 target pretty well matched the natural decline in oil and gas fields worldwide, so there could be no future new developments if that goal was to be achieved. I know because it was me. I can’t remember if it was a post or comment and don’t much care. You seem to be asking about a geological peak oil prediction – I usually tune out when those arguments start and can’t for the life of me see the connection with the IEA paper which considers imposed production limits and climate change (and hence neither with my comment).
Here is my prediction based on data from 1965 to 2019. Theoretical peak centered at 2021.0 with a range from 2020.4 to 2021.6 based on 95 confidence interval. Ultimate centered at 2943 with a range from 2843 to 3017 billion barrels.
These were obtained by logistic extrapolation as shown in the second figure.
This is the parameter estimation plot.
Hi George,
Just wondering what you had in mind when you said:
The headline news for all MSN and the trade blogs is that the goal requires all new fossil fuel developments to stop this year or next. Many blogs, not least this one, said this in 2015, immediately after the Paris charade.
I don’t remember this blog saying that, I don’t read every comment, but I have read all the posts and none to my recollection have said anything close to that.
I guess you may have been referring to your own comment, which seems like it was saying that this was not likely to happen (that is that all future oil and natural gas investment would stop in 2015), I would have agreed that such a scenario would be highly unlikely. The same can be said of the IEA scenario, imo. Investment in new oil and gas projects will continue.
I think I’ve commented that *economic rationality* would mean an end to all future oil and natural gas exploration, but I have also said that it’s completely clear that the oil speculators are not rational and will throw money into holes in the ground and set it on fire.
With assumptions including controlled natural depopulation (no evil plan I hope, which nobody really wants) and reduced energy consumption per capita there can be a plan in there somewhere regarding 2050. IEA choosing to go from one extreme to another does not serve anything other than to alert everyone of the challenges ahead.
We have now got a taste of what it means to cut “luxury” consumption in affluent countries during the covid pandemic. It is a part of modern lifestyle to travel and participate in large gatherings. To cut for example 30% of hydrocarbon consumption can be done, but if it is not done the right way it will harm living standard quite a bit. Aviation and other transportation habits, both private and commercial, are very entrenched. And industrial/agricultural use of the stuff is more or less taken for granted so far. As long as the price of fuel is cheap for the affluent, luxury consumption is not really restrained enough and in a fair way.
As for the transition to solar/wind power and electric transportation it is a scale problem, and it is not likely that we will be able to replace fossil fuels fully. Electricity is a good energy source when using heat pumps/ efficient AC/ electric motors however. Pretty flexible, but we don’t have enough copper, aluminum, rare earth metals etc. to build the needed infrastructure to scale up the use to infinity.
The drive for recycling of metals (especially) is going to be very important in the future, even if a lot of manpower and electricity is required.
Pretty sure nobody is advocating infinite use of energy. There is a lot of aluminum resource and rare earth metals have substitutes, copper can be recycled, and energy can be used more efficiently, currently roughly 60% (perhaps more) of primary energy is wasted as heat that is not utilized, for space and water heating, heat pumps can cut energy use by at least 50%, the transition to lower carbon emissions will take many decades, but technically the first 50% is easier as we approach 90% reduction the task becomes harder, but some say it can be done perhaps to 99%. Also changes in land use practices can help in reducing atmospheric carbon, so there are a variety of approaches, we just need to get to work.
” so there are a variety of approaches, we just need to get to work. ”
Just like ” I got to loose 10kg weight , just need to get to work , but after my Big Mac .” 🙂
Hole in head,
I lost about 15 kg with exercise and a whole food plant-based diet. So forget the F150 (50k new for a nicely equipped truck) and get the Tesla M3 (analogous to skipping the big mac).
Or buy some solar panels (if you have good insolation)
or build a net zero home
or use a heat pump instead of boiler and buy electric power supplied by wind or solar,
switch to a whole food plant based diet (better for health and the planet).
Plant some trees.
etc.
OK , boss . As you say , but some problems .
1. I don’t have a car , only a bike . I don’t even dream of a Tesla because I can’t afford one .
2 . Solar etc . I live in a rented apartment and the landlord won’t even fix my leaking faucet . I have no garden ,so no trees etc .
I am vegan since long . Anyway good suggestions that I will pass on too associates . Be well . 🙂
Actually don’t forget the new F150, cause it’s an EV for $40K before tax credits of $7500, and it’s specs look completely badass! Could be a game changer folks…
https://electrek.co/2021/05/19/ford-f-150-lightning-starts-under-40k-w-300-mile-range-and-can-power-your-home/
The attitude needed for sure. I am a little bit more pessimistic than you. I know a lot about aluminum; it can be used as a substitute to copper and it also very easy to recycle. Exciting, the same can not be said of all other metals in the energy transition. I am also of the opinion that the last 10-20% of hydrocarbon consumption will be the hardest to get rid of. But considering the long tail of some oil fields and possible new green fields, the challenge is more to reduce hydrocarbon consumption to 20% of total energy consumption in the first place. Which would not be easy, dependent on speed and just how it’s implemented.
Kolbeinih,
I agree it will not be easy, many things that are necessary are not easy to accomplish. Carbon emissions will fall to net zero only with carbon capture for the last 10% of fossil fuel use in combination with land use changes and sequestering of carbon in the soil and taken up by plant growth. Lower meat and dairy consumption will also help, with more people adopting a whole food plant based diet.
None of this will happen quickly, it will take 50 years or more.
You do not want to reduce atmospheric carbon unless you would like a few billion people to starve to death.
@Kolbeinih
“IEA choosing to go from one extreme to another does not serve anything other than to alert everyone of the challenges ahead.
It has the merit to highlight the cognitive dissonance in which we are stuck; not IEA, but us, their clients. A clear choice needs to be made ASAP between two opposite aspirations.
I can’t imagine the necessary investments to avoid a supply shock will be made. Therefore, unless we make the decisions to lower quickly and largely our carbon emissions, we will for sure end up with both issues: constrained energy supply and untamed carbon emissions (leading to >2°C global warming in 2100).
My bet is that the fight to maintain the same level of energy consumption per capita is a lost one. As long as we consider current level of consumption (even more growth of it) as a right, we make the problem insolvable. One way or another, we will need to have an adult discussion between our aspirations. Albeit being based on a technical data, this is a cultural issue.
I relentlessly insist (see my post:
http://peakoilbarrel.com/brazil-summary/#comment-714858 ) that the most important response to climate change is adopting regenerative agriculture. Land use is the only major greenhouse gas source which can turn into a sink. I will add to my post linked to above by noting that not only does regenerative
agriculture absorb CO2 out of the atmosphere storing it in the soil, but it vastly improves the capacity of soil to absorb water. So that regenerative farming provides resilience to both drought and flooding. This type of farming not only prevents climate change, it offers resilience to the effects of climate change as well as improved health (see
https://bioneers.org/hidden-hunger-does-food-lack-essential-nutrients-zmbz2105/?mc_cid=533832c1c2&mc_eid=6d08de598c ).
I will also add that peak oil will drive us to regenerative agriculture sooner or later. After the collapse of the Soviet Union, subsidized oil deliveries were halted to both Cuba and N. Korea. Cuba turned to agroecology. They were hungry, but they survived (see
https://en.wikipedia.org/wiki/Special_Period ). N. Korea did not and many starved. Food security is still a major concern for the country (see https://en.wikipedia.org/wiki/North_Korean_famine ).
Schinzy,
I agree this could be an important part of the solution, not sure it will be enough by itself, but I do not think that is what you are saying.
The journal biophysical economics have two recent articles related to decupling/dematerialization (https://link.springer.com/article/10.1007/s41247-021-00086-7) and degrowth (https://link.springer.com/article/10.1007/s41247-021-00087-6). The current trajectory is more resources, not less. The IEA scenario is a very different pathway indeed.
BIG MYSTERY
This morning the EIA updated their weekly numbers and production was flat at 11,000 kb/d. What is surprising is what was reported last week and again this week was the NGPL numbers.
Last week, they reported a drop of 973 kb/d in NGPLs. I thought that must be a mistake. It is there again today. Also the US all liquids dropped from 16,088 kb/d to 15,215 kb/d. That’s a significant drop.
Does anyone have a clue on how to explain this?
I don’t know if it has a link with the weekly numbers. https://www.reuters.com/article/usa-natgas-outlook-idINL1N2MY1VW
JFF
We will have to wait till the next STEO comes out to see if their NGPLs output drops. The latest one shows a steady 5,250 kb/d. Very close to the output before the drop.
Ovi,
There is monthly NGPL data under refining and processing for Petroleum liquids. That is the only good data we have, the weekly data is often far from the mark. This may be one of those times. We will know in August what the real numbers are for May.
Dennis/Ron/Ganesa
Dug threw that vast EIA data base and came up with their monthly NGPLs data. It looks like the weekly NGPL numbers are three months behind according to the EIA. In February, when the winter storm hit, the NG wells were also shut down and the EIA monthly number for NGPLs for February is 4,215 kb/d, same as the weekly number. Coincidence or ?. Difficult to explain a three month delay in weekly data.
https://www.eia.gov/dnav/pet/pet_pnp_gp_dc_nus_mbblpd_m.htm
Ovi,
The weekly data is often based on other estimates, the Feb data came out at the end of April and perhaps took a few weeks to make it into the weekly data, it is likely NGL output increased in March as NG output would have recovered by then. If we look at shale gas output from Permian, Eagle Ford, Haynesville, and Barnett (all mostly in Texas) for March, it mostly recovered to Jan 2021 levels by March 2021 (to 99.6% of the Jan 2021 shale gas output level for those 4 plays). We won’t have natural gas output for all of the US until the end of May. Shale gas output for the four major Texas tight oil/shale gas plays decreased by about 5% in February from the Jan 2021 level, but NGPL output dropped in inland Texas by 33.4% in Feb 2021 from the Jan 2021 level, yikes. I have no idea how long it has taken for NGPL output to recover, perhaps the freeze ups in Feb caused substantial damage that has required several months to recover from.
The issue is quite complex (more than I realized) and covered in following article (my guess was wrong on NGL equipment damage, there are problems upstream of NGL in plastics feedstocks).
https://www.naturalgasintel.com/texas-storm-fallout-festers-in-petrochemical-ngl-sectors/
Ovi,
If you compare the NGL data you posted above and the most recent MER, the numbers are very close up to Jan 2021. Not sure why the STEO is not using the same NGL estimates.
MER at link below see table 3.1
https://www.eia.gov/totalenergy/data/monthly/
NGL data at link below
https://www.eia.gov/dnav/pet/pet_pnp_gp_dc_nus_mbblpd_m.htm
Data below is NGL in kb/d from Jan 2019 to Jan 2021
NGL-EIA NGL-MER
4554 4554
4713 4713
4729 4729
4790 4790
4840 4840
4795 4795
4707 4707
4766 4766
4990 4990
5022 5022
4995 4995
4992 4992
5145 5145
4965 4965
5253 5253
4934 4934
4745 4745
5197 5197
5369 5369
5325 5325
5309 5309
5299 5299
5323 5323
5060 5060
5188 5188
4215 5295
Note that the MER was released a few days before the EIA released the Feb 2021 data, so that may account for the difference for Feb 2021.
Ovi, don’t you think NGPL production drop could be linked with the shutting of the Colonial pipeline? For sure, several refineries of the East Coast may have halted operation temporarily, resulting in lower NGPL production.
Though a small amount NGLs are refined out of a barrel of crude oil, it is only about 1.6 gallons equivalent out of 45 gallons, most NGLs are from gas production. Shutting down a gasoline pipeline would have little effect on NGL production, even if some gasoline refining were shut down.
A barrel of crude oil is 42 gallons but yields 45 gallons of refined products due to refinery process gain.
Worth remembering that most refineries are optimized for gasoline production, with a smaller percentages optimized for diesel or for jet fuel.
This is going to become a problem for them in less than five years. Demand for gasoline is dropping fastest, followed by demand for diesel. Not only will many refineries have to close as overall oil demand drops, many of the remaining ones will have to retool. Who’s going to fund it? Many will close rather than retool.
The refinery overcapacity in the US was addressed temporarily by the shutdown of that giant refinery in Philadelphia after the accident. But the crazies at Exxon are still building more refineries; I wonder who will have to shut down to make room for them.
I’ve been trying to puzzle out the refinery shakeout for a while and have not come to conclusions. It’s already clear that there is a shakeout happening in slow motion and that it will get worse.
Ovi,
This is just problems with weekly estimates, sometimes they are telling us something, in this case probably not, just an error somewhere in the system, monthly data and annual data are the only ones that are useful, in the case of NGPL we only really have the annual data, though there are monthly estimates in the STEO and MER. Basically NGPL is not reported very accurately in the US even on a monthly basis as there are large differences between STEO and MER estimates for NGPL.
Dennis
It will be interesting to see what the STEO reports in its June issue. Will it report the monthly data posted above?
Ovi,
That is unclear, there is a big difference between current MER and STEO for NGL, not at all clear why. Sometimes in large agencies the right hand does not know what the left hand is doing perhaps.
The human factor-
Nordstream2- Is it the business of the USA government to tell Europe where to get its Natural Gas?
“PIPELINES are meant to be safe, reliable and deadly boring. Yet the proposed €9.5bn ($11bn) Nord Stream 2 (NS2) pipeline, which from next year will double the natural-gas carrying capacity from Russia to Germany, is as controversial as energy projects come. In recent weeks the 1,200km undersea pipeline has generated tension between President Donald Trump, Angela Merkel, the German chancellor, and President Vladimir Putin of Russia. For years it has caused rifts between Europe and America, and within Europe. Germany vigorously supports it. Denmark intends to stop it passing through its territorial waters. Poland says it is anti-competitive. Ukraine sees it as a potential Russian noose around its neck. Yet, for all that, dredging has started and workers will begin laying the pipes across the Baltic sea shortly. Why is it such a geopolitical problem? And will it go ahead regardless?
Ukraine is the biggest potential flashpoint. The reason is that NS2 gives Russia a bigger cudgel to bully its neighbour over natural gas. Much of Europe’s gas from Russia to Europe passes via Ukraine, earning Naftogaz, a Ukrainian gas company, $2.8bn last year. This is an important part of the state budget. But after the annexation of Crimea in 2014, Gazprom, the Kremlin-backed energy giant, has played havoc with Ukraine’s gas supplies. Ukraine frets that once NS2 is completed, Russia will divert the rest of its European gas supplies directly to Germany, cutting off its transit income and crippling its economy.”
I don’t see the USA as having any business in all of this. And yet- the USA imposed sanctions to interrupt the project under the last administration-
“The Trump administration fears the pipeline will tighten Russia’s grip over Europe’s energy supply and reduce its own share of the lucrative European market for American liquefied natural gas.”
“Both Russia and the EU have strongly condemned the US sanctions.”
The sanctions related to this project may be ending soon.
Does anyone have any data for Cane creek horizontal wells in Utah?
FYI: Drought is going to impact Frack Drilling:
https://www.willistonherald.com/news/oil_and_energy/drought-prompting-innovations-to-hydraulic-well-fracturing-production-outlook-good-for-state/article_f5d37ae6-a91b-11eb-a1d9-e3317f9278c9.html
“North Dakota’s drought is not only devastating for agriculture, it is also complicating things for the state’s oil and gas industry.”
“Completing a well typically uses 25 acre-feet of water per well. An acre-foot is the amount of water it would take to cover an acre with 1 foot of water —360,000 gallons. That works out to about 9 million gallons to complete one well.”
On the flip side, the drought is preventing a lot of fields from getting planted this spring. I’ve read that states like Nebraska, and the Dakotas have got almost no rain since the beginning of April. Presuming this continues, I think we’ll see some food shortages & sky high food prices by late summer or early fall. No water, no crops.
Oil Price Could Hit A Different Kind Of Peak Oil In The Years Ahead
SNIP most of the article (Notice the question mark after the below headline.)
Price gains on the horizon?
Many still see higher prices, though. If not imminently, then down the line, as recovering demand meets the lack of capex in new production, resulting in a supply crunch.
Despite much talk about peak oil and oil companies writing off assets as potentially unrecoverable reserves, the fact remains a migration to a fossil-free future is going to take many years – decades, probably.
In the meantime, oil will remain a significant energy source while other options are developed. We have probably already reached, or are very close to, peak oil demand.
But what we could have to contend with is peak production.
BP (BP) sees oil demand remaining at 2018 levels of between 97 million and 98 million barrels per day till 2030. It sees that falling to 94 million barrels per day in 2040. It forecasts a drop to 89 million barrels per day three decades from now, according to its most likely forward planning scenario.
However, funders are wary of US shale and almost no offshore fields are in development. Furthermore, investors are actively lobbying oil companies to drastically cut fossil capex in favor of renewable capex.
With all that in mind, oil bulls have an argument that shortages will be a feature down the line.
In the past, we have talked about peak oil as a concept based on rising demand hitting resource limited supply.
But what we could see is stagnant or slowly declining demand hitting rapidly falling supply later this decade.
Ron,
This scenario makes sense to me. One thing that might happen is that high oil prices might accelerate the transition to electric power for personal vehicles, which may bring demand levels down to the level of supply and lead to moderate Brent oil prices in the $70 to $80/b range (2020 US$) from 2025 to 2030, after 2030 we might see demand falling faster than supply, especially if autonomous vehicles get approved and each EV with autonomy serves many customers of Uber and Lyft and travels 100k per year. Essentially one EV then replaces about 4 to 5 ICEV as far as vehicle miles travelled. It might be a pipe dream, but smartphones would have been seen as such 20 years ago.
BP’s estimates of oil demand are far too high.
I don’t have a good grasp on how supply will change, however. It depends mostly on the state of old, conventional oil fields in Saudi Arabia (who are mostly very opaque), Iran, and Russia. Will it fall fast? Depends on how much oil these older fields can pump out if they decide to go full blast. They have an incentive to go just fast enough to shut down unconventional oil, and not too much faster. But they are quite secretive and dishonest about their abilities. Depending on political mood, they have claimed huge reserves and production ability they may not have; and they have claimed that their lowered production is due to production constraints when it’s actually a policy choice to raise prices. So…???
As goes China , so goes the oil markets .
https://finance.yahoo.com/news/china-become-even-more-dominant-210000336.html
DUCs continue to fall. This is actual data, through April. DUCs fell by 241 to 6,857 in April. That is down by 2,011 from the all-time high of 8,868 in June 2020.
Not much happening in the shale patch. The EIA’s Drilling Productivity Report shows US shale projected through June. They still show June projection down over 200,000 barrels per day since the post-pandemic high in November 2020.
It’s absolutely guaranteed that EV prices will drop.
Tesla raises price of Model Y, Model 3 variants — again
https://www.autoblog.com/2021/05/21/tesla-price-increases/
Ovi,
$500 price increases, the claimed range has been increasing, currently the long range variant has a range of 350 miles, vs 310 in the fall of 2018. Price of the standard range plus (250 miles of range) is around 40k. The original standard range was about 210 miles of range (for 35k), the claim by Tesla is that there is no demand for cars with range under 250 miles.
Dennis
I don’t think the price increased because the range increased. Here is a better update on what has happened to Model 3 prices since February. Increases closer to $2,500 to $3,000. The price of a lot of commodities, like steel and copper, are going up and possibly some scarcity.
Soaring Prices Herald Boom Time for Steel Makers: https://www.nytimes.com/2021/05/21/business/steel-prices-boom.html
Here are all the prices of the different versions of the Model 3:
Tesla Model 3 Standard Range Plus: price went from $39,490 to $39,990
Tesla Model 3 Long Range AWD: price went from $48,490 to $48,990
Tesla Model 3 Performance: price stayed the same at $56,990
With these now five price increases in a row, Model 3 Standard Range Plus, Tesla’s cheapest vehicle, has now increased in price from a low of $37,000 back in February to $40,000 – a more than 8% increase in price.
The Long Range AWD version has also seen a significant price increase now coming from a low of $46,490 in March to now going for $2,500 more.
Dennis , not surprising that price is up . I read somewhere that 40% of EV is still oil . Tires , plastics , seats, fittings etc . You are trying to justify this by ” hedonistic ” economics which the BLS uses to report low inflation figures . If you believe BLS figures on inflation or unemployment , I have a bridge to sell you .
hole in head,
See following on US CPI pp 12-13
https://www.nber.org/system/files/working_papers/w22111/w22111.pdf
You are wrong on CPI for US, it does a pretty good job.
Tight oil estimates through April 2021 came out recently.
Output down a bit (about 9 kbo/d) in April from March level and down 231 kbo/d from the Nov 2020 peak. April output at 6923 kbo/d.
It can’t even reach 7.0 mbpd which was just prior to the big freeze . Not surprised , I have said it will drift downwards . Down is the trend as the headwinds gain traction .
Hole in head,
I also expect it will continue to drift lower until June and then will slowly increase unless oil prices fall.
One potential scenario below (for Brent oil prices rising to $75/bo in 2020$ and remaining at that level to 2035) of an infinite number of possible future scenarios, odds of correctness=zero.
Dennis , not important . Nobody cheats geology . A Ponzi is a Ponzi by any name and all Ponzi’s eventually crash . As Ayn Rand stated ” You can run from reality but you can’t run from the consequences of reality ” .
P.S : Disclaimer , I am not a fan of Ayn Rand . RIP
Shale oil play :
Headwinds :
1 . False PDP
2. False accounting
3. Increase in GOR/ WOR
4 . Aging labor force
5. Too much debt
6. 1st acreage is all tapped out
7. DUC’s are only smoke and mirrors .
8. Remember Ralph Nader ‘s book ” Unsafe at any speed ” well for shale is ” Loose money at any price ”
9. Red Queen effect .
These are already in play and will accentuate .
Tailwind :
1. Oil price will MAYBE go to $ 100 .
As Richard Pryor said when caught by his wife in bed with another woman ” Who do you want to believe , me or your f^^^^^g eyes ” . 🙂
Hole in head,
Output increasing until 2030 will make a difference, it will depend in part on prices, profits, demand for oil, and geology. All are included in my model, though potentially the estimates of future prices, costs, and EUR per well will prove incorrect. Note that the model underestimates tight oil output by roughly 400 kbo/d for April 2021 and may prove conservative.
New posts up
https://peakoilbarrel.com/annual-reserve-revisions-part-ii-international-major-iocs/
https://peakoilbarrel.com/open-thread-non-petroleum-may-22-2021/
hello
test
a