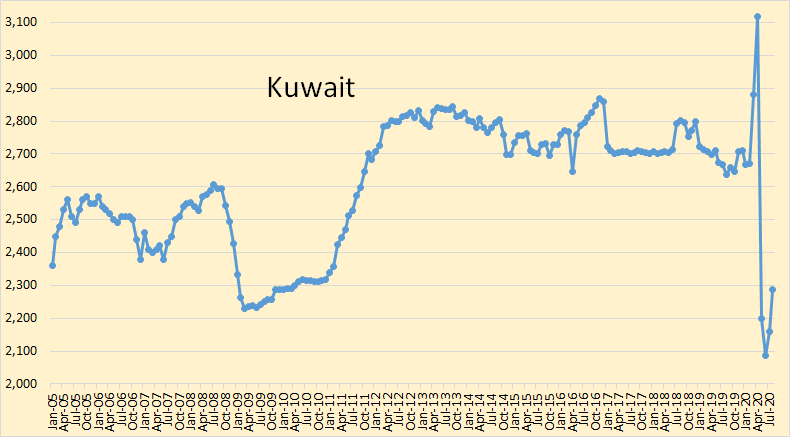
Data for the OPEC charts below are from the OPEC Monthly Oil Market Report and is in thousand barrels per day. All data is through September 2020.
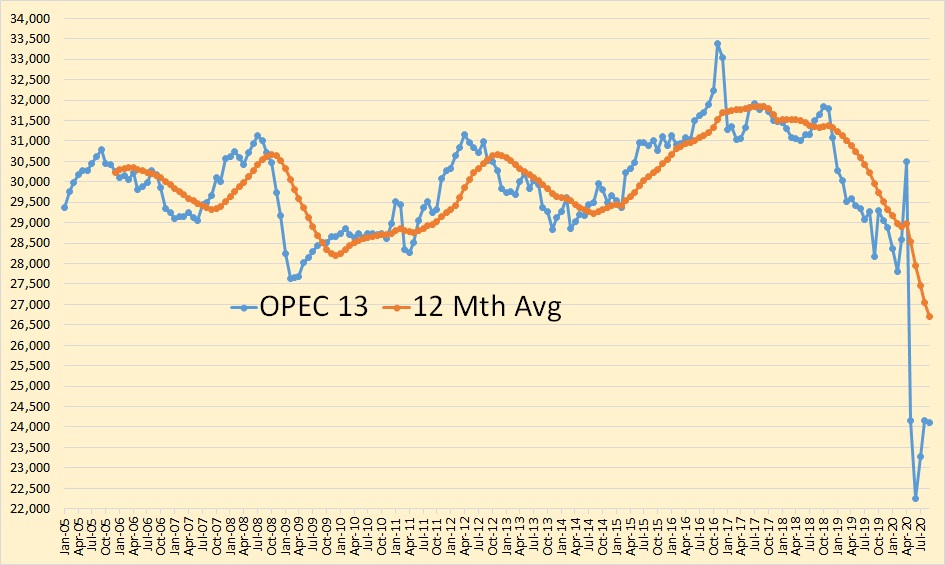
There was little change in OPEC production in September.
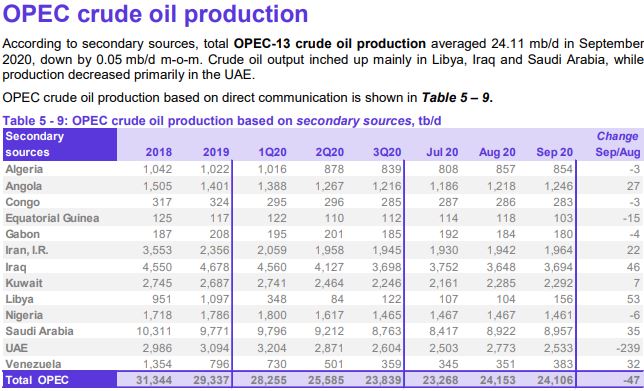
Total OPEC production was down 47,000 barrels per day in September but that was after August production was revised upward by 109,000 bpd.
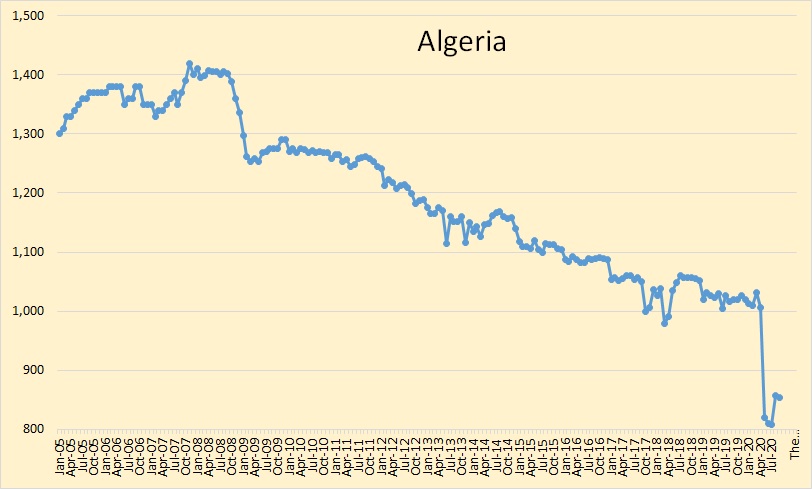
Algeria was basically unchanged in September.
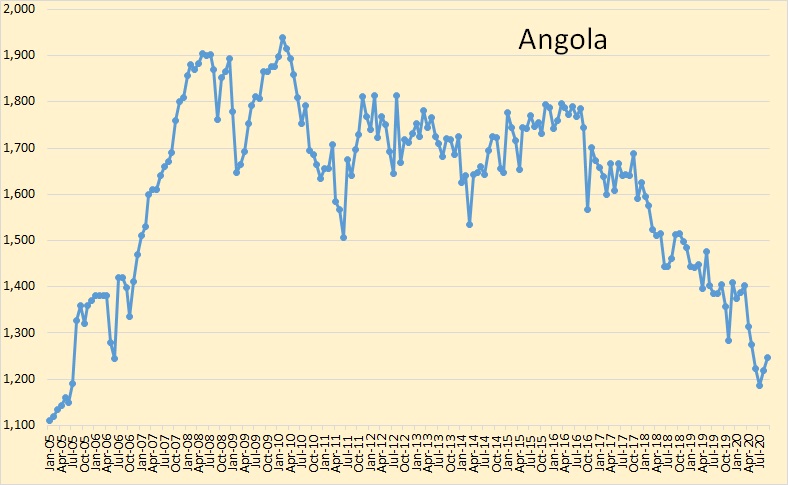
Angolan crude production increased by 47,000 bpd in September.
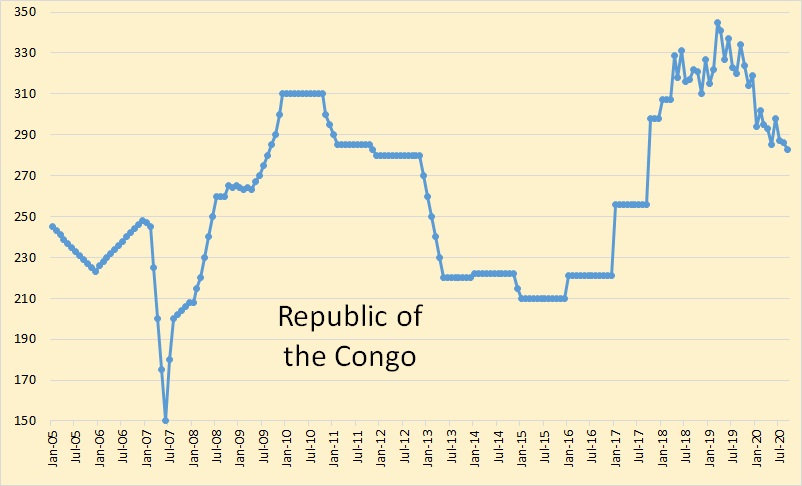
Not much change in the Republic of the Congo.
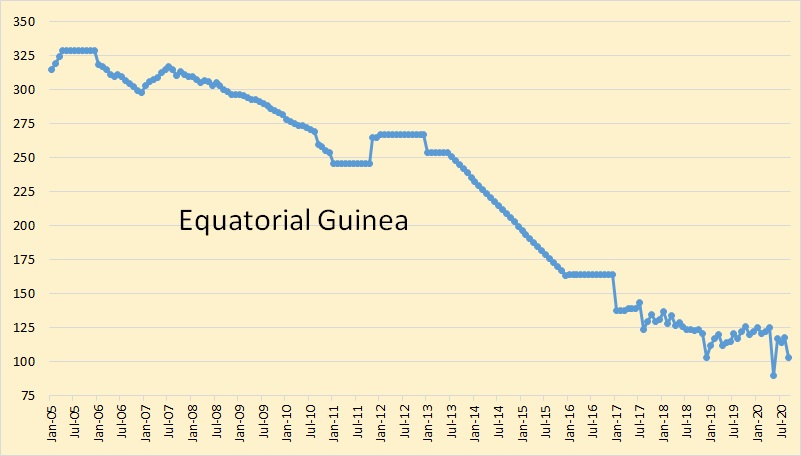
Equatorial Guinea is simply in slow decline.
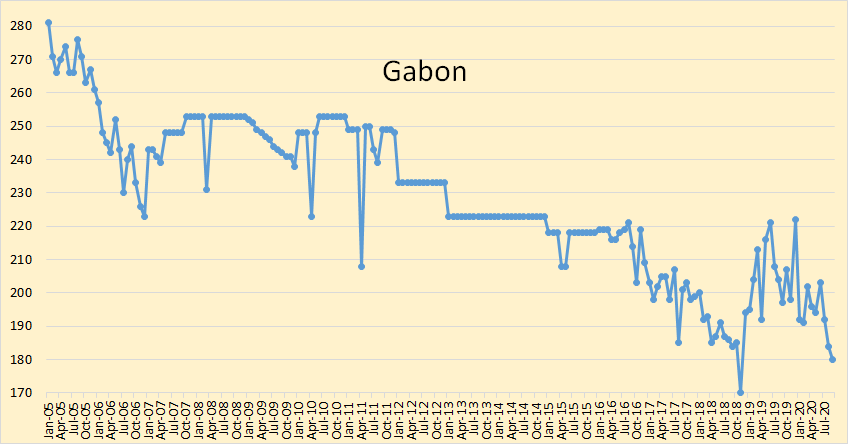
Gabon is also in slow decline.
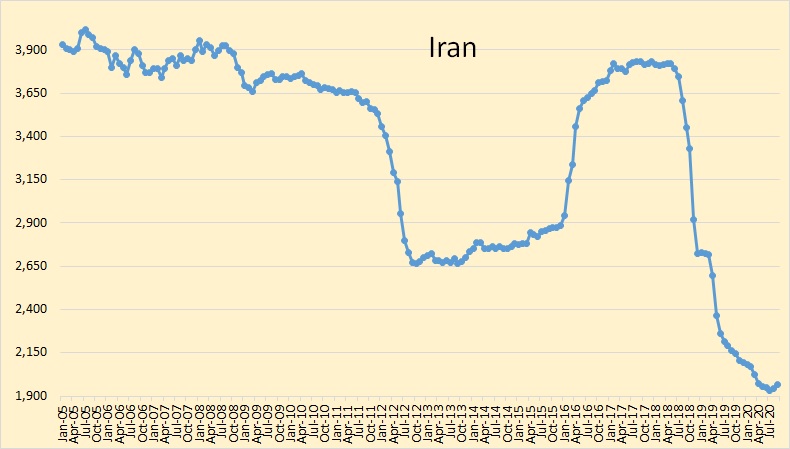
Iran is holding steady but said to be exporting more oil than this chart would indicate.
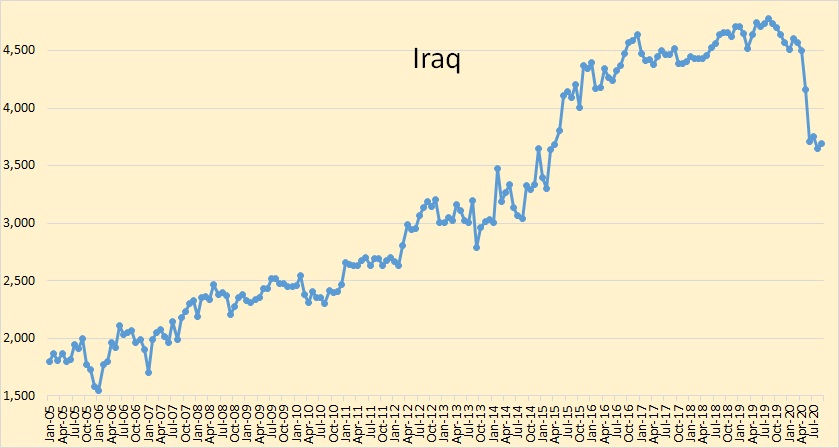
Not much change in Iraq for the last four months.
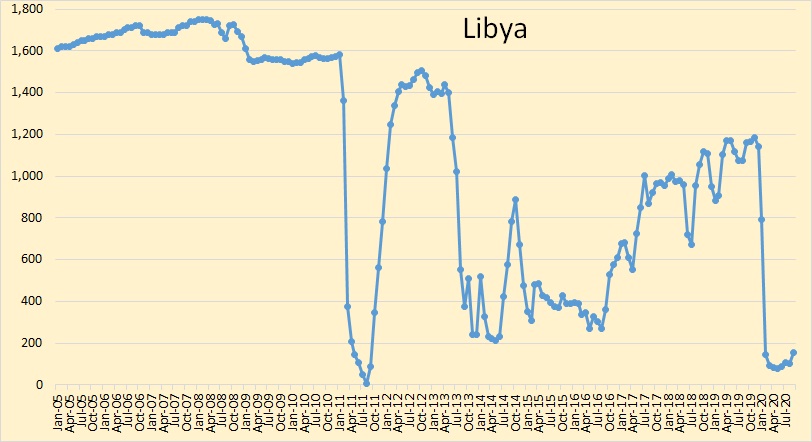
Rebels are still raising hell in Libya. The political situation there doesn’t seem to be getting any better. Parts of North Africa is in almost as bad a shape as Sub-Saharan Africa.
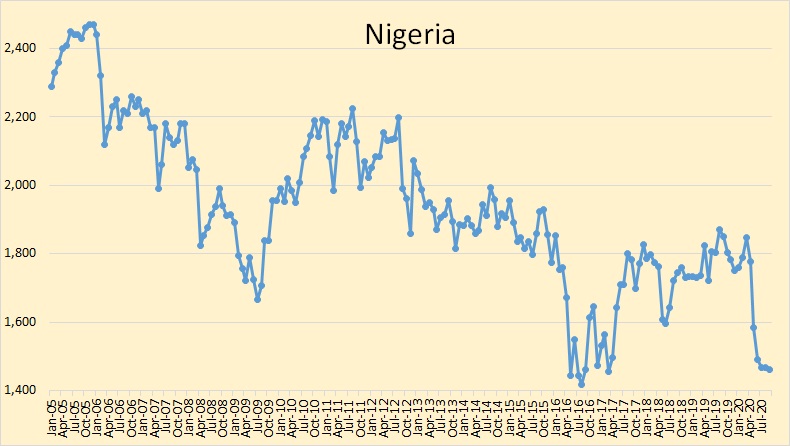
Speaking of Sub-Saharan Africa, Nigeria has had constant political problems for decades. Things will get a lot worse in Nigeria before they get better, and that includes their oil exports.
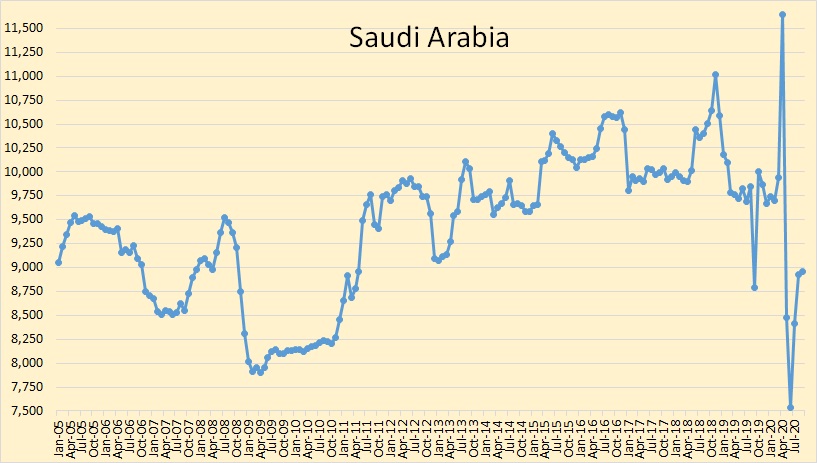
Saudi Arabian crude production was up 35,000 barrels per day in September, however their August production was revised upward by 30,000 barrels per day.
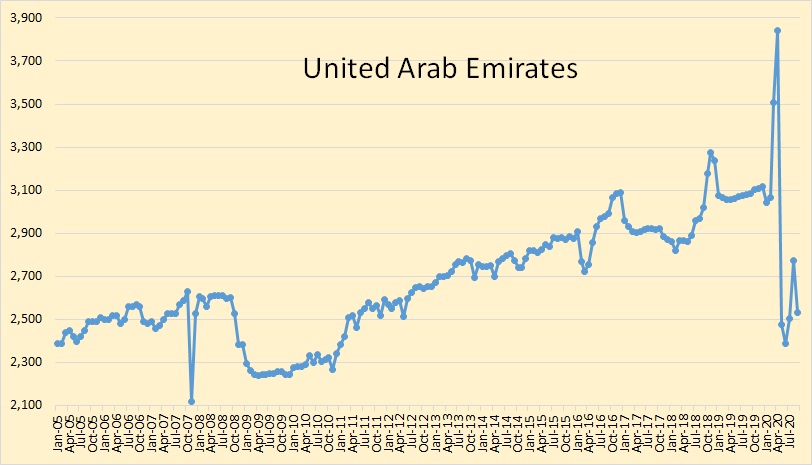
The UAE was the only OPEC nation with any major change in production in September. Their September crude production fell by 239,000 barrels per day in September. However, that was after their August production had been revised upward by 68,000 barrels per day.
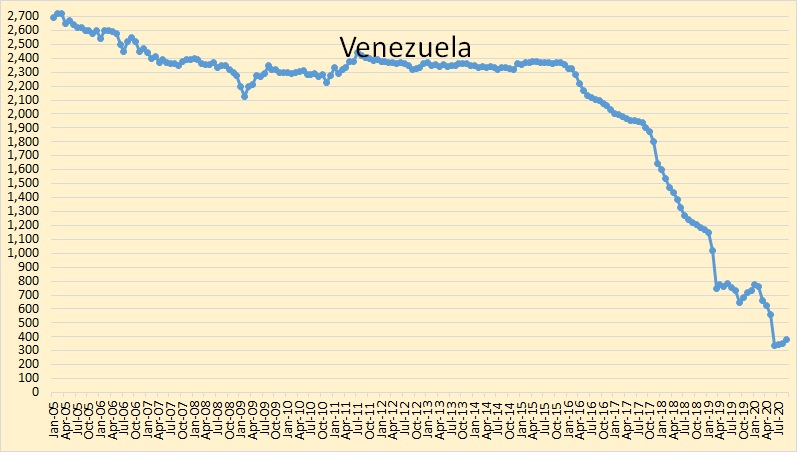
Venezuelan crude production was up 32,000 barrels per day in September. For the last four months they have produced between 300 and 400 thousand barrels per day. Things are likely to get much better in Venezuela for a decade or so because Maduro is starting to cannibalize the Orinoco pipeline for scrap metal to pay contractors.
Venezuela Is Tearing Apart Oil Pipelines to Sell as Scrap Metal
(Bloomberg) — Venezuela’s capacity to produce some much-needed gasoline and diesel of its own hinges on a single oil play. To tap it, the Nicolas Maduro regime is willing to cannibalize the country’s crumbling energy infrastructure to pay contractors with scrap metal.https://products.gobankingrates.com/r/d9360ea31bf06ea8b9d0ef49288e28fb
Unlike the tar-like crude from Venezuela’s Orinoco region, the light oil from Monagas state is the only kind that’s easy to process into fuel at the country’s aging refineries. It’s also the only area where production doesn’t require the help of sanction-wary partners.
So, with the U.S. considering further steps to curb the country’s fuel imports, cash-strapped state producer Petroleos de Venezuela SA is offering to pay for major repairs at pumping stations and compression plants in Monagas with scrap metal and parts from idled oil facilities, people familiar with the situation said, asking not to be named because the information isn’t public.
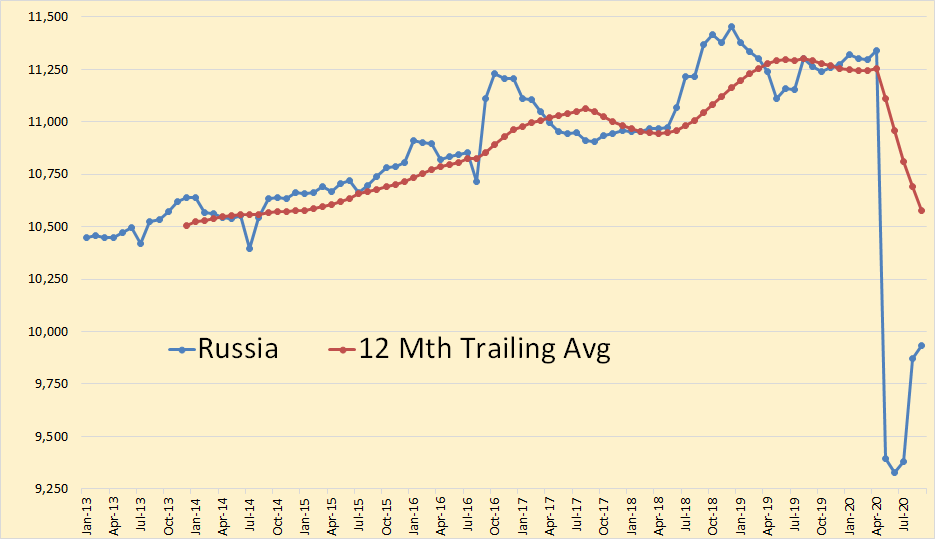
Russia is the only other oil producing nation that has production data for September. Russia’s C+C production was up 61,000 barrels per day in September
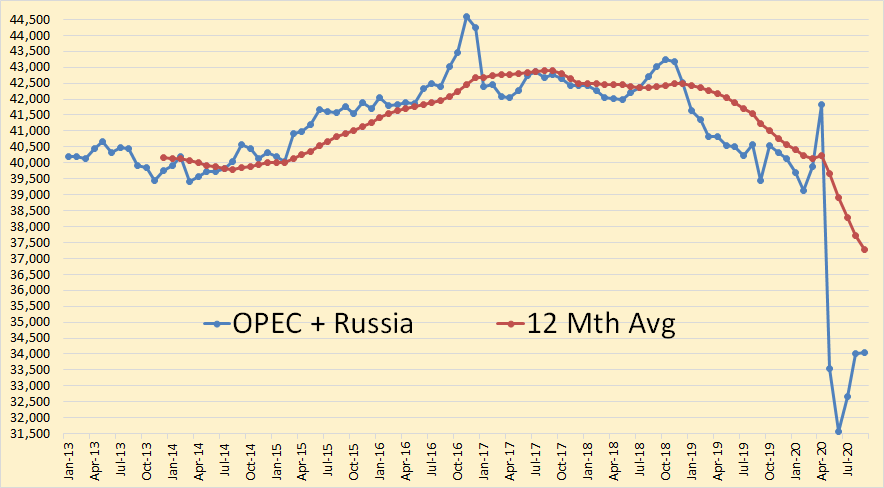
Total combined Russian C+C plus OPEC crude only was up 12,000 barrels per day in September. OPEC + Russia averages about 53% of world total oil production.
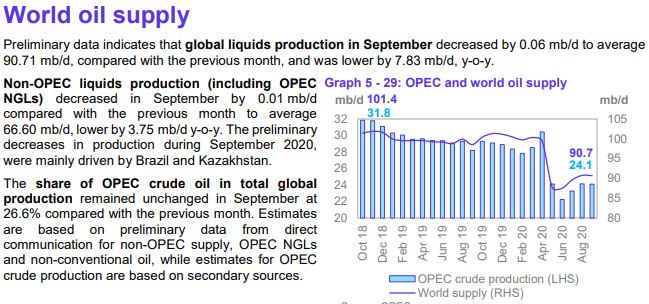
World oil supply decreased in September. Their estimate of OPEC’s total share of global production is totally wrong. They are comparing OPEC crude only with World total liquids, apples and oranges.
What to expect next year? More of the same except likely worse.
There will likely be no recovery in oil demand or prices next year because the Covid Pandemic will likely be worse.
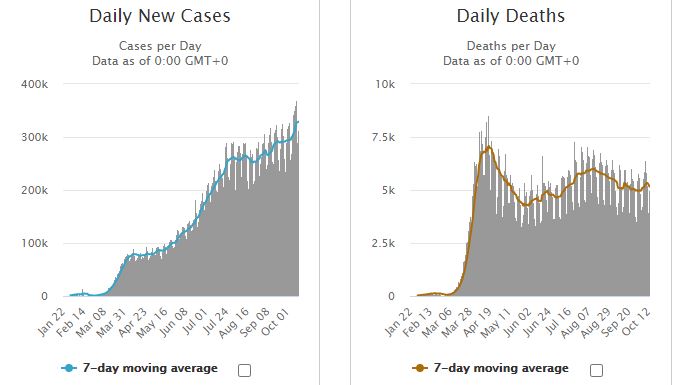
Though the death rate has plateaued new cases are climbing steadily. Death rates are likely to follow suit. That means there will be little, if any, increase in oil demand. Many people are grossly underestimating the long term effect of this pandemic. New cases are increasing just as we are facing five months of cold weather. I think we can expect to see sub forty dollar oil until well into 2022.
This pandemic will likely bring on a deep worldwide recession that will take years to recover from. The misery is just beginning.
– “The misery is just beginning.” Holy Fractional Flow Batman… Honey badger virus just a catalysis? Re-post – https://www.artberman.com/2020/09/03/stop-expecting-oil-and-the-economy-to-recover/
One of Art’s charts below. I could not agree more.
Ron. US oil demand has been more or less stagnant for 20 years. I think 2005 is still the peak year for US oil demand, although 2019 was close.
However, world oil demand grew by over 20 million BOPD from 2000-2019, and until this year, only fell during the GFC years of 2008-2009 during the period from 2000-2019.
The pandemic has resulted in a huge decrease in world oil demand, unlike anything seen in decades regarding the drop in world oil demand.
Seems like population growth worldwide has mattered a lot to oil demand growth in the past
Shallow sand,
The factor that correlates best with World oil demand is population, but World real GDP also correlates well especially from 1986 to 2018, the relationship was different before 1975 and reversed from 1979 to 1985 (oil output decreased while population and World real GDP increased).
If we due a regression of oil vs both variables (population and real GDP) , both variables are significant, but population is a stronger relationship with a tstat of 5.2, where real GDP is lower at 2.9.
The regression has an adjusted R squared of 0.992 and a significance F of 9E-33. The regression on real GDP alone has an adjusted R squared of 0.986 and a significance F of 2E-30, the Tstat for real GDP is 47. The regression for population alone is also very strong with adjusted R squared of 0.991, significance F of 4.6E-33, and tstat for population of 57.
If we take the equation based on World C+C demand vs World Population and assume the relationship holds into the future with future World population growth following the UN Medium Population scenario (9.1 billion in 2038) we get the following demand scenario.
It seems unlikely that supply will meet this scenario and for this reason I expect oil prices will rise.
It is the balance of supply and demand that matters especially with regard to oil price.
The proper metric is commercial stocks vs 5 year average. After great recession it took about 2 years for commercial US Petroleum stocks to return to normal levels (less than 50 million barrels above the 5 year average). High oil prices from 2011 to 2014 kept demand below previous levels which had not been high enough for long enough for consumption habits to change (Brent prices had only been above $90/bo for 11 months from Nov 2007 to Sept 2008, not enough time for change in car ownership etc to reduce demand). From Nov 2010 to Oct 2014 (5 years) Brent oil prices were $85/bo or higher and the average Brent price for that period was $108/bo, generally we will see reduced demand during a period of high oil prices.
It is the balance of supply and demand that matters especially with regard to oil price.
No argument from me on that point Dennis. However Art’s point with that chart is not price, it’s demand. A recession depresses demand regardless of the price.
Ron , I concur with Art and I have been pointing out earlier and so has Schinzy on this post that the laws of demand and supply seize to apply when an asset is financialized . Is Tesla worth $400 and what about Netflix ? Cheap money has distorted the market and now there is no price discovery ,only price speculation . Heck , Delta raised $ 9 billion securitizing it’s ” frequent flyer” program .Literally speaking it financialized its passengers . These are markers that we are in desperate times . As Ann Rand said ” You can ignore reality but you cannot ignore the results of reality .” One ignores reality at his or her own peril . Be well .
Hole in head,
The worth of an item is subjective, there is no objective value.
See Piero Sraffa on this, using an input output matrix any given good can be used as a “measure of value”, one could use gold, labor, apples, or a barrel of oil to determine the value of every good at any moment in time.
In reality a person holds a certain amount of money in their hand and decides if the price a seller is asking for his apple is worth it.
Depends on how much the individual likes apples and perhaps how much they have to spend as well as on the asking price.
That’s reality.
Nobody is suggesting that the state of the economy does not affect demand and supply, that affects the money one has to spend.
Ron,
I agree price will reflect the balance of demand and supply, where I disagree with Mr. Berman is his belief that demand will never return to the 2018 level, it may take some time, but it seems likely to me that demand will increase to the 2018 level especially if supply is adequate to keep Brent oil prices at $75/bo or less in 2019 US$.
As you know, I also think that if oil prices gradually rise to $75/bo (at about a $3/bo increase in real 2019$ per year) by roughly 2030, that US tight oil output will increase to about 9 Mb/d by 2029, this plus a return of OPEC nations to full output (when demand calls for it) will allow World C C output to return to slightly above the 2018 level or possibly just below that level. Note that this is based on a very conservative oil price scenario (Brent oil prices never rise above $75/bo in 2019$ in this scenario). It seems likely that oil supply will be short relative to demand after 2025 and higher oil prices and higher oil output might be possible, but my best guess is a peak of 84 to 86 Mb/d about 2028 to 2032, say 85 Mb/d in 2030 with a 50/50 chance it might be higher or lower and/or earlier or later.
Dennis ,the key is ” measure of value ” . You are correct . The question is what if the very instrument to measure is defective ? Defective thermometer will give you defective temperature ,defective barometer will give you defective pressure and so on . As I have pointed out the instrument for price discovery is defective ,so not possible to measure the value . Objective ,subjective work in a fair market . QE, ZIRP and as a matter of fact intervention by the FED directly thru it’s SPV’s has made the instrument defective . Heck ,the FED made a SPV to purchase junk bonds .Ridiculous . If you believe that the instrument is not defective ,you can do so , I have no issue with that , but keep Ann Ryand’s quote on the tip of your shoulder .
Hole in head,
There is no measure of value, you missed the point. Value is like beauty rather than like temperature, that is what it means for value to be subjective. The worth of a thing varies from individual to individual. Money is not a measure of value, it is simply a convenient means of exchange.
OPEC+ Is On The Brink Of A Crisis
With many of the OPEC+ members being rentier-states, the need for higher oil prices cannot be overstated. A vast part of the government budgets of OPEC member states depends on oil and gas-related revenues. As such, all OPEC countries are looking at significant budget deficits this year, especially Saudi Arabia, the UAE, Bahrain, Iraq, Iran, and Kuwait.
OPEC+ Discusses Stalled Demand Recovery, Return Of Libyan Oil
A panel of the OPEC+ group is discussing on Thursday the current major downside risks to oil prices—the return of oil supply from Libya and the rising coronavirus cases that threaten oil demand recovery, two sources at OPEC+ told Reuters.
Yep, and the economic prospects of many countries are at risk of prolonged economic difficulties, and credit ratings cuts.
https://www.reuters.com/article/us-global-ratings-sovereign-s-p-exclusiv/exclusive-second-sovereign-downgrade-wave-coming-major-nations-at-risk-sp-global-idUSKBN27126V?il=0
I see unemployment spiking next year. After whoever wins the election and whatever stimulus they are going to do gets done. It will buy a few weeks maybe a month or two. But then reality sets in again. And business start laying off people in droves.
Situation is way worse in Europe. They will have a hard time because governments are hamstring when it comes to spending. What i look at is the EUR/USD currency pair. When the US dollar is gaining on the Euro or the Euro is losing to the dollar however you want to view it. It’s very deflationary to the entire world. When the Euro is losing to the dollar the Euro is actually gaining against the commodity currencies. AUD (Australian dollar) NZD (New Zealand dollar) and CAD (Canadian dollar) Because commodities are price in dollars and the EUR/USD pair is pushing the dollar higher.
EUR/USD appears to be making a top. EUR/AUD appears to be making a bottom at the moment. Which means dollar weakness is over. Inflation hopes are over. Reflation hopes are over. Not good for price of oil. But if you bought oil back in April you’ll be ok to hold your position.
The rich will defend their wealth. Just start with that concept and guess your scenarios from that, rather than any sort of logic or extrapolation.
I think we’re going to see consumption not having fallen more than 10 or 20%. The preliminary numbers we are seeing suggest that already. China will likely offset quite a few countries.
It remains hard to argue with farmland.
In times of scarcity (a contracting economy) people defend inequality for many reasons among which are: money, race, religion, culture, education, birth rights, and military might.
Credit is still in contraction. Which means financial conditions are too tight. As low as interest rates are they are still too high. All the largest banks in the USA have never owned more US treasuries than they do currently. And the only way those banks don’t lose their collective shirts on all those bonds is they off load them to the FED. Interest rates are going negative from here and they will stay there.
All the banks are tightening lending standards. Which will lead to more credit contraction. And higher bond prices and lower yields or interest rates.
I think oil consumption is absolutely going to fall off a cliff in China. Because demand for China made goods is going to fall off a cliff in the USA and Europe.
And it’s all debt that is the core problem here. Corporations and households don’t have the room on their balance sheets to borrow our way out of this mess. This is not a liquidity issue like we faced in 2008-2009. It’s a solvency issue like 1929. Only on a much grander scale.
Take a look at GM and Fords balance sheet. Another US auto company bailout really isn’t all that far off.
“Things are likely to get much better in Venezuela for a decade or so because Maduro is starting to cannibalize the Orinoco pipeline for scrap metal to pay contractors …” Stupid communist. Why doesn’t he use the gold reserves? Oh, wait, they have been stolen by the Brits! Well … not (Venezuela’s Maduro wins UK court appeal over $1 billion in gold reserves held by the Bank of England)!
Court said the gold does not belong to the opposition. But did not compel transfer of the gold without deeper investigation.
OECD Commercial Oil Stocks on land in millions of barrels of crude plus petroleum products, from OPEC Oil market reports.
It will be interesting to see what happens in quarter 3 of 2020, I expect stocks will decrease which might support oil prices.
Note that much of the OECD increase in stocks was due to an increase in US commercial stocks from the first to second quarter ( about a 200 million barrel increase in the US, from first to second quarter, since then US stocks have fallen by about 70 million barrels based on weekly data).
OECD commercial stock scenario for days of forward consumption where it is assumed that the OPEC OMR forecast for future OECD consumption for the next 6 quarters is correct (2020Q3 to 2021Q4) and that OECD stocks fall by about 70 million barrels each of those 6 quarters (US stocks fell by about 70 million barrels from Q2 to Q3 2020 based on weekly estimates, I assume this continues to 2021Q4). Like every scenario of the future, this is likely to be incorrect (probability very close to 100%).
Schinzy, your post doesn’t explain much. Kind of a scattershot. Why were the folks at the Charlottesville march, you know, the ones carrying the torches, defending inequality?
Hi Ron, I often use the pneumonic MICE when considering the motivators of individuals- Money, Ideology, Compromise (Kompramat) and Ego. Groups are more trouble as its coallitional. The Alt Right ‘street fighters’, and I use that term loosely, have, IMHO, been PsyOp’d, that is to say effectively propagandized, and are motivated by ideology and ego. They (the various Alt Right squads) are quasi shirt movements similar to the ones in interwar years in Germany, but unlike the German interwar shirt movements the contemporary USA ones aren’t willing to throw down for protracted battle in the street. If they do they consistently get their asses beat. I don’t see that changing, which is nice.
https://youtu.be/qCtvuIWvnEw
My post was not intended to explain much. It was an observation. There are always groups of people defending inequality. In times of economic stagnation and/or contraction, their defense becomes more intense.
The North Dakota data is out. Total production was up122,351 barrels per day to 1,164,432 barrels per day.
EOG for Lunch? Start of the next phase of consolidation?
https://seekingalpha.com/news/3623025-speculation-swirls-around-potential-bid-for-eog-resources?utm_medium=email&utm_source=seeking_alpha&mail_subject=eog-cvx-speculation-swirls-around-potential-bid-for-eog-resources&utm_campaign=rta-stock-news&utm_content=link-3
Supply projection from
https://shaleprofile.com/us-tight-oil-gas-projection/
I modified using instructions to increase well completions per month from July 2021 to Dec 2025 (at 2% per month), also average new well productivity is assumed to decrease at 0.5% per month over the same period. From Jan 2026 to Dec 2030, the well completion rate is assumed to be constant (about 1100 wells per month) and new well productivity is assumed to decrease at 1% per month.
Chart below
Hey, that really looks good Dennis. I would say it is a lot more accurate than your previous estimates. If it is accurate then 2018-2019 will be peak oil.
I still think that much shale oil is a little optimistic. But it may be quite accurate.
Again, looks really good.
Ron,
I will assume you are serious. 🙂
Simply difference in assumptions, note that OPEC could potentially produce more than they did in 2018 (if Iranian sanctions were not in place). In a previous scenario I assumed completion rate continues to increase from Jan 2026 to Dec 2028, also the assumption for decrease in average new well productivity decrease was different (in my models it is based on total completions to date as well as completion rate). Here is the previous 73 Gb scenario where Permian completion rate is limited to 500 new wells per month (a more optimistic scenario assumes this rate might rise to as much as 700 new well completions per month with a URR for all US tight oil at 76 Gb). So this has a peak of 8 Mb/d vs 7 Mb/d for the scenario you prefer, at the peak of the shaleprofile scenario (created by me using Enno Peters excellent tool) in early 2027, my scenario has tight oil output at only 7.5 Mb/d, a mere 500 kb/d higher than the scenario you like. Chart below has my previous scenario.
Yes, I was serious. But this one? Naw, between one and two million barrels per day too high.
note that OPEC could potentially produce more than they did in 2018 (if Iranian sanctions were not in place).
Not likely. Much of the rest of OPEC is in decline. But the real question is total world production. OPEC could produce close to their previous high if Iran sanctions are removed. However, combined production in the rest of the world, including the USA is in decline. Peak oil is definitely in the rearview mirror.
Ron,
We do not know what future oil prices will be and this will determine (or at least influence) how many new wells will be completed. No particular reason new well additions stop increasing in 2026, that is simply an assumption I made, which may or may not be correct.
Alternative scenario below,
But there is one thing we do know Dennis. Petroleum is a finite resource. I know you know that also. However, it is my humble opinion that you vastly overestimate the amount of that resource left in the ground. That is the main thing I see wrong with your charts. In fact, that is the only thing I find wrong with your charts.
Do you think that if the price of oil was high enough we might squeeze a little out of a turnip? 😉
Ron,
You never responded when I showed the Monterrey estimate was the mistake of the EIA, not the USGS. I always ignore resource estimates by the EIA, they do a very poor job with this as their area of expertise is economics not geophysics.
The mean USGS estimate for the TRR of Permian basin is 75 Gb, my economically recoverable resource(ERR) estimate is 50 Gb, for the ND Bakken, the USGS mean TRR estimate is about 11 Gb and my ERR estimate is about 7.6 Gb, for the Eagle Ford the USGS mean estimate is 15 Gb and my ERR estimate is 6.4 Gb. Note that no matter how high oil prices rise the oil recovered will never be more than the TRR estimate, but for the three basins with USGS estimates, my favored oil price scenario has ERR at about 64 Gb which is about 63% of the TRR for these three tight oil basins. Also consider the following chart which shows the rate of increase in the US tight oil well completion rate from July 2016 to July 2018 (a rate of increase of 282 wells per month each year). For my tight oil scenario the well completion rate increases at only 186 wells per month each year from 2022 to 2025 and the rate of increase then slows from 2025 to 2029 to only 86 new wells per month each year (peak completion rate is in Nov 2028 at 1300 new wells per month, in June 2019 the rate was 1149 completions).
Dennis, in 2003 the USGS estimated the Monterey formation to contain 121 million barrels of oil. The below link is from the Oil and Gas Journal and is behind a paywall. But the Google search said enough so I just copied and pasted that.
USGS downgrades oil, gas estimates for Monterey formation …
http://www.ogj.com/exploration-development/discoveries/...
In 2003, USGS conducted an assessment of conventional oil and gas in the San Joaquin Basin, estimating a mean of 121 million barrels of oil recoverable from the Monterey. In addition, in 2012 …
So it wasn’t just an EIA overestimate of the Monterey formation, it was also the USGS’s overestimate.
Calfornia: EIA, USGS cut estimate of recoverable Monterey Shale oil by 96%
Hi Ron,
Yes the USGS did reduce their estimate from an earlier estimate of conventional resources in the Monterrey shale see
https://www.usgs.gov/news/usgs-estimates-21-million-barrels-oil-and-27-billion-cubic-feet-gas-monterey-formation-san
In particular (bold added by me):
The volume estimated in the new study is small, compared to previous USGS estimates of conventionally trapped recoverable oil in the Monterey Formation in the San Joaquin Basin. Those earlier estimates were for oil that could come either from producing more Monterey oil from existing fields, or from discovering new conventional resources in the Monterey Formation.
The area of the potential continuous accumulation assessed in this study is limited to where the Monterey Formation is deeply buried, thermally mature, and thought to be generating oil.
The assessment team concluded that most of the petroleum that has originated from shale of the Monterey Formation in the assessment area has migrated from the source rock, so there is probably relatively little recoverable oil or gas remaining there, and most exploratory wells in the deep basin are unlikely to be successful.
So the earlier study of conventional resources estimated 121 million barrels of conventional oil in the Monterrey area, it was not an estimate of tight oil resources. The new estimate is for tight oil resources.
The poor estimate of the Monterrey came from a research firm called INTEK, that simply gathered information from investor presentations without any further work, basically their work was crap.
The 2003 study is at link below
https://pubs.usgs.gov/pp/pp1713/01/pp1713_ch01.pdf
With respect to technically recoverable undiscovered conventional hydrocarbon resources in the San Joaquin Basin Province, the USGS estimated means of 1.8 trillion cubic feet of gas (TCFG), 393 million barrels of oil (MMBO), and 86 million barrels…
latest assessment at link below
https://pubs.usgs.gov/fs/2015/3058/fs20153058.pdf
Conventional oil resources are distinct from continuous oil resources, the earlier 393 million barrel estimate was conventional oil resources, the more recent estimate was for continuous (aka tight) oil resources, 21 million barrels. Note that neither of these estimates is anywhere near the EIA estimate of 15,000 million barrels of oil.
The USGS has only done one estimate of Monterrey tight oil resources, that estimate was 21 million barrels.
Okay, the USGS was not as wrong as the EIA. But this has little to do with today’s estimates. They are still over the top. Also, world reserves are really what matters.
Ron,
The USGS was not wrong at all on their tight oil estimate, their only estimate was 21 million barrels and that was for technically recoverable resources, this is essentially an estimate of about zero for economically recoverable resources for the Monterrey tight oil resources.
When I use the USGS mean TRR estimate for North Dakota combine with a model based on well profiles deduced from actual output data gathered at http://shaleprofile.com, along with real well cost, annual discount rate of 10%, transport cost of $10/bo, royalty and tax payments of about 29%, and real oil prices to find discounted net cash flow over the life of the average well, ERR is about 7.6 Gb (TRR=11 Gb). Cumulative output plus proved reserves are over 8 Gb, so the model is conservative. You can claim that the Permian basin mean estimate by the USGS (75 Gb) is bogus, but it is simply an assertion with nothing to back it up, the ERR for the Permian based on the USGS mean estimate is about 47 Gb.
You often focus on tight oil and now are changing the subject with World reserves being the important matter. Note that it is economically recoverable resources that are important, we only have information on proved reserves and much of that information is not very good. The best information comes from Jean Laherrere and in October 2018 he estimated a URR of about 2600 to 3000 Gb for World crude plus condensate minus extra heavy oil (oil sands in Canada and Venezuela with API gravity of less than 10 degrees). My World scenarios have about 2900 Gb for World C plus C, see chart, peak is in 2030 at 84 Mb/d, cumulative output from 1950 to 2110 is about 2700 Gb for this scenario. Click on chart for larger view.
Dennis, this is just a lot of fun for me. I don’t take it all that seriously. I am not consciously trying to change the subject. If the USGS was better than the EIA a decade ago, that means nothing today.
Love your chart but you started your decline about 12 years too late. It should begin right after that 2018-2019 peak.
Thanks Ron,
Glad you like the chart, we will see if the peak is 2018 or 2030, it won’t really matter much and much will depend on demand along with supply, low demand will lead to low oil prices and corresponding low supply.
Note that the claim that the USGS was wrong matters quite a bit, they were not wrong on their tight oil estimate for the Monterrey shale, that’s a red herring.
No doubt you or someone else will bring it up again, even though proven specious.
Why does it matter, because the claim then follows that no USGS estimate should be believed, which is also false.
The mean estimate is the best guess by experts, it is not an exact science, the estimate could be low or high by 20% and then economically recoverable resources will depend on many factors (well cost, discount rate, taxes, royalties, transport costs, water disposal costs, well abandonment costs, and oil prices, and probably at least a dozen other factors I have not considered.
The ERR estimate is my best guess informed by what I have learned from many others (including Shallow sand, Enno Peters, Paul Pukite, and others who may prefer to remain anonymous).
Oh and the USGS Monterrey tight oil estimate was from 2015 (so 5 years ago). The Permian basin estimates are more recent 2016, 2017, and 2018, see link below.
https://www.usgs.gov/centers/cersc/science/permian-basin-oil-and-gas-assessments?qt-science_center_objects=0#qt-science_center_objects
If anyone looks at these assessments the total undiscovered TRR (UTRR) for the three areas (Wolfcamp Midland, Spraberry Midland, and Wolfcamp and BoneSpring formations of Delaware) is about 70 Gb, one must add cumulative production (2.3 Gb) and proved reserves at the end of 2016 (5 Gb) to this estimate. That gives about 77 Gb, but I round down to 75 Gb for my TRR estimate.
At the end of 2018 cumulative production (4 Gb) plus proved reserves (11 Gb) was 15 Gb, my ERR estimate is about 46 Gb, so about 31 Gb left to produce out of 60 Gb of TRR remaining to be “discovered”. So my scenario is fairly conservative with only 52% of remaining UTRR being produced and about 61% of the total TRR is economically recoverable (46/75).
The ”recovery” of tight oil will arrive ”to late” to sustain oil demand in world, causing drastic change in oil consumption, as the rest of world oil production will keep on decreasing, and making this recovery ratherly unusefull.
Jean,
If oil supply is too low relative to demand, then oil prices will rise and OPEC+ output and non-OPEC output will increase in response.
Please keep in mind COVID-19 is really kicking in in ND now. Not a good sign.
Someone is telling the truth . Honda CEO says EV’s cannot be mainstream.
https://auto.economictimes.indiatimes.com/news/passenger-vehicle/cars/electric-vehicles-wont-be-mainstream-says-honda-ceo/72010071
from your link- “Commenting about Honda’s electrification strategy, Honda CEO said the brand will focus on petrol-electric hybrids, not BEVs, through 2030.”
Plug-in Petrol-Electric Hybrids will indeed be a very effective vehicle class for this decade, and perhaps the next as well. I have had one such vehicle for 3 years now. ‘The 2018 Chrysler Pacifica is powered by a 3.6-liter V-6 rated at 287 hp ‘, plus a battery pack that gives 32 miles electric range before the ICE kicks in (seamlessly). This is a powerful and quick vehicle- the torque from the electric motors can pin you to the seat upon acceleration.. To date- 76% of my mileage has been electric (solar charged), and 24% of total mileage is petrol.
Honda’s competitor Toyota has just come to market with another example of such a vehicle- 2021 Toyota RAV4 Prime with 302hp and an all electric range of 42 miles.
The American driver averages 29.1 miles traveled/day. Clearly such a vehicle could be primarily fueled with electricity, for this entire decade.
The trend of electrification of transport is inevitable and at an escalating pace.
The good news for those with internal combustion engines is that the affordability time frame of petrol availability will be extended by a decade or three, as more people replace their petrol consumption with electrical charging. This means that global instability due to a shortage of petrol is considerably less likely or less severe than was the case prior to the emergence of this viable alternate transport mechanism.
Hickory , the world is becoming poorer . It is the end of prosperity . We know efficiencies and stuff ,what good are they if you are worrying where your next meal is coming from? Bill Gates purchased a yacht ,hydrogen powered for $ 648 million . Is that the benchmark ? How many EV’s will (not can) will Bill, Warren ,Mark, Mukesh and Larry buy ? Diamonds at $ 1000 per carat are cheap (Mrs. Mukesh Ambani purchased a Hermes handbag for $350000) but diamonds at $ 0.10 cents are unaffordable if you are one who is living below the poverty line . Just for your info Rafa Nadal sold his yacht which was custom made, after one trip of sailing around the Med with his newly wed wife. He realized it was nothing but a white elephant . We are in decline of prosperity . The problem is that what has been sustained by unlimited money printing is now unravelling . Very few realize and understand this . The problem is not supply but demand .
HiH-
Perhaps you foresee abrupt economic collapse all around you, and I believe it is one scenario for the world generally. But not the most likely. More likely the human bulldozer will continue its onward grind for decades.
“the world is becoming poorer”
On the contrary- The worlds middle class has grown explosively in past several decades.
“The size of the global middle class increased from 1.8 billion in 2009 to about 3.5 billion people in 2017 — more than half of the world population and is expected to grow to some 4 billion by 2021 and reach 5.3 billion by 2030. Some 88% of the additional middle class population will be Asians.”
At the small end of transport vehicles spectrum, from electric cargo 2 and 3 wheelers, cycles, and what we in the USA consider very small sedans, its going electric rapidly. These segments will all be cheaper to own and operate that the ICE versions, and in a state of declining prosperity will have a clearadvantage.
I know you won’t like this report findings HinH, but nonehteless-
https://www.consumerreports.org/hybrids-evs/evs-offer-big-savings-over-traditional-gas-powered-cars/
The developing world has been experiencing an explosion in middle-class consumers, but the developed world has seen quite the opposite. And the same phenomenon is about to hit the developing nations now they’re nearing the same cost of energy issues that the Westerners started running into at the turn of this century.
Don’t worry. The world is not going to support that many new wealthy middle-class consumers, so it’s a non-issue.
Kleiber ,bullseye . The middle class is crushed worldwide . In the west it is papered over . At the height of the crisis before Thatcher came to power the unemployed were 4 million . Today 9 million are in furlough ( so not counted as unemployed ) . Cover up . Who wants to buy a $40000 EV when you are looking up google maps to see where is the nearest food bank .
https://www.cbsnews.com/news/unemployment-running-out-millions-americans/
Hickory ,I do not see an immediate worldwide collapse . I foresee a decline followed by a collapse later . What is unknown are the gradient and the speed of the decline . We are at the starting point as a matter of fact it has taken off , when will it catch speed and what can/will be triggers ,we will have to wait . As to your link, in the long run ev’s may be more cost efficient ,my POV is how much of the public is going to pay Euro 35000 to buy one . They are far too expensive for entry level . In Belgium I can buy a Suzuki or a Renault hatchback for Euro 6700 on the road brand new . As to the rising middleclass in the devolping world, that party is over. Kieiber below has got it right . I am witnessing right now the collapse of the middle class in India which is ground zero for me and in Thailand where I have extensive contacts since my school days . The collapse in Thailand is due to massive contraction of tourism . 1 in 6 jobs was in tourism and that has gone . Massive unemployment in both countries .
Hence the calls for the world’s richest monarch to be deposed.
Lightout , one has a choice , be on the job or be on the street . This movie is coming shortly to a theatre near you .
HIH,
He is stating his opinion about the future, which may or may not be correct.
As always, we will see. Many other automotive CEOs would disagree.
As always , my POV is affordability . If oil at $ 140 was affordable you can have it ,if oil at $ 50 is unaffordable you cannot have it . QED .
I have to agree. The problem isn’t the technology, which is hardly new and has been radically improved upon in the century since. It’s being able to get it out there and to have the majority of people use it within a suitable timeline.
Given the economic storm unfolding, one is not going to be looking to the consumer, who was already looking at 10 year autoloans and PCP contracts, then going into purchasing brand new EVs with the same vigour one had pre-2008 with big petrol cars.
And, again, I find the obsession with personal conveyances rather misses the much more important and bigger users of petroleum for transport. You’re not getting EV lorries or superfreighters. I’d see a bigger saving on petrol usage from the pandemic manifesting the once maligned idea of remote working.
Kleiber,
There are EV Buses and soon there will be EV Lorries as well, superfreighters (do you mean a ship?) can be run on natural gas.
Keep dreaming . You are welcome
Buses, yes, my local city has them. They can do maybe 100 km round the city per day, much like the diesel-electric taxis we also have, but ultimately they are second fiddle to biogas and hybrid buses we have in abundance now. And buses are by no means equivalent to heavy cargo hauling trucks, of which there are no EVs remotely equivalent to their diesel counterparts. They lack the range, haulage capacity, price competitiveness, and infrastructure to support their usage even if they were abundant and affordable. When you have serious commentators talking up Nikola, for instance, you know there’s something wrong systemically. As an aside, local councils and bus operators are strapped for cash, and fare prices are already extortionate for bus and rail. The idea of overhauling the national fleets with the far more expensive, less capable (either innately or due to lack of infrastructure support) greener alternatives of 2020 vintage is, well, just not happening.
And yes, I meant freighters as in seafaring for the latter. Natural gas, however, is indicative of why we can’t move away from fossil fuels for such jobs. Bunker fuel to diesel to NG. Nothing there is going the way of a EV transition like in commuter vehicles. Simple physics will ALWAYS make any electric vehicle inferior to the ICE equivalent in terms of range and payload capacity. This can be ameliorated for passenger cars, because most people are not packing families in the things and driving hundreds of klicks. But for freight? No. Local BEV vans for grocery deliveries from an out-of-town depot are not on the same level as a long range 18-wheeler.
Now, if every nation had extensive electric rail and cheap mains electricity already powered by nuclear and wind/solar/hydro, then we’d be set. As it stands, we built around the car culture. And for Americans at least, that’s a massive hurdle.
Kleiber,
I agree long haul trucking may not work for EVs, electrified rail probably makes more sense long term with BEV trucks from rail hub to final destination, transition will take time.
Dennis,
Im sure your aware and working on it but its quite impossible to follow any lengthy discussion now on a mobile device, at least mine. Posts get to a column of 2 characters after a while. Perhaps settings for comments and adjusting maximum levels of comments like it was with previous theme that you had to adress who you were responding to when levels had been maximised?
I would also enjoy if i could skip directly to comments like before and not have to scroll the entire post every time i check in.
Im using a free theme here: https://aktiertips.se/
called sparkling, it has the direct to comment feature and i think it looks better then this theme your using now but i have no idea how it will handle amounts of comments.
Its a two columns theme i think you mentioned that was what you wanted also.
Thanks Baggen.
Do you know how I might reduce the indents for the comments, unfortunately I cannot control comment levels separately for mobile and computer.
Dennis,
“Do you know how I might reduce the indents for the comments, unfortunately I cannot control comment levels separately for mobile and computer.”
I dont understand what you are looking to do, under settings -> discussion you can set the depth level of the posts but i suspect you are looking for something else right?
Baggen,
Several things I would prefer to change, but for now this will have to do. Unfortunately I am not confident editing the theme.
Dennis,
If you dont use it already i can recommend “updraft” for automated backups.
Superfreighters are really that important for the world economy anyway. Growth has been much higher than economic growth because shipping is basically free. If it got expensive, production would shift closer to home, or shipping would move back to land routes.
The same is true for flying. cheap flights to the beach are not the rock the economy is built on.
Hole in head,
Not everyone is in poverty, nor is this likely to become the case, in the US the best selling new cars are around 35k, Toyota Camry usually is near the top of the US list, when looking at total cost of ownership the Tesla Model 3 comes very close to the Camry, oil supply is likely to become constrained and oil prices will rise (likely to $75/bo for Brent in 2019 US$ by 2030 with a roughly linear rise (with random ups and downs above and below this line) from todays price to $75/bo in the middle of 2030. As this rise in oil prices occurs the EV becomes more affordable than the ICEV, in addition EV cost will fall as output ramps up, Tesla expects to introduce a 25K car in 2023 (typically Musk is too optimistic so perhaps a 30K car in 2024).
Found following article on median household income worldwide, a big range.
https://news.gallup.com/poll/166211/worldwide-median-household-income-000.aspx#:~:text=Country%2Dlevel%20income%20closely%20related%20to%20Payroll%20to%20Population%20results&text=WASHINGTON%2C%20D.C.%20%2D%2D%20The%20median,according%20to%20new%20Gallup%20metrics.
What is median or average ? I learnt this a long time ago . A teacher took his class out for a walk . The height of the tallest was 6 ft and the height of the shortest was 3 ft . The median (average ) was 4.5 ft . They came across a stream or river ( call it what you will ) with a depth of 5 ft . Well , the result was not very pleasant . Another example , a company produces 1 tractor ,next year it produces 2 tractors ,increase is 100% . A company produces 1,000,000 tractors , next year it produces 1,100,000, an increase of 10 % . Where will you put your money ? Statistics and figures can be misleading . I go for the meat and potatoes , the Cola is not interesting .
hole in head,
median is different from average (also called the mean).
Lets say we have 3 numbers in our dataset, 1, 2, and 5. The median is the middle number where there are the same number of data points above and below it (in this case 2), the average (or mean) for this case would be 4. The reason median income is more useful is that when income distribution is unequal (a few who are much wealthier than most) the mean is often much higher than the median. In my view the median is a better measure for income than the average, you perhaps do not agree.
If you believe Musk , I have a bridge to sell . When he blows up he is going to make Enron and Madoff look like a walk in the park . The authorities in Germany cut off the water supply to the construction site because he did not pay his water bill INSPITE of several reminders .
hole in head,
Do you have a link to support your assertion about Tesla and German factory? Currently the cheapest Model 3 is about 39k, a similar Toyota Camry built with similar features (but slower acceleration for the Camry) is also about 39k. I own both a Camry (2013 purchased new) and a Model 3 (delivered in Oct 2018), the Tesla is a far nicer car, and no Musk does not meet the impossible deadlines he sets for himself, everyone is aware of that fact.
Here is the link .
https://www.thedrive.com/news/37086/german-officials-shut-off-water-at-teslas-gigafactory-berlin-over-unpaid-bill
Dennis , some CEO learn early . BMW has a plant in Holland making the premium BMW mini(ICE) . They will shut it down by the end of the year . Originally it was planned to changeover to make EV’s . I don’t know why they changed their plan ,maybe they don’t see enough demand . There are still quality problems with the battery catching fire . Last week in a period of 5 days battery fire broke out in Hyundai’s, BMW’s and Ford’s in Germany . They have put sales on hold for the moment . In EU Tesla is sold without ” selfdrive” because the authorities at TUV ( German equivalent of NTSB) has deemed it ”unreliable”.
The supply chain problems have yet to be sorted out . Audi EV division has shutdown production for five days since they cannot procure components . Car production is a complex highly synchronized system .
Thanks for link, no doubt the bill will be paid promptly in the future. Telsa may be used to places where there are 30 days to pay the bill, perhaps the rules are different in Germany.
Dennis , he better pay it ,or else 🙂 . Read the article , he failed to pay even after the grace period was over . On all invoices we have a ” pay by date ” and then a grace period of 14 days .
hole in head,
bill paid, water on.
https://www.latimes.com/world-nation/story/2020-10-16/german-water-utility-pulls-plug-on-tesla-over-unpaid-bills
With this stock price, Tesla can’t have cash shortage.
They have done 2 capital increases this year, for together 7 billion $. With no negative impact on the stock, so it’s free cash for them. They can pay the whole German factory in cash, and still have some left. With no aditional dept – Tesla stock holder love capital increases diluting their stock.
Dennis , you are incorrect to assume that because you can afford a $ 39K car ,others can too . You and me are lucky that we can . $39K is a lot of money for the public at large . Even in Belgium and Netherlands , both prosperous countries it is a lot of money and this comes right from the horse’s mouth . I discuss EV’s with many here who are prosperous and have good incomes ,all say ,no , they will not buy a car that costly . Upper limit is Euro 20-25 K . Above that is a ”no go” . They would rather buy a used Mercedese, BMW or Audi between that price range .
hole in head,
Yes many are unwilling to buy new cars, but somebody does and those who don’t buy used. Note also that depreciation for Teslas is lower than for most ICEVs as they get constant software updates that most car companies cannot match.
Note that 25k Euros is about 29K USD, it will not be long before Tesla offers a car at that price, in fact there might be rebates that bring the cost to that level especially when the Berlin Tesla factory begins operation (perhaps by the end of 2021). In the Netherlands there is a 4000 Euro subsidy and and these cars are exempt from the BPM tax which would be about 4000 Euros for a Volkswagon Golf (one of most popular cars in Netherlands), so that’s a 25k car after rebate and then no tax paid making the net cost close to that of Golf including the tax. Again the Tesla is a far nicer car than the Golf.
Dennis , the subsidy ends Dec 2020 . Any car above Euro 30K in Europe is a corporate car for the big bosses of the companies . A status symbol . EV’s are allowed a 120 % depreciation in the Benelux in the first year itself . The only reason it is purchased . How do I know that ? My workplace is next to a McDonalds where battery charging stations are installed . I go there at 11 am to have a coffee DAILY and I strike up a conversation with the men charging their Tesla ‘s . All in the range 55-60 years , all corporate ” creme de la creme ” and all acknowledged the only reason they have the Tesla is depreciation , status symbol and party talking point . Since I myself am 65 and polyglot and not a threat to them they have no problem in letting out . As to Tesla producing a car at $ 29 K forget it . Tesla would have shutdown if it was not for the carbon credits it is able to sell .Heck , Tesla looses money even with all the subsidies accounted for . Subsidies will end . Government’s are going to have to decide very shortly . Pay subsidies or pay pensions . Musk has one vote , pensioners in Benelux are 33% and in Benelux voting is compulsory i.e 100% ( except for exceptional reasons ) . Not a difficult choice for politicians , or is it ?
hole in head,
Generally it is higher income people buying the Model 3, in the US the least expensive Model 3 is about 39k which is about 33k Euro. Tesla will produce a cheaper car by 2024, as production ramps up they will reduce battery costs and the price of the car will fall. At some point subsidies will be eliminated, the tax savings may remain even though the subsidies expire.
You do realize that a few years back nobody believed Tesla would produce a car for under 40k USD. Now it is reality.
Today people say Tesla will never produce a car for 25k USD (in 2019$), perhaps they are correct, but I think they will produce a car for under 30k USD (2019 USD) by the end of 2024.
As always we will have to wait to see if my guess is correct.
As to the carbon credits, those will end eventually as well.
People will buy this kind of car, rather than walk or buy a car that runs on petrol that costs too much.
“A GM-backed mini electric car that costs just the equivalent of $4,000 in China has already received 50,000 orders.”
https://electrek.co/2020/08/20/gm-mini-electric-car-price-orders/
Ignore [or belittle] the electrification of transport trend at the risk of being out of touch with where the world is heading.
Sorry boss , I have been listening to cars being run on water , compressed air and what not for so long that I am suffering from fatigue . When it becomes mainstream get back to me . A prototype is not production . 50,000 orders would not justify setting up a production line . I have been to the Wolfsburg plant of VW . It is out of the world with its own railway system to deliver sheet metal ,parts to the various units . You my dear friend have no idea about auto assembly lines .By the way I was also a OEM supplier to Mahindra in 1990’s when I was still in India .Also visited the Audi assembly line in Gyor , Hungary .I have first hand experience on this .
Electric motorcycles will be the start, then move to 3 wheel and then 4 wheel.
https://electrek.co/2020/01/08/chinese-electric-motorcycles-sur-ron-niu-evoke-voge-er10/
There are more bicycles in the world than cars https://ilovebicycling.com/random-facts-about-the-cycling-industry/. Electric bicycles are bringing many new people into cycling. The pandemic is causing a boom in cycling and cycling investment https://finance.yahoo.com/news/pandemic-boon-bicycle-thousands-snap-154124899.html.
hole in head,
Clearly there are others besides me that can afford a Model 3, in 2020 Tesla has sold 318,000 vehicles (some of these are the more expensive Model S or X. Pretty sure I have never claimed that everyone can afford a new Model 3, nor does everyone want an EV.
Dennis ,bill paid . Congratulations 🙂
Eulan, even a combination of all the Nobel prize winners in Economics and Physics will not be able to dissect the accounts of Tesla . He makes Madoff ,Ken Lay , Bear Stearns and Lehman look like babies still in their nappies . 🙂
New Tesla battery likely to last 2 million + miles. Why would anyone want to pay $35K for a car they can drive their entire lives and then pass on to a grand child and have them drive their entire lives? Each electric car sold will ultimately displace up to ten ICE car purchases.
https://electrek.co/2020/10/18/tesla-battery-test-results-over-2-million-miles/
Both of us have agreed to be on the different sides of the ball game . You say prices will rise because of supply and demand (except for black swan events) , I say prices will drift downwards because of affordability . Only time will tell who was correct .
Two items:
First is the fiscal year ended 1 October. National Debt quoted $27T. I think I guessed $29T by the end of the year, calendar year, and I’m still in the running on that if there is post election stimulus. 2T is reasonable number for that.
Second is consumption and this presumption that work at home is going to chop typical consumption down. If there is no vaccine or treatment, I put the odds at pretty good that cities are going to empty. And that will take consumption right back to where it was despite work at home.
Stimulus is also having an unwanted deflationary effect. It appear if you give people free money above and beyond what they’d make actually working. They use it to pay down debt.
Canada is a prime example. Look at their household debt to income it’s never contracted like it is right now. But it’s happening everywhere.
My guess is stimulus backfires here and makes credit contract big time. And the bigger the stimulus the bigger the contraction it will be.
I’ve mentioned before that i think the global fiat monetary system we currently have is ending. I thought we still maybe had 10-15 years left before that end. Now i think it’s more like 3-5 years or less.
Will oil even be priced in dollars 5-10 years from now? I don’t see any way around a global war to decide who gets control over whats left. I think trade between the US and China goes to ZERO
I agree with your prognosis.
However I do not think that the problem is a fiat currency. I think that money creation through interest bearing debt only works when the economy is growing. We hare heading towards chronic economic contraction and our financial system is not well adapted to this situation.
HHH, I also concur with you . Our economic and financial system is based on continuous growth , ” The end of growth is the beginning of collapse ” . Contraction has started and there will be no going back .
hole in head,
Perhaps you have not noticed that the economy tends to be cyclical with periods of faster and slower growth. There is no particular reason that economic growth cannot continue.
Eventually (maybe in 2060 to 2070) human population may peak and then decline ( as fertility rates continue to fall) at some point even with a constant rate of growth in world real GDP per capita of say 1.4% per year. When population growth rate reaches -1.4% per year or lower, World real GDP may start to decrease, that would be a good thing as environmental damage by humans would be reduced.
All of these financial/fiscal issues are just the first shot across the bow in the long story of how global population overshoot ramifications come to the surface. It will be a game of kick the can (reckoning) down the road for as long as possible.
We should not be surprised to see a many decades long process of ‘reset’, sometimes in an abrupt and destructive movement. But lets not kid ourselves. The world of humans is not about to disappear suddenly.
Dennis, perhaps you have not noticed that we have entered into phase change as I have explained in earlier posts. Past experiences and events and cycles become irrelevant . Having some problems with the website coloring etc .
HHH,
If you are correct and Debt to GDP ratios fall, that simply gives room for expansion of credit as the economy returns to growth after the pandemic subsides. Many people are concerned about too much debt, though I think in a contracting economy you are correct to worry about decreasing debt. A lot of the debt just moves to the public sector as governments take on debt during an economic contraction, this government debt is reduced as the economy returns to higher employment levels and private credit levels start to expand.
If oil supply becomes short (perhaps by 2027) oil prices rise and demand gets destroyed to a level where supply and demand are roughly matched.
Dennis , I follow non MSM economists like Micheal Hudson, Richard Wolff and Steve Keen . Dr Keen does not see govt debt as a major threat to the system . He argues that corporate debt in USA and private debt in Europe and now the emerging markets will be what will cause the crash .
Hole in head,
I am very familiar with the older work of Rick Wolff, he was my professor in graduate school, I am not familiar with the other two. For every two economists there are at least 5 different opinions on any matter. 🙂
Hole in head,
Yes time will tell.
For past 20 years (2000-2019) the average annual real Brent oil price (2019 US$) has been about $75/bo. Chart below has annual real Brent prices and centered 3 year average real Brent oil price and my $75/bo maximum real Brent price scenario tacked on (showing centered 3 year average only). The linear trend (using a least squares regression) for annual real Brent oil prices from 2000 to 2019 is also shown, that trend suggests $100/bo (2019$) for Brent in 2024. My scenario by comparison has real Brent oil price at about $57/bo for the average annual price in 2024. My guess is that the real Brent price is likely (66% probability) to be between $57 and $100 per barrel of oil in 2019 US$ in 2024.
I will repeat that the law of supply and demand is the most overrated law in economics.
I also remark that prices rose from 2002 – 2018 as extraction rates rose. An elementary calculation suggests that once oil becomes a constraint on the economy (post pandemic), the partial derivative of price with respect to quantity will become positive, in other words the lower extraction rates fall, the lower the price will be https://www.math.univ-toulouse.fr/~schindle/articles/2020_oil_cycle_notes.pdf.
Schinzy,
Perhaps you are forgetting the all else remaining equal part of the supply demand observation. Most economists are well aware that if GDP decreases demand will also decrease, also technological changes can also affect demand (as is obvious in the case of labor).
Under a situation where real GDP is constant and there are no changes in technology, is it you expectation that a decrease (or increase) in supply of a good would have no effect on the price of that good?
If so, I would strongly disagree.
Let Y be GWP, p be the cost of oil, q be the quantity of oil produced and C : = pq/Y be the cost share of oil in the economy. Solving the definition of cost share for p, one obtains:
p=CY/q. (1)
The scaling of oil in the economy is found by writing:
Y = Kq^α, (scale)
where K is a positive constant and both K and α are determined empirically (by taking the log of the above equation and then performing linear regression). Substituting the scaling equation into (1) one obtains:
p=CKq^(α -1).
One sees from the above equation that the critical scaling is
α = 1.
If α =1, then changes in price are only dependent on changes in cost share, changes in quantity have no effect. If α is greater than 1 then the price is an increasing function of quantity at fixed cost share. If α is less than 1, the price is a decreasing function of quantity.
From 1947 to 1973, we calculated α to be approximately 2/3. From 1973 to 2016, α was approximately 2.3 (see https://link.springer.com/article/10.1007/s41247-016-0016-6).
How will oil scale in the contraction phase of oil extraction? My guess is that α less than 1 until decreased investment causes oil production to be a constraint on the economy after which α will be greater than 1.
Hole in head,
Things always change, and the rate of change also varies over time. The current pandemic has led to a rapid economic collapse. Such episodes have occurred releatedly over human history.
Such episodes can also precipitate social changes and that might occur in this case.
You seem to think you can foresee what is to come. I am not clairvoyant. I just know the history of the past 300 years fairly well, generally economic collapse has not been permanent. Government intervention can usually right the ship, we have become better at this in the past 74 years, mostly due to Keynes.
Ian Schindler,
There is no reason to assume the cost share remains fixed, in fact it changes all the time as prices change and consumption habits change.
Such is yet another problem with so-called economics apparently.
Insofar as you may think that ‘There is no particular reason that economic growth cannot continue…’, so one might argue that there is no particular reason why cars– electric (often indirectly/remotely fueled by coal-burning or natural gas-burning plants) or otherwise– and their massive roadway infrastructure, complete with parking lots, coerced-tax-payer subsidies, endangered-species roadkill, and sprawl, etc., should exist.
Electric cars, despite being electric, still share many of the same problems with internal combustion cars, and probably introduce many novel ones too, such as novel wastes and geopolitical and ethical issues related to resource accessibility.
About your economic growth:
Decoupling for ecological sustainability: A categorisation and review of research literature
I like this new layout by the way and appreciate the effort in that regard and in the site in general.
Meanwhile Honda’s diesel and gasoline cars are tanking in Britain, and will be phased out in favor of EV and hybrids, whose sales are booming. The numbers a pretty shocking.
https://insideevs.com/news/449715/uk-honda-phased-out-diesels-electrification/
“Honda has accelerated its plans for all its European mainstream car models to be electrified from 2025 to 2022 and our motor petrol hybrid technology will play a key role in achieving this goal. As such, we plan for European production of diesel powertrains to cease by the end of 2022. However, on a local level in the UK, we have now stopped selling diesel cars.”
Toyota and Honda are betting on hybrids now.
As decline, collapse and/or issues related to that and resource availability and affordability and ecosystem viability vis-a-vis global population size, demand and crony-capitalist plutarchy techno-industrial lifestyle set in, a lot of that and related may not matter– some of it rather suddenly…
In that sense perhaps, I’m suddenly reminded of a quote that I seem to recall someone else hereon also using:
Whether Honda fails or succeeds is irrelevant. If they stop investing in diesel research, they will stop selling diesel cars eventually.
Product lifecycles for internal combustion engines are long. Thanks to competition and increasingly strict regulation, you can’t sell old designs. So if companies don’t invest now in the next generation of diesel engines, they will have a hard time selling them in 6-8 years.
Pretty much every major car company is cutting research in diesel. It is hard to see who will produce the next generation. I doubt Mike Tyson can help us here.
Oil Majors Stuck Between A Rock And A Hard Place
The past few years have been historic for as far as crude oil forecasts are concerned. Back in 2015 the view that crude oil demand could peak during the 2020s or 2030s was still met with disbelief (and some ridicule…). Economic growth had been pushing crude oil demand up ever year for decades already, so why would things become different, so the reasoning went. Today, however, essentially all major energy forecasters, including BP, Shell, Total, DNV-GL, the IEA and even OPEC, have come round and acknowledge Peak Oil Demand as a realistic possibility.
New tight oil data out. link to Excel spreadsheet below
https://www.eia.gov/energyexplained/oil-and-petroleum-products/data/US-tight-oil-production.xlsx
Permian basin accounts for about 53% of US tight oil output in Sept 2020.
US tight oil output increased by 2788 kb/d from Dec 2016 to Sept 2020, the increase in Permian basin tight oil output was 2338 kb/d over the same period, accounting for 84% of the US increase in tight oil output since the end of 2016. Permian output increased by a factor of 2.6 (3815/1477) since the end of 2016 (less than 4 years). My Permian basin scenario has Permian output increasing by a factor of 1.6 (to 6180 kb/d) by September 2028 (over an 8 year period), some believe this cannot be done, which might be true if oil prices remain low for the next 8 years, but I doubt such an assumption will be correct.
Thanks, Dennis. I see US Tight oil was down 13,892 barrels per day in September. Eagle Ford was the biggest loser down 12,000 bpd.
Ron,
Yes US tight oil dropped a bit (0.19%) in September, less than I expected. The DPR had a slightly bigger drop, but still only 0.29% from August to Sept, bigger drops are predicted by the DPR for Oct (1.1%) and November(1.6%), though I don’t have much faith in the DPR. My scenario is way off for Sept 2020, I had US tight oil output at 6394 kb/d for Sept 2020, about 10% too low. The completion rate in my scenario is too low.
Something from the site of “the boss ” ,Mike S ,the man I refer as with the black goo,black face and black hands , but always dependable . DUC ‘s will not save your butt .
https://www.oilystuffblog.com/single-post/2020/09/28/Quack
Be well . Of course visit his site .
From comments section of oilystuff there was a link to a good article on DUCs
https://www.linkedin.com/pulse/what-significance-duc-eric-gagen/
Well worth a read IMO, and Mike’s stuff is always great.
Ron,
Great post but the chart for Kuwait seems wrong(old).
Yeah, sorry about that. I just got a new computer and somehow things got messed up. This chart of Kuwait is only through August but Kuwait was up only 7,000 bpd in September. I will have it fixed by next month. All the other charts seem to be correct.
Based on most recent EIA tight oil data, my model needed a bit of an update (my guesses at future completion rates developed in March were running a bit low relative to the actual output.) Chart below reflects the latest update where completion rates were adjusted so that September output is close to EIA reported tight oil output (previously the model was 10% below actual output based on the earlier guesses for tight oil completion rates.)
Longer term chart for tight oil, note that obviously any estimate beyond Sept 2020 is speculative and the further into the future, the more likely the scenario is to be wrong, we don’t know what will happen tomorrow, 20 years in the future is a very long time. The model’s output is based on a set of price and other economic assumptions and the mean TRR estimates for tight oil from the USGS which are likely to be revised in the future.
This is the updated model I referred to in the comment just above, revised to agree more closely with data available currently.
Thanks, Dennis, best laugh I have had all day. 😉
Glad to make you laugh Ron. The chart below uses a log scale to show the rate of increase in the completion rate and the rate of increase in output (it will be the slope of the curve on a log vertical scale vs time on horizontal axis. The rate of increase in completions and output is slower than at earlier times for my scenario.
Frac spread count
see
https://www.youtube.com/watch?v=RlwkyHNOyxQ
US Horizontal oil rig count from
https://rigcount.bakerhughes.com/na-rig-count
Oil and gas bankruptcies blow through new record in Q3, already eclipsing 2016:
https://wolfstreet.com/2020/10/14/great-american-oil-gas-massacre-bankruptcies-hit-new-milestone-now-bigger-companies-let-go/
Seems like the EIA’s Drilling Productivity Report is getting more accurate. They had the decline in September tight oil pretty close.
US Commercial Petroleum Stocks (excludes SPR) minus 5 year trailing average. When this figure has been less than 50 million barrels from 2011 to 2020, oil prices have tended to increase. Note that during the third quarter of 2020 this figure fell by about 75 million barrel of oil (MMbo). If that continues in the fourth quarter of 2020 the commercial stocks will be about 25 million barrels above the 5 year average. The average level for US commercial stocks from Jan 2011 to December 2014 when Brent averaged about $110/bo was about 18 million barrels above the 5 year average. So we might see a period of rising oil prices if stocks continue to fall in the US. Note also that we saw stocks fall from 173 million barrels above the 5 year average in July 2017 to 23 MMb above the 5 year average in Dec 2017, this was followed by a significant increase in Brent oil prices from Oct 2017 to Oct 2018 from 57 to 81 dollars per barrel.
I wish you would also show the price on the same graph and then a scatter diagram of price vs stocks. Or if there was a way to get a copy of your data, I’d do it.
Jay,
The data is at EIA
Products supplied
https://www.eia.gov/dnav/pet/hist/LeafHandler.ashx?n=PET&s=MTTUPUS2&f=M
Stocks
https://www.eia.gov/dnav/pet/hist/LeafHandler.ashx?n=PET&s=MTTSTUS1&f=M
Real crude prices
https://www.eia.gov/outlooks/steo/realprices/
A scatter plot shows no relationship, but in my opinion a sharp change in the slope of the days of forward supply (stocks divided by daily consumption) relative to 5 year average leads to a significant change in price. There is definitely more too it than stock changes and price changes, the price reflects the state of the economy and traders opinion about if the demand can be met going forward, stocks are only a part of the story.
Venezuela continues its collapse towards zero oil production:
https://oilprice.com/Energy/Energy-General/The-End-Of-Venezuelas-Oil-Era.html
Libya oil coming back online the next year or three, possible. 1000 Mbpd
“Libya’s warring sides sign agreement for ‘a permanent ceasefire in all areas’ in what the UN calls a ‘historic achievement’.
https://www.aljazeera.com/news/2020/10/23/un-says-libya-sides-reach-permanent-ceasefire-deal
Some of “the best” oil on the planet.
We shall see.
It’s been awhile, comrades. ‘u^
Right now there is an ocean of bonds being issued that are USD denominated. Not just in the US but globally. Outside the US some 1.2-1.3 trillion dollars in 2020 alone. Even China has be issuing bonds denominated in USD. The US dollar is being used as a funding currency. They are cheap and easy to get and excepted everywhere and are being used as a covid recovery currency.
Every problem that was there before covid-19 just got bigger. You can borrow all the dollars you want. Or issue all the dollar denominated bonds you want. But none of that will enable you to get enough dollars to repay the loans plus interest.
There are whole lot of people that believe the value of the dollar has been dropping because the FED is printing money. It’s a popular narrative. But the reality is a crap load of dollars were borrowed. And as payments come due and are made on balances. Dollars will disappear at a rate never seen before and that is in fact highly deflationary.
Even if covid disappeared tomorrow. It doesn’t change anything. That is what people just don’t seem to understand.
If you can’t grow both oil production and consumption. And you keep piling on the debt. You blow up financially.
HHH.
Explain why grain prices are racing higher.
Supposedly ethanol and biofuel demand is still weak.
Maybe we are lucky, but our yields in both areas we operate have been at or near all time highs for every field for both corn and soybeans.
OTOH we are completely in the dumper on oil. Oil can’t just get a bid like grain.
A new thread on Non-OPEC oil production has been posted
http://peakoilbarrel.com/non-opec-oil-production-starts-to-rebound/