A post by Ovi at peakoilbarrel
Below are a number of oil (C + C ) production charts for Non-OPEC countries created from data provided by the EIA’s International Energy Statistics and updated to June 2020. Information from other sources such as OPEC, the STEO and country specific sites is used to provide a short term outlook for future output and direction for a few countries.
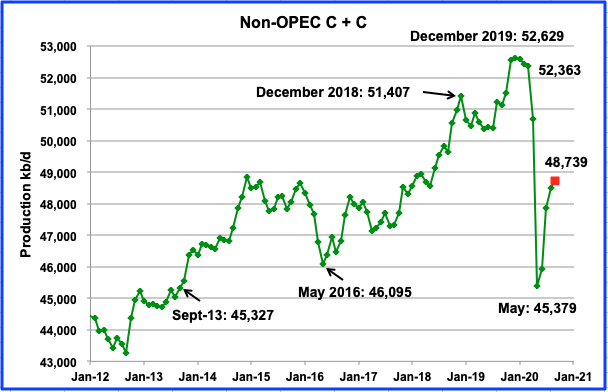
Non-OPEC production has started to rebound from the May low of 45,379 kb/d. According to the EIA, June’s output added 564 kb/d to May’s to end up 45,943 kb/d. Using data from the STEO, a projection for Non-OPEC output was made to September. September output is expected to rise to 48,739 kb/d, with the biggest increment occurring in July, close to 1,000 kb/d. Of the 1,000 kb/d, 500 kb/d will be provided by the US.
Ranking Production from NON-OPEC Countries
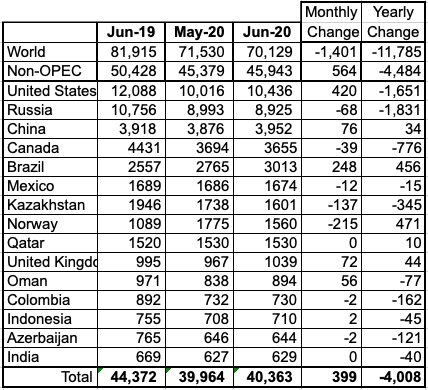
Above are listed the worldʼs 15th largest Non-OPEC producers. They produced 87.9% of the Non-OPEC output in June. On a YoY basis, Non-OPEC production decreased by 4,484 kb/d while on a MoM basis, production was up by 564 kb/d.
Looking at world oil production, it was down by 1,401 kb/d MoM and 11,785 kb/d YoY.
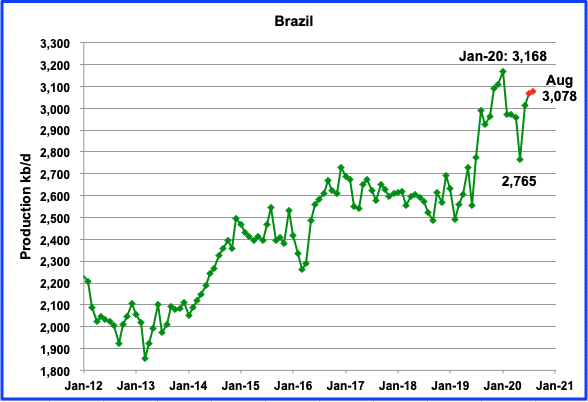
The EIA reported June production was 3,013 kb/d. According to this source, output in July and August increased to 3,069 kb/d and 3,078 kb/d respectively. (Red dots)
The increase in production is mainly due to the Lula and Búzios fields. Production from the pre-salt oil fields in August was 2,200 kb/d.
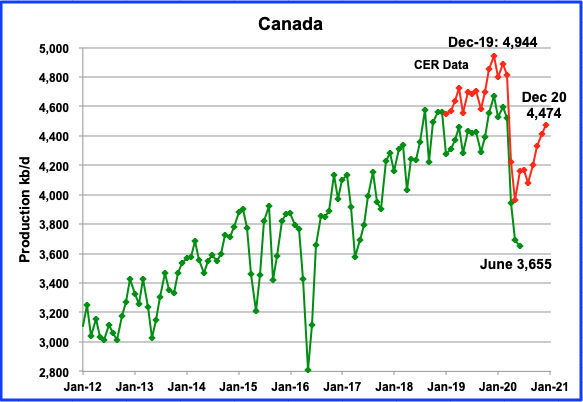
The EIA shows Canadian production was down in June by 39 kb/d to 3,655 kb/d. The Canada Energy Regulator data indicates a production increase for June and is higher because it includes NGPLs in their estimates and is close to 6% of total output. Canadian oil exports by rail to the US fell from a high of 411,991 b/d in February to 38,867 b/d in July, a drop of 90.6%.
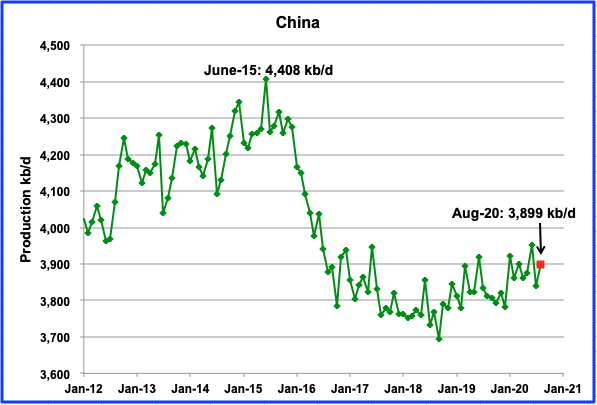
According to this source, Chinaʼs August production increased by 2.3% over last August. Output increased by 59 kb/d to 3,899 kb/d (Red square). However August’s output is still slightly lower than the June’s 2020 output of 3,918 kb/d even though Chinese oil companies have increased their spending to reduce the decline rate in their oil fields.
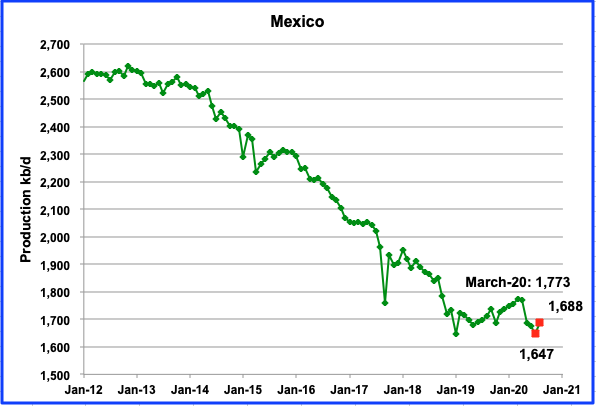
Mexicoʼs production decreased in June by 12 kb/d to 1,675 kb/d, according to the EIA. Data from Pemex shows that production dropped to 1,647 kb/d in July and rebounded to 1,688 kb/d in August (red squares). Under the OPEC + Declaration of Cooperation, Mexico committed to reduce output by 100 kb/d in May.
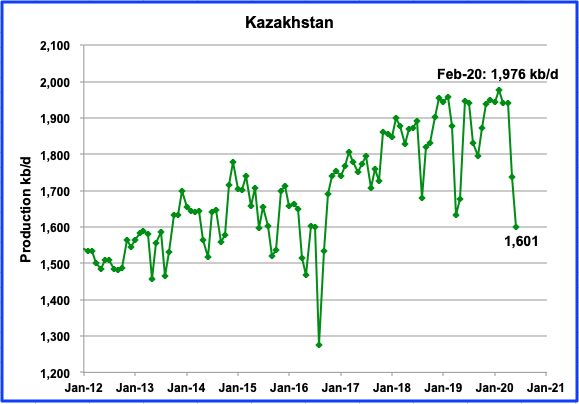
Kazakhstan production hit a new output high in February, 1,976 kb/d. For June, production dropped by 167 kb/d to 1,601 kb/d. According to this source, Kazakhstan states that it cut its oil output beyond OPEC+ requirements in June. This may explain the total drop of 340 kb/d from April‘s production of 1,941 kb/d to 1,601 kb/d.
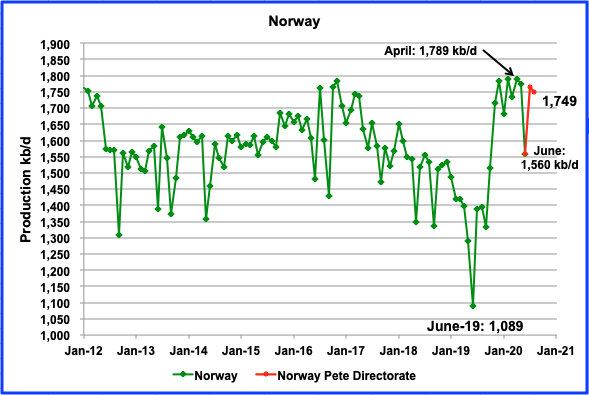
The EIA reported that Norway’s June production was 1,560 kb/d, a decrease of 215 kb/d from May. According to the Norwegian Petroleum Directorate, oil output in July was 1,765 kb/d and dropped to 1,749 kb/d in August. (Red lines)
in April 2020, the Government decided to implement a cut of 134 kb/d in Norwegian oil production. The production figures for oil in July and August do not appear to include the cut of 134 kb/d. It appears to have been a one month cut.
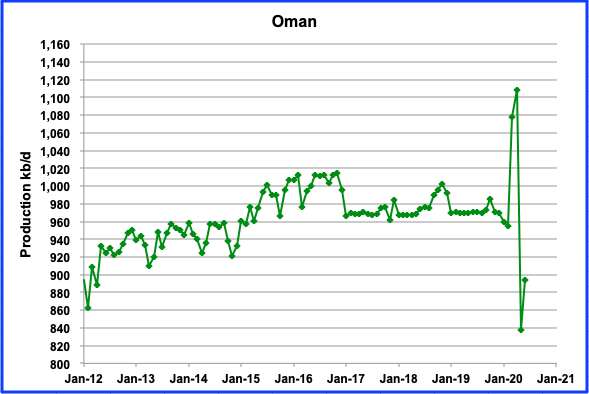
Oman production has been volatile since March. In June production was 894 kb/d, an increase of 56 kb/d from May
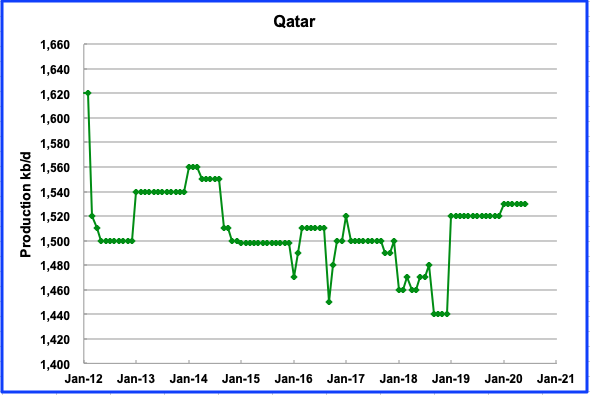
Qatar production has been stable in the 1,520 kb/d to 1,530 kb/d range since the beginning of the year.
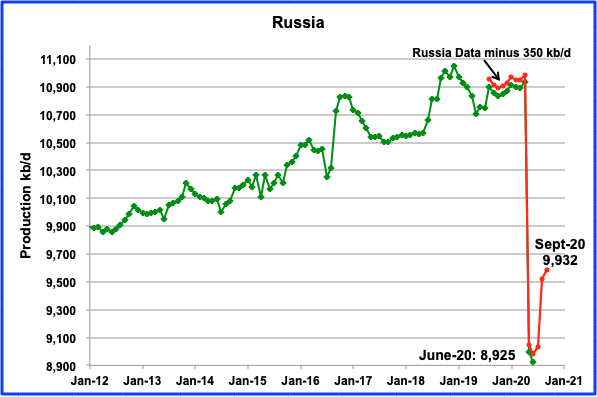
According to the Russian Ministry of energy, Russian production increased by 61 kb/d in September to 9,932 kb/d from 9,871 kb/d. The EIA reported that June output dropped by 68 kb/d to 8,925 kb/d.
According to this source, “Russia’s crude producers are looking to cut 2021 drilling as the pandemic threatens the recovery of prices and global demand, according to one of the country’s top-three independent oil-service providers.
“The nation’s producers, which have reduced oil drilling by as much as one-third so far this year, may cut it by a further 20% in 2021″, said Vitaly Dokunikhin, chief executive officer at Eriell Russia.
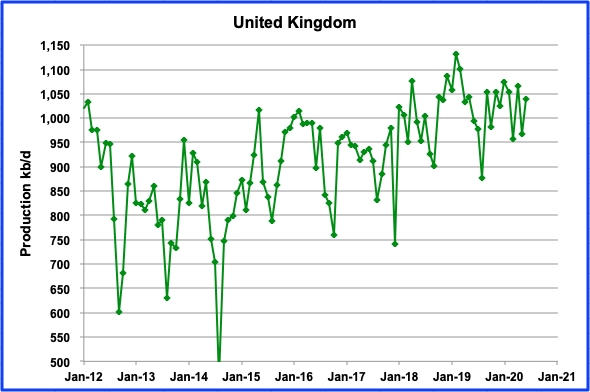
UKʼs production increased by 72 kb/d in June to 1,039 kb/d. According to OPEC, UK production is expected to stay virtually flat for 2020 and 2021.
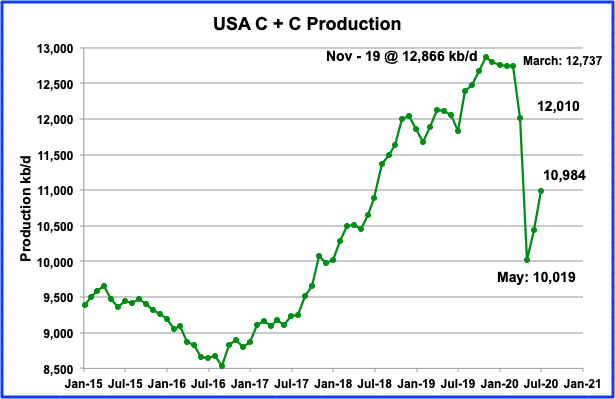
July’s US production continued to rebound from May’s low by adding 538 kb/d to June’s output. Since May, the US has added 965 kb/d, almost 1.0 Mb/d. May’s output was revised up by 3 kb/d from the EIA’s June report.
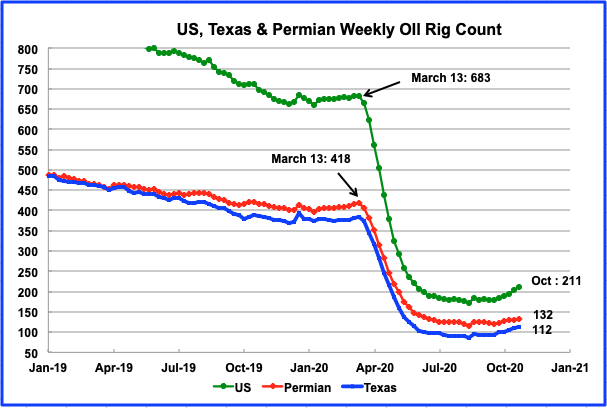
US and Texas oil rigs increased by 6 to 211 and by 3 to 112 respectively in the week of October 23, even though the price of WTI has remained close to $40 since early September.
According to the October DPR, the 132 rigs operating in the Permian in October are not sufficient to increase production. The DPR is estimating that production will drop by 17 kb/d from 4,382 kb/d in October to 4,365 kb/d in November.
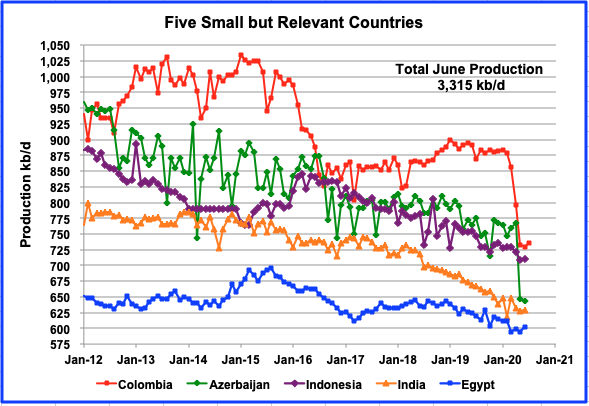
These five countries complete the list of Non-OPEC countries with annual production between 500 kb/d and 1,000 kb/d. All five are in overall decline. Their combined June production was 3,315 kb/d up 7 kb/d from May’s output of 3,308 kb/d. For comparison, April production was 3,516 kb/d, 201 kb/d higher than June.
Non-OPEC W/O US Oil Production
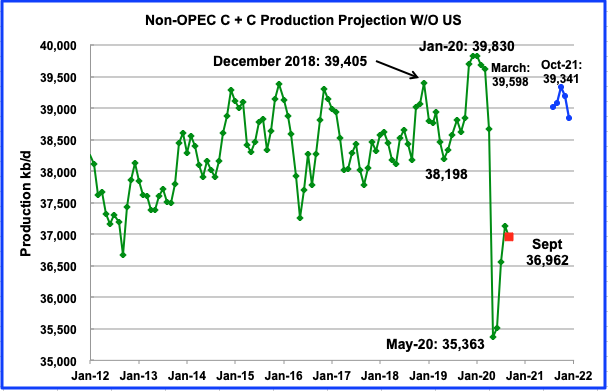
Non-OPEC W/O US output reached a new high of 39,830 kb/d in January 2020 an increase of 425 kb/d over the previous high of 39,405 in December 2018. For comparison, output from Non-OPEC countries W/O the US only increased by 541 kb/d over five years from December 2014 to December 2019. It is an indication that these countries as a whole are approaching an output plateau. May’s oil output hit a low point of 35,363 kb/d.
Using information from the October STEO, output from the Non OPEC countries W/O the US is expected to rebound to 36,962 kb/d in September (red square). Looking further out to October 2021, output is expected to reach 39,341 kb/d. (Blue graph). Note that the October 2021 high is currently expected to be 489 kb/d lower than the January 2020 peak. The 489 kb/d difference is probably within the margin of error of whether the January 2020 high will be exceeded.
World Oil Production
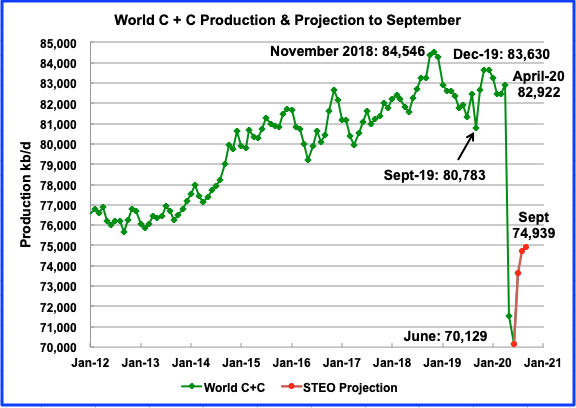
World oil production in June decreased by 1,401 kb/d to 70,129 kb/d and should be the low for the year. This chart also projects world production out to September 2020. It uses the September STEO along with the International Energy Statistics to make the projection. It projects that world production will recover by close to 5,000 kb/d from June’s low to 74,939 kb/d in September 2020.
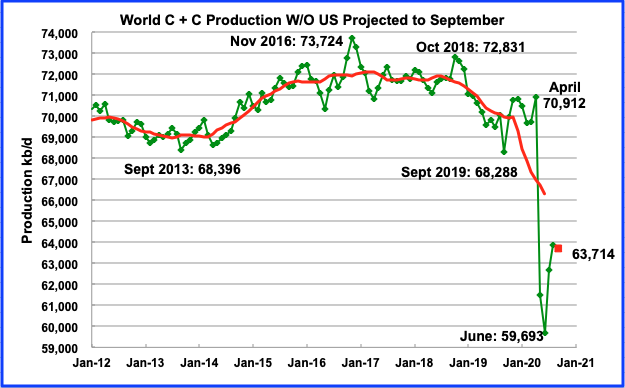
This chart presents world oil production without the US. Note that the November 2016 peak is two years prior to the worldʼs peak shown in the previous chart. June’s production was 59,693 kb/d, a decrease of 1,818 kb/d from May and a decrease of 11,219 kb/d from April.
Using the STEO and the EIA international Energy Statistics, output for September is expected to recover to 63,714 kb/d.
I posted this at the end of the last oil post.
For HHH or anyone else.
Why are grain prices racing higher?
Why is crude stuck in such a tight range?
The Energy-Self-Cannibalizing Snake In The Grass?
Maybe it’s because 1. they make ethanol from grain, (and it’s more local and abundant for some regions) and see the end of crude (sooner rather than later, perhaps due in large part to geopolitical [i.e., Export Land Model] and climate considerations) and, 2. if crude goes too high, it’s too expensive for the general economy, while too low and it’s less (if at all) profitable for producers.
Maybe the economic-energy snake is in the initial processes of eating its tail, as it progresses toward its body. I suppose it’s only a matter of time before it reaches its neck/head.
Dmitry Orlov recently wrote an article (Nefarious Objectives)– partially (and annoyingly) behind a Patreon paywall– that appears to talk about COVID19 in a related sense.
If grain prices are racing higher for those kinds of reasons/in that kind of context, that seems a little frightening that an economy would start digging into our food system like that. If so, it also doesn’t seem to bode well for some transitional greenwashed industrial technotopian dreams that some have.
Because unemployed people don’t travel but they still try to eat.
Shallow sand,
Has the grain harvest been bad due to floods or drought? Perhaps worldwide grain stocks are low, I am not in grain country so I don’t follow this, I would think where you live it would be the talk of the town.
Oil prices being in a tight range may just be uncertainty, nobody knows what will happen with the pandemic and thus demand.
US petroleum stocks have been coming down from July to Oct, if the rate of decrease continues through Dec 2020, we may be within about 25 million barrels of the 5 year average and prices might start to move up then or within 3 months say Jan to March 2021. Probably a bad guess as usual.
Dennis.
Our harvest has been near record setting. There were terrible storms in Iowa earlier this year with high winds which damaged crops.
The primary reason for higher prices is supposed to be strong demand. This is based on government reports.
Some farmers say grain prices are going up due to the election. Some oil producers also say oil prices have been stagnant and low due to the election.
Some oil producers also say oil prices have been stagnant and low due to the election.
Any oil producer should know better than that. Oil prices are a worldwide phenomenon, not driven by an election only in the USA.
Crude prices are in a tight range because that is what the current supply and demand dictate. If prices go higher, then producers that can produce more do so, driving the price back down.
Two big factors influence grain prices- export demand and weather. The big influence right now is export demand increasing. The election is non-news in this sector. Occasionally politics and policy does matter. for example, if the national program of corn ethanol production [equivalent to about 1 Mbpd oil] was to be changed (incentives, mandates, price supports) it could significant change corn pricing in a big way. btw- the corn ethanol production is well greater than all on farm use of liquid fuels in this nation (about 600 Mbpd).
“December corn futures matched yesterday’s 14-month peak this morning, supported by strong export demand – primarily from China. Planting concerns in South America and harvest worries in Ukraine due to dry weather continue to underpin strength in the corn market.”
“Soybean shipments for the week rose 8% to 92.5 million bushels, the largest weekly soybean export shipment volume since November 2017. Soy shipments to China accounted for 72 million of those bushels as China shows few signs of easing demand any time soon. Nearly 613 million bushels of new crop soybean sales are awaiting loadout from the U.S. to China as of October 15.”
“Wheat export volumes remain strong, supported by rising Black Sea prices and a weakening dollar. But last week’s export volume indicates more shipping capacity is needed for wheat in the nation’s waterways to allow the product to flow into international markets…However, export demand remains constrained by corn and soybean bushels dominating shipping channels as they are harvested out of Midwest fields. ”
https://www.farmprogress.com/morning-market-review/morning-market-review-oct-23-2020
Grain yields are disappointing worldwide and strong demand from China is what I understand to be the case.
https://www.allaboutfeed.net/Raw-Materials/Articles/2020/10/Drought-is-causing-an-upward-trend-in-grain-prices-659421E/
Demand from China is pushing grain prices higher. They have a major food shortage due to floods,locust,and swine flu. None of which are going away anytime soon. They have to have US dollars to purchase most of the food they import regardless if they are buying from the US or not. Wonder how that works if the US and elsewhere don’t produce as much food due to a lack of oil and other fossil fuel inputs.
When you look at Asia as a whole. The gap between what they produce and what they have to import fossil fuel wise is the greatest. Anybody investing in China is delusional and believes energy will never be a problem.
As far a crude being stuck in a range. Price moves on what future expectations are when there is no other catalyst to drive them. Honestly the majority of people can’t call it one way or the other. Food prices are stable until there is a shortage. Oil is no different. Oil right now just lacks that catalyst that is going to push it one way or the other.
SS, see the FAO’s food price index:
http://www.fao.org/worldfoodsituation/foodpricesindex/en/
It’s now at 98, increased the last four months in a row. But 2 less than the 2014-2016 average (100).
>> Reflecting brisk trade activity amidst increased concerns over production prospects in the southern hemisphere and dry conditions adversely affecting winter wheat sowings in many parts of Europe, wheat prices rose sharply in September. International maize prices exhibited a notable surge as well, responding to cuts in production prospects, especially in the EU, and the expectation of a significant drop in supplies in the United States of America, following the downward revision of the country’s maize carryovers from the previous season [EOQ]
Correspondingly, the cereal price index is up 13.6% YOY
>> The FAO Cereal Price Index averaged 104.0 points in September, up 5.0 points (5.1 percent) from August and as much as 12.5 points (13.6 percent) above its value in the corresponding month last year. [EOQ]
40% of US corn production is used for ethanol.
I have followed grain and oil prices since the 1990’s.
There is a lot of paper trading momentum that drives them.
The idea that commodity prices are strictly a supply/demand matter is very naive, IMO.
I am glad grain prices are rising personally, as they help to make up for the horrific oil prices we are experiencing.
On another matter, several months ago I said Biden was against fracking. I was correct, as it turned out.
He is going to win, but he did cause himself some problems at the end of the debate.
Sure will hate to see all the energy jobs that will be lost in the next few decades. It is going to hit my community very hard. Lost 60 $100K plus jobs recently. There will be about 650 more lost when the oil refinery is closed, and about 100 when our oilfield is shut in and plugged out.
Both the refinery and oilfield have been here over 100 years. But time marches on, and maybe the losses our community experiences will be gains for another community.
SS , this is what happens when everything is financialized . No correct price discovery . Biden against fracking ? We will wait and see , he has to win first . Still 12 days to elections and Hunter Biden revelations could derail him . I don’t live or vote in the USA ,so just of academic interest . But I feel sad for guys like you and Mike S getting shafted , all news from the oil patch are negative . I have a bet with Dennis that oil will be $ 25 by max 2025 . I hope I don’t win because that would mean the end of our arrangement of living .
I think this energy transition is going to be very rocky.
Not sure what we will do with our leases.
Energy transition is happening regardless of who gets in the white house.
Trump came in with grand pronouncements about the coal industry, yet during his term the share of the nations electrical generation fell from 30 down to 20%.
Ford, GM, and all the rest are not about to halt their ambitious plans to remain relevant over the next decade (electrification).
The transition will take another decade or two, minimum. Regardless.
The USA should be charging ahead in this industry, rather than just surrender it to the Chinese and other innovators.
Don’t think Hunter Biden matters to anyone other than those who were going to vote for Trump all along.
Don’t think it matters who President is that much as to energy. Fracking ban could be good for oil prices.
Oil companies probably worse than tobacco. At least tobacco has the chance of cannabis with a national legalization.
Still 12 days to elections and Hunter Biden revelations could derail him .
Wrong on both counts. It’s 10 days until the election, not 12. And there are no Hunter Biden revolutions. There is the big Rudy Giuliani laptop discovery and both Twitter and Facebook have banned reports on it because it is such an obvious fake. No one in the mainstream media is even talking about it anymore. So don’t get your hopes up because it is a nothing burger.
10 days ok , but even that time is more than enough to turn the tables . Any way ,it was an observation from a guy 5000 Km away , no skin in the game . However there is something that both of us can agree upon , whosoever wins just got handed the poisened chalice .
10 days ok, but even that time is more than enough to turn the tables.
No, not with Biden’s over 10% lead. Of course, there could be a black swan but that is extremely unlikely. I have no idea what that would be except a heart attack or stroke by Biden. But barring a black swan Biden is in.
Ron, with greatest respect, in this regard I submit you are wrong. It’s going to be Trump all the way, baby. Those polls are all fabricated, as you must surely know.
Nobody really knows until the last vote is counted, at any rate.
True, nobody knows until most of the votes are counted. If Biden’s lead is greater than all the votes uncounted, then it’s over. We won’t have to wait until they count the last vote.
Those polls are all fabricated, as you must surely know.
All of them? Everyone is lying? Even the folks at Fox News? And I am supposed to surely know that? No Mike, I do not believe every pollster is lying. And I don’t believe that a majority of American voters are dumb enough to vote for Trump.
Shallow sand,
About 10 % of fracking happens on federal land, the only place Biden is proposing a ban.
Eventually the oil industry will wind down as the resource is limited, nobody can change that fact.
Dennis.
Seems like the oil industry is about to be put down, and not wound down.
Hopefully someone in the White House and Congress will understand the differences between XOM, shale, and the many small businesses that make up most US onshore conventional production.
After hanging in there for the last few years, the pandemic is putting many of the small oil businesses out of business.
Biden does have a plan for Federal funding to plug all of the abandoned oil wells in the USA. He would start with the worst methane emitters.
I think that is a good Biden policy that is pro industry and pro environment. It would employ many skilled workers for quite awhile. I think he tried to mention that during the mess of the first debate.
Biden could do a lot of good if he would realize how much different the upstream industry segments are. But US conventional is a niche, I know.
Shallow sand,
Doubt the oil industry will suffer much during a Biden presidency. There are many things said during a campaign that never become law.
I hope that those making money and /or wage in the oil and gas industry do well. I don’t think the demand is about to evaporate quickly, in fact it is impossible given the near complete dependence on these fossil fuels for such a huge amount of productive and critical energy use throughout all sectors and regions.
Nonetheless, slow and big change is coming, hopefully in time to help offset depletion of global production of fossil fuels. In Oklahoma, for example, electricity production in 2001 was 63% coal and zero percent wind. By 2018 , it shifted to 24% coal and 32% wind, with most of that change happening in the last 7 years of that period. [nat gas increased from 32 to 41%]
The western half of Oklahoma has powerhouse level solar energy input, within 10% of the Calif Central Valley for comparison. Oklahoma will become a huge solar electrical energy producer/exporter over the next 2-3 decades. The individual landowners numbering in the thousands will be part owners or rent collectors, and the jobs to build out this industry will be numerous. I suspect that at some point late in this decade it will feel like a frenzy of activity.
note- grazing can coexist with solar pv if designed with that in mind from the start. good idea
Dennis. The only place the executive branch could end fracking without Congress is on federal lands.
I think Biden is also for no new permitting offshore, including GOM.
Shallow sand,
Often promises are made during a campaign that are not kept. Not sure there is a lot left in GOM that does not already have permits.
SouthLaGeo might know or Mr Kaplan, probably both.
This is one that does concern me – it appears that a Biden administration would favor a ban on drilling permits on federal lands, which would include almost all of the GOM. (The states own the leases a few miles out from the shoreline, then it all becomes federal leases). This is a big deal. Drilling permits are asked for, and granted, on a single well basis, and usually done only weeks to months before you plan to drill the well.
No more exploration wells, development wells, etc.
All companies could do is produce out the assets they have on line. No more lease sales because you can’t drill on the leases if you are high bidder and awarded the lease.
Could you even do workovers, or is the only thing you could do with a rig is, when the time comes, abandon your wells? Again, if I’m interpreting this right, this is a big deal.
It is not clear to me that Biden’s position is to ban new drilling in federal waters, his position may be no new drilling on Federal land.
What Biden’s dilemma is highlights the problem with our primary system. He has to say one thing during the primary, another during the general.
He is only focused on a few states, but three big ones he thinks are in play are Pennsylvania, Ohio and Texas. So he waffles.
I point this out because I worry, like Obama, Biden doesn’t understand the industry and there will be zero nuance when his administration regulates it.
Then again, Trump claims to be a champion for oil, but low oil benefits him personally, so I’m not so sure the oil industry has a good choice.
Since I still see farm equipment and semi trucks being powered by oil, and still see almost all passenger vehicles powered by oil, and still see thousand of consumer products being made with oil, and see roads being made with oil, it is concerning how little both candidates know about the industry.
By the way, Biden has said he is for no new offshore drilling. He said that to the Democratic base in the primary. More importantly, it is clearly stated there will be no more leasing of federal lands or waters. Whether this will include no more drilling on existing federal leases is unclear.
Our concern with Biden are the methane rules, which he says he will apply to both new and existing sources. The concern is he will regulate the brand new shale well the same as the 1 BOPD stripper oil well.
At current prices, we will be finished if we have to buy or rent the $80K camera and monitor methane at every well.
shallow sand,
It seems there are solutions to the methane problem, with realistic regulations that could be imposed. No doubt there will be endless lawsuits with the claim that the regulations are an undue burden for small producers. Not sure what the answer is, but regulations can be revised and improved, I would think a big oil producing state like Texas would lead on this, rather than simply fighting all regulation, work with the EPA to develop realistic regulations for methane from stripper wells that won’t drive most small operators out of business. I imagine you could come up with a plan that would work.
Also found this interesting article
https://iprb.org/blog/2019/important-context-on-illinois-oil-gas-production-methane-emissions/
Dennis. The IPRB article is the stripper well dilemma regarding methane.
When the Obama Administration proposed methane emission regulations, there was a stripper well exemption.
The Sierra Club and other groups fought that, claiming to find some abandoned gas wells in PA emitting methane at high levels. Rather than studying the issue in depth, the Obama administration just went along with the environmental groups and eliminated the stripper well exemption entirely.
I do not know if the study mentioned in the article has been released. I will look when I get a chance.
Shallow sand,
I imagine your oil field will be producing for a long time, also would think oil refinery will keep running as demand returns to normal.
Biden plans to transition to more renewable, but I am sure he realizes we will need oil and gas for quite a while, the push for renewable energy is to make a transition possible and to create jobs.
Dennis. I hope. But this is dragging on.
The oil price range for us since March, 2020, has been from $15-$38. This has been brutal and doesn’t show any sign of getting better.
We assume the companies that have debt aren’t paying the banks. We are starting to see the banks give up and force liquidations. We have seen service equipment selling for 1/4 to less than 1/10 of what it brought 2010-14.
Should bring service costs down as good companies can buy assets cheap and pass savings on to operators.
If 40% of US corn production disappears over next 5-10 year for a variety of different reasons. Ethanol goes away and or exports of corn go away.
I think scarcity is both highly deflationary and inflationary at the same time. Meaning price of goods goes up but the the ability to pay goes down. Basically a bunch of people get priced out and sent to the poor house. So demand falls and prices rise. Only the better off people get to consume.
At some point the currencies of certain countries are no longer exchangeable for goods and services in global markets. And they are also no longer exchangeable for US dollars to buy goods and services in global markets.
We are going to de-oil some folks.
In a world of scarcity. Do countries like say Italy get to keep spending money that they don’t really have in order to continue consuming beyond their means?
Forced austerity is coming. No amount of government spending and central bank financing of government spending is going to change this outcome.
What happens when you can no longer borrow from the future as it becomes clearer that future profits won’t be there to service debts?
Banks and credit markets are in serious trouble right now. The last thing they need right now is to be adding more leverage to the system.
I think we are at the end of a debt super-cycle. And a deleveraging on a truly massive scale is in the cards. Debts aren’t going to be inflated away. They are going to be defaulted on. You can’t inflate away debt in a fiat monetary system.
Two reasons. The way money is created. Loaned into the system. There is never enough money in the system to payback loans plus interest. If you even attempt to pay it back there is even less money in the system to payback loans plus interest. So debt just grows and grows until it can’t anymore. Then the defaults come.
I’ve heard the argument before that central banks can just buy all the debt and cancel it. OK well when they do that trillions of dollars disappear in the blink of a eye. It’s no different than a default.
So the pandemic ended the prediction of $160 oil prices. Darn.
I am just asking for opinions for the current situation of corn advancing quite a bit (along with wheat, soybeans etc.) while oil languishes at real prices last seen in 2003 (for more than a short time).
Also, lumber and copper have made moves. But oil is stuck.
I do agree the demand issues are there for oil, but would think there would be at least some demand issues with the the other commodities.
Lithium was way off, have not checked it is awhile. Would think it would be much higher if we believe the headlines.
shallow sand,
One difference between most other commodities and oil is that there is no cartel controlling 50% of reserves and 30% of output (50% if we consider OPEC+). So in many cases oil prices will not move in lock step with other commodity prices. When an approved vaccine is announced, we may see oil prices move, or when OECD commercial petroleum stock levels are within 25 to 50 million barrels of 5 year average. I expect we will be over $45/bo for WTI by Dec 2021 and over $50/bo by year end 2023, my best guess is probably $7/bo higher than this estimate. Unfortunately I never get future oil prices right (of course the futures market is not much better).
Pardon my intrusion and abrupt comment at this point, but it is worth stating that True Peak Oil was November, 2005. Or rather, Peak Energy production was November, 2005. It is clear from the way the economy is going -and will go henceforth- that the aforementioned is a done deal.
The ship has long since struck the ‘berg. At this point, the bow is separating from the stern.
Dennis, with respect I’ve selected this scene from James Cameron’s ‘Titanic’ for your review: https://youtu.be/7SOPCyr-RaI
And this, with the noteworthy line -“The pumps will only buy you minutes” – https://youtu.be/SP7BWb1ndpA
Michael Sutherland,
Perhaps you mean “net energy”, a quantity which is not easily measured as the boundary around where the “energy industry” begins and ends is far from clear and there are often 5 estimates of net energy for every two resource economists.
Here is the primary energy consumption in Exajoules from BP statistical review of World energy. The “peak” in 2005 is hard to find here, maybe you could point it out. 🙂
HHH, very well explained . The key is as you have said ” Debts aren’t going to be inflated away. They are going to be defaulted on. You can’t inflate away debt in a fiat monetary system.” Italy and Spain owe Germany Euro 1 trillion and are bankrupt . 20% of their GDP was/is tourism . It is finished . Spain has implemented a lockdown for the next 6 months and same with Italy . Funny money . Italy just raised money in the bond market at negative interest rates .
Debts aren’t going to be inflated away. They are going to be defaulted on. You can’t inflate away debt in a fiat monetary system.
A couple of points here. You guys talk about “a fiat monetary system” as if there were other types of monetary systems. There are no other kinds, not even one. There may have been in times past, but no longer. All forms of currency are based on “The Faith and Trust of the Government”.
Second point, yes federal debts can be inflated away. Well, not completely away, but almost completely away, depending on the rate and duration of the inflation. If today’s dollar is worth 15 cents in the future, then the debt can be paid back at 15 cents on the dollar. Of course, you still pay back an equal amount of dollars, plus interest, but you are still having to pay a lot less money, or a lot less buying power than what you once owed.
If, on the other hand, there is deflation rather than inflation, then the opposite is true. However when have there been long periods of deflation? I think like…. never. I think it is a safe bet that is not going to happen.
Under the gold standard, money supply couldn’t increase along with the economy. So, you HAD to have deflation, as the ratio of GDP to currency went up and the ratio of currency to GDP had to go down. Very simple.
Deflation was very painful, and led to a lot of “panics” and very long depressions. Only since “fiat” currency was introduced have we dramatically reduced the number and length of recessions and depressions.
What we call a depression, people in the 1800s would have called a mild, tiny recession. They would have thought we were very timid, and easily scared at very small variations in the economy – a bunch of wimps. That, of course, was because they had to deal with things that were much, much worse. For instance, the US had a recession just after WWI that is barely mentioned in history books, but was easily as bad as what we’re going through now.
The gold standard was hideous. “Fiat” currencies and controlled low inflation has made life enormously better.
You don’t get it. If debts are paid back money disappears. There are absolutely no intentions of paying back or paying down debt of the government variety. Only way to lessen the burden is for the value of the debt to decline. Which means you lose money on bonds and interest rates rise. Which cannot be allowed to happen. It can’t be inflated away. Only rolled over again and again until it can’t be rolled over anymore. Then debts are defaulted on. Be it debt forgiveness. Straight up default or partial default happens.
Now if governments want to change how money is created and create money with no loan attached to it. No debt attached. Then maybe debts can be inflated away. That is not fiat money though. That is suicide by hyperinflation.
I think i’d rather experience debt deflation than hyperinflation. At least your currency still has value and you can start over at a much lower level. No guarantees you get to start over with hyperinflation. You don’t really get to control your own destiny as your currency has no value. Your at the whims of other nations.
We just aren’t going to grow our way out of debt like after WW2 Too much debt and back then there was a lot of untapped oil still in the ground.
back then there was a lot of untapped oil still in the ground.
Fortunately wind and solar are much cheaper as a source of energy, and batteries are as cheap as oil for portable storage, and getting cheaper fast.
And wind and solar are domestic, so money spent on them circulates domestically instead of leaving the country and stimulating the economy of KSA (or Texas or ND, if you’re from, well, any of the other 48 states…).
My thoughts on the issue . The FED has been trying to create inflation for a long time. It could not meet it’s target of 2% and last month announced end of inflation targeting. However we have now a situation where there is inflation in all things essential (except oil) items like healthcare ,education ,food ,shelter etc and deflation in all things non essential like smartphones, luxury , restaurants , vacations . I fear that over a period of time the industries that are in the deflationary sectors of the economy will start shutting down causing production and supply chain problems in the essential goods sector . This will be inflationary . The question is will there be shortages or scarcity ? Shortages can be overcome but scarcity is a different story .
As to default , I have my doubts that it will be resorted to but in a SOS situation . Reason being that this will be a recipe for war . China with 3 trillion, Japan with 1 trillion , India with 540 billion ,Germany 650 billion and all other countries holding dollar reserves will not take it lying down .
HHH makes a very important and valid point ” there is no more untapped oil ‘”. We are definitely on the downward slope of ” net surplus energy ” for the economic system to recover . Sorry , Nick wind and solar are not a substitute for oil ,that has been extensively discussed here .
You don’t get it. If debts are paid back money disappears.
Dammit HHH, I know that. I didn’t just fall off a turnip truck. You are the one that doesn’t get it. I said nothing about money being paid back. The debt is lessened by inflation.
Only way to lessen the burden is for the value of the debt to decline. Which means you lose money on bonds and interest rates rise.
Yes, that is called inflation.
Which cannot be allowed to happen. It can’t be inflated away.
Oh really? Then why in the hell did it happen????? I lived through it. The debt from the Vietnam War was inflated away. It has happened before and it can damn well happen again.
More on the inflation rate.
The chart below is a longer term chart of the US inflation rate. The first dip is the deflation during the Great Depression. The first spike is the inflation caused by the massive spending of Roosevelt’s spending to get us out of the Great Depression. The second spike was the WW2 debt being inflated away. The third spike was caused by the Korean War debt.
Just one more point. It just occurred to me that some folks, younger folks who are new to the inflation debate, may get the impression that when I say “inflated away” that I mean it disappears. No, the actual dollar amount always increases but the actual value of the debt is decreased by inflation. And in hyperinflation, several times in the past, the value of the debt is decreased greatly.
The data for my above chart can be found here, along with the cause, each year, for the inflation:
US Inflation Rate by Year from 1929 to 2022
Ron,
Debt is not inflated away per se. It gets easier to service and repay debt when salaries increase. The situation going forward seems to be inflation (higher cost of essentials/living/food) absent, or with little, increase in the pay check. This is not the same as the situation post WWII and we are in uncharted territory of how central banks will respond. I think limits to growth has a lot to do with this.
Debt is not inflated away per se.
Jeff, I know that. As I told HHH, I didn’t just fall off a turnip truck. But the debt is inflated away in value. If the debt is two trillion dollars, then after a few years where inflation has reduced the former dollar to fifty cents the debt is still two trillion dollars but only half what it was originally…. in value. (Assuming no additional increase of course.) It becomes easier for taxpayers to reduce the debt because they are now earning more and paying more taxes.
The term: Inflating Away the Debt has been around for at least a century. Everyone on this blog should know exactly what it means. I assure every politician in Washington is very familiar with the term.
It is just not that hard to understand.
Nick wind and solar are not a substitute for oil ,that has been extensively discussed here .
Well, no. Yes, there’s been a lot of discussion, but there has not been a consensus that wind and solar can’t substitute for oil. On the contrary, they absolutely can.
If you’d like to discuss that here, or move to “the other side”, just say so.
But debt can be inflated away….absolutely it can without the slightest problem. Printed money was invented for just such a thing.
On debt- Debt can be useful if the money borrowed is an investment in productive assets.
Is that how we spend it?
And do we pay it back during good times?
Shallow sand,
Short term price movements are driven by paper trading. No amount of paper trading can overturn the fundamentals of physical supply and demand in my opinion.
Both Ron and I are well aware that futures markets can become disconnected from physical markets over the short term, on April 20 the spot market price for WTI was -39.68 dollars per barrel of crude, this illustrates the phenomenon of paper trading simply causing volatility due to expiration of monthly futures contracts.
EIA spot price data for WTI at link below
https://www.eia.gov/dnav/pet/hist/RWTCD.htm
Nick, since this has been extensively discussed it is not for me to start all over again as it will become argumentized . I will pass . However your comments are interesting and add to my understanding of “your side ” . Tks .
Mr Musk .
https://nltimes.nl/2020/10/23/100-dutch-tesla-owners-suing-automaker-shoddy-cars
Mr Musk
https://nltimes.nl/2020/10/23/100-dutch-tesla-owners-suing-automaker-shoddy-cars
Can someone in the oil patch answer a question for me.
Biden said that he would end subsidies for fracking. What subsidies does the govt give to Frackers?
Thanks
Ovi,
The oil industry does not get any subsidies that are not available to other mineral producers.
The ending of subsidies to oil companies is just a liberal talking point.
Dennis. You beat me to it, but hopefully I have a little more information.
Mostly what Biden will end is what Obama said he would end and what Obama also claimed were tax breaks for “big oil”. Primarily that is percentage depletion, which only applies to the first 1000 BOEPD produced. It is really a tax break for little oil, and not big oil. Most other mineral extraction businesses, including gravel, are able to deduct percentage depletion under the tax code. Percentage depletion has been in the tax code since 1926.
Oil companies can only deduct percentage depletion against income, so this year there won’t be much taken as there won’t be much income to take it against.
The tax break that applies more to fracking would be expensing of intangible drilling expenses, called IDC’s in the industry. Rather than depreciating or depleting costs such as drilling the well, fracking the well, etc., over several years, companies are permitted to expense these in year one.
IDC expensing is why almost no shale companies have paid Federal income tax since 2014. For GAAP the companies may write these off over 30+ years, but not for income tax purposes.
There aren’t many tax breaks other than those two that are not available to all businesses. When oil prices where high, conventional producers paid a lot of income tax. Percentage depletion did have a big effect in those years, as it is a 15% deduction against gross income. So if a producer sold $100,000 worth of oil in a year and had $35,000 of expenses in a year, it would also be able to take a $15,000 percentage depletion deduction.
Royalty owners benefit from the percentage depletion deduction also.
Shallow Sand
Thanks for your detailed answer.
As a follow up, since Permian wells have a higher initial flow rate than EF wells, and considering the IDCs, does that make Permian wells more economical and break even earlier.
Ovi.
I don’t know that IDC’s make Permian wells more economic than other shale basins.
I can explain how shale companies make themselves look profitable without being profitable.
You have heard about shale overestimating reserves. This juices GAAP earnings in the short term.
For example, let’s say we have a well where the company spends $10 million in intangible costs. The company estimates over the life of the well it will produce 1 million BOE. So, for every BOE produced, the company deducts $10 of cost depletion for GAAP purposes. However, say the well only will produce 500K BOE of its life. The company should have deducted $20 for every BOE produced.
But, for income tax purposes, this doesn’t matter as the intangible drilling costs are all deducted in full the year the well is drilled.
This is how a company like Pioneer Natural Resources can show GAAP earnings while having accumulated an over $5 billion net operating loss from 2015-2020.
GAAP earnings are of little value in analyzing upstream E & P’s. There is a Seeking Alpha blogger named Raw Energy, that has some really good posts about this and other accounting issues that relate to shale companies.
I will add that reserve write downs and “one time charges” do matter. That is real money being lost.
I honestly do not know how or why companies are drilling and completing wells right now. OPEC and Russia have cut several million barrels of PDP to try to balance the world market. There is no need for new wells, and will not be for quite awhile.
I cannot make the math work for how shale wells now could be economic. I am baffled as to where the money is coming from for these.
The frack spread count keeps rising and the rig count is rising. Yes, from low levels. But I cannot fathom what would make any of these companies drill now, other than commitments in leases. Even then, it would seem maybe best to let those expire.
COVID isn’t going away. I cannot see any signal regarding a rebound in oil prices. But I didn’t see one during 2016-19, when shale drove US production up by over 4 million barrels per day.
SS , a dialog from Taxi Driver ,Robert De Niro ” You talking to me ” .
1. Amazon, Alphabet ,Apple , Microsoft have a market cap of $ 6 trillion . That is more than the GDP of all countries in the world except USA and China .
2 . Tesla with 1/20th the revenue of Walmart is valued higher and is now the 9th biggest company on the planet .
Like I said ” You talking to me ” . Things are out of whack . Every time I think nothing can beat this, a new one emerges, like developing a 5 G network on the moon . Not surprising for me ,but I ask the question ” What are these guys smoking? ” . Be well .You and Mike S along with many others are in hot water. My only consolation is that you guys know it and are taking defensive actions .
Shallow sand,
For producers with low royalty costs (Chevron in Permian) the new wells might be profitable, also remember there is a distribution of EUR for new wells, in the most productive areas the average EUR is higher and new wells in those areas might pay out at currrent oil prices. Mostly, I agree, especially based on average well cost, average royalty cost, and average new well EUR, seems we should see fewer new wells drilled by tight oil producers, we saw the same thing back in 2015 to 2016, more wells were drilled than seemed to make sense from an economics perspective.
I am at a loss to explain this.
Shallow Sand/Dennis
Suncor just reported its Q3 results. Attached is an analyst summary from TD Bank that provides some costs and netbacks for oil sands and conventional oil. Note that the report focusses on cash flow (CF) per share, Cdn76¢, and the oil price they received is $Cdn47.85/b. The earning were -1¢/shr but there is no mention of earrings in this report as Canadian analysts focus on CF. SU reported the earnings as required by law. If someone wants the full report, I will send it to Dennis.
Thanks Ovi,
Note that my focus tends to be on tight oil producers. At $40/bo completing a new well does not seem logical, but perhaps many of these producers have some of their output hedged and are receiving higher oil prices than the current spot price.
For example EOG, generally one of the best tight oil producers in the US burned about 490 million in cash for quarter 2 of 2020. In quarter one of 2020 they slowed their capital spend and had a positive cash flow of 879 million, probably they could see the coming storm. In the first six months of 2020, EOG sold their oil at an average price of about $37/bo, they have also cut capital expenditures by about 33% from the first 6 months of 2019 when oil was sold at around $60 per barrel (average selling price over those 6 months).
https://www.google.com/finance/quote/EOG:NYSE?sa=X&ved=2ahUKEwiTh9q03tzsAhUcmHIEHYpbB8EQ3ecFMAB6BAgBEBk
Thanks SS
I don’t understand GAAP rules or earnings with regard to oil wells. Here is Canada, the oil analysts primarily focus on cash flow. CF must cover drilling costs and all other expenses, interest, dividends etc. A few analysts say CF is not recognized by financial rules and only earnings are meaning full. So many companies put out both. There are many casee where CF is positive and earnings are negative. I think depreciation drives earnings negative in many cases.
shallow sand,
Are the the equivalent of IDC tax breaks available for all mineral producers or just for oil and gas companies? My guess is these tax breaks would be available for a lithium mine in the US, but I am not a CPA so may be wrong.
Dennis. I found an article which discusses the effect of IDC’s upon federal income tax revenues. It is dated 10/17/2013 and is on the website crfb.org.
First, IDC expensing is only available to independent producers, and not integrated companies like XOM and CVX.
Second, from this article, the impact on repeal of IDC expensing from all oil and gas companies was expected to increase tax revenue by $14 billion from 2014-23, while repeal of expensing from all extractive industries, including oil, gas, coal and other hard mineral mining, was expected to increase tax revenue by $18 billion.
Based on this, it appears there is expensing for other mineral extraction besides oil and gas, but that oil and gas made up the largest percentage at the time the article was written.
The article also states that IDC expensing has been in the tax code since 1913.
As far as lithium, I am not aware of the federal taxation rules for lithium mines. I do know that Nevada has given state tax abatements to a proposed lithium mine in Humboldt Co. totaling about $8.6 million. In doing some further reading, I learned that the process of this particular lithium mine involves burning sulfur and diesel. There is local opposition to this mine, which has a website claiming there will be 75 semi loads of sulfur burnt at the mine each day, with the residue being dumped on a tailings pile, and that the mine will also burn 11,300 gallons of diesel fuel at the mine and another 14,794 to power boilers at the sulfuric acid plant, each being daily. The opposition site pulled these figures from the Plan of Operations and Reclamation plan.
I know the lithium information is far afield of oil and gas, but thought it was interesting.
COVID19, Never Letting A Good Crisis Go To Waste, & The New Normal
How much oil left in America? Not much
Geopolitically-speaking, the USA government appears to have (so far) essentially failed (thanks in part to, yes, Russia) with its assorted Middle East proxies; failed with Syria; failed with Venezuela (also likely thanks in part to Russia) and ‘installing a puppet’ (Guaido); and failed with Bolivia for its lithium mines; while failing at home with its fracking.
Covid19 as an opportunity for energy cannibalization (braking/breaking/throttling the economy) seems like a logical progression from the above, such as if the USA (with therefore other countries being impacted, which may be partly why many of them have gone with the ‘covid narrative’) is running out of energy from/at home while failing to secure it elsewhere.
See also, The Manufacturing of Greta Thunberg
My thoughts exactly Caelan MacIntyre. Peak conventional oil in 2005, financial crash in 2007. Peak global oil production in 2018, repo market crisis in 2019. Covid 19 March 2020.
Hume,
Peak conventional (if we define conventional as all crude plus condensate except extra heavy (API gravity<10) and tight oil) was not 2005, it was 2016 at 73 Mb/d. Note that since 2016 Iran and Venezuela have been under sanctions and the World has been oversupplied with oil, so conventional output might rise as tight oil output falls after 2030.
Dennis
When you say the world has been oversupplied with oil, you’re aware global oil production hit a peak of 84 mb/d in Nov/Dec 2018. But worldwide demand for oil reached 100 mb/d.
Which makes me wonder how was demand satisfied, if indeed it was.
Hume, that peak was C+C. That demand peak was total liquids.
Should bring service costs down as good companies can buy assets cheap and pass savings on to operators.
Shallow sand,
Everyone would rather hear from you myself included.
Your answer far better imo.
just picked this from Mike Shellman’s blog .
https://www.worldoil.com/news/2020/10/20/recent-deals-reveal-a-buyer-s-market-for-shale-operators
Shale is breathing its last dregs of air , the only reason to buy shale assets is to strip them and scoot leaving the creditors and others holding the bag . SS will know better .
Love the last line,
‘”With the underlying decline rate that approaches 40%, it’s hard to distribute cash back to the shareholders as rapidly as we can in this new model,” Concho’s Leach said.’ – literally admitting to the ponzi scheme and the fact that the grift reservoir is depleted.
Hole in head,
Not at all the impression I get from that article. This is a classic case of industry consolidation, i.e. the big fish eat the small fish. Demand will rebound, oil prices will rise and well run tight oil companies may turn a profit, if Brent oil prices rise to $75/bo (likely higher) by 2030 and remain at that level (or higher) for 10 years or so.
Chart below has a Permian scenario using my $75/bo (2019 $) maximum Brent oil price scenario (2030-2040), on left axis we have cumulative net revenue for all Permian tight oil producers in billions of 2019 US$ (where we assume all wells are average wells and average new well EUR increases from 2010 to 2019 and starts to decrease starting in Jan 2020. Assumed Permian basin TRR=75 Gb (USGS mean estimate) and economically recoverable resources for the oil price scenario used (along with other economic assumptions) for the scenario is 50 Gb (about 6 Gb was produced from Jan 2010 to Sept 2020). Annual interest rate on accumulated debt is assumed to be 8%, debt for the model was 75 billion for all Permian basin producers in Sept 2020, debt is paid off in full by April 2029.
“Chart below has a Permian scenario using my $75/bo (2019 $) maximum Brent oil price scenario (2030-2040)…..”
Wow. Just wow. A prediction for $75 made to ten years out, no less. Ten years.
What could possibly go wrong?
A scenario is not quite the same as a prediction. Simply a set of prices used for an economic model. See link below for EIA reference Brent oil price scenario, not the Average price in 2030 for that scenario is $75/bo.
Actual average annual Brent oil price (in 2019 $/bo) is unknown for every year from 2020 to 2030, an obvious fact I thought was unnecessary to point out to the (mostly) intelligent readers here.
https://www.eia.gov/outlooks/aeo/data/browser/#/?id=12-AEO2020&cases=ref2020&sourcekey=0
Absolutely savage Dennis. Well done.
Hey doodles ,….Fuck You
You worthless asshole. This is between me and Dennis, you are a worthless piece of shit and won’t amount to anything.
Way too much presumption. People will starve without oil. And so there will be oil. And likely as a consequence of subsidy rather than nationalization, since it is such an international thing. It will be much easier to get that through with a Trump presidency and the GOP holding the Senate, than the reverse when the entire government will be filled with oil haters. They would never accept the necessity. They would claim that that is a lie and demand food appear where they tell it to appear.
Joe Boden (and his handlers) aren’t as stupid as his followers.
Starving people cannot afford oil. So the rate of ‘unraveling’ increases…
New US update at http://shaleprofile.com click on blog link at top of page. Mr. Peters has a hypothetical supply case where US horizontal rig count increases by 5% per month until the end of 2021 and then holds steady at 505 rigs, supply increases to about 6200 kb/d by Dec 2030 for this case (average well productivity assumed constant at Jun e 2020 level for this scenario).
Link to blog post below
https://shaleprofile.com/blog/us-monthly-update/us-update-through-july-2020/
Dennis from you” Not at all the impression I get from that article. This is a classic case of industry consolidation, i.e. the big fish eat the small fish. Demand will rebound, oil prices will rise and well run tight oil companies may turn a profit, if Brent oil prices rise to $75/bo (likely higher) by 2030 and remain at that level (or higher) for 10 years or so.” Yours is an “if ” scenario .
Read the post of twocats and the admission of Mr Leach of Concho . Self explaintry . The future of shale is , I think 3S ” Sell, Strip ,Scoot ” . SS and Mike S know better .
Watcher , I agree with your observation . Must have oil ,subsidize ,nationalize ,steal or go to war . The alternative is empty stomachs . There are no volunteers for starvation .
Hole in head,
There is no doubt that Shallow sand and Mr. Shellman know far more than me.
I think there is more to the piece you linked to than the one line about distributing cash back to shareholders quickly due to declining production. The tight oil wells do decline very quickly from their peak output, but note that getting output produced quickly reduces the time needed for a well to pay out. The ideal well would produce all of its EUR in its first 30 days (a physical impossibility with todays technology), note that such a well would have a very high decline rate, but might be very profitable at the right oil price and well cost.
My guess is that the industry executives that have decided to make these all stock deals think the companies they are merging with have assets that are valuable at the price they are offering for the stock deal.
From the outside I have no idea, but if oil prices rise as I suspect they will, these companies will make money.
If oil prices fall to $25/bo as you suspect, then they will fail. Note that the futures strip has WTI at $50/bo for the Dec 2030 contract, if we assume 2% average annual inflation from 2020 to 2030 that would be $41/bo in 2020$. Not much money would be made at that price, but I believe the futures strip will be incorrect. I base my guesses in part on the EIA STEO over the short term and EIA AEO reference scenario medium term (to about 2030) then I simply assume a $75/bo maximum Brent price in 2019$ to be conservative and that a transition occurs to bring down oil demand by 2040 (oil prices are likely to rise higher than Brent at $75/bo in 2019$). The AEO 2020 reference Brent oil price case has 2040 average price at $90/bo in 2019 $, 2030 Brent price is $76/bo in 2019$.
https://www.eia.gov/outlooks/aeo/data/browser/#/?id=12-AEO2020&cases=ref2020&sourcekey=0
Dennis , I have already clarified that yours is an “if ” scenario . Quote ” If wishes were horses ,beggars would ride .” If is just that
“if”.
Hole in head,
Same applies to your scenario and all scenarios.
The future is not known.
When the Soviet Union collapsed in 1991, subsidized oil deliveries to Cuba
and N. Korea were halted and the two countries had to get by with about 1/2
the oil over night. In N. Korea, a large number of people starved to death
https://en.wikipedia.org/wiki/North_Korean_famine. The Cubans invited
experts in eco-agricultural techniques from Australia to teach them how to grow food
without fossil fuels. The Cubans were hungry, but didn’t die of starvation, see
https://en.wikipedia.org/wiki/Special_Period.
Hint:
Castro died of old age—-
Schinzy,
Jörg Friedrichs wrote a book on this a few years ago, “The Future Is Not What It Used to Be: Climate Change and Energy Scarcity”. Countries have responded differently in the past when faced with energy scarcity.
West White Rose work cancelled for 2021 in early ripple from Cenovus-Husky merger
There are immediate implications for Newfoundland and Labrador from a major shakeup in the Canadian oil sector, with Husky Energy confirming construction on the stalled West White Rose extension project will not resume in 2021.
In early April, with its balance sheet in tatters, Husky announced it was reviewing its entire operations in eastern Canada, and it asked the provincial and federal governments to buy equity stakes in West White Rose in order to save the project.
Big question is when all the cap-ex reduction translates to a production deduction?
Frac spread count from Friday Oct 23 was 134, on July 10, 2020 the frac spread count was about 64. The centered 4 week average frac spread count for Oct 9, 2020 was 123, on May 15, 2020 the centered average 4 week frac spread count was 48.
See 3:20 to 3:30 of video below
https://www.youtube.com/watch?v=3_65yc_YywA
Chart for frac spread count Feb 2020 to Oct 2020.
Canadian oil patch companies have been badly mauled this year. No sign of a recovery yet.
Cenovus to cut up to 25% of workforce after merger with Husky
TORONTO/WINNIPEG — Cenovus Energy Inc plans to cut 20 per cent to 25 per cent of its workforce after it acquires Husky Energy Inc, the companies told Reuters on Tuesday, as Cenovus begins to slash costs in the Canadian oil patch’s biggest merger in four years.
Market still believes reflation is on the way and central banks got this. I say that because the end of dollar weakness may not be here just yet. EUR/USD is looking more like a pull back within an up trend than a top now. And EUR/NZD printed a massive pinbar candlestick on weekly chart last week. Wick is pointing up so direction for price is down. Meaning New Zealand dollar will be appreciating. That doesn’t happen if dollar weakness is over.
Makes sense. Market is chasing more stimulus after election. Stimulus might get us $50 WTI.
At them moment the range bound oil price has left the range to the downside.
Great archivement for state companies in Brasil, Norway and other countries holding up or increasing output. They get really much $ for all their extra oil… I hope they have high bills investing in all the new production platforms.
Europe will be in lockdown until broad vaccine usage is possible. But at least they’ll start throwing around more money – for example the newest gag in Germany. Close all restaurants and Bars, even those with all new hygiene concepts and fittings, becaus people got infected on private weddings and parties. Replace 75% of their sales with money from state (.. since nobody is working in non-state-companies anymore, money created from fresh air). And forget their vendors and contractors with the money shower…
Traveling is forbidden, driving senseless (where do you want to drive too?), so you need a lot of stimulus in the US to compensate Europe oil usage.
Let’s see if they manage to create hyper inflation. It’s 97 years ago in Germany they managed it the last time – it was with central bank money, too.
Inflating dept away works in Germany at the moment. We have round about 2% inflation, and negative interrest on state bonds. 2% of 2.1 trillion € are round about 40 billion € less per year, with negative interrest even 50. Not too shabby – if they don’t sink the currency completely the zero interrest policy will stay here for the next decades.
The EIA’s Monthly Energy Review came out yesterday. They have C+C production up 330,000 barrels per day in September to 10,737,000 barrels per day. PDF file of the Review
Also, crude oil taking a dive this morning. WTI down over $2 at $37.50, but rather volatile. Bouncing around like crazy,
Canadian oil patch workers are taking it on the chin.
Varcoe: Oilpatch workers ponder leaving sector as megamerger triggers layoffs
‘We can either sit here and keep waiting and hoping for that oil and gas job to come — and in the meantime, we’ll continue to be unemployed — or we pivot and start to diversify’
Frugal wrote “Canadian oil patch workers are taking it on the chin.”
In a few months they will be taking it on an empty stomach . Sad state of affairs .
Right now WTI stands at $35.57, Brent at $37.23. Coronavirus cases are spiking throughout the world, driving down demand. Yesterday there were 504,412 new cases. Of course, that is just the cases that were counted. We know, worldwide, there were far more cases than that.
Folks, this is going to get a lot worse before it gets better.
Ron ,disagree . No , it is not going to get a lot worse before it gets better . It is going to get lot more worse and then more worse and then more . If 2020 was an year of being crazy ,2021 is going to be the year when the crazies will takeover the asylum .
Then there’s China that claims that they’ve only had 4,634 Covid deaths. With a population of 1.4 billion, their true number must be at least 100 times more.
No, China and Taiwan are handling the pandemic extremely well.
But sure, everyone likes to make up numbers without factual evidence.
Its the presidential thing to do.
https://www.politico.com/news/magazine/2020/10/28/is-president-donald-trump-a-flight-risk-433313
I can’t find any facts about Chinese Covid numbers in your link and just because Trump lies doesn’t mean that Chinese leaders don’t. Chinese Communist Party officials as a group are pathological liars. This is a common theme among dictators who never admit to bad news. For some reason they think they’re perfect and can do no wrong.
Good luck finding factual evidence of the real numbers. The only ones who know the true numbers are the Chinese themselves but they won’t release them. The official numbers are clearly bogus and I stand by my assertion that the Chinese Covid numbers are grossly under-reported.
Yeah, what Fugal said. 😉
So you ‘guess’ that China has 100 fold more deaths.
OK, well then take Taiwan
“Taiwan Achieves Record 200 Days With No Local Coronavirus Cases’
10/29/20
https://time.com/5905129/taiwan-coronavirus-record/
Its called good leadership, with good policies.
Masks, and contact tracing.
I agree that Taiwan has done a very good job containing Covid and that their very low infection rate is probably correct, They’ve done a way better job containing the pandemic than China and there are reasons for this.: (1) they’re an island with no land borders, (2) they have a highly educated population, (3) they have a competent government, which is not nearly as corrupt as China’s, (4) they acted quickly and decisively, (5) … Singapore also has a similar low infection rate for the same reasons.
China on the other hand initially denied they had a pandemic and by the time they locked down Wuhan, the virus had already spread to the rest of the country, and at this point, it was impossible to contain. China is also very corrupt, which doesn’t help during a pandemic.
Dennis , headed to my target of $ 25 . 🙂
Hole in head,
Yes oil price is lower as we would expect when a peace deal is reached in Libya which was not expected by many (or not by me over the short term, I thought it might occur before 2030). If a vaccine (or several) gets approved and widely distributed over the 12 months following approval, oil prices are likely to increase in response to increasing oil demand.
See also the October World outlook from the IMF at link below
https://www.imf.org/en/Publications/WEO/Issues/2020/09/30/world-economic-outlook-october-2020
Growth rate for World Real GDP at market exchange rates in chart below. Real GDP rises above the 2019 level by 2022 based on the IMF outlook (their reference scenario).
Dennis ,you surprise me . A V-shaped recovery .? Every economist of all school of economic thought have discounted that , Keynesian , Austrian , Minsky , MMT etc . Heck ,even the kids in the slums of Dharavi , Mumbai have discounted it . Maybe you have an ace up your sleeve that I am not aware off .You are aware that I am skeptic about the forecast made by IMF and WB . I would not swallow it with a lump of salt ,leave alone a pinch of salt .
Hole in head,
Just reporting their forecast, the IMF economists must be from a different school, perhaps that of of reality. 🙂
Note that in October of 2009 their forecast was pretty good, see comment down thread. Forecasts of the future are seldom accurate as the odds of being correct are about infinity to one (aka probability equal to zero.)
I do not believe any forecast of the future, I create scenarios based on a set of assumptions and try to create an envelope of possibilities that might bracket reality. The IMF does much the same, they have several scenarios, the reference scenario is just the medium case between high and low cases.
Dennis, is that chart your idea of a joke? We hope the Covidvirus peaks in 2021. But there is no chance whatsoever it will disappear by late this year or very early in 2021, which would have to happen for your chart to be correct.
I hope the virus peaks next year but even if it does, there will be a long slope downward, lasting four or five years. But the worst is in the future. We are nowhere close to ending this nightmare.
Okay, I know the data is not yours but that of the IMF. They are insane.
Ron,
Experts are often wrong, and this may be one of those cases. I agree their reference scenario seems optimistic.
I looked back at the IMF forecast for October 2009 and compared with actual World real GDP (using market exchange rates rather than PPP). In 2009 they did a fairly accurate forecast, we will see how they do for the current crisis.
And for Italy, this relationship seems even more obvious. https://jancovici.com/transition-energetique/choix-de-societe/litalie-et-lenergie-un-cas-decole/
About GDP variations, since 1986, oil consumption variations seem preceding GDP variations. https://jancovici.com/en/energy-transition/oil/is-the-price-of-oil-driving-the-economy/
No question: KSA’s economy goes up when the price of oil goes up, and oil importers’ economies are damaged.
Another reason why it’s very, very risky to depend on oil. Better to transition away from such a risky energy source, as quickly as possible.
Another Report for 2020 and 2021 output scenarios from OECD
https://read.oecd-ilibrary.org/economics/oecd-economic-outlook/volume-2020/issue-1_34ffc900-en#page4
Real GDP growth for World in 2020 is expected to be -4.5% and in 2021 growth is expected to be 5%.
From another set of economists from the real world school of economics. 🙂
Just reporting what I find, the fact is nobody knows what future output, prices, etc will be.
Also The EIA’s World economic forecast from STEO (Oct 6, 2020) at link and chart below. World Real GDP is expected to recover to the 2019Q3 level by 2021Q3.
https://www.eia.gov/outlooks/steo/data/browser/#/?v=30&f=Q&s=0&start=201601&end=202104&map=&ctype=linechart&maptype=0&linechart=~RGDPQ_WORLD
Also OPEC Oil market (October 2020) report has a forecast for World GDP, in 2020 they expect -4.1% y-o-y and in 2021 they expect growth of 4.6%
y-o-y see page 20 of the OPEC MOMR.
Thank you , Mr Shale ,it was nice knowing you .
https://www.axios.com/global-investment-slump-energy-3b6de33b-3165-4a38-bb7d-c36ba74befaa.html
They knew this was coming. If they didn’t make out like bandits during the good times, they’ve left it way too late now.
XOM announces head count reduction to defend dividend, which it is not cutting.
Yes I saw that Watcher. They are going to let 14,000 people go. Amazing that Zoom, which produces nothing, has a market cap higher than Exxon ($141 billion vs. $136 billion respectively)
This is definitely not going to go where people like Coyne think it is. It appears to almost be following that Hills report (which I read with not a small amount of disbelief), based on what I’ve been seeing lately.
Mike,
The Hill report is based on poor analysis and a lack of understanding of thermodynamics, it is best ignored.
The output of tight oil depends on the price of oil, in fact all oil output will be influenced by the future oil price which is unknown.
My best guess is informed in part by the EIA’s AEO 2020, though my scenario had real Brent oil prices in 2019$ rise to only $75/b in 2030, remain at that level to 2040 and then decline to $30/bo in 2063. A second oil price scenario has Brent oil prices rise to $50/bo (2019$) by 2022 then remain at that level until 2053 and then decline to 30 per barrel by 2063 and remain at that level. The last scenario has Brent oil price fall from $45/bo (2019$) in June 2020 to $25/bo by Feb 2028 and then remain at that level until 2080.
For the first of these price scenarios I have a higher completion rate scenario where Permian basin completion rate rises to 700 completions per month, the US tight oil scenario has a URR of 80 Gb for that scenario. The second scenario uses the same oil price scenario as the first but assumes the Permian basin completion rate rises to only 500 completions per month at its maximum, that scenario has a URR of 76 Gb.
The $50/bo maximum oil price scenario has a US tight oil URR of 32 Gb, and the low oil price scenario has a US tight oil URR of 26 Gb, no new tight oil wells are completed after June 2020 in that scenario. Chart below shows the four US tight oil scenarios. My guess is that the $75/bo maximum oil price scenario will prove conservative and I expect the high scenario might prove too conservative, as oil prices are likely to be considerably higher than my $75/bo scenario as oil output is outstripped by oil demand as the World economy recovers.
The output of tight oil depends on the price of oil,…
Of course it does. But it also depends on how much tight oil is left in the ground. And it also depends on how much of that oil can be economically recovered. There are a lot of DUCs that will never be completed because the amount of oil they could recover would not be enough to pay the fracking bill unless the price is over $100 a barrel.
Dennis, there is a lot of oil in that shale that will remain there… forever. It will be uneconomical to recover it even at the $70 a barrel price that you foresee in just a few years.
Hi Ron,
I have run the analysis on what will be recoverable, the wells are only completed if the discounted net revenue from the well (for the assumed oil price scenarios) is greater than the cost of the well. In short, I disagree. You think the tight oil in the ground will not be economically recoverable, but the economic analysis does not agree.
Oil price scenarios are below, in my view they are quite conservative, note that the modified AEO (more conservative than actual AEO 2020 reference oil price scenario) is not used for the analysis, it is shown for comparison to the other three oil price scenarios that I used.
AEO 2020 Brent oil price scenario at link below
https://www.eia.gov/outlooks/aeo/data/browser/#/?id=12-AEO2020&cases=ref2020&sourcekey=0
Link to AEO 2020 Brent Oil Price Scenarios (Reference case, low case, and high case)
https://www.eia.gov/outlooks/aeo/data/browser/#/?id=12-AEO2020®ion=0-0&cases=ref2020~highprice~lowprice&start=2018&end=2050&f=A&sourcekey=0
Chart for AEO 2020 for Brent Real Oil price in 2019 US$/bo
You think the tight oil in the ground will not be economically recoverable,…
Dennis, I don’t think you understood me correctly. Or perhaps I was not clear enough in my reply. Of course, a lot of shale oil can and will be economically recoverable. However, all the shale oil in the ground will not be economically recoverable.
I was thinking of this article by Art Berman:
Stop Expectig Oil & the Economy to Recover
What about DUCs (drilled, uncompleted wells)? The DUCs drilled before 2015 will never be completed because they were questionably commercial at $100/barrel oil prices. Many remaining DUCs are part of the 12-month delay from well spud-to-production. Nor is completing DUCs free. Completion accounts for roughly half of total well cost.
Dennis, before they drill a well, the driller only has a vague idea of how much oil the well will likely produce. But after the drill the well, from the samples they pull up, they have a far better idea of how much oil the well will produce. If the samples indicate the well will not be economical at a given price, and the price is well below that level, they do not complete the well. And unless the price rises above the profitable level, the DUC will never be completed.
Bottom line: There will be a lot of shale oil left in the ground because it will be uneconomical to recover it. That was my point and I think that point is indisputable. Sweet spots peter out and the further you get from that sweet spot, the less productive the well will be. And if the expected production gets low enough, that oil will simply be abandoned.
Ron,
There is always a lot of oil left in the ground that cannot be economically recovered, that much is obvious, so much so that I would think it need not be pointed out.
The model assumes the average new well productivity decreases as sweet spots become fully drilled (no room for closer spacing that would be profitable to produce). I agree there are no doubt many DUCs that will not be completed, though some of that will depend upon the price of oil.
For the Bakken/Three Forks, OOIP tight oil estimates range from 300 to 500 Gb, let’s assume the low estimate is correct, my recent Bakken model (with the $75/bo max oil price scenario) has ERR at about 7.6 Gb, so about 97.5% of the original oil in place will be left behind for the Bakken/Three Forks formation in the US.
For the Bakken/Three Forks, OOIP tight oil estimates range from 300 to 500 Gb,…
Dennis, I cannot deal with such numbers. What percentage of that 300 Gb can be recovered?
Ron,
From my previous comment:
…about 7.6 Gb, so about 97.5% of the original oil in place will be left behind for the Bakken/Three Forks formation in the US.
So 7.6 Gb ERR divided by 300 Gb original oil in place (OOIP) times 100=7.6/300*100=2.53% of the total tight oil resource is recoverable (if the 300 Gb OOIP estimate is correct), if the OOIP is 500 Gb then only 1.52% of the resource is recoverable.
In either case, most of the tight oil is left behind, much more so than for conventional oil reservoirs where roughly 30 to 40% of the conventional resource is recovered.
Note that when technically recoverable resources are considered, for all US Bakken/Three Forks perhaps 12 Gb is the mean estimate for TRR, for a very high oil price scenario where the ERR would be close to the TRR and where a 300 Gb OOIP estimate is used about 4% of oil is recovered with 96% (288 Gb) left in the ground.
Please provide a link to the Hill report.
The link to the Hills Group does not exist anymore.
But you can find the report here:
https://aspofrance.files.wordpress.com/2017/03/jl_2017_hill_exergy.pdf
or here:
https://limitstogrowth.de/wp-content/uploads/2020/01/ETP-Modell_THG_Full_petrohgv2.pdf
The explanation of the physics is here:
https://limitstogrowth.de/wp-content/uploads/2020/01/Mar_2020_Thermo_EN_09.pdf
Because the original report starts with an equation unknown to most people and has errors, please read the second document (3rd link) first.
Thankyou.
See
http://peakoilbarrel.com/on-the-thermodynamic-model-of-oil-extraction-by-the-hills-group/
SK’s rebuttal contained more severe errors than the original HG report. And both authors did not recognize that the ETP-equation describes the heat transfer from the oil reservoir to the earth surface. It took me a lot of time and discussions with several professors to find out that the heat transfer is the cause, why the oil production energy steadily increases.
Its all explained in the document of the third link.
it was probably removed because it’s an embarrassing piece of garbage pretending to be cutting edge thermodynamics. It’s doubly irrelevant anyway because The Hill referred to is the political blog I think.
https://thehill.com/changing-america/sustainability/energy/494112-how-the-coronavirus-has-impacted-the-oil-industry-and
Bernt,
You assume net energy is the goal of oil production, an incorrect assumption. The reason oil is produced by oil companies is to make money, as long as the product is in demand because it is convenient to use relative to alternatives the product will be produced. There is no reason that oil cannot be produced as an energy carrier, if your analysis is accurate. The temperature change of the earth’s crust is of little significance because in most cases (exception being geothermal energy) it is not used as an energy source. Also much of the energy used as an input to the petroleum production process comes from non-petroleum energy sources such as coal, nuclear, or renewable electricity production.
Why does your analysis start with oil prices in 2008?
Real oil prices from 1991 to 2019 have a very different trend, data from BP statistical review of world energy 2020.
Dennis,
i had a lot of discussions with people who did not know the second law of thermodynamics. I know how difficult, nearly impossible, it is to convince them of the implications of the 2nd law to oil production.
Especially people, who believe that money drives the economy, not energy, are a hopeless case. They believe, money can be used to generate energy, because if enough money is spent for oil production, the oil will be produced. They do not recognize, that this does not work for a whole economy. You seem to be one of this kind.
Sorry, but only it makes sense to discuss, if the second law is known and accepted.
Printed,
Yes we have a number of people who understand the physics quite well. What I have said is that energy does not determine the value of a good. Nor does money. There is no objective measure of value.
How do you measure a piece of art?
Also I agree energy input for the entire economy is important, the Hill analysis does not look at total energy only energy from oil, that is a major problem.
I vaguely remember the Hills thing. I think years ago. Generic wackos. And by the way thermodynamics are not particularly connected to the dividend decision from Exxon.
Watcher,
I agree, a fundamental problem with the analysis (besides the confusion over thermodynamic analysis) was the assumed link between net energy of a barrel of produced oil for the end user and the price of a barrel of oil. The value of a product is not determined by its energy content, there is no objective measure of value, value is subjective, like beauty.
A value may be assigned to beauty in the eye of the beholder, but the modern world depends on energy to run and that energy is assigned a value. The commodities exchange is one venue where that value is decided every moment of every day.
And therefore, I disagree vigorously with your assessment that there is “assumed link between net energy of a barrel of produced oil for the end user and the price of a barrel of oil” There is a DIRECT link -not ASSUMED- that is absolutely irrefutable, and the COMEX notwithstanding the results of that mass energy expenditure go into the world’s collective mouth every morning, afternoon and evening.
The diesel used in those tractors create the food the world eats, having been delivered by a large fleet of trucks, and from these essential daily operations I would dare to suggest that the value of food and it’s hydrocarbon facilitator is both extremely high and extremely real.
Michael,
I did not say there was no value to oil, current economic theory has no value measure, the idea that energy is the proper measure of value is an arbitrary one.
We could use the labor theory of value preferred by David Ricardo and Karl Marx as an objective measure of value, but the work of Pierro Sraffa showed that any good can be used as a measure of value using input output analysis (essentially an exercise in linear algebra).
What this tells us is that any good could be used as a measure of value, we could use gold, apples, a barrel of oil, an hour of labor or a unit of capital as the measure of value. The choice is entirely arbitrary. This is the reason that modern economic theory has abandoned the idea that an objective value theory is useful, instead a subjective value theory is utilized where consumer preferences, expressed as a demand curve for a good, combines with marginal productivity of businesses which determines the supply curve for a good to determine an equilibrium market price where demand is satisfied at a supply level where businesses are profitable.
There are many inputs to the economic system, energy is a necessary component and oil is important, but a free market system where prices can adjust to supply and demand will lead to an efficient allocation of resources.
See Walrasian Economic Theory
https://www.press.umich.edu/9407/walrasian_vision_of_the_microeconomy
My viewpoint is quite mainstream, probably means I am wrong. 🙂
any good could be used as a measure of value…The choice is entirely arbitrary.
This is a valuable perspective, but this way of framing it goes a bit too far, I think. Any particular good may be Imperfect, but some are far more useful than others. IMO, it’s clear that labor is the most useful measure: if you look at value added in the supply chain of almost any good, labor is the most important input.
Edit: value is a complex thing, affected by both producer cost and consumer use value. The paragraph above is mostly about producer cost, which I think, very roughly is the more important determinant of market prices. For instance, oil hasn’t become more useful in the last 15 years, but marginal producer costs have risen.
This is, of course, very complex. For instance, competition and the availability of substitutes is important. When oil prices rose in 1979, oil was priced out of the electrical generation market because there were cheaper substitutes. That will happen over the next several decades for transportation, in part because we’re realizing that oil is more expensive than we knew due to expensive pollution and insecurity of supply.
Nick,
Disagree that some measures are better than others. None is any good the choice of better or worse is entirely subjective.
Modern economics does not use the LTV, in fact their is no value theory, this is left to philosophers.
Michael,
First, we’ve chosen to use oil for most transportation at the moment, but we don’t have to. We could electrify most transportation that is currently powered by non-fossil fuel sources, and use synthetic hydrocarbons or hydrogen for more difficult cases like aviation or long-distance water shipping.
Are you clear that “hydrocarbon” isn’t the same thing as “fossil fuel”? There are lots of sources of hydrocarbons, and they can be built from simple inputs like electrolytic hydrogen, and carbon from the atmosphere or seawater. That requires an energy input of course, but wind and solar power are already cheaper than fossil fuel energy, and getting even cheaper fast.
2nd, most of the value of oil right now isn’t it’s energy, it’s the ability of oil to store energy in a convenient portable form. Just compare the cost of a BTU from natural gas or coal, to the cost of a BTU from oil: there’s a big difference, and that difference isn’t the value of energy, it’s the value of convenient portable storage. So…you have to expand your thinking about value: it’s not just about BTUs (or joules). That value comes from many factors.
The majority of wind and solar are made in the far East and shipped west. Renewables require rare earth materials which are scarce. The manufacture of which relies on fossil fuels.
There is no known substitute for fossil fuels.
Hume,
We will use less as they become scarce and expensive, solar does not depend on rare earth minerals, and wind turbines can also be made without using rare earth minerals. Steel can be recycled using electricity produced by wind and solar, and there are some substitutes for coal in the cement production process and coal is relatively plentiful.
The transition from fossil fuels to wind, solar, hydro, and other non-fossil fuel sources of energy will happen gradually, and probably will take 50 to 100 years. Nobody thinks it will happen overnight.
Hume…and your president says the ‘noise from windmills causes cancer’
By the way, XOM posted a US upstream loss of $681 million for the 92 days contained in the 3rd quarter of 2020. Production fell over 200K BOEPD companywide. Cutting CAPEX again.
Another interesting one to watch will be ballot proposition 1 in Alaska. If it passes, COP has stated it will drill no more wells in the state, which is significant given 1/4 of COP companywide volumes come from Alaska and it is by far the largest producer in the state.
The ballot initiative seeks to increase the state tax on North Slope oil production-
‘A “yes” vote supports increasing taxes on oil production fields that (a) are located above 68 degrees north latitude in Alaska, which is an area known as the North Slope, (b) have a lifetime output of at least 400 million barrels of oil; and (c) had an output of at least 40,000 barrels per day in the preceding calendar year.’
https://ballotpedia.org/Alaska_Ballot_Measure_1,_North_Slope_Oil_Production_Tax_Increase_Initiative_(2020)
Kansas produced 49.5 million barrels of oil in 2014, which was a multi-decade peak. By 2019 annual production fell to 33.2 million barrels.
Through the first half of 2020, Kansas produced 11.3 million barrels.
Kansas is, in my opinion, a good barometer of the state of US conventional onshore oil production.
The second half of 2020 will likely be more than the first half, but likely 2020 will be little more than half of 2014.
Well count also dropped from 53,628 in 2014, to 51,556 in 2019 and 44,891 in 2020.
There surely is a decent amount of onshore conventional oil production throughout the remainder of the US, and world, that is similar to the production in Kansas?
Shale is in the dumper and has such high declines.
I guess the only hope is permanent recession/depression?
How do we sell all the high cost EV to people who aren’t paying for sub $2 gallon gas, of which almost half the cost is taxes?
If we go through the chain, we see extraction taxes for oil, ad valorem taxes for oil, income taxes for oil (if the price is high enough $50s?) and then some pretty steep gasoline taxes.
On the other end, EV get tax breaks big time. Not being taxed up and down the chain like oil.
And still, 18 million of 259 million light vehicles projected to be EV by 2030?
What a mess.
Shallow sand,
As more EVs are sold, the way roads are funded will be changed, EVs will be charged a road tax when their car is registered based on weight and miles on the odometer, ICEVs could be charged in the same way and any taxes paid as fuel taxes would be a carbon tax, likewise electricity producers who emit carbon from fossil fuel should also be required to pay a carbon tax which will be passed on to the consumers of that electricity. Note that Tesla customers no longer get any rebates from the Federal government, this may also be true for GM EVs. There are some states that offer rebates for EVs, and many already charge an annual fee for EVs, though it is pretty low ($75 to $200/year). The $200 fee is equivalent to the fee a gasoline car that travels 10,900 miles per year averaging 30 MPG would pay in Illinois where gas taxes (Fed + State) are about 55 cents per gallon. Note that the electricity used to charge the EV is also taxed in most cases (most electricity does not come from renewable sources, in fact much comes from Natural gas (30 to 40%) and maybe another 30% from coal.
Dennis ,you wrote ” There is always a lot of oil left in the ground that cannot be economically recovered, that much is obvious, so much so that I would think it need not be pointed out. ”
Of course we know that . The point is that what percentage of shale oil now available will be left in the ground . What has been extracted ,has been extracted ,what about from the balance available today ? How high will be left ? My POV from where we stand today, + 50% will be left in the ground best case scenario. Worst case 65-70% . No, there is no data to back this ,this is my understanding of prices ,geopolitics and several connected events that will unfold and a feel of the total picture .
Hole in head,
Much depends on the price of oil. For your oil price scenario about 75% gets left in the ground, for my preferred oil price scenario about 20% gets left in the ground (of mean USGS TRR estimate and my guess for TRR of US tight oil areas where there is no USGS estimate (we only have estimates of Permian, Bakken/Three Forks, and Eagle Ford/Austin Chalk).
Note that my guess is that about 65% to 95% of the TRR is likely to be produced (TRR is roughly 100 Gb, so that’s 65 Gb to 95 Gb, with 80 Gb as my best guess for the ERR of US tight oil.
I realized you are looking for discussion of what is left to be produced, about 17 Gb of tight oil has been produced.
So about 83 Gb of remaining TRR of tight oil. My guess is that of this 83 Gb about 48 Gb to 78 Gb will be produced so 58% to 94% of remaining TRR will be produced, with my best guess that 63 Gb (76%) of the remaining 83 Gb of TRR will be produced.
Lower oil prices will lead to lower oil output and higher oil prices to higher output (possibly near the TRR with very high oil prices).
Hole in head,
Also note that even with no new tight oil wells completed after June 2020 the total tight oil produced will be about 26 Gb, so remaining tight oil TRR would be 74 Gb (again assuming my 100 Gb estimate for US TRR is correct and that the 26 Gb estimate for tight oil produced is also correct, both will in fact be wrong).
For this 74 Gb of remaining resource (needing new tight oil well completions to be produced) I expect about 54 Gb of it to be produced for my best guess estimate ($75/bo max Brent in 2019$ with URR=80 Gb) so about 27% is left in the ground.
Your best guess scenario (with oil prices falling to $25/bo by 2028 and remaining at that level) would have no new tight oil wells completed so 100% of the 74 Gb of remaining tight oil technically recoverable resource (TRR) remains in the ground.
I think my scenario is more realistic, and even Ron (who tends to be a bit more pessimistic than me) thinks there will be some new tight oil wells completed, just fewer than my guess. His guess might be about 40 to 60 Gb for US tight oil economically recoverable resources, though he has never given a specific number as far as I know.
Hole in Head and Dennis are talking about 2 slightly different things.
Hole in Head is talking about recovery factor – which is oil produced/total oil in place.
Dennis is talking about oil produced compared to USGS estimate of EUR.
Recovery factor for resource oil plays are extremely low – less than 10% for sure.
I suspect if you researched the USGS TRR estimates, you would find that they are assigning a very low recovery factor (something like 100Gb EUR out of an oil in place of 1000Gb).
SouthLaGeo,
Thanks for pointing out my misinterpretation of Hole in head’s comment.
The total oil in place for Williston basin was estimated at 300 to 500 Gb, but TRR is on the order of 13 Gb as estimated by the USGS in 2013. So if we take the middle of the OOIP range of 400 Gb, we would have a recovery factor of less than 3.25% for the Williston basin tight oil resource.
So about 97% of the oil (or more) gets left in the ground.
Hole in head gave numbers like 50% to 75% of the oil being left in the ground. This matches up better with TRR estimates I gave above, if we use OOIP the numbers would be far higher based on the Bakken data (if we assume other tight oil basins are similar (I have not seen OOIP estimates for the Permian basin, Eagle Ford or Niobrara, so I can only guess that these might have similar recovery factors to the Williston basin, likely that it a bad assumption, but geology and geophysics are not my areas of expertise.)
Thanks Dennis, I actually think you can assume extremely low recovery factors for all the oil resource plays. You calculated 3% using a mid-case OOIP and TRR estimates for the Williston Basin. I’m sure someone has done similar calculations for the Eagleford and Niobrara. Probably harder to do for the Permian because of all the historical conventional production.
Not as sure about gas. Curious to see what the recovery factor estimates are for the Barnett, Haynesville and Marcellus. I’m sure they are low, but I would expect them to be higher than oil.
South La, many thanks for putting things in the right perspective . That is the difference between a pro like you and an amateur like me . Continuing , the action of XOM to write off $ 30 billion of shale assets will be the canary in the coal mine . Shale is nothing but OPM (other people’s money) , I remember a post a long time when Mike S said ” when OPM runs out ,shale runs out ” . Are we there ? If yes , then as Ron has said the oil remains in the ground . I like to put in a small disclaimer . The XOM link says they are THINKING of writing down the assets ,they have yet to make a decision . Steve Di Angelo use to do a good analysis on XOM . Last I remember ( before he went behind a paywall) , he analyzed that all profits what XOM made in operations OTHER than shale were nullified by the losses in their shale operations . Tks once again for your input .
The business foundation of the largest refiner in the world and the 4th richest man in the world is floundering .
https://indianexpress.com/article/business/companies/reliance-industries-q2-net-falls-15-on-weak-oil-business-6910516/
As SS has said ” If XOM is in trouble ,then the oil industry is in trouble ” . Tks SS for your thoughts .
Not a good time to be an oil patch worker at the moment.
Exxon To Cut 1,900 Jobs In The U.S.
“As part of an extensive global review announced earlier this year, the company plans to reduce staffing levels in the United States, primarily at its management offices in Houston, Texas. The company anticipates approximately 1,900 employees will be affected through voluntary and involuntary programs,” Exxon said in a statement on Thursday, a day before it is set to announce its Q3 earnings and a day after it kept its quarterly dividend flat for the first time since 1982.
Exxon has already said it would cut 1,600 jobs in Europe as part of efforts to rein in costs.
If Exxon takes this route there will be rush to the door from other shale players to exit . Too heck with DUC’s , LOE’s , fracking crews . The oil remains in the ground . XOM to take a $ 30 billion write down of its shale assets .Read
https://finance.yahoo.com/news/exxon-historic-losing-streak-adds-113144017.html
XOM it seems is in deeper trouble than we know .
https://earther.gizmodo.com/exxon-pays-off-shareholders-lays-off-workers-1845521977
Art Berman is as usual very clear . This guy knows his field of work .
https://www.youtube.com/watch?v=ugj634e4TjM&t=19s&ab_channel=GeorgeGammon
Frac spread count fell to 127 for W/E 10/30 from 134 previous week, most of the fall was natural gas focused and Bakken frac spreads see Primary vision network video at link below
https://www.youtube.com/watch?v=kodOcS8twZU
The 4 week centered average frac spread count for October 16, 2020 is 127, all of the data points with labels (except the last for Oct 30, 2020) are centered 4 week average data points in chart below.
Horizontal Oil Rig count US and Permian basin
For W/E 10/30, US horizontal oil rigs (HOR) 188 (+10), Permian HOR 138 (+9), total US horizontal rigs 254 (+9).
Data from Baker Hughes pivot table at page linked below
https://rigcount.bakerhughes.com/na-rig-count
Using frac spread count and oil rig count we can estimate oil focused frac spreads with the assumption that the ratio of horizontal oil rigs to total horizontal rigs will also reflect the ratio of frac spreads to oil focused frac spreads. The chart below is an estimate for oil focused frac spreads based on that assumption (which is not likely to be correct). It is a model, based on data for frac spreads and horizontal oil rigs plus the assumption above.
Hole in head,
Up thread you suggested oil prices are headed to $25/bo.
See https://oilprice.com/Energy/Oil-Prices/Analysts-Oil-Prices-Are-Going-Nowhere-In-The-Short-Term.html
a snippet below (41 energy analysts and economists in survey)
The analysts expect Brent crude prices to average $42.32 per barrel this year, slightly down from the $42.48 projection in last month’s poll and almost in line with the average price of $42.45 so far in 2020. Next year, the analysts polled by Reuters expect Brent prices to average $49.76 per barrel, down compared to $50.41 expected a month ago.
Of course these analysts know just about as much about future oil prices as you and me, that is nothing at all.
I don’t know . Today Brent is $ 36 +/- . My take is $ 25 by 2025 max .(excluding black swan events) . Looking at daily pricing is like looking at grass grow . Not interesting . I have said that their will be ups and downs ,but the price will drift to $ 25 . As events stand today and the recent announcements in the oil patch I have more than a fair chance to be correct in my forecast .
Hole in head,
Yes oil prices are currently down due to coronavirus spike in Europe and the US as well as the peace deal in Libya expected to increase supply by 800 kb/d or more.
The announcements by the various companies in the oil industry suggest the plan is to cut back on output, that will tend to balance the market and is likely to lead to increased oil prices (above $45/bo for Brent in 2019$) by August of 2021.
That’s how I see it, but nearly all forecasts are likely to be wrong imo, only one out of a trillion (or more) is likely to be correct.
To be sure I understand your “by 2025 max”, does this mean you expect Brent oil prices (in 2019$) to be $25/bo or less by Dec 31, 2025 at the latest? Also is your focus daily, weekly, or monthly average spot prices, we may well be talking about different things as “price” means different things to different people. I tend to focus on the average monthly or 4 week average oil price, you have just said daily prices are not interesting so I assume that is not your focus, but I forget what your benchmark is.
Dennis ,my $25 price is for WTI and not Brent . Why I had benchmarked WTI was because it determines the price shale will get . My scenario sees a fast decline in shale production as prices drift lower . SS has informed that he can get a price between $ 18-25 and so he has shut in the wells . Most major increase in production since 2010 has come from shale production, with it’s high decline rates and bankruptcies foreseen the decline in oil production will also come from this sector . I agree Brent is the international benchmark . There use to be a $3-5 range difference between WTI and Brent ,but now the spread is about +/- $2 . What happened ?
My benchmark is average monthly .A spike here and there does not count . Also price $25 is in nominal dollars not 2019 $ .
A new US August oil production has been posted.
http://peakoilbarrel.com/hurricanes-impact-us-august-oil-production/#more-29056
A new open Thread Non-Petroleum has been posted.
http://peakoilbarrel.com/open-thread-non-petroleum-october-31-2020/