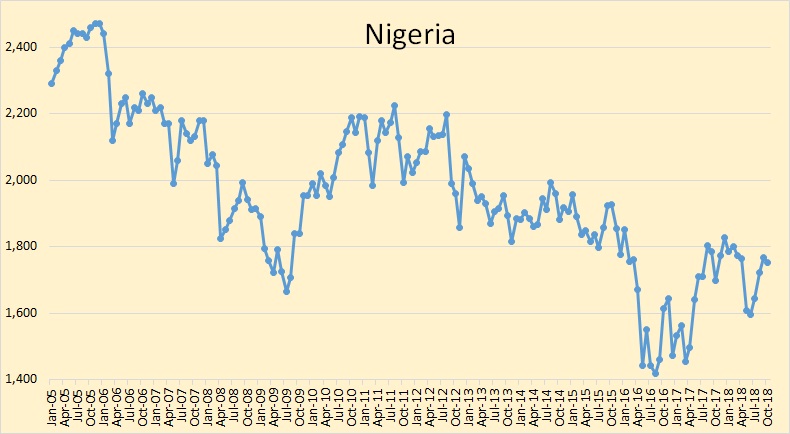
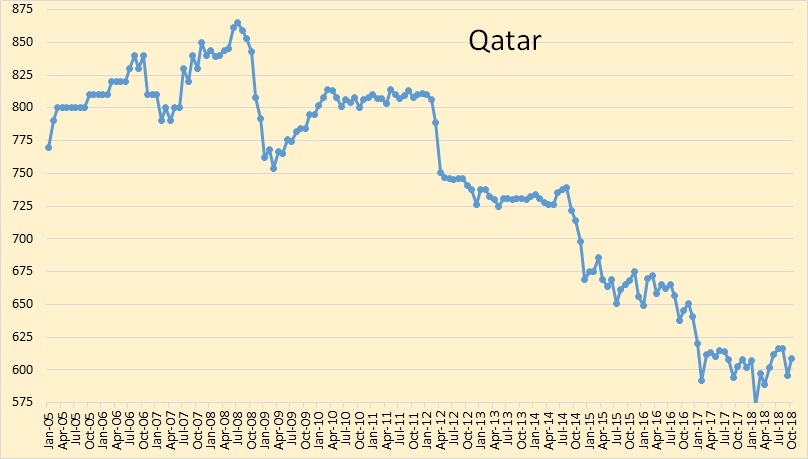
All OPEC data below is from the OPEC Monthly Oil Market Report The data is through October 2018 and is in thousand barrels per day.
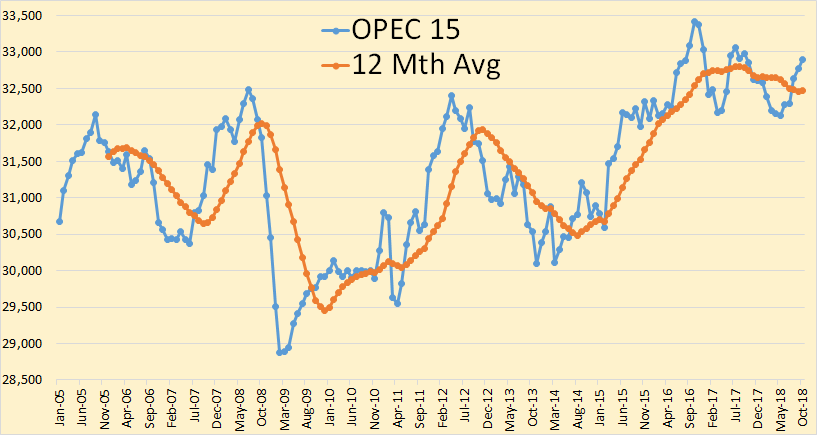
OPEC 15 crude oil production was up 127,000 barrels per day in October. that was after September production was revised upward by 13,000 bpd.
OPEC production will likely be up a bit more in November but down considerably in December.
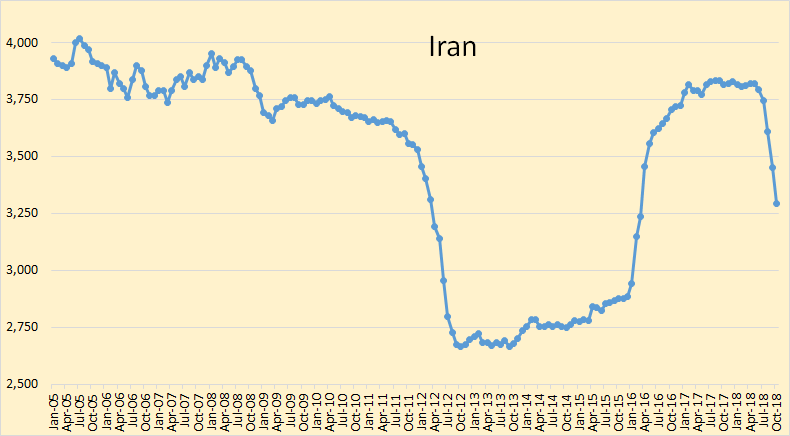
Iran down 156,000 barrels per day in October due to sanctions.
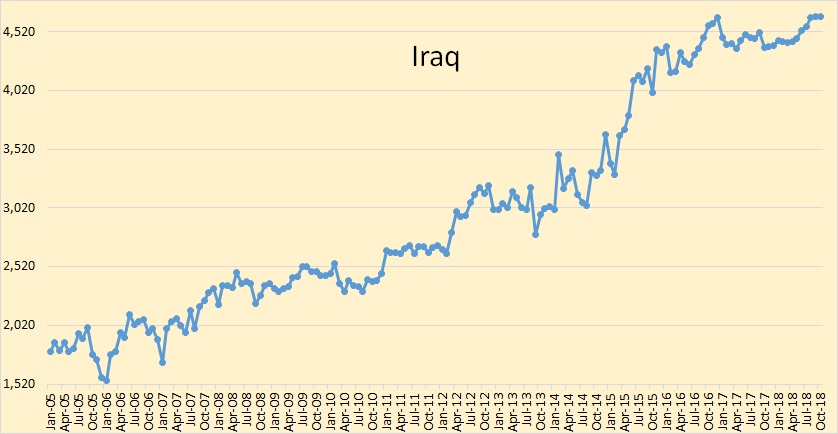
Iraq production has been flat lately. They are obviously pumping every barrel they possibly can.
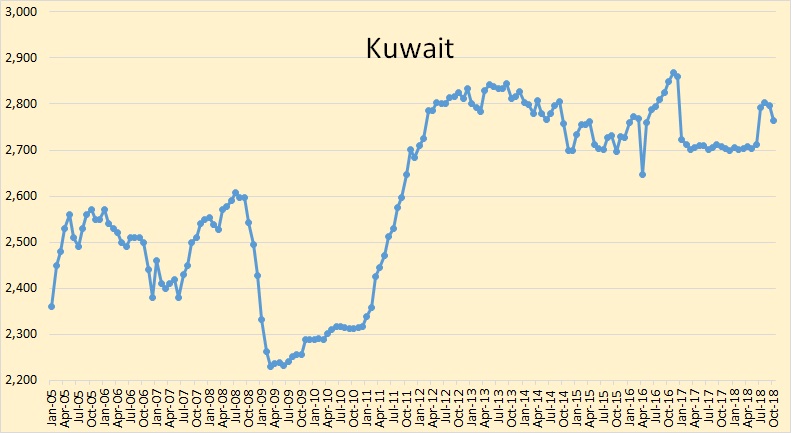
Kuwaiti crude oil production has been relatively flat for 6.5 years. During that period their oil rig count increased from around 20 to a high of 44. It has recently dropped to 35 however. It should be obvious that they are producing flat out.
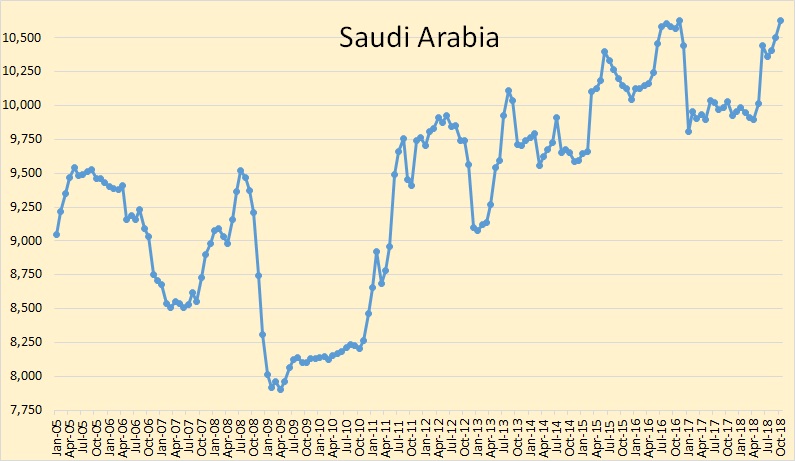
Saudi Arabia reached a new all time high in October of 10,630,000 barrels per day, 5 thousand bpd higher than their previous high in November of 2016.
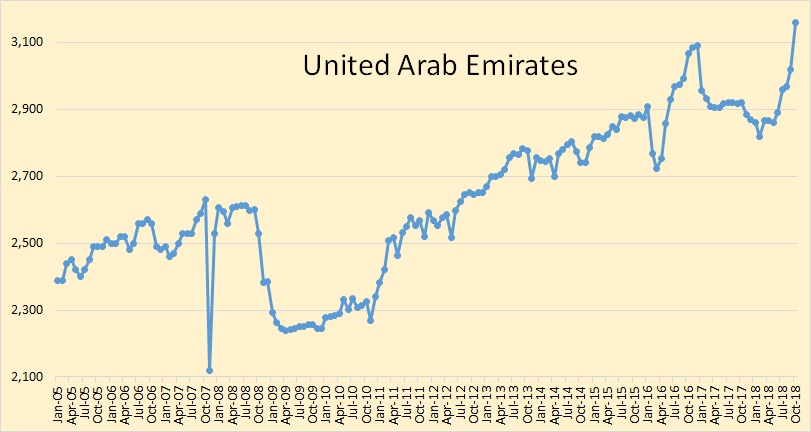
The UAE also reached a new all time high in October of 3,160,000 barrels per day, 70,000 barrels higher than their previous high in December 2016.
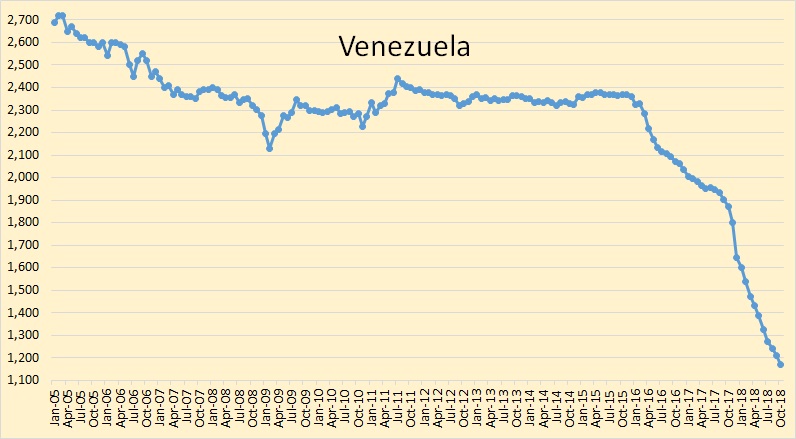
And of course, Venezuela continues their decline.
World oil supply, that is total liquids, is now just short of 100,000,000 barrels per day.
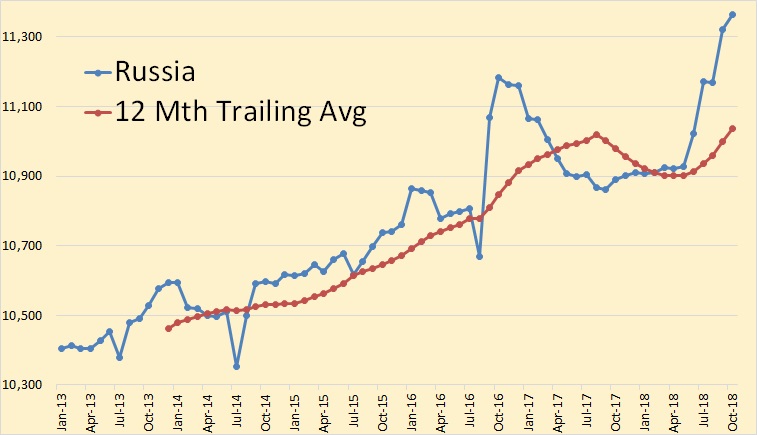
Russian oil production was up 43,000 barrels per day in October to 11,365,000 bpd according to the Russian Minister of Energy.
All USA and world production numbers are only through July 2018.
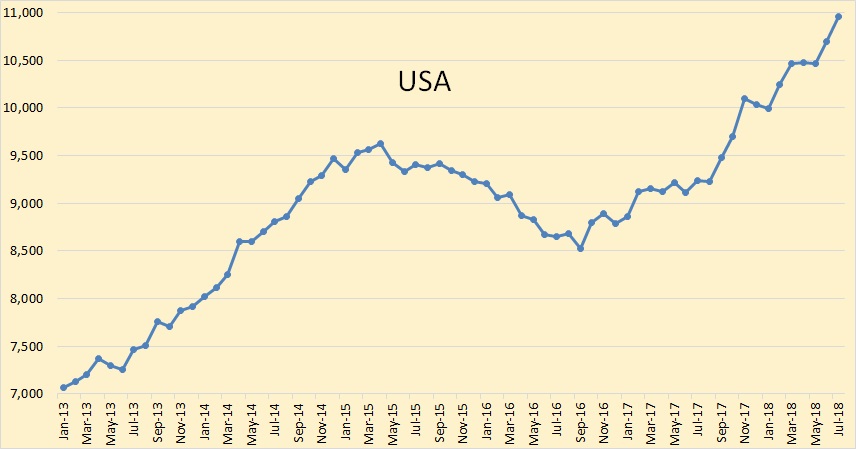
US production was up 269,000 barrels per day in July to 10,964 bpd.
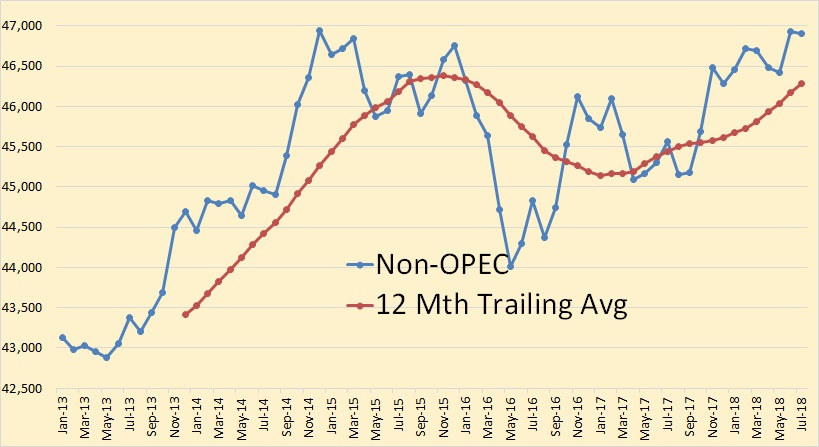
Even though the US increased production in July by 269,000 bpd, Non-OPEC production was still down 29,000 bpd to 46,903,000 bpd.
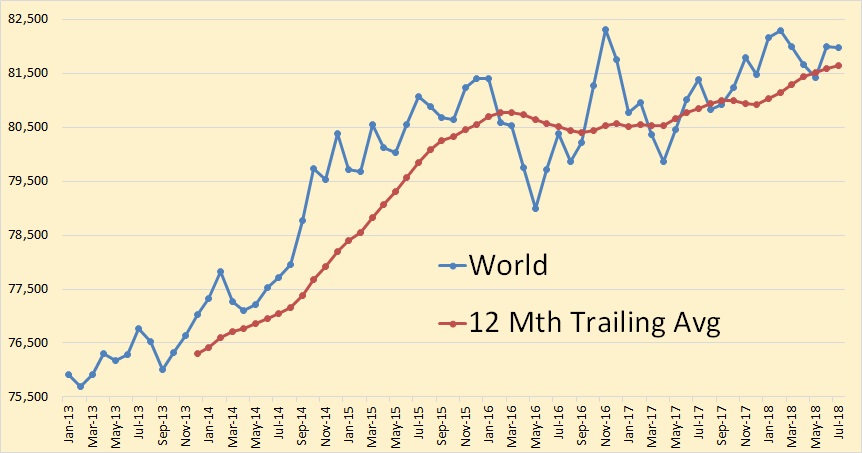
World C+C production was down 18,000 barrels per day in July to 81.983,000 bpd.
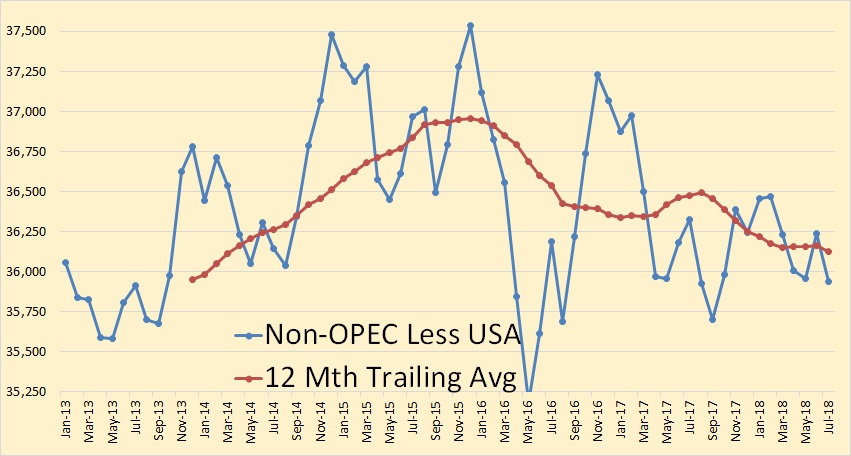
Non-OPEC less USA peaked in December 2015 at 37,934,000 barrels per day. It was down in July by 1,595,000 bpd from that point.
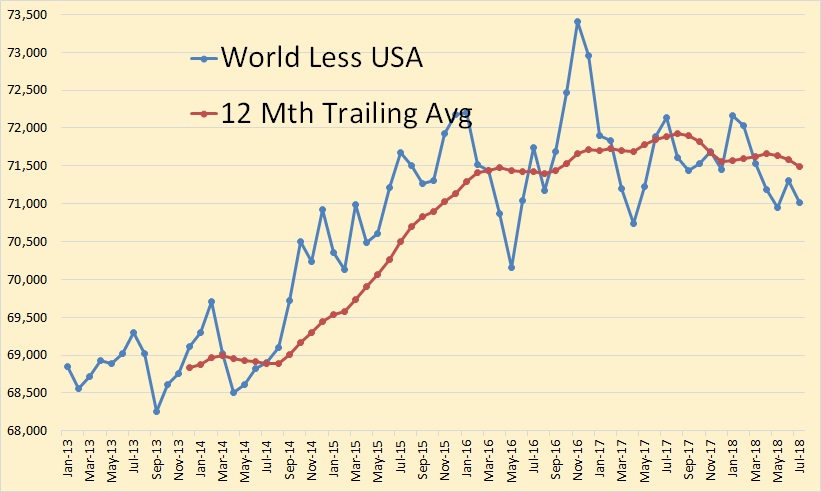
World less USA peaked in November 2016 at 73,407,000 barrels per day. In July it was down 2,388,000 barrels per day from that point.
The question is: Just how long will the USA be able to continue to increase production in order to hold off peak oil?
And on another subject:
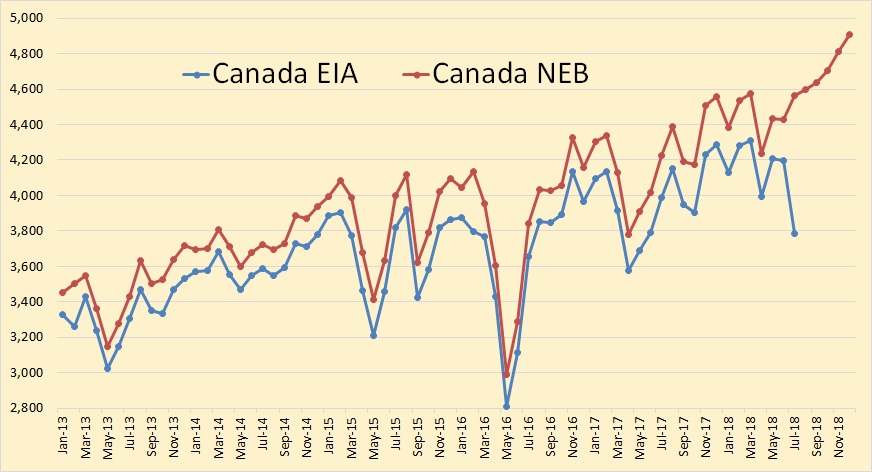
The EIA has Canadian C+C production down 415,000 barrels per day in July while the Canadian National Energy Board has Canadian production up 133,000 bpd. However, both numbers are subject to revision. On average, the EIA has Canadian production about 200,000 barrels per day below the Canadian NEB estimate.
439 responses to “OPEC October Production Data”
So the biggest 3: US, Russia, KSA keep pushing the envelope
Yes but Russia and Saudi Arabia are at, or very near peak production. Saudi will be up a few bpd in November but down in December and down in 2019. Expect Russia to start trending down in 2019 also. And of course, the rest of the world, except the USA and Canada will keep their current trend, down.
I said earlier that I think 2019 will be the year crude oil peaks. I am now more convinced than ever of that prediction. Keep in mind that the World less USA has already peaked, and was, in July, 2,388,000 barrels per day below that peak.
I think the EIA estimate for Canada is more correct for July since Syncrude had a total power outage that took 350 kb/d offline due to cokers not being shut down in an orderly manner. Production was restored by mid September to full production.
Nonetheless it seems that they all have production records, except Russia which has post-soviet records, is hard to have 12Mbarrels/day without all those republics. After all this effort the fall might be hard. Maybe Ugo Bardi is into something with his Seneca cliff.
Sir Ronald Patterson,
love your work.
dont forget we have thorium coming out of our human holes.
we will be eating rat and bird soup and having karaoke parties for many moons from now
ya heard it here first,
Satan, Evil Demon
The reason why North American production keeps rising and the rest of the world is either rising slowly, flat or declining, is because of where the oil investments occur. If the oil industry was indeed a “free-market” then imagine the stupendous amounts of oil that could be produced if the billions wasted in shale and tar sands were invested in Russia, Iran, Iraq, KSA & the Emirates. Like I said so many times before, these countries at least, can increase production (under the right circumstances) way, way beyond where it is at the moment.
In America, anything is possible. It starts with cutting down enough trees to print enough money to create enough debt. Without QE/fiscal stimulus, and credit, the shale oil phenomena would have lasted only 3 years, just long enough to realize what shale oil decline rates actually were, and how grossly unprofitable it is to extract that crap. Its now a decade old, only because of credit.
That’s exactly my point. If so much oil can be produced from such difficult regions as are the North American shale formations and Canadian sands, then imagine what the production boost would be in places like Iraq/Iran/KSA and Russia, where oil extraction is immeasurably cheaper. What I am trying to say is that we are nowhere near Peak Oil, it’s only geopolitical games that may make it appear so from time to time.
Oil extraction is cheaper in the middle east because mother nature was kind enough to place world class reservoirs able to capture giant oil reserves from prolific source rocks. But conditions for producing crude oil from these source rocks are not as attractive as in the US. Their costs are higher, the crews less efficient, there’s no fresh water, and the geology isn’t likely to be as good as the top US basins.
The reason why North American production keeps rising and the rest of the world is either rising slowly, flat or declining, is because of where the oil investments occur.
Oh! You mean the amount of reserves in the ground have nothing to do with it? Well hell, I guess I learn something every day.
Like I said so many times before, these countries at least, can increase production (under the right circumstances) way, way beyond where it is at the moment.
Pardon my French, but you are as full of shit as a Christmas Turkey.
You have been anticipating and prophesying Peak Oil for decades now, yet you remain steadfast on insisting on this discredited theory. It also amazes me, how ignorant you seem of true oil reserves in the ME and Russia. There’s a reason why the US & the EU are so intensely interested in these two regions.
Apropos “amount of reserves in the ground”. Reserves in the ground are secondary, what is primary is the capital available for their extraction. You cannot possibly believe that shale and tar sands are the best option for oil companies at the moment. It’s only geopolitical imperatives that make it so.
Reserves in the ground are secondary, what is primary is the capital available for their extraction.
But of course, reserves don’t matter all that much. Enough money will create more reserves in the ground.
You cannot possibly believe that shale and tar sands are the best options for oil companies at the moment. It’s only geopolitical imperatives that make it so.
Geeze, you don’t seem to understand one damn thing about world oil production. Yes, shale is the best option for the United States.* That is because conventional reserves are dropping like a rock. And yes, tar sands are the best option for Canada for the same reason. But not for Saudia or anywhere else in the Middle East. They don’t have either.
We have been debating world oil reserves, on this site and other sites, for over a decade. And you, Jhonny come lately, suddenly declare that reserves are not a problem because… I don’t know, perhaps you think there are still many trillion barrels left?
If you are going to claim that the amount of reserves left in the ground are not a problem, then produce your evidence.
*Shale is not a good option at all because it cost more to produce than you get when you sell the stuff. But if you are talking about increasing US production, that is the best option we have.
“I read somewhere oil oozes from the earth’s core”
And I read somewhere that the earth is flat. Which proves there are still idiots posting stupid shit on the net.
I know. I keep reading the same old bs about Thomas Gold discovering oil in sweden every two months or so.
I’m trying to get my adopted son a gig at ITER for the summer, to get a better idea of how that’s going. That’s a more viable answer. I hope.
I totally agree with Chris Nelder, the likes of Jeremy Leggett took the discussion of peak oil into the gutter. You can get his 2005 book on Amazon for £0.01. Cheaper than fire lighters
https://www.forbes.com/sites/michaellynch/2018/06/29/what-ever-happened-to-peak-oil/#70d60ad4731a
From your Michael Lynch link:
“This is not a controversial statement. It is just a question of when.” Jeremy Leggett in 2006
And those who disagreed were treated with derision.
To disagree with that statement means you believe oil will never peak. Anyone who believes oil production will never peak deserves to be treated with derision.
And that includes Michael Lynch, who’s mantra has always been, “no peak in sight”.
Ron
There were many environmentalists who bought into early peak oil. They believed that global warming was no longer a problem because oil production would peak in 2008-2012.
https://www.youtube.com/watch?v=9FOhCHiuKMQ
Production now would have fallen to 80 million barrels per day and the solar, wind and electric transportation industry would be far cheaper than the fossil fuel alternatives.
Unfortunately Jeremy Leggett was wrong and the main analysts proved correct.
The argument always should have been that we need to move to a renewable world. Yes the cost will be high but far better then floods, fires and failed harvests.
Waiting for coal, gas and oil to become expensive was a big mistake.
It has been calculated that $2.5 trillion dollars invested in wind and solar each year would have avoided and still may avoid the worst.
Global warming would still have been a problem even if oil did peak between 2008d-2012. No environmentalists worth his salt thought anything different. Coal and oil would have been burned and will be burned decades after oil has peaked. Peak oil has never been posited, by any reputable environmentalists as a solution to climate change.
Waiting for coal, gas and oil to become expensive was a big mistake.
I don’t know who the hell you are talking about there. Just who was doing that waiting? But as far as the price of oil, or the price of anything is concerned goes, economics is an uncertain science. It is more of an art than a science. And everyone makes mistakes, sooner or later, when trying to predict the future price of anything or the future supply of anything.
But one thing is certain, oil production will peak. It has peaked already in most countries.
Ron
Your view of things is so simplistic. Environmental scientists are still debating exactly what the effects of a 1.5 degree and 2 degree rise will have.
Perhaps you should contact them and tell them exactly how much Co2 will cause a 1.5 degree rise and a 2 degree rise.
https://www.cicero.oslo.no/en
You say peak oil is a problem, and you also say burning too much oil is a problem. You also say living without fossil fuel would take us back to the stone age. Do you have any solutions or are you simply very confused?
Do you disagree with Islandboy that renewable energy is a solution?
You say peak oil is a problem,
Of course, it’s a problem. We are almost totally dependent on oil for a transportation fuel. How in God’s name could anyone possibly say it is not a problem.
and you also say burning too much oil is a problem.
What the fuck? Of course burning too much oil is a problem. You seem to think that the two are mutually exclusive. No, they are not, they are both a problem.
You also say living without fossil fuel would take us back to the stone age.
Oh fuck, I never said that. But if we totally abandoned fossil fuel today, the dieoff would start tomorrow. We are in no way prepared to live without fossil fuel. If you think we are we are, then you are living in a dream world. But most of you guys think we can gradually ease out of fossil fuel over the next couple of decades. I do not. That is the debate, not if we just abandoned fossil fuel tomorrow. That is impossible.
Do you have any solutions or are you simply very confused?
That is the very stupidest sentence I have read since I read Trump’s latest tweet. You are implying that if I don’t have solutions then I am very confused.
No, fuck no, I do not have solutions. There are no (painless) solutions. And I am not confused. I don’t think you are confused either. You are just delusional.
Do you disagree with Islandboy that renewable energy is a solution?
I am totally in favor of renewable energy. I would turn cartwheels if I thought renewables could replace fossil fuel. Fossil fuel is a serious problem and is poisoning the earth. But we are totally dependent on it. I am sorry, and I do mean I am very sorry, but renewables will never support eight billion people. I dearly wish it could, but I am a realist instead of a dreamer, it cannot and will not.
I think you’d be extremely lucky to support 1 billion people on renewables. Frankly it doesn’t seem likely to even hit 1/2 that number without fertilizer manufactured from petrochemicals.
800 M
The possibility is much higher – but then the investments of 1 trillion $ / year into fossile energy have to be rerouted into alternative energy then.
Think about 100 x 100 miles solar farms in Australia / other deserts and liquid hydrogen tankers in a long row waiting at the ports there. Maintained and perhaps even build by mainly robots.
It’s not the rooftop solar alternative dream, it’s big business then.
And it’s not now, so we need this oil to bridge the gap until there.
Or they get these fusion plants working and payable – but I believe more in huge solar farms because it is existing tech only need to scale.
PS: Transportation could be done in a national show of strength – if it has to be now, cover the land again in railroads and trams. It has been done in 19th century in a short time, and could be done today under warlike conditions (oil war in the gulf, fracking is a dud in a few years …) again. Use the existing batteries only for electric busses and local delivery trucks.
It will be dirty but could be done. It can get people to work and food and goods to customers.
We have still these networks in Europe, but not big enough. We would need to double and double again capacity here if we needed to replace oil.
Yes you did
“Are all global warming deniers stupid idiots? So far they seem to be. If you think CO2 is real, but drive your car, or travel by air, you are a hypocrite. Bullshit! We must function in the world we were born into or else die of starvation. Just because we point out the obvious, does not mean we must return to the stone age with our daily lives or else we are hypocrits.”
What is the point of this website if there are no solutions?
It is like counting gravestones.
The point of this website was never to stop global warming. It was to spread the word about peak oil and hopefully to enable some people to find a less painful way down the decline slope.
Many of the earlier comments were about finding ways to be among the survivors.
However Dennis decides the purpose of this site now. But if you think this site can somehow stop global warming, you have a very serious problem with reality.
Why do people buy tickets to the seventh game of the world series? Just to watch of course.
CO2 is real. I breathe it out. I drive an old diesel car. What’s obvious to me is that climate change is now used to support political ideologies ranging from communism to broccoli diets.
Most people misunderstand the industrial agriculture revolution. Industrial agriculture brought us more food per hour of work. Ecoagricultural techniques bring us more food per hectare of land. In addition ecoagricultural techniques store carbon in the ground. Industrial agriculture is responsible for 25% of global greenhouse gas emissions
because it vents the carbon from the soil into the atmosphere (all of transportation is only 17% of GHG emissions). If we switch to ecoagricultural farming, rather than being a net emitter of greenhouse gas, agriculture could remove C02 from the atmosphere. That is why Toensmeier
proposes the Carbon Farming Solution. Toensmeier has calculated that we could feed the earth’s human
population on 5% of the land currently cultivated.
Schinzy
I will certainly get the book.
Besides the more efficient use of land which would as you say convert land back to being carbon sinks. The food distribution system needs to be made efficient, the waste is staggering.
http://www.fao.org/save-food/resources/keyfindings/en/
NEW solar is already cheaper than most EXISTING fossil fuel generation. It’s over.
Traditional energy sources now compete with batteries, not with primary energy production.
For transportation that means the oil industry is pretty much doomed. Oil is a terrible source of energy, much too expensive. That is why there are so few diesel power plants. They just can’t compete.
That fact that oilmen think of themselves as the energy business shows how clueless the really are. The oil business is not the energy business. It’s about disposable liquid energy storage in moving vehicles.
Oil is a wonderful way to STORE energy, which is why it is insulated from the extremely low cost of electricity. But batteries are already eroding this insulation. More and more vehicles are becoming electrified.
Turning to the more competitive electricity business, nobody seriously claims that traditional electricity can compete on price with renewables. Instead you get the mantra “What happens when the wind doesn’t blow and the sun doesn’t shine?”
The answer to intermittancy is storage. Traditional power generation competes with storage, with batteries. You can tell by their own arguments, which focus on “reliability” and “dispatchable” energy, not on generation costs.
The argument about the cheapest way to generate energy has already been lost. That’s what the whole “reliability” claim boils down too — that coal and gas fired plants are cheaper than batteries.
The final use of fossil fuels is heating, which can be highly efficient. My guess is that it will be the last niche that they can survive in.
These are the levelised generation costs in the UK.
https://assets.publishing.service.gov.uk/government/uploads/system/uploads/attachment_data/file/566567/BEIS_Electricity_Generation_Cost_Report.pdf
Obviously you have to add the cost of battery storage to wind and solar.
https://www.bmreports.com/bmrs/?q=eds/main
What is the cost of storing 40Mw, multiplied by say 12 hours?
Hugo, what’s obvious is that we shouldn’t be wasting so much energy. Then we wouldn’t have to generate it or store it.
In a free market, prices are primarily set by short term considerations. When renewables produce energy, traditional plants bleed cash. When renewables stop producing, traditional plants compete against batteries.
I’m not sure if you are agreeing or disagreeing with me. Your argument simply confirms what I am saying. The batteries are the issue. Competing with them is the only hope traditional energy sources have to survive.
One final point: You have a report from 2016, which is no doubt based on earlier data.
https://www.lazard.com/media/450773/lazards-levelized-cost-of-energy-version-120-vfinal.pdf
Old data isn’t much help in fast moving markets. Solar panel prices are falling at a rate of a quarter or a third each year.
Batteries costs are falling almost as quickly, but factories can’t be built fast enough to keep up with demand. So the ax hasn’t fallen yet. That will change in few years.
Oil is a terrible source of energy, much too expensive. That is why there are so few diesel power plants. They just can’t compete.
For generating electricity, oil cannot compete with coal, which is a far worse polluter.
2017 Coal use number worldwide is 37%. C’mon Ron you can’t use 2007 numbers here…
If new solar is cheaper then we can stop subsidizing it and let market forces handle the changeover. We can go back to debating more interesting stuff like football or whether the US Navy LCS is a shitty warship design.
To Ron, I’d love to see the source article that the graphic you posted came from. I have sensed an anti renewable bias from Der Spiegel in the past so, I’m really curious about the background of that graphic. I’m a little surprised that you would use it since the latest edition of my report EIA’s Electric Power Monthly – October 2018 Edition with data for August has the YTD contribution to electicity generation in the US from coal at 27.21% and the last one with annual figures, EIA’s Electric Power Monthly – February 2018 Edition with data for December 2017 and the data for the whole of 2017 has the contribution from coal for 2017 at 30.1%. From the data, the last time coal contributed more than 49% to the US electricity generation mix was 2005!
To Fernando, the market is moving in that direction, see:
Lazard, Lazard, LCOE – what’s the cheapest energy?
The headline information making the rounds with this analysis is that building new wind and solar power, in some cases, is cheaper than running already built fossil and nuclear facilities. Well, we already knew that at pv magazine.
For instance, Indiana finalized their plans to shut down coal plants and exchange them renewable facilities because its “the most viable option for customers”. Colorado recently voted for retiring Xcel’s coal-fired Comanche Generating Station ten years early, which represents 660 MW of total capacity for two separate units at the site – again, for economic reasons. Carbontracker.org noted that all of the wind bids for the above Xcel RFP were cheaper than coal, and 74% of the solar bids were.
Yesterday, Lazard released its Levelized Cost of Energy (LCOE) analysis version 12.0 for Energy (.pdf), and Version 4.0 for Energy Storage (.pdf). The document shows that utility scale wind, solar offer the cheapest absolute electricity pricing – without subsidies. When federal tax subsidies are applied, essentially politically palatable forms of a carbon tax, we see all thin film solar cheaper than all gas, and the majority of crystalline silicon solar cheaper than gas..
What do you think of this:
Spain wants 100% renewable electricity by 2050 as part of climate change strategy
I believe peak oil arrives too late to become a solution to climate change.
Human beings have always made use of all the energy they had within their reach. With fossils we are doing the same. Oil has not replaced coal but has allowed us to increase its production and consumption. And when the best quality oil has begun to become scarce, we have used technology to exploit the less accessible fossils (ultradeep, offshore).
Our increase in technological efficiency and, above all, the ability to move resources around the world, is allowing even low yield products (LTO, tar sands) to be exploited.
For many years there has been sufficient knowledge about the magnitude of the threat posed by global warming, but even today there has not yet been a real commitment to limit emissions. Since our objective has never been to consume less, but to maintain perpetual growth of GDP, improvements in efficiency have only succeeded in postposing the fossil peak, thus moving the peak of emissions beyond the point of no return.
Given the climate system inertias, and the fact that after the peak we will still be burning FF for some years (and probably multiplying deforestation), an increase of 1,5ºC on pre-industrial levels, which the IPCC recently marked as a key limit, is today more than guaranteed. What’s more, if we take into account the feedback loops that this will trigger, the possibility of avoiding a runaway global warming seems increasingly remote.
If the renewable transition had been posed seriously 40 years ago, perhaps today the picture would be less dramatic. But of course, a sustainable world not only demands the use of renewable sources, but (and above all) reducing consumption until we reach a really sustainable stationary state economy, something that is totally incompatible with the current economic system.
Tragically, the U.S. elected Ronald Reagan in 1980 partially as a reaction to a renewable energy transition proposed by President Carter in a 1977 speech which called for ending dependence on foreign oil as the “Moral Equivalent of War.”
Americans didn’t want to conserve gasoline, turn down thermostats, or fund the National Renewable Energy laboratory so we (some of us) elected President Max Headroom to blow smoke up our asses and tell us to go shopping, buy a bigger car because, “It’s morning in America!”
So we get floods, fires, and failed harvests? On a world wide basis? Do you really believe that?
World wide basis- you mean all at once?
If so, no.
But yes to here and there, over time. With a high degree of probability.
Enough to hurt bad.
Hope that you don’t live there, or have cable TV.
Hard to watch, unless you revel in those kind of scenes.
I don’t see much evidence for such catastrophes. We know that crop yields and water use efficiency are improved by more CO2, that warming is mostly caused by higher water vapor content which leads to more precipitation, that crops can be planted earlier and harvested later, that the earth is greening, that trees are larger, have more leaves, and that the main problem seems to be sea level rise, which is manageable.
Fernanado- Since your whole career has revolved around around the oil extraction industry, you are known as a extremely biased ‘observer’. Enough said.
You think I’m biased. So what? Keep trying to smear me, it actually makes me help my case: you have nothing to debate with.
Fernando, let’s examine your claims more closely. Oh, I don’t have to do it, it’s already been done for me at the Skeptical Science website. To the question “What would be the effects of an increase of CO2 on agriculture and plant growth in general?” they reply:
1. CO2 enhanced plants will need extra water both to maintain their larger growth as well as to compensate for greater moisture evaporation as the heat increases. Where will it come from? In many places rainwater is not sufficient for current agriculture and the aquifers they rely on are running dry throughout the Earth.
On the other hand, as predicted by climate research, we are experiencing more intense storms with increased rainfall rates throughout much of the world. One would think that this should be good for agriculture. Unfortunately when rain falls in short, intense bursts it does not have time to soak into the ground. Instead, it quickly floods into creeks, then rivers, and finally out into the ocean, often carrying away large amounts of soil and fertilizer.
2. Unlike Nature, our way of agriculture does not self-fertilize by recycling all dead plants, animals and their waste. Instead we have to constantly add artificial fertilizers produced by energy-intensive processes mostly fed by hydrocarbons, particularly from natural gas which will eventually be depleted. Increasing the need for such fertilizer competes for supplies of natural gas and oil, creating competition between other needs and the manufacture of fertilizer. This ultimately drives up the price of food.
3. Too high a concentration of CO2 causes a reduction of photosynthesis in certain of plants. There is also evidence from the past of major damage to a wide variety of plants species from a sudden rise in CO2. Higher concentrations of CO2 also reduce the nutritional quality of some staples, such as wheat.
4. As is confirmed by long-term experiments, plants with exhorbitant supplies of CO2 run up against limited availability of other nutrients. These long term projects show that while some plants exhibit a brief and promising burst of growth upon initial exposure to C02, effects such as the “nitrogen plateau” soon truncate this benefit
5. Plants raised with enhanced CO2 supplies and strictly isolated from insects behave differently than if the same approach is tried in an otherwise natural setting. For example, when the growth of soybeans is boosted out in the open this creates changes in plant chemistry that makes these specimens more vulnerable to insects.
6. Likely the worst problem is that increasing CO2 will increase temperatures throughout the Earth. This will make deserts and other types of dry land grow. While deserts increase in size, other eco-zones, whether tropical, forest or grassland will try to migrate towards the poles. Unfortunately it does not follow that soil conditions will necessarily favor their growth even at optimum temperatures.
Skeptical Science is one of those bogus warmist sites crafted for the echo chambers of believers. They are the ones who wrote the bogus 97% of scientists paper. Find something else.
Hi Fernando,
Name calling is not really an effective rebuttal. How about
http://www.ipcc.ch/report/sr15/
your “warmist” claim is unconvincing.
The last IPCC report tells me it’s ludicrous to go for a 1.5 degree anomaly limit. But I knew that. Seita Emori et all already documented this in their masterpiece report.
With regards to point number 4 of Phil S’ comment, I have noticed something in my neck of the woods that could support that idea.
There used to be a lot of acreage under sugar cane but the farming practices were very bad and harvesting practices even worse. Sugar cane fields are always set on fire before they are harvested to get rid of insects and the leaves, since the cane is harvested manually and the leaves can cut. This led to severely depleted soils requiring heavy use of fertilizer.
Competition from sugar beet drove down prices and a since the factories were nationalised back in the seventies, little or no maintenance or upgrades were done to keep the industry competitive. As a result the sugar industry in Jamaica is now on life support, despite the efforts of new private (Chinese) ownership of the few remaining divested factories. The rum industry that uses the same feed stock, remained in private hands all along and is doing fine.
What I have noticed is that it appears that several species of the genus Leucaena appear to be flourishing on the nutrient deficient former sugar lands. Leucaena is a legume so it fixes it’s own nitrogen, does not need nitrate fertilizer. Sugar cane is still being grown in some spots and in other areas there are plots of vegetables growing but these efforts are probably heavily dependent on artificial fertilizers.
Maybe Leucaena is just mother nature’s response to what mankind has been doing, both to the soils and the atmosphere. By the way, what is this climate change discussion doing in the petroleum thread? I thought that was what the non-petroleum threads were for. I notice there’s been a fair amount of discussion on renewable energy and EVs as well!
Islandboy, sugar cane doesn’t have to be burned before it’s harvested. My grandfather ran a sugar mill for a while, and the harvest was never burned. This gave him more material to burn in the boilers, and yielded a richer better tasting guarapo.
Fernando, The Chinese owners of last divested sugar factory that is still in operation have instituted a policy of paying less for cane that has been burned to try and discourage the practice but, it is still very widespread. The old cane cutters must have handed down the tradition to the current generation and the only way I see this being stopped is to get the people who burn the cane out of the picture altogether and switch to mechanised harvesting instead of using manual labour.
You will no doubt love the background as to why manual harvesting is still being used in Jamaica and why it’s sugar industry is in such a sorry state. In the seventies the left leaning Michael Manley led administration had very pro union policies coupled with a penchant for price controls in response to spiraling costs associated with the oil price shocks of the era. The administration also instituted a levy on bauxite production which provided a lot of money in the short term but, resulted in most of the companies operating in the country threatening to cease operations. The same hostility towards capitalism was having the same effect on the municipal bus company, the telephone company, the electricity utility and the sugar industry among others.
The Manley administration’s response was to use the cash from the bauxite levy to nationalize everything and preserve the jobs of the employees, ignoring any principles of astute management of the enterprises. Many of the nationalised entities were allegedly used to provide “jobs for the boys” and the concept of cutting jobs was vigorously resisted, so measures like using mechanical cane harvesting were out of the question. Jamaica has never fully recovered from that decade that ended with the election of a much more business friendly administration in 1980. Supporters of Manley’s policies point to the IMF and subversive activity of the US CIA as reasons for the failure but I’m pretty sure you will say that his friendship and admiration of Fidel Castro had far more to do with it.
Failed harvests and associated risks concern me the most, for obvious reasons (mortality & morbidity). I don’t feel that simultaneous world wide failed harvests are necessary to create widespread and largely negative population health outcomes. Regional and sub regional failed harvests, unaccompanied by either fires or floods, will be sufficient. If you, or anyone else, wish to discuss crop failure/famine further I’d be happy to discuss it on the non petro side of the street.
There seems to be a lot of focus on trends in pending ice free Arctic Ocean. The more concerning event, though perhaps tied to arctic ice, might be significant crop failures in the bread basket regions. Robert Fanny, and other self styled “emerging threat analysts” (although to be fair I think Fanny stopped calling himself this, none too soon), seem to ignore the risks associated with failed harvests/crop failure. Paul Beckwith, in his otherwise fantastic series, also fails to address it. Prof. David Battisti, who I highly recommend, does though have some very good presentations on it. You should check him out for sure!
There is no indication of failed harvests. We do see the earth is greening, trees have more leaves, growing season is longer, plants manage water more efficiently, and the extra CO2 really helps them. The key to take advantage of this trend is to make sure we get the extra nutrients in the ground. We will also have to develop new varieties able to yield even more food, larger vegetables, etc.
Quim
I agree that the current economic system makes cutting energy consumption very difficult. In order to get a steady state economy, would that not require a stationary population?
Naturally, in a finite world human populations can not grow indefinitely. The problem is that determining what is the maximum number of humans that our planet can feed is a complex task. In any case, I think that in general (I do not mean you) the debate about the population increase is being used in a biased way, with the intention of hiding the other two elements of the ecological footprint equation: technology and wealth .
The problem is that determining what is the maximum number of humans that our planet can feed is a complex task.
Oh fuck, that is not the question. The earth may be able to feed 20 billion people. But if it did human beings would be the only large or even small animals left on earth. Even rabbits would disappear because they would be killed because they ate growing human food.
The question is, what is the long-term human carrying capacity of the earth. That is how many humans can the earth support, long-term, without destroying the environment that supports other wildlife? That number would very likely be less than one billion people.
I didn’t want to say that maximum population “feedable” is THE question. I rather wanted to point out that there are many factors we must take into account, if we don’t want to give wings to ecofascist speeches (that’s where we are heading). I live in Spain, and I often listen about the risks of overpopulation in the “underdepeloped” world, but zero words about reducing our hyperconsumption (Spain per capita >4kW, close to twice world average). If we are to reduce population, where to begin?
Moreover, earth carrying capacity is not stable, because conditions change continously. Even so called ecosystems climax can’t behave as steady systems for many time.
I agree with you that less than one billion people would be a reasonable figure if we put resource scarcity on the table, but I guess there is a growing chance that climate change reduce this by several orders of magnitude in a not distant future.
About 20 yrs ago I went to Hanoi, and was touring around the nearby countryside for a few days. Rice paddies and big rugged mountains interspersed. What surprised me was how little wildlife I saw.
Many, many people. Hard working. Most very very poor. Simple living (because they didn’t have any money to buy stuff).
When I got back to Hanoi, I was walking along a food market street when it dawned on me. This is where all the animals all. In sorted piles, dead.
Even all the snails were here, sorted by size. The most numerous were the tiny ones, smaller than your pinky tip. The bigger ones were very few.
Any wildlife that could be gathered was. And eaten. And still the protein intake of the populace was meager.
Thats what carrying capacity looks like.
Add some fertilizer. More people perhaps.
Less and less of everything else.
>In order to get a steady state economy, would that not require a stationary population?
Not when per capita consumption is falling, as it has been in rich countries for decades.
Not when per capita consumption is falling, as it has been in rich countries for decades.
I would like to see a link that supports that statement. One like this one that shows per capita meat and seafood consumption growing by leaps and bounds all over the world.
Meat and Seafood Production & Consumption
Of course, you just said “per capita consumption”. Consumption of what? Buggy whips?
Ron,
Consumption to an economist means purchases of goods and services, so yes it would include buggy whips, food, oil, legal services, … (it is a long list).
I imagine you know this already. 🙂
I agree, that consumption has likely increased in advanced economies, that is certainly the case for the World where per capita GDP has increased (market weighted exchange rates) at about 1.45% per year from 1971 to 2017 (average trend).
If world population peaks and then declines at a rate of 1.45% per year or more then Real GDP growth will cease (at exactly a 1.45% decrease in population, if we assume the 1971-2015 growth rate continues) or it may decrease if the rate of population decrease is higher than the rate of GDP per capita growth.
82 million new homo sapiens on the planet.
If world population peaks and then declines at a rate of 1.45% per year or more then Real GDP growth will cease (at exactly a 1.45% decrease in population,
Oh my goodness no! Consumption decline, (GDP decline), will lead population decline by many years. In fact, population decline will be because of consumption decline. Consumption will decline because there will be fewer consumer goods to consume. Primarily there will be less food to consume, that will be the primary reason for population decline.
I don’t think consumption decline has yet begun. But when it does, that will be a sign that population decline is only about a decade or less away.
Hi Ron,
For the World as a whole, there is no evidence of lower GDP per capita, though a more unequal distribution of income may have lead to falling consumption for the poor.
Progress on poverty is slowing according the piece linked below
http://www.worldbank.org/en/news/press-release/2018/09/19/decline-of-global-extreme-poverty-continues-but-has-slowed-world-bank
actually your link is a bit of a self-own. if you look at meat supply per person for the United States, although the detail is a lacking, it shows a basic jump in the 1970, another in late 1990’s and then a fall back in 2010. But more or less steady for… decades.
Thanks to the dry weather, Germany will be a net importer of grain for the first time in decades. The maize crop was down by 75%. I just read in the newspaper today that potato prices will increase by half.
Your choice of a question as a rhetorical trick is an example of “proof by incredulity”. It only says that you don’t know whether your position is tenable or not, but you have deeply seated beliefs anyway.
Yep, I took part in a project to replace dead and dying fruit trees in Southern Germany this past week. Had to use pick axes to dig the holes because what is normally supposed to be soft muddy soil is currently hard as cured cement due to this past summer’s drought in this region. Anyone who doesn’t think climate change is a big problem and will cause crop failures is welcome to come join the pick axe crew…
Cheers!
“They believed that … … oil production would peak in 2008-2012.” Now, think about CONVENTIONAL oil, no fracking, no sands, no deep sea: Since 2005 that production is on a flat plateau. Now, let’s suppose that Ron is right and the peak is next year and that also that flat conventional production is getting south. Then let’s assume a smoothed out, idealized bell curb for the last decades of oil production: Voilá: The peak happened at the middle of the production plateau in 2012!
Of course in the real world, nothing is idealized and smooth. All I want to say is that the predictions made a decade ago maybe weren’t that wrong. In a way, they still could prove basically right!
The main short term cost of renewables is putting everyone out of business who’s trying to sell fuel. Coal is much cheaper than oil, but coal won’t survive the relentless onslaught of renewables, and gas won’t either.
It is truly incredible the impact of hydraulic fracturing has had on this. Remove this source of production from the market over the past 8 yrs and see what impact you would have. Energy desperation far and wide.
A big question is- Will another region of the world pull off a similar result as N. America did? Most people discount the possibility, but no-one foresaw the N. American results either.
The question with fracking is it scalable? For now only US has a “success story” with it.
The answer broadly speaking appears to be “no.” It needs the right type of rock and the right type of logistics. Close enough to civilization that the capex and manpower are reasonable, far enough removed that it’s politically doable.
And it’s not like US LTO has been economical. Most of the operators lose money even at decent prices. It’s all debt, and debt that tends to outlast the well that it is taken out to drill.
IMHO is not about the type of rock but about the free buck.
It’s like asking if anyone could produce as much steel as the Soviet Union. The question is whether anyone would want to.
Argentina has a nice shale called the Vaca Muerta, which is being tapped for crude oil and gas. Ddevelopment will be much slower but it will be a nice future contributor. It may even reach 1 mmbopd in say 10 years.
Anyone seen mapping of offshore shale? I assume it would be off the scale expensive to go after any such deposits.
The need for rig platforms makes the bulk drilling in LTO a literal impossibility. Not to mention spill risk.
The short answer is no, and not for a lack of trying. Canada and Argentina both have good shale reservoirs, but with questionable economics. It will not likely work in Europe, the infrastructure is not there, and population density is too high, one pad to drill from might be ten to twenty acres, and in most places the minerals are owned by the state, so there is little incentive for the Farmer on the surface to not protest any drilling. Needing a large supply of water to frac with means the middle east is out of luck, as is most of Australia, China and South Africa. Offshore might have the right source rocks in places, but the cost is so ungodly high you would be hard pressed to have a shale play work. Usually you don’t get repeatable economic wells in a shale play until about well 100 to 200. Russia probably has unexplored potential, but that is it.
I think i can design a 24 well onshore pad which only takes up a 100 m by 100 m square for about $30 million USD. I would use a combination of what i know about offshore rigs, Arctic and Siberian well pads. Construction time would be about two years because it would involve making a deep pit to hide wellheads and equipment ( the rig would be skidding on steel rails at ground level).
The January, 2018 story from the Pittsburgh Post-Gazette has a pretty good description of western PA wells, including a picture.
5 acres is more than enough for most pads that might contain 20 to 40 GAS wells. (Encana still has the world record of 51 producing gas wells on a 5 acre pad in the Piceance).
Oil wells will always be more problematic with the needed infrastructure required for long term production.
I have worked with large pad developments (up to 28 wells per pad). What we found was most effective was to run two separate test headers, a production header, two test separators (we had two multiphase meters which seemed to work well on two pads to learn how to operate them), and to ship the pad production multiphase to a small plant.
Depending on the set up, this plant could simply pick up production from a few pads, take some gas we needed for fuel and ship to the central plant.
I prefer to fine tune development to allow the facilities to get fully loaded abd run a plateau with a bit of surplus capacity, and this requires managing the drilling and completion schedule while making sure the most efficient rigs and crews are kept busy (this issue is neglected by the power point tassel loaf pansy management i see nowadays who dont understand a good rig crew has to be kept together because they are like a good football team).
When i hear about these large pads, the excessive use of single well pads, and the mess some companies make managing truck traffic i get tempted to buy one of those rock star buses and park it in a nice town like Midland and with a sign “Experienced oil hand for rent, fee negotiable”.
This fracking can’t go on much longer. They’ve drilled out much of the sweet spots already, and from what I hear, there are already 7 ‘child’ wells being drilled for every ‘parent’ well. (as I understand it, a ‘child’ well is drilled in close proximity to the ‘parent’ without – hopefully-hitting and drawing from the same formation’) If fracking were to stop tomorrow, you’d lose over 600k bbls/day in production immediately and the whatever is leftover tapering off to zero over the course of two-three years.
You see this in Ennos oil site, too.
When you compare 2017 and 2018 well quality (all US sites), well quality has improved but only a tiny amount. ALL years before this growth was much higher – so rock quality decline is finally catching up to improved tech.
The question is: Just how long will the USA be able to continue to increase production in order to hold off peak oil?
Yes will it go bankrupt first or continue to run on until peak and depletion. Meanwhile it drags down the oil price artificially making most other oil development less likely, and increasing volatility.
The FED is reducing money supply by 50 billions per month at the moment. The first feeling it will be comanies needing to sell junk bonds.
This is a big ploblem for the relentless “drill baby drill” programs of several LTO companies.
And a global economic crises, even if only a few years long, will crash oil prices AND credit supply. This will hurt LTO more than the oil price crash from 2015.
Oil bonds appear to be starting to feel the burn at $55/barrel.
https://seekingalpha.com/article/4222006-oil-plunges-energy-junk-bonds-turn-dangerous
I have the feeling that investors’ patience with a quarter or two of low oil prices will not sit well with the oil bond market, especially if there’s a recession on the horizon.
https://www.bloomberg.com/opinion/articles/2018-11-13/oil-collapses-the-fallout-may-hit-junk-bonds-hard
I was surprised to see evidence of reason yesterday: Cenovus has asked the government of Alberta to impose a production cap. Alberta provincial law exists to do this.
The piece is at Rigzone.
https://oilprice.com/Energy/Crude-Oil/Crude-Recovery-OPEC-Eyes-14-Million-Bpd-Production-Cut.html
OPEC and non opec, considering a 1.4 million cut. Mainly to counter EIA’s ghost oil.
You didn’t see David Blaine levitating oil to gulf ports last week? In all seriousness when will the EIA give up the ghost.. mid 2019 you think?
We are only a few days from putting together Texas production for Sept. from the initial production and pending data file. I already have the pending file for the second month, and it’s been adjusted down by about 60kbpd. My guess is that it will come up with a decrease for Sept. probably for Oct, too. Even though there was an uptick in completions in Oct., most of that will show up in Nov. Bottom line, EIA’s projection of 12mbpd by mid year is a complete fairy tale. It will probably rock along at around 11.1, or slightly over, until the fourth quarter of 2019. When oil is close to $55 by mid November, budgets for the other shales are probably not going up much. EIA won’t give up the ghost, they are believers in ghosts, Santa Clause, and the tooth fairy.
Guym,
There have been increases in other states besides Texas (North Dakota, New Mexico, and Colorado), eventually lower output from OPEC and Russia (if they decide to cut) and from Texas will lead to higher oil prices and perhaps higher output, non-Permian basin output has increased at an annual rate of about 450 kb/d for the past 6 months, if Permian output were flat due to pipeline constraints, but the rest of US rolls along at a 450 kb/d annual rate of increase, then we get to 11.8 Mb/d by August 2019, not quite 12 Mb/d, but pretty close and I doubt there will be no increase in Permian output over the next 12 months, 200 kb/d (17 kb/d each month on average) increase from the Permian gets US output to perhaps 12 Mb/d (if non-LTO output remains flat over the Sept 2018 to Aug 2019 period).
I would agree there are a bunch of very optimistic forecasts such as the EIA’s DPR. The EIA STEO projects a 740 kb/d increase in US C+C output over the next 12 months (Sept 2018 to Aug 2019) and expects 12.09 Mb/d of output in August 2019. Might be a bit high, we will find out in about 11 months.
Honestly, Dennis, how much do you think they are planning additional capex next year for areas outside of the Permian with oil at $55 a barrel? Agreed, if prices go up later, they can always shift gears, but there is a six month lag time on that, at least.
Guym,
I think an increase in the completion rate for DUCs could be accomplished in much less than 6 months, maybe 2 or 3. I also suspect we won’t see $55/b for very long, when OPEC cuts, prices will go up (actually just the decision to cut will move the price of oil). Note also that output increased while oil was $55/b, and the capital not spent in the Permian may move to other basins, while they wait for pipeline construction in the Permian basin. No way to know for sure, but as the Permian basin slowed their rate of completion, other areas have seen bigger increases in output. Have you seen a big slowdown in activity in the Eagle Ford due to the recent fall in the price of oil?
You have a huge amount of ducs in the Permian, not that much elsewhere, except dead ducs. There hasn’t been much in the way of new permits in the Eagle Ford, even when prices were much higher. Except for tier one stuff, there is no profit at $55. Tier one stuff in the Eagle Ford is just to keep afloat, not increase production.
And how long would you think it would take for higher prices to be sustained, before a company takes a leap up???? You drill a well, and the highest production is in the first five to six months. Up and down prices would not tickle my interest much, but then I’m not an operator. Just an investor and royalty owner, but I hope they wait to drill mine when prices are consistently higher.
Guym,
I don’t know how long an operator might wait, with the volatility, if they wait they may miss the boat, say oil goes back to $65/b in the next 4 weeks and remains between $60 and $70/b for another 4 weeks (or continues higher), some may decide to pull the trigger. I don’t know how these decisions are made as nobody knows what tomorrow’s oil price will be.
Everyone in the oil industry hopes for consistently higher oil prices (except the refiners I suppose), some day that might happen 🙂 I hope so.
Guym, I’ve noticed some things about recent EIA reports that seem odd. The info you give, if correct, indicates a wide divergence by EIA reporting. Do you suspect that the EIA could be intentionally overstating production?
The President is willing to tell bs to keep prices down. The EIA is part of his admin, so what are the odds?
dclonghorn,
Are you talking weekly reports and DPR? Those are garbage. The only data reporting worth paying attention to are the monthly reports for US crude oil production and tight oil production in my opinion (see page linked below.)
https://www.eia.gov/petroleum/data.php
Also the page linked below has some good information
https://www.eia.gov/petroleum/production/
especially good are the “crude oil comparisons with other estimates” scroll down looking at right hand column.
I also came across the article below which discusses production rates from horizontal and vertical oil wells and the relative drilling rates for each.
https://www.eia.gov/todayinenergy/detail.php?id=37492
Hi Dennis, The DPR’s are useless to me. The weekly reports must be taken with a grain of salt, or maybe a bag. But the weekly’s do indicate some trends sometimes, and when taken with the monthly’s they should give a good indication of production and inventory of crude and products. I’ve watched them for a while and though I can’t put my finger on it something seems wrong.
If Guym’s hypothesis of declining permian production in sept. and oct. is correct then comparing it to the monthly and weekly EIA’s leads to the kind of differences that are not easily explained by inaccuracies.
I’d say it will be more flat until November, when it may pick up about 200k to the fourth quarter of 2019. However, you have to adjust that for about a 100k overstatement on August monthlies in Texas, and GOM probably will trend down. But, George or others are better to comment on GOM, than I. But, the weeklies probably have an overstatement of close to 500k, or more.
Guym,
Agree Permian output will probably be flat until more pipeline capacity (or rail capacity) is available. Mike has said using trucks is too expensive and no doubt he is correct, in my opinion.
Guym and dclonghorn,
I just ignore the weekly production data and the monthly data is also not perfect, but it gets revised as better data comes in over time. Also weekly data doesn’t tell us what is happening in Texas, GOM, or any particular state, it just gives us a US total (which is often far off the mark and is never revised). So weekly data can be looked at for storage trends (but these are also not very accurate).
Guym, I looked up the Texas completion info you were talking about. Oil completions in Oct. were 987 compared to 553 in Sep. and an average of 694 for the first 9 months. Isn’t that a pretty large uptick?
From reading third Q earnings releases, I was thinking 4th Q activity was supposed to be down a little. Any thoughts on this?
dclonghorn,
Probably a three month centered average would give a better indication, as the data on completions is pretty noisy. Past 3 month average (aug to oct) has been 713 oil completions per month, for the 3 months centered on June 2018 the 3 month average was 802 oil completions, so a drop of 12.5% from June to Sept for centered 3 month average oil completion rate. For the 3 months centered on March 2018 the 3 month centered average oil completion rate was 648 completed oil wells per month for Texas. Note that Texas oil output was increasing pretty rapidly over the first 6 months of 2018, and that the Sept 3 month centered average oil completion rate (which was higher than the March 3 mo avg rate) may be high enough to result in continued increases in Texas output (though I expect the rate of increase will be smaller than the first 6 months of 2018).
I don’t consider that a large uptick, no. May was 739, June 914, July 763, August 601, September 553, October 987. But, RRC only reports when the completion reports were turned in. There is sometimes a two to three month lag before they are finally reported. Could be a lot of those 987 were completed in earlier months. Quien sabe? But I am with Dennis on the probable flat production. May be up and down month to month.
Thanks for the info. I have not been watching those stats much so that’s helpful. It is amazing how much EIA reported production has grown over the last year. Texas up 100,000 bbl per day per month for the last year.
Guym,
We are in agreement, flat or maybe up a bit would be my guess, though much will depend on oil prices and I always think they will be higher than they actually turn out, it is a tough business to be in of that there can be no doubt (at least in my opinion.)
Came across this at EIA, kind of interesting
https://www.eia.gov/todayinenergy/detail.php?id=37532
November 16, 2018
The Wolfcamp play has been key to Permian Basin oil and natural gas production growth
From Aug 2017 to March 2018 Texas output increased by 800 kb/d and from March 2018 to Aug 2018(133 kb/d per month), the increase was slower at about 400 kb/d (67 kb/d per month) based on EIA monthly data estimates.
Guym is absolutely correct on the completion data, it is probably not 100% accurate (no data is.)
What a different world we live in. Ten years ago, having followed Deffeyes, Campbell, et al. for many years, reading shelves full of books, even dipping into a scientific journal every now and then, I thought I knew approximately what would happen with oil production within five, ten years or so. The luxury of such certitude is dead and gone.
I wonder if things aren’t altogether worse now: Before, we had the cold comfort of “knowing” what would happen, and when, and what the effects would be. Now it seems we don’t know shit.
Mike Lynch’s comment quoted above –“no peak in sight”–is true, with a dreadful irony: no peak in sight, because we’re blind to it. And now that we’re making sure we burn it ALL up, there is no recourse when the decline sets in.
Whenever that will be.
All we can say for sure is that, because we live on a finite planet, every day that passes it is more likely to happen; and the longer it takes to happen, the worse it will be.
How about in five years? Maybe sooner.
Sleepwalking Into The Next Oil Crisis
https://www.forbes.com/sites/rrapier/2018/03/23/is-the-world-sleepwalking-into-an-oil-crisis/#6f4c87d244cf
Gone Fishing that is an older article from March 2018, but the analysis is excellent and I agree with Rapier 100% and believe it remains correct today.
“older article” Yeah it’s this year, but I have a tough time getting 202o articles so find the old ones that make some sense. 🙂
Gonefishing,
Much changes in the oil industry from month to month, so viewpoints change quite a bit in 6 months time in some cases. A more recent article by Rapier at link below does not seem to contradict his viewpoint from last March and as I said, I agree with the March analysis and his more recent post below (generally Rapier is very good in my opinion).
https://www.forbes.com/sites/rrapier/2018/11/11/oil-is-oversold/#70ae7a031fbc
Europe 15 + Norway crude oil inventories to September – OPEC MOMR
Chart: https://pbs.twimg.com/media/Dr_t6v4XQAAQ9if.jpg
Europe15 + Norway crude oil & products inventories to September
(Crude Oil + Gasoline + Naphtha + Middle distillates + Fuel oils)
Chart: https://pbs.twimg.com/media/Dr_uo2-XQAEmZFO.jpg
Lights https://pbs.twimg.com/media/Dr_vWV7X0AMrKQM.jpg
Middles https://pbs.twimg.com/media/Dr_vJYmX0AMtAY2.jpg
Hi Ron, thanks for the post, the great blog, and your comments. I see on the world production chart that November 2016 and February 2018 are pretty close to being roughly tied for peak. Do you, or anyone else please, happen to have the production numbers for those two months?
Nov-16 82,304,000
Feb-18 82,286,000
Yes Ron, thank you for an excellent post.
On the shale topic; it is marvelously stupefying to observe a heavily indebted shale industry supplying increasing volumes of oil, to an extent that the price/bbl never hits a level where any debt reduction can be realized. (to say nothing of profit)
Its’ almost as if they have no intention of becoming solvent.
Not to mention Uncle Jerome at the Fed is tightening the vise on cheap money. I wonder what the industry average is on rate of interest paid on debt. You see junk debt ranging from 6-8% but how much of the industry is actually paying that high of a rate?
Amazon has had problems with profitability for its whole existence, yet is the darling of Wall Street. Netflix is following the same path, so too with the shale companies. Because of all the technology these companies have at work to produce oil, I think the markets largely see them as a subset of the technology industry, and the usual paradigm in tech is that profitability isn’t as important so much as growth.
Some time ago presented estimate of oil used to create and move food in the US. My recall is the number wasn’t huge.
Recently came across new data. Will get around to laying it out.
25% of total US consumption. Tractors, insecticides, some fertilizer(transport of those to the field), transport of animal food to hogs, beef, etc, transport of human food to shelves, transport of people to the shelf and home. 15% pre transport of human food, 10% transport human food.
Pretty efficient agriculture in the US. No squeezing that 5 mbpd.
Unless people stop eating too much, switch towards a vegetable diet and buy locally or start growing their own food.
Or you know, stop wasting food. It’s ludicrous to call a system efficient that wastes 150,000 pounds of food a day.
https://www.theguardian.com/environment/2018/apr/18/americans-waste-food-fruit-vegetables-study
This country needs to spend more time looking in the mirror. I’m not talking about the fact that a third of adult Americans are obese either. I’m talking about how stupidly wasteful the economy is.
Now Bakken is in queeze mode with discount up to 20$ to WTI due to pipelines booked out.
Looks they have a drilling frenzy there and exploding production. Or is part of the problem canadian oil pressing into these pipelines via rail end points, too?
https://oilprice.com/Energy/Energy-General/Bakken-Prices-Crumble-On-Pipeline-Woes.html
Canada – August seems like a long time ago, Alberta AER says production came back down in September…
2018-11-09 Statistics Canada – August crude oil and equivalents production up +9.6% compared with the same month in 2017.
Press release (in cubic metres)
https://www150.statcan.gc.ca/n1/daily-quotidien/181109/dq181109d-eng.htm
Chart https://pbs.twimg.com/media/DsAauhqXgAARbVF.jpg
Crude oil inventories up +9 million barrels in August
https://pbs.twimg.com/media/DsAbUzYWkAAi3Y2.jpg
https://pbs.twimg.com/media/DsAbnKTXgAEuV-9.jpg
2018-11-14 Canada’s oil industry to spar over forced output cuts
https://www.worldoil.com/news/2018/11/14/canada-s-oil-industry-to-spar-over-forced-output-cuts
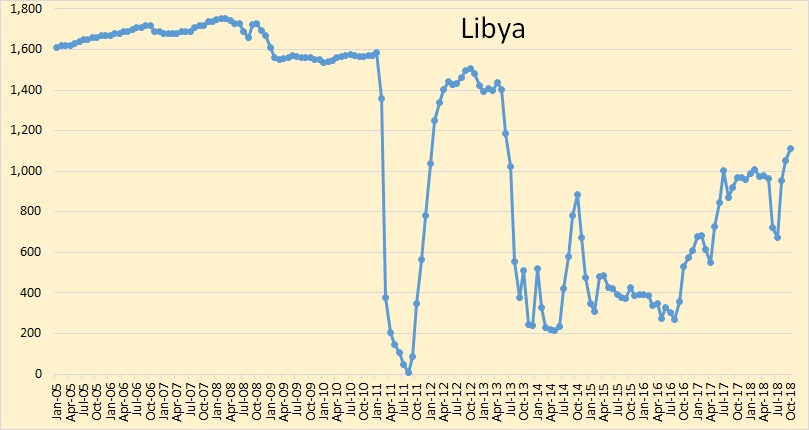
Libya wants to invest $20bn in upstream. It sounds like Libya could produce another +150 kb/day just by increasing maintenance spending…
2018-11-15 (The National UAE) Libya’s National Oil Corporation said. “By 2022 we are going to have more than two million bpd of oil, and more three billion standard cubic feet of gas, so we need a total of $20bn for the next five years, so this [is going] to increase production,” he added.
“We could add more than hundreds of thousands of barrels per day if we do some repair on pumps, generators,” said Mr Sanalla.
https://www.thenational.ae/business/energy/exclusive-libya-needs-60bn-to-overhaul-energy-infrastructure-says-noc-chairman-1.792088
Record products supplied – crude oil, big build but products equally big draw…
U.S. Petroleum Balance Sheet, Week Ending 11/9/2018
Products Supplied, Line 26, Total: 22,387 Difference: +2,001 kb/day w/w
http://ir.eia.gov/wpsr/overview.pdf
Saxo Bank chart summary https://pbs.twimg.com/media/DsDkmkYWsAI9Kgm.jpg
Energy News,
Happens every year during fall refinery maintenance and then again in the Spring (another round of refinery maintenance). Crude piles up and product stocks go down due to lower refinery throughput.
Pennsylvania just released September’s gas production reports.
524 Bcf total comes to 17.4 Bcfd.
2018 exit rate will exceed 6 Trillion cubic feet per year.
Combining Ohio and West Virginia Utica and Marcellus (and Upper Devonian) with Pennsylvania will assure excess of 8 Tcf per year from the Appalachian Basin in 2019, possibly even 2018.
For context, size-wise, the highly touted gas reservoirs recently found in the eastern Mediterranean are said to contain 30 to 50 Trillion cubic feet total resource gas in place.
The highest recent producers such as the McGavin 6 and the Howell 8 are at the 11 billion plus mark at 14 months online.
For those tracking financials, these 2 wells – at $3 HH – have each grossed about 35 million bucks in a little over a year.
Tomorrow afternoon’s Directors Cut is expected to show another new production record for the Bakken.
Cowboyistan with Appalachia Rising.
Coffeeguyzz,
So two wells are making money, that is nice. The average cumulative output at 14 months for the 7486 Marcellus wells that have been producing at least 14 months is about 1.73 BCF according to shaleprofile.com so a gross revenue of 5.2 million per well. At 36 months the average well has a cumulative output of 3 BCF so gross revenue of about $9 million for the average well, probably at least half of the revenue is paid out in royalty, taxes, transport cost, and OPEX, leaving a net revenue of 4.5 million, my guess is the average well cost (for all capital expended for drilling, completion, needed well infrastructure, land, and plugging the well at end of life) is probably at least $8 million, so they have only lost 3.5 million per well on average. I know you don’t worry about silly stuff like profits so you should definitely invest. 🙂 Note that experienced oil men like Mike Shellman look for the well to pay out in 36 months for a profitable experience, though Shallow Sand looks for a 60 month payout, the difference is possibly due to the different nature of the wells that they operate in their respective operating areas.
Note that the 60 month cumulative for the average Marcellus well is 3.9 BCF, so only a 2 million dollar loss on that basis. Sign me up 🙂
https://shaleprofile.com/2018/10/23/marcellus-pa-update-through-august-2018/
You’re gonna stick to viewing these operations largely through the filter of ‘averaging’, I reckon. That is, plotting a bunch of numbers and neatly computing an abstract composite.
So be it.
You are the math guy, not mois.
Kinda makes me wonder though …
If half of Americans are male, and half female, would the average American then be Caitlyn/Bruce Jenner?
I think I’ll stick to what is actually going on and make evaluations accordingly.
Average is what counts.
You buy 100 lottery lots for 1$ each.
2 win with 40$ each, the rest are duds.
Do you have made 78$, or lost 20$?
If you drill only 1 well, or own only the best sweetspot – good for you. The whole industry can be measured with the average – and every company’s earning is based about their average, too.
Coffee, this comment is, well, I’d ask Dennis pretty please to take it down if I were you. You can stick to all the “evaluations” you need from investor presentations but it hardly represents what is actually going on. It is just more “filtered” crap.
Trillions of MCF’s got produced in the App Basin over the years at less than 70 cents an MCF. Unlike the shale oil industry, who is severely market challenged and can’t think past next week with regard to the relationship between supply and price, the shale gas industry seems to have manipulated this years gas situation nicely by elimination of storage. To its benefit, of course. The plus $4 spike currently must be killing debt ridden households in the NE.
At $2.80/ MMBTU, however, about the norm the past few years, after royalty, marketing, etc. etc. those guys must be netting something around $1.65, maybe. And those super long laterals completely stuffed with sand are costing $10MM plus.
Basically, the shale gas phenomena (see Webster for definition of phenomena) is only slightly less of a money loser than shale oil.
And the Bakken data that is coming out that has Coffee puffed up…phffttttt. They’re getting likely less than $40 a barrel in the Bakken at the moment. That hurts the ‘ol pocketbook, trust me.
Hey Mike,
Texans don’t borrow money?
Historically RBL was played a role in oil and natural gas development but not to the extent it is being used today by the shale phenomena. If a well takes 4 years to reach payout and the best one can hope for is a 40% ROR over the ensuing 14 years, one better be very good at managing that wells indebtedness. I hope you are sitting down because the shale industry has made a stinking mess of it. Unlike borrowing money to buy a duplex there is nothing out there above or below ground that is actually appreciating; from day one it is all depreciating. When the well reaches its economic limit there is nothing to sell, little to salvage, there is only an enormous liability.
If you don’t have a shale well, Dennis, get one, as the old saying goes. You can buy tons of non-op NPWI in the Bakken and, if oil prices behave as you expect them to, you will make a killing. If nothing else a rational understanding of the burden of debt on an industry subject to volatile product prices will at least make a better ‘analyst’ out of you. Just think, you could even get some longhorns for the front of your Tesla. Or moose horns.
Hi Mike,
The “debt” cmment was in reference to the “indebted” people of the Northeast that won’t be able to afford natural gas. Many in the more rural areas of the Northeast use oil, propane, wood, or coal for heat as there is no natural gas infrastructure, in the cities and metro areas (where most of the people live) you are correct the higher natural gas prices will hurt.
It just is not clear to me that household debt is any higher in the Northeast compared to Texas.
I agree with you that at current price levels for oil, investing in a shale oil well would not be a great idea (at least for the average well). About $85/b at the refinery gate (typically close to Brent of LLS), assuming $5/b transport cost for Permian and $10/b for Bakken, would be needed for a decent rate of return at a well cost of $9.5 million (2017$).
Using the AEO reference price scenario from the AEO 2018 from the EIA, the debt can be paid off in the Permian basin, the med/low case oil price in the chart below does not allow the debt to be paid off. Neither of us knows which of these oil price scenarios is more likely, but my guess is that oil prices will be closer to the AEO reference case or higher. Note that I call the “reference” case AEO med in the chart below, med/low is the average of the med and low cases and med/high is the average of the med and high cases.
Click on chart for larger view.
Mike,
Yes I am well aware that capital depreciates in the oil industry, more like borrowing to buy a car than a home, to do it right the loans should be paid back over 3 to 5 years and when a business is mature (no more increase in output), debt should be paid off and operations should be out of cash flow.
Also I agree low oil prices (under $60/b at the refinery gate) will be the undoing of LTO producers. Those with high debt levels are likely to fail.
Hi Coffeeguyzz,
Think of someone who designs elevators. When they say 10 people can be carried, what do they mean? You would say it means the elevator can carry 14,000 pounds because the heaviest person ever weighed about 1400 pounds.
I would say the elevator is probably designed to carry about 1600 pounds because the average mass of a human is about 154 pounds.
The average is much more representative of “what’s really going on”. The 11 billion cubic foot wells at 14 months are more like the 1400 pound person, they are outliers and not representative of the entire population of wells.
Have you ever taken any courses on statistics?
The average is most certainly NOT representative of what is unfolding in this unconventional realm and those of you who continue to hold that stance will continue to be surprised at ongoing developments.
There is WAY too much heterogeneity, WAY too much dynamism amongst regions, individual horizons, well by well, stage by stage differentials that just the geology alone makes for continued adaption.
Throw in innovations starting with pads, then micro seismic, diverters, remotely monitored drilling/fracturing, the amassing and analyzing of stupendous amounts of data, on and on.
You guys have been demonstrably wrong and will continue to be so unless and until YOU adapt to these emerging realities.
Those 2 Marcellus wells are the best of the best and in no way represent the norm.
However, they show what CAN be accomplished and so serve the industry wide engineers to dissect the minutia of particulars in the ongoing collective efforts to both mimic and improve upon those stupendous results.
And that’s a fact, Jack.
Coffeeguyzz,
Yes there are good wells and bad wells due mostly to differences in geology from one location to the next. On that point I agree.
Perhaps you are familiar with the idea of a distribution of different well productivities.
If we consider the 2016 Marcellus wells completed from Jan 2015 to Dec 2017, the mean cumulative output at 14 months was 2.157 BCF, the median was 1.8 BCF, about 63% of wells completed had cumulative production of less than 2.1 BCF and 38% of wells completed had cumulative output of less than 1.3 BCF. Also 23% of wells have cumulative output of less than 0.9 BCF at 14 months and 75% of wells less than 2.7 BCF of output at 14 months (again this is for wells completed from 2015 to 2017.)
In your initial comment you mentioned 2 wells at over 11 BCF cumulative at 14 months, how many of the wells completed in 2015, 2016, and 2017 produced 11 BCF or more? Exactly 2 out of 2016 completed wells or 0.1% of all completed wells.
If you consider that sample representative, I don’t really know what to say. You have noticed that I don’t pull the same crap from the other end of the distribution. In this case there are 135 wells (2%) with 0.1 BCF of cumulative output or less after 14 months. I make no claims that such wells are typical.
In a business that aims to make a profit one has to take account of all the wells completed, which is what the average well reflects. Read up a bit on statistics maybe and perhaps you will understand.
Read up a bit on the ongoing operations in the Appalachian Basin and perhaps you will understand what is taking place there.
I’ll not again spend the time disproving Marcellus well results as I did a few years back when you and Mr. Roughneck offered some preposterous statements regarding Cabot well EURs.
While educational for me, I am not interested in knocking down strawmen.
However, although I have difficulty navigating Enno’s site – the source, I presume, for your data – I will go over some of your stated statistics and validate/invalidate/contextualize what I find over the coming weekend.
To be clear, I am totally disinterested if you proceed to make erroneous claims.
You have always displayed a genuine desire to obtain the truth of things. I would think all these years of ‘missing’ this so called Shale Revolution would prompt a self examination as to the causes.
Or, mebbe not.
Coffeeguyzz,
You may not read what I write. Generally I have used the data I have and tried to simply make forward projections, see for example the post below where a made a range of projections for the Bakken based on different assumptions.
http://oilpeakclimate.blogspot.com/2013/10/exploring-future-bakken-decrease-in.html
see figure 4 and note that in Oct 2013 I did not anticipate the fall in oil prices that would occur a year later.
In many cases I match the analyses of the EIA AEO, USGS, NDIC, and others. Yes there has been a shale revolution, but most companies are not very profitable and eventually new well productivity will decline as it has always done in every oil field ever discovered. Despite what some people believe the resource is not unlimited, and eventually if these firms do not become profitable the well completion rate will fall to zero.
Coffee, it is possible to make all of Kuwait into one big golf course that would parallel Augusta, complete with purple azaleas. All it takes is money. Thats the shale biz!
After over a half century in the oil business I might be offended by your “strawmen” comment but for the fact that your comments keep getting stupider and stupider; therefore I am not. If you read the comments here on POB, on twitter, wherever, you will see lots and lots of people who have no knowledge of the oil business question the viability of an industry so tied to credit to survive. LOTS of people think for themselves and seem to be able to sort this shaleshit out. I am sorry you can’t. I tried to help. I am done with you, hand. You’ve lost all credibility in my mind.
https://twitter.com/aeberman12/status/1063429017586622470
Coffeeguyzz,
The data is at shaleprofile.com.
https://shaleprofile.com/2018/10/23/marcellus-pa-update-through-august-2018/
Go to productivity distribution tab on second chart, I chose 14 month cumulative and 2015 to 2017 wells for first flow. Productivity distribution in chart below, click on chart for larger view. About 95% of Marcellus wells completed from 2015 to 2017 produced less than 4.5 BCF over their first 14 months of output.
Dennis, that’s a neat distribution plot, similar to a conventional reservoir sizes distro. Should be able to fit a dispersive profile to it.
Paul,
I thought it interesting that the mean was at close to 63% for the cumulative probability which suggests a Maxent distribution.
We have Enno Peter’s excellent data and programming skills which allows me to reproduce that chart from shaleprofile.com.
Thanks Enno!
Definitely he does a good job.
Coffeeguyzz,
Using my Bakken analysis from October 2013 (5 years ago) and updating only the date that EUR starts to decrease to June 2019 ( a guess, but EUR has stopped increasing in 2018, so a decrease may begin soon or not) and the annual rate of decrease in EUR such that total TRR matches the 2013 estimate by the USGS (10 Gb) for the ND Bakken/Three Forks. We get the scenario below which does not attempt to match the downturn in 2015, but simply assumes 2016 new wells are added each year (168 new wells per month). This model has output at 1.32 kb/d for Sept 2018 and 2.8 Gb of cumulative North Dakota Bakken/Three Forks output from Jan 2005 to Sept 2018, through Dec 2050 cumulative output (from Jan 2005 to Dec 2050) is 9.8 Gb.
Computer problems so I am trying to make do without Microsoft office (a painful experience).
Horizontal axis should be Jan 15, 2009, Jan 15, 2019, Jan 15, 2029 and Jan 15, 2039. The numbers appearing now are roughly days since Dec 31, 1899. If you do the math (2009-1900)*365.25, you will find that there are 39,827 days from Dec 31 1899 to Jan 15, 2009, then each 10 year period is about 3652.5 days apart.
The geology is all very well, but for finance guys it’s a black box. All they see is how much money goes in and how much comes out. If they even know how many wells there are, they take average values over those wells.
Hi Dennis, The average 2017 Marcellus well according to shaleprofile is 2.9 BCF at 14 months. They are getting more productive.
dclonghorn,
The average lateral length increased by 53% from 2015 to 2017 which accounts for most of the increased productivity. Antero doubled proppant per foot (I could not find industrywide data) in the Marcellus and the increased proppant and use of different additives to frac fluids may account for the rest of the increased productivity The 53% increase in lateral gets us to 97.5% of the 2017 average well 2.83 BCF vs 2.9 BCF, so possibly more proppant gets us to 2.9 BCF.
Payout isn’t the best measure of well returns. The best option is to use a risked discounted cash flows to an economic limit. This of course is price sensitive. If a well yields a risked positive present value above the cost of the investment capital, then the deal is a money maker.
Nobody said it was the best measure of well returns, Fernando. Its important to folks who spend their own money, however, and are able to replace reserves and grow without the use of debt.
Fernando,
It is just a simple way of explaining the principle. I use a discounted cash flow analysis for my models and as Mike correctly points out such an analysis depends on the assumptions for future oil prices which nobody knows. Also we don’t know what will happen to future OPEX, royalty and tax rates, transportation costs and so forth though one could do a sensitivity analysis to see how changing the assumptions affects the analysis, I generally focus on different scenarios for future oil price, though the same could be done by reducing or increasing OPEX, royalties, taxes, etc.
Count liquids as well.
I count all crude plus condensate reported, in many LTO plays (especially the more oil focused plays like Bakken and Permian Basin), natural gas is a product that yields very little profit as is evident from the fact that regulations are needed to prevent all of it from being flared. So if by “liquids” you mean NGL, it affects the Bakken and Permian very little, though it might be significant for the Eagle Ford and perhaps SCOOP and STACK. I do very little analysis of Marcellus gas, NGL may be of great significance there, I have never looked into it.
US oil imports – looking at the chart at the bottom of the page Saudi oil exports to the US are already down over -0.5 million barrels per day
2018-11-15 ClipperData – Saudi Arabia crude oil loading bound for the USA
http://blog.clipperdata.com/misdirection-of-houdini-sized-proportions
Some international weekly inventory changes
Products: down -8.5 million barrels
https://pbs.twimg.com/media/DsFAwtRW0AAv25v.jpg
Crude oil & products: up +4.6 million barrels
https://pbs.twimg.com/media/DsFBL5fXQAEiO0_.jpg
Light and Middle
https://pbs.twimg.com/media/DsFBtP7WoAAI2BH.jpg
A look at just the USA in the same Light & Middle format
https://pbs.twimg.com/media/DsFC1ODXcAEYfK1.jpg
Japanese Weekly Inventories
Total (Crude + Products): +4.38 million barrels
https://pbs.twimg.com/media/Dr9Wb0TWoAAXj3e.jpg
EIA Weekly US Ending Stocks. November 9th. Weekly change in million barrels
Crude oil (without SPR) up +10.3
7 oil products down -9.6
Total (Crude + Products) up +0.7 (From the end of Dec 2017, down -1)(not shown on chart)
Propane & NGPLs down -2.9 (From end of Dec 2017, LPG is up +25.6)
SPR down -1.4 (not shown on chart)
Chart: https://pbs.twimg.com/media/DsFFdljWkAApOQf.jpg
Chart for gasoline with dates for seasonal highs & lows
https://pbs.twimg.com/media/DsFKCpJXcAEfmYL.jpg
Shallow Sand mentioned EV as a sign that oil consumption might go down.
I view EVs as inefficient natural gas powered cars, or worse. And the key problem is its lithium battery. See http://www.epa.gov/dfe/pubs/projects/lbnp/final-li-ion-battery-lca-report.pdf
The cost of producing a large lithium battery is high and it is “perishable product”, which will not last even 10 years. The average life expectancy of a new EV battery at about five (Tesla) to eight years. Or about 1500 cycles (assuming daily partial recharge, which prolongs the life of the battery) before reaching 80% of its capacity rating. https://www.quora.com/What-is-the-cycle-lifetime-of-lithium-ion-batteries
Battery performance and lifespan begins to suffer as soon as the temperature climbs above 86 degrees Fahrenheit. A temperature above 86 degrees F affects the battery pack performance instantly and often permanently. https://phys.org/news/2013-04-life-lithium-ion-batteries-electric.html
It is also became almost inoperative at below freezing point temperatures. For example it can’t be charged.
So they need to be cooled at summer and heated at winter. Storing such a car on the street is out of question. You need a garage.
And large auto battery typically starts deteriorating after three years of daily use or 800 daily cycles.
Regular gas, and , especially, diesel cars can last 20 years, and larger trucks can last 30 years.
Recycling of lithium batteries is problematic
http://users.humboldt.edu/lpagano/project_pagano.html
In a way EVs can be called “subprime cars.” Or “California cars”, if you wish (California climate is perfect for this type of cars)
Switching to motorcycles for personal transportation can probably help more in oil economy aria then EVs.
That also suggest that “peak oil consumption” for the next five to ten years remains a myth.
Best EVs are trams, and most people live in cities, but they mean people would have to face the horror of mixing with others so much better to spend all the money and discussion time on high end limos.
George,
I agree, light rail and subways are a great option where population density allows. For those in less densely populated areas, EV small cars and motorbikes are an option along with bicycles and walking.
Likbez,
Probably true that “peak demand” at current oil price levels in the next 5 to 10 years is not likely, but “peak supply” (which will coincide with “peak demand” as we cannot consume what is not produced) in the next 5 to 10 years is highly likely, oil prices will rise so that consumption falls with production. EVs will be needed to fill in the transportation needs, though more car pooling and the rise of transportation as a service will also help along with smaller vehicles, more motor bikes (where weather is not too severe, Canada in winter is not a great place for a bicycle or motorbike).
Also note that 80% range for a battery pack initially designed for 300 miles of range, is still plenty for most people, in fact 50% would probably do, also note that most people do not drive 250 miles every day, that would be 91250 miles per year and at 5 years would be 450,000 miles.
See https://www.greencarreports.com/news/1110149_tesla-model-s-battery-life-what-the-data-show-so-far
which suggests Tesla Model S batteries fall to about 85% of capacity at 150,000 miles.
Also there is
https://insideevs.com/highest-mileage-tesla-now-has-over-420000-miles/
Where the highest mileage Tesla was at about 80% of original capacity after 420,000 miles. For a battery which may have been 300 miles at 100%, that would be 240 miles of range after 420,000 miles, still plenty of range for most people.
> oil prices will rise so that consumption falls with production
Or, more correctly, consumption will be equal production.
> EVs will be needed to fill in the transportation needs
At what cost ? Is this an optimal path, or a marketing produced illusion of the solution and natural gas powered cars represent a better, more sustainable, deal? Does it make sense to burn natural gas to produce electrical energy which is transmitted with substantial losses (at least 10% in transmission and 10% at charging) to consumer?
> Also note that 80% range for a battery pack initially designed for 300 miles of range, is still plenty for most people, in fact 50% would probably do
That is true only for optimal range of temperatures. Which means California. At zero Celsius you already have 50% of capacity and no ability to charge the battery unless it is heated.
Imaging sitting in traffic crossing Washington bridge to NYC in 10 F weather with strong wind for three hours. Tesla heater consumes 7KW/h ( 27 amps at 243 volts). Or 21KWh for three hours. So you can run out of energy in the middle of the bridge.
Likbez,
Internal combustion engines are not very efficient, and natural gas will also peak and decline. Electricity can be produced by wind, solar, nuclear, coal, natural gas, geothermal, hydroelectric, and biofuels so is considerably more flexible.
The battery heats up from the charging system, it was 12 F in my garage recently and the battery charged just fine, also note it is not winter all the time and at higher temperatures, the car cools the battery when necessary, either using outside air or AC at discretion of owner using an app. The car uses less heat than you imagine, put the heater on recirc, use the seat heaters and dress warmly. Does it often take 3 hours to cross the GWB, seems like 30 minutes is more common in rush hour traffic?
For comparison at -2 C, I saw about 300 whr/mi compared to 260 Whr per mile at 13 C for a trip at motorway speeds, about a 15% increase in energy use or a drop in range from 300 miles to 260 miles for a 15 C drop in temperature.
It is possible to run out of gasoline on the bridge as well, the battery in the Tesla long range model 3 has about 78 kWhr when fully charged. When heading toward the GWB, if traffic is backed up I would use the tunnel or the Tappen zee as an alternate route.
Its not an all- or -none choice likbez.
For the next seven yrs I’ll wager that most new car sales will be some sort of hybrid vehicle. Mine happens to plug in, and can get about 360 miles with its gasoline engine. No worries on the bridge or in the cold.
So far, just over 2/3rds of the miles have been on pure electric.
This article outlines Fords plans over the next 3 years-
https://www.reuters.com/article/us-autoshow-detroit-ford-motor/ford-plans-11-billion-investment-40-electrified-vehicles-by-2022-idUSKBN1F30YZ
I don’t understand why pure electric has to be the answer.
Seems like a plug in hybrid that uses 1/3 or less the fuel would solve a lot.
I see above what I often see in these discussions elsewhere. The initial guy says what happens at 10 degrees Fahrenheit blah blah blah blah.
The reply talks about minus 2 degrees Celsius and what happens then. Well that’s about 30 degrees Fahrenheit not 10.
The rationale is often . . . Well this car is great for 90% of the travel that one would need to do. The rationale does not then continue to say. . . And for the other 10% you just need another car. That would not send the right message.
Make these things so that they carry the same payload, for the same distance, depreciate at the same rate, and refill their tank in the same period of time. Then you have success. You do not have success until then. And if “then” hasn’t arrived in, say, 5 years, it’s a failure. Too stringent? Okay, 10 years.
Watcher,
Everything does not remain the same, my Tesla can “refuel” at home each evening, was not able to do that with my old 97 Camry, maintenance costs are lower. Local temperatures so far have been as low as 12 F and no problems, as it gets colder I will report back when I have more data. Some have reported much lower range in winter temps, but I think it depends how warmly one dresses for long trips in the car in winter. I alpine ski all winter so can take pretty cold outside temps, usually down to -10 F and -30 wind chill, I am ok, though not very comfortable, I will probably turn the heat on at that point. 🙂
Oh and I was focused on the claim that at 0 C, range was 50% of range at 15 C, not the case in my experience (I have seen about a 15% drop for a 15 C drop in temperature), if the relationship is linear, then at -15 C (or about 0F) there would be about a 30% drop in range, the relationship may not be linear, I will report back when I take a long trip at 0 F, short trips at 12 F, I didn’t travel far enough to get a good feel for the drop in efficiency.
Also I have never been stuck on a bridge for 3 hours, have you? When it is 10F outside I usually am dressed pretty warmly as a car can always break down and I live in a rural area where I would need to walk to somewhere where I can warm up, also there are many places with no cell service, so I use caution when travelling in cold weather. Also, most families own more than one car, so pretty easy to have an EV and a hybrid.
Hey Watcher-
by the criteria you indicate [Make these things so that they carry the same payload, for the same distance, depreciate at the same rate, and refill their tank in the same period of time. Then you have success. You do not have success until then] , then sure. No success.
But short of ‘success’, you can still drive 15,000 miles a yr without going to the gas station. And for lees cost/mile.
Nonetheless, I wouldn’t be trying to replace a winter, rough road, cargo hauler with one, yet. I would keep a 4 wheel drive pickup or SUV petrol vehicle around in the family for that purpose.
For the vast majority of trips Americans make/miles traveled, EV’s will make the grade without problem.
Shallow sand,
Hybrids are great, but eventually will be a more expensive option once charging infrastructure is built out and oil output peaks so that gasoline and diesel are very expensive. Plugin hybrids or hybrids are a great transition vehicle, (I have had hybrids since 2004 3 Prius’s (Prii?) and a Camry hybrid, the last Prius is a plugin, but only 11 miles range on electric only so not nearly as good as a Chevy Volt, the newer Prius Prime I think gets 25 miles of range for the battery (EPA rating). For those with short trips to work or that can plugin and charge at work, the Prius prime could cover 12.5 to 25 mile trips from home to work (25 if charging at work is possible) with no gasoline use. Base model is 27k. If the Tesla Model 3 short range (220 miles of range) battery model ever is produced it will be 35k without any rebates for the base model. Currently the cheapest Model 3 available is 46k and through Dec 31, 2018 a 7500 rebate is available reducing cost to 38.5k, this rebate falls to 3750 from Jan 1 to June 30, 2019 and to 1875 from July 1 to Dec 31, 2019 and to zero after that. So if the base price for the midrange model (260 miles of range) is unchanged price would rise to 42.25k, then to 44.125k, and finally to 46k. This includes only the Federal tax incentive, some states also have incentives, just not where I live.
Just noticed that supposedly if an order is placed today for the midrange Model 3 (46000), you will get December delivery, which if true (I am skeptical) means a cost after tax credit of 38500.
This is the stripped down base model, but even that is pretty full featured (no enhanced autopilot, no AWD, and 260 mile range battery, and only black color at that price). A pretty nice car in my opinion at that price.
https://3.tesla.com/model3/design?#battery
With the referral code below the first 5 to order a new Tesla get 6 months free supercharging
https://ts.la/dennis15569
From the Tesla Order page:
Order by November 30th to ensure eligibility for the $7,500 Federal Tax Credit. Tesla will expedite shipping for 2018 delivery.
Note that I doubt that Tesla will be able to get you your car by Dec 31, 2018 (which would get you the 7500 Fed Tax credit) if you order on November 30, 2018, earlier might increase your chance, but if it were me I would try to call a sales rep at Tesla or try to schedule a test drive and talk to a sales person to see what Tesla will do for you if they promise Dec 31, but you get your car on Jan 2, will they spot you the 3750, that you lose? I don’t know.
I have been driving a Chevy Volt for the past 2-1/2 years. I recently went a full 12 months without putting any gas in the tank. Last weekend I took a 650 mile trip, all on gasoline, and got 41 mpg. I think this is about the ideal a POV transportation compromise possible.
Very cool, what range do you get on the battery? How much of a change in range do you see in winter, if it gets to -10 C where you live?
Hickory,
Which plugin do you have (Ford CMax maybe)? and what is the advertised and actual electric range? It seems the Ford Fusion Energi plugin Hybrid is the only Ford option I can find, which has a 7.6 kWh battery which would be about 31 miles of range (similar to the Prius Prime) if we assume 240 Wh/mile efficiency. Generally in the Tesla Model 3 that has been my average, though it varies from 200 to 300 Wh/mi depending on speed, weather, etc.
I have the Chrysler Pacifica Minivan Plugin Hybrid.
Its gets about 32 electric range.
I would have preferred one that had double the battery capacity and all-wheel drive, but overall it is an excellent vehicle, domestic too. Fast, and big enough to put a sheet of plywood in.
https://www.fueleconomy.gov/feg/Find.do?action=sbs&id=39483
Nice I didn’t know about that one. Price?
I got mine for 40K- highest equipped model.
Hickory,
So that is after the rebate of 7500? I see it is pretty easy to load up on options and push the MSRP to 50k, so depending on what you chose and how good a deal you struck, probably 47.5 K and then rebate bringing it down to 40 k. Very nice and seats 8.
That price does include the 7500 rebate, and I got 6K off the MRSP. Then added back the tax to get the total.
I have been extremely pleased with the ride and control systems.
‘imported from Detroit’
My Volt consistently gets over 55 miles per full charge at 301 Wh/mi, somewhat less in the winter, more in the summer.
Very nice. Over October to Nov 2018 I have managed about 246 Whr per mile, but this will probably rise to 275 or 300 Whr per mile over the winter.
So the pack is about 15kWh I assume for your Volt.
Correction, Volt battery pack 16.5 kWh
likbez-
True, the batteries are far from ideal, so far. Hopefully that will improve. Big companies are putting a lot of money into that sector now. Literally tens of billions.
You might as well start getting used to it.
Before too long, it will be the most common deal throughout the world.
Maybe you could read up at EV Nerds
Your next vehicle could be one of these-
https://evnerds.com/electric-vehicles/other-cool-ev-stuff/dsraider-and-ezraider-4-wheel-electric-vehicles-from-israel/
There will be choices from 30 countries I’d wager, from a skateboard to a big rig.
I now have a plug-in hybrid electric van made in the US of A. Its big enough to lay a sheet of plywood in. Only going to the gas station once every two to three months. Haven’t cried a tear.
This rant is a common symptom of fuel oriented thinking. You say a battery only lasts ten years, but how long does a tank of gas last? Liquid fuel (and its exhaust) is more or less invisible. In come out of the ground in pipes, gets stored in tanks, processed in huge factories etc, but nobody ever sees the immense quantities of the stuff that flows around.
I was talking to someone the other day about the risks of peak oil, he actually laughed and said he was worried about the issue over 10 years ago. But got fed up with it when oil production just kept on going up.
He sent me this link
http://www.theoildrum.com/node/3001
https://oilprice.com/Energy/Crude-Oil/Canadas-Crude-Crisis-Is-Accelerating.html
Brazil won’t open up to outside drillers until mid 2019. Canadian production will trend down from the above article. That leaves the economists at EIA to continue their massive production?
And the Saudis cut by 500k, or more.
https://www.cnbc.com/2018/11/16/saudi-arabia-cuts-oil-shipments-to-us-in-likely-bid-to-boost-prices.html
They feel they cooperated, and Trump fell short. Prices back up by the year end, probably.
Above quoted 25% of oil consumption in US is for food system. Here’s layout.
https://www.nrcs.usda.gov/Internet/FSE_DOCUMENTS/nrcs141p2_023113.pdf
Quote is 15% of energy and table says 95% of energy is diesel (dominant), gasoline and liquid petroleum gas. The major burn is production of fertilizer and insecticide.
Transport of food to mouth is not in their numbers. Tack on 10% for that.
25%. Pretty serious stuff. That’s 2007. Can’t glibly say proportion is higher now. Population grew, so did oil consumption in total, so proportion could be the same.
But. The microsecond production falls, and consumption falls, for any reason, the proportion grows, because people eat no matter what happens.
As a generalization, I would say most gasoline consumption is for personal consumption, and the rest is commercial, heating, or otherwise pretty much inelastic. As gasoline production makes up less than half of production, the rest is fairly inelastic, until EVs take over trucking. And, gasoline consumption is not that elastic now, either.
until EVs take over trucking
Short distance delivery-maybe.
Long distance? Not going to happen with current technology.
(lithium ion was first commercialized in the early 1990’s- its been a while)
Baker Hughes US Rig Count
Oil: +2 to 888
Natural Gas: -1 at 194
Permian: +1 to 493
Table https://pbs.twimg.com/media/DsJJ1_FWwAECCgW.jpg
Baker Hughes GE http://phx.corporate-ir.net/phoenix.zhtml?c=79687&p=irol-reportsother
2018-11-16 North Dakota produced 1.359 million b/d in September (a new record) vs 1.293 million b/d in August
Director’s Cut: https://gallery.mailchimp.com/4753e4b0ea70df438a15ff868/files/1815bee7-8353-4b3c-aae4-1be5a4293763/18.11.16.Directors_Cut.pdf
Chart for takeaway capacity https://pbs.twimg.com/media/DsJYL2vWsAAwvaJ.jpg
Energy news,
The case 2 in the takeaway capacity chart below has about 15 Gb of output from 2017 to 2050 (I assume linear decline to zero output from 2044 to 2050), this is about 2 Gb higher than the USGS F5 TRR estimate for the ND Bakken Three Forks (about 98% of North Dakota output). In other words, even before accounting for profitability, the USGS estimated in 2013 that there was a 95% probability that North Dakota Bakken Three Forks URR would be less than 13 Gb even in a very high oil price scenario (essentially the TRR estimate is close to an ERR estimate with very high oil prices assumed, such as a rise in oil prices to $200/b by 2050).
The Washington Post has reported that the CIA has determined that MBS sanctioned the killing of Jamal Khashoggi. Not exactly a surprise that MBS directed this, but the leaking of that assessment is, especially as Trump has been trying to direct the blame anywhere but at MBS.
This will have implications on Saudi – USA relations and Saudi oil production. What they will be is going to be interesting.
About 18 mos ago MBS was the darling of the left wing in the US and elsewhere, given his commitment to women’s rights and drivers licenses etc. He was also the driving force behind the Saudi Aramco IPO and NYSE getting THAT would have turned into serious money flowing into the NY area (which is blue) and thus was another reason for the Dems to cheer him.
But now it’s the Prez who would like MBS to get a pass. He’s offering to extradite an Erdogan opponent living in the US to get Turkey to stop the leaks to the media about the killing.
No real rationale clear on this, other than that MBS could shut off the Saudi SWF’s money flow into US companies and buttressing equities in general in the S&P.
The whole thing really does smell like a trap. An expensive one. My money, as it were, is still on the guys locked up in that hotel til they coughed up big numbers. They still had big numbers left and I think they spent some to get MBS caught doing dirty deeds.
Watcher, I’m not sure where your statement about the liberals loving MBS came from I thought he had always been buddy’s with the right wing. I would agree that both sides of the aisle have walked very softly in any dealings with KSA, out of deference to their oil weapon, as well as their opposition to Iran.
From what I understand, KSA has always been ruled with an iron fist and a lot of guile. If those guys who were locked up in the hotel decide KSA would be better off without MBS it will likely be very nasty. If they do not act then how will the Europeans and North Americans deal with a head of state who is credibly accused of luring a US resident to its Turkish consulate then murdering him.
If they had staged his murder as a mugging gone bad they probably would have gotten away with few consequences, but it appears they wanted folks to know so that any other dissenters would be intimidated. They have been accused of similar actions on others including Saudi Princes.
As a backdrop, these events take place at a time where I believe KSA is seeing meaningful production drops at its giant oil fields, and is now having to work hard to maintain its oil production. The myth of unbounded KSA oil reserves may be revealed soon. I’ve always wondered why KSA has kept production info as a national secret, and seemingly always grossly overstated its reserves. I believe it has more to do with controlling it own people than increasing it quotas.
Someone recommended Karen House’s book “On Saudi Arabia” recently. House describes KSA as having a young population of undereducated, largely unemployed men, in a country where 90 percent of all employees in the private sector are imported foreign workers. A country where Islam is preached not practiced, corruption is rampant, and strict Sharia law turns into an increasingly lawless society.
I certainly do not know what will happen there, but there is a good chance of it blowing up in some way, and they export around 6 million bpd of oil to the world.
Sept 2017:
“”Our sisterly women drivers, we wish you continued safety,” flashed roadside digital signs operated by the Saudi government’s Department of Motor Vehicles. Police officers handed out roses to women entering highway ramps at midnight.
Saudi Arabia’s King Salman lifted the ban as part of a package of changes designed to loosen the rigid rules governing the Muslim country’s society and economy. The king’s son and successor, Crown Prince Mohammed bin Salman, spearheaded the changes ”
Here’s another article from 2017:
Nov 2017, CBSnews
https://www.cbsnews.com/news/saudi-arabia-prince-mohammed-bin-salman-reforms/
He was the hero. After some money got spent on making him not the hero, he no longer is.
It’s really important for folks to understand the power of Sovereign Wealth Funds. All the ppl out there analyzing the stock market(s) and showing squiggly lines of what markets did in the past and how that suggests what will happen in the future are oblivious. It’s just a handful of guys running KSA’s SWF, UAE’s, Norway’s, Qatar’s, Kuwait’s . . . these are trillions and trillions of oil/gas-derived dollars and those handful are “the market”. What they say happens is what happens. There were never mutual funds of this size so the guys running those didn’t have this power.
(Pssst, Citadel and other HFT firms are at odds with SWFs, allegedly. Let’s just let that hang there for thought)
It’s not history. There is no history. MBS has clout no one else ever has before.
This is pretty much bullshit. The Saudis got zero brownie points for their weakass reforms. In fact it just reminded the world of what a fucked up country it is.
This is a basic marketing lesson you could learn from. For example the German national train system gets criticized for late trains, so a few years ago they implemented a system that shows exactly how late which trains were. It showed that they were mostly on time, but critics just used it to show that there were in fact delays.
On the other hand Ryanair blows a trumpet and brags (over the loudspeakers) every time their planes land on time.
A guy like you who can’t come up with a better argument than claiming he knows what his political enemies think is probably too dim to understand this, but give it a try.
Never trust a Clown Prince.
Ok, Texas preliminary figures for Sept. are posted and I already had the pending files. August is interesting. Not only is the reported production smaller than July, but the pending file has been adjusted down by almost 60k bpd. Making reported RRC August production 4350k bpd. EIA guessed higher at 4577k bpd, or 227k higher than Texas RRC numbers. Sept. is down further, and I am guessing 4240k bpd.
Here is a comparison from June:
…………… EIA. 2nd month RRC
June. 4406. 4344
July. 4451. 4363
Aug. 4577. 4350
Sep. ? 4240 (my estimate)
Where’s the beef? North Dakota is growing slowly, Texas ain’t. I’m guessing with the 300kbpd pipeline addition, it will creep back up to 4400 to 4500 bpd, but not much over. I’m beginning to have some real doubts about the estimates by drilling info which EIA uses. The source data should not vary much from users reporting of the source data.
For perspective, these are historical reported Texas monthly production figures. The August number is the first reported production number as of last month. It is now 111,325,548 and add 23,522,712 from the pending file. EIA is trying to add another 7,037,000 to that total, and that is a lot.
http://www.rrc.state.tx.us/oil-gas/research-and-statistics/production-data/texas-monthly-oil-gas-production/
EIA says that within 9 months, most (95%) of the pending data file is moved over to production (or what they call late reporting). Which I have looked at and agree with as a ballpark figure. That would make Dec 2017 at about 124,000,000. A 7 million barrel amount that is neither in reported, or the pending data file is completely unreasonable.
Guym,
I think if you go back about 5 months the drilling info data is pretty accurate (probably within 0.5% of the final number reported in the RRC PDQ after about 18 months, after 9 months the RRC is still not reporting full output in the PDQ.)
To confirm this go back to the RRC PDQ data set that ended with Nov 2017 as the most recent reported month and compare with current RRC PDQ data. You will find that it takes 18 months for the difference between the data sets to fall back to under 0.5% (in this case from Nov 2017 to June 2016). The RRC is dealing with 300,000 to 400,000 oil wells so there is a lot of data to keep track of, not the easy task of 15,000 oil wells for smaller producing states like North Dakota. Companies like Drilling info try to sort this all out and if they were not doing a pretty good job at it, they would not be in business. No data set is perfect and the RRC PDQ data continues to change even after 46 months the Nov 2017 data set does not match with the Sept 2018 data set for Jan 2014, though at that point the difference is only 194,000 barrels (0.22%).
Looking back at some of the older DI data from the EIA’s compstat file, the DI estimates are pretty good (within 0.5%) if you ignore the most recent two months reported in the compstat file (the most recent two months tend to be bit low, most recent month 8.5% low and 2nd most recent about 1% too low.)
Sometimes the 914 survey data is revised, so perhaps the survey data for Aug was messed up. This has nothing to do with the DI data which the EIA just presents for comparison.
DI data does seem a bit low for June and July, the EIA data will be revised eventually. In a situation where we don’t know, I just average. So my revised estimate would average your estimate and mine to get 4374 and 4412 for June and July, I expect there may be a revision for Aug data, but for now 4468 kb/d would be my Aug estimate which I think will be revised lower at the end of the month. No guess for Sept.
I don’t think you understood the gist of the historical data. Look at the historical increases. We go from about 124 million in December to 134 million according to RRC data. That’s a significant increase. Ten is significant. 17 is a wild number.
That’s seven million barrels a month that has not been reported to the RRC within two months. Or, somewhere around 73.5 million in royalty payments, which would be front page news in Texas, and lawsuits galore. If each unreported well average 15k for the month, considering 30k as a very high average, then that would be over 400 completions that have not been reported as production. Completion reports can be filed later, but production has to be reported. Prior to July, historically EIA monthlies and second month RRC data were fairly close. They have become significantly divergent recently. You can believe that, I don’t. I relied on the EIA monthlies being the saving grace of EIA attempt in staying with reality. Now, I don’t believe a damn thing they say.
And 4468 was my initial guess for August, which is close to yours. But, it did not get that high. We were almost 100k barrels over. My first guess for that month, is just a guess. Based upon using the difference in the previous months first and second reporting as my adjustment. My “final” us what the RRC has in their files. Which is usually adjusted downward over time.
https://mobile.twitter.com/DeanFantazzini/status/1064202298807730176/photo/1
https://mobile.twitter.com/DeanFantazzini/status/1064202160957808640/photo/1
Dean’s estimate, and he is relying on the initial reported production plus that amount in relation to past. But, his is trending down, too. I will not argue with his mathematics?, but mathematics is not the whole story. There are things like pipeline constraints that can complicate projections. It is interesting to note that his two month average and all vintage eventually meet in between, somewhere close. His two month is close to EIA until about June. So was RRC’s. As a matter of fact, his two month was consistently higher than EIA, until recently. My 4250k for Sept. is in between, as expected from his historical charting. But, all of this will not be clearer until mid 2019. EIA is just buying time.
Guym,
The survey data covers roughly 90% of Texas output, and perhaps it is not always accurate or the other 10% might change by quite a bit. The historical Texas output data changes over time, especially the most recent 24 months or so. I suppose the part of Texas output from small producers may have fallen drastically, perhaps due to pipeline constraints. For example, lets say Texas output was 4300 kb/d in Aug and 10% was not reported on the 914 survey (about 430 kb/d) let’s say this 10% fraction not covered by the 914 survey (all producers except the largest 100 oil producers in Texas) decreased from Aug to Sept by 20% (a WAG), which would be about an 86 kb/d decrease. That would amount to about a 2.6 million barrel decrease which would not have been anticipated based on the 914 survey, the 7 million barrel discrepancy would require a 230 kb/d mistake by the EIA, which would be more than half of the output by smaller producers. Also possible is clerical errors or mistakes reporting by the larger producers on the 914 survey. That is more likely to be the case than smaller producers cutting their output in half.
As I suggested earlier we may see an EIA revision at the end of Nov. We will find out then and won’t really know what Sept 2018 Texas C+C output is until Nov 2020.
Time flies. Long before Nov 2020, I will be able to give you a comparison of how the second month data compares to “final” numbers of Texas production. It’s only been a year, but it looks very promising. Nothing is going to be exact, because there obviously will be some corrections up and down, but the majority of “unreported” production is still in the pending data as far back as I can go, apparently. So, aside from some minor corrections, Texas production, as a whole, appears to be reported within two months. The only exception, so far, is in the first month of doing it in Sept 2017 when the Hurricane created havoc. Then the third month actually had an increase over the second month.
Laughingly, this may be the only time that an aged old accountant with an excel spreadsheet may be more accurate than a huge, highly paid staff with an almost unlimited access to alternate data? compare $10 a month and some interest to hundreds with millions to use. I know that gives very little credibility, but strangely I am comfortable with it.
Guym,
All production is “reported” to the RRC, the problem is that the pending file is a mess. RRC data continues to change if you go back several years, just take an old data set (say the one from Nov 2017 as the latest reported number and compare with the current data set for the PDQ.
As an example I found a PDQ I pulled in June 2015 with the most recent data point at April 2015, if we go back and look at April 2013 (24 months earlier) and compare to today’s reported PDQ data for April 2013 we find the old value is about 1% below todays value (old=71,992,763 barrels, new=72,699,077 barrels). Even 36 months back the old data is still 0.33% below the more recent data (old data for April 2012=55,866,550 barrels.)
At 18 months the PDQ is 2.3% too low and at 12 months 2.7% too low.
In an earlier comment you mentioned 9 months to “nearly complete data”, at 9 months the RRC PDQ was about 4% low (July 2014=95,638,163 barrels, over 4 million barrels lower than reported today in the RRC PDQ).
What the heck is a pdq? A pending data query? To do that, you would have to input all producers individually, and then add them up. A totally impossible and useless task. You can’t use anything but the last three months of the pending data file each month. Every month it has to be pulled. I have no idea what your talking about. I think you are still looking at the originals I pulled for you. I pointed out they starting going down, because some operators had a tendency to zero out pending data when it was switched over. To find a good comparison, you had to pay $10 bucks and pull it each month for a year or two to get a good comparison. You didn’t want to lay out $10, or take the effort, and now your looking at old data I gave you. Which I told you, at the time, they can’t be compared past three months, which you are doing anyway as an argument. The pending data query on the RRC site, couldn’t possibly be what you are referring to. That’s only good for a particular lease, or operator.
Let me try again. I am buying the pending data file from the RRC each month. I am NOT using the query system. That would not be accurate, at all. Each month I download, sort, and add up the actual pending data file, they have data going back to 2005. I don’t use the old data, just the most recent three months when they have moved very little data yet to the production file. I dont have to look at the September 2017, in the September 2018 file. I pulled the working files over a year ago, before they could get damaged. That’s my working files. That is how I will be able to compare past a year. The rest I do NOT use. If you continue to compare it, that’s your choice, but as I told you you are comparing damaged files. You did this previously, and I finally gave up on discussing it. But, if you figured out a way of using the query system to get the pending data file, I’m all ears. Be a big trick as some operators will not show up when queried. University of Texas doesn’t want you to look at their data via query. It is in the actual pending data file, however.
Guy, I’ve gone thru this with Dennis several times and it will do you no good.
Its quite simple, actually; because of the level of activity in Texas production from new wells is reported under drilling permit numbers until completion reports are filed and lease ID numbers are assigned. This “pending” file still has all the production in it and allows everyone to be paid for every barrel of oil that drives out he cattleguard, within 30 days. Every BO is accounted for and billions of dollars of revenue is distributed accordingly. All one has to do is look for the data, as you have. Indeed production to sales, sales to production (buyers report to the TRRC as well, on a lease by lease basis) and things like PL shrinkage, etc. are adjusted over time; so what? It all comes out in the wash and no dollar is left unpaid, therefore no barrel is left unreported. Not DI, or the EIA, or the DOE or PETA knows oil production in Texas before the TRRC does.
If you can’t think past data, or know what the data means, then one just wants more data, immediately; in real time. They don’t want to work for it, as you have. They like the NDIC better than the TRRC, because they THINK its better because it is faster and requires less work. They refuse to accept that the TRRC works. Some data hounds have even complained to the TRRC because they don’t like the way it has done things for 93 years. Its sort of like big government; folks think that works better. Like the EIA for instance. Phftttttttt.
Your exactly right, except for the thirty days. It is thirty days for currently producing wells, but an additional 30 for new. That’s why I use second month. Per the law, there is slightly more than sixty days on new production, but nobody pushes the nickel. September of 2017 was the exception due to the hurricane, but the addition in the third month was nominal.
For the amount of activity RRC works with, it does a great job. EIA would not spend the effort, and everyone else’s effort on the 914, if they had one person with a $10 budget for pulling info. And I doubt the RRC would even charge the Fed $10. They would do it for free, if EIA would quit bad mouthing them. NDIC doesn’t have to keep up with almost a half million oil and gas wells. Significant difference.
There is very little kudos due me over the effort. It takes $10, and about one hour of work to get there each month. Ok, sometimes I spend as much as two hours a month. Any problems I have are delt with swiftly and courteously by the RRC. Besides, you are the one who pointed me toward the pending data file, or rather your discussion with Dennis did.?
http://webapps2.rrc.texas.gov/EWA/ewaPdqMain.do
Current Production Data Query can be found at link above. Guym uses “second month” data which I think means PDQ from the second most recently reported month plus pending file data.
Eventually the PDQ becomes quite accurate, pending file seems pretty tricky to me, maybe second month is accurate or most recent month, earlier months have many leases which are reported in both the PDQ and the pending file, sorting out the double reporting is a big task for 300,000 to 400,000 wells, too much work for me.
For an individual lease owner, it is simple, just look up your individual lease number and the data is there, for every barrel as both Mike and Guy have said.
It is trying to get an accurate total for all barrels produced in Texas in a given month that is difficult.
Perhaps Guym has nailed it, not sure how we know until the data has settled down in the PDQ after 24 months. Guym’s first estimate was from Nov 2017, in Jan 2020 the PDQ data for Nov 2017 will be 24 months before the most recent data point of Nov 2019 and we can see how close his estimate is to what the RRC reports.
http://peakoilbarrel.com/estimating-texas-production-bridging-the-gap/
Seems Nov 2017 estimate was about 3912 kb/d or 117,360,000 barrels, report below
http://www.rrc.state.tx.us/oil-gas/research-and-statistics/production-data/texas-monthly-oil-gas-production/
has Nov 2017 output at 113,750,810 barrels. At the bottom of that page there is the following:
* Preliminary Crude Oil & Gas Well Gas Monthly Production Total – Significant changes to the preliminary production figures will occur in decreasing amounts for approximately six to eight months due to the filing of corrected and late reports by industry. Commission staff anticipates that the production totals following that period are substantially complete, although continued minor changes occur thereafter. There is no point beyond which an operator may not file corrected production reports.
Historical production information is available on the Commission’s website through the Production Data Query System
I have taken my data from the Production Data Query System (which I abbreviate by PDQ).
Despite the claim that the data is “substantially complete” after 6 to 8 months, it takes about 18 months before the PDQ system reaches 99% of final reported output. If 97% is “substantially complete”, then the claim is correct.
Interestingly, if we take the RRC estimate for Nov 2017 and divide by 97%, we get vey close to GuyM’s reported output for Nov 2017 (which is very close to the EIA estimate).
I know all the data is somewhere in the RRC database, but figuring out the total is a challenge.
Ok, I see in the reply above, which I can’t post to, that Dennis means production data query for PDQ. Not sure why you would use that, except for current production, as there are years of production in the Texas Monthly Production pdf in research and statistics that is updated each month, after the end of the month. But, that is an accurate comparison, sorry Dennis, I misunderstood what you said. At the same time, I realize why RRC does it the way they do. Mike is right, almost all need that immediate gratification of knowing what production is NOW. So, the EIA weekly is the standard. A very poor one, but it’s fairly immediate. I’ve never trusted EIA to provide me estimates of anything. That’s why I am doing what I am doing. I could get it refined to the point that it proves RRC has all of the data, and are reporting it as quickly as possible, and it wouldn’t be accepted by hardly anyone, because they don’t want to wait two months. I could charge a dollar for the service, and I would have to use my personal debit card for a pack of chewing gum with the profits from the effort. It will prove out with a couple of years of effort, but it’s a real esoteric effort. I will be able to look at EIA’s monthly production figure for Texas, and be able to say: “hey, that’s x amount over or under actual”. That is mostly important to me. No one else will care.
Kudos to Dean for his mathematical estimates. If he combined that with what I am doing, he would be very very close to estimating it as soon as RRC posted their first month production numbers. The second month is actual, or very close to it, the most immediate month I have to estimate using crude estimates. Currently, I use the change between the previous months reported production, and the most recent. I am sure he could do a much better job of that.
Guym,
Can you explain again what you mean by second month? Is it the sum of the statewide Production Data Query for the month before the most recently reported month, plus the pending lease data for that month?
Also could you list the reported data for Texas C+C (your second month reported data) for Nov 2017 to the most recent second month data (August 2018, I think).
Thanks.
Fossil Fuel subsidies increased in 2017
https://www.iea.org/newsroom/news/2018/october/hard-earned-reforms-to-fossil-fuel-subsidies-are-coming-under-threat.html
The $300 to $400 in subsidies would go a long way in preventing climate change if it all went into home insulation, solar hot water and wind energy.
Climate change is not important.
When the day arrives that food is getting scarce because oil is, there will be not a single word demanding that the oil not fuel up tractors and trucks and cars that haul food because of climate change. Not a single word, even from the climate change people.
But it doesn’t make sense to provide subsidies to piss away oil. If we are concerned about food, then we should be finding ways to increase efficiencies to stretch out what we have.
Stating the obvious there, Watcher. Food above all else.
That is why soil is the primary concern for life on the planet.
Oh, and water.
JODI Data has just released their September statistics, an update for Saudi Arabia
Saudi Arabia Inventories (crude oil + total products)(million barrels)
Down -1.6 to 310.9 in September from August
Down -21.7 from December 2017
Down -3 million every month since the high in October 2015 (-100 kb/day)
Chart: https://pbs.twimg.com/media/DsYA7xDXoAAOLbj.jpg
Saudi Arabia Domestic Demand (crude oil + total products)(1000 barrels per day)
Down -487 in September from Sept 2017
Down -390 in September from Sept Average Year
Down -236 in the first nine months of 2018 compared to same period in 2017
Chart: https://pbs.twimg.com/media/DsYBMybX4AEkDK0.jpg
Saudi Arabia net exports and C+C Production
Chart: https://pbs.twimg.com/media/DsYBbvxXcAAzNaY.jpg
Oil and gas related but also falls under the banner of other peoples money.
https://www.zerohedge.com/news/2018-11-18/optionsellerscom-goes-dark-after-catastrophic-loss-event-natgas-short-squeeze
Came across the following
https://www.reuters.com/article/us-usa-oil-shale/u-s-shale-surge-boosts-industry-finances-puts-deals-in-spotlight-idUSKCN1NK2OT
U.S. shale firms are more profitable than ever after a strong third quarter, according to a Reuters analysis of results for 32 independent producers. These companies are producing more efficiently, generating more cash flow and consolidating in a wave of mergers, the data show.
Results at 32 independent shale explorers show nearly a third generated more cash from operations than they spent on drilling and shareholder payouts, a group including Devon Energy, EOG Resources and Continental Resources. A year ago, there were just three companies on that list.
The group’s cash flow deficit has narrowed to $945 million as U.S. benchmark crude hit $70 a barrel and production soared. The group overspent by three times as much as recently as June and was $4.92 billion in the hole a year ago, according to Reuters’ analysis of Morningstar data provided by the Institute for Energy Economics and Financial Analysis.
Please look exactly how many “independent shale producers” there are on shaleprofile.com; 32 is a drop in the bucket. Only 10 out of the chosen 32 generated more cash flow than they spent. Whoop. The groups cash flow deficit NARROWED to a little south of $1 billion… because of $70 oil. Its now $56 in the EF, $47 in the Permian and about $39 in the Bakken. As recently as 3 months ago the group was spending 3 times more than this quarter, so the year is not going to look near as peachy as the quarter. This time last year the group was losing $4.92B, it only lost a B this quarter. Losses were less than expected, in another words. All this fantastic news with low D&C costs (service companies taking the hickey), low interest rates, a relaxation of regulations, much higher prices thanks to OPEC & Russia’s help and the highest well productivity in the history of the shale biz.
If this is the A-Team, how is the shale oil industry EVER going to pay off $300B of long term debt?
“How are they going to pay $300 plus billion of debt off doing that?”
The money will never get paid. How can it?
Sounds like the governments (federal and state) will have to step in and take over oil drilling and production for a while. That will mean the workers and management will get rehired as government employees to slowly bring down the shale oil boom without crashing the economy. Gas and oil needs to keep running another decade or so.
The federal government is used to running at a loss.
Mike,
If oil prices are low they won’t, if prices follow AEO reference case, they will.
Future price unknown. Things are less bad than a year ago. Some believe there will be lower oil supply, if correct prices will likely rise.
Mike,
Yes there are a lot of producers in the LTO sector, I imagine the analysis chose the largest 30 LTO focused oil companies, but as a group they might only cover about 20 to 30% of output.
How is this good news? Two thirds are still losing money even with higher prices.
At least gas should be cheap for the Holiday weekend. Maybe I’ll through the bike on the SUV and head over to Moab for a little ride. All it takes is a barrel or two of refined product. If I wear a Patagonia fleece and ignore the hypocrisy can I still consider myself an environmentalist?
Boomer II,
They are losing less money than before with the higher prices, so heading in the correct direction. With lower prices, they will likely go in the other direction. Prices were only high for a relatively short period of time.
Losing less money is still losing money. And as the losses pile up, they find themselves in a bigger hole. So they need not only enough money not to lose money right now, but also to cover those increasing losses.
I can’t see how anything other than no losses, plus significant income to pay back debts, will be sufficient. And if they deplete supplies at a low price, what will they sell at a high price?
It’s like that saying:
“We’re losing money on every sale, but we make it up on volume.”
Boomer II,
Have you ever heard of a little company called Amazon? They had losses for many years. If prices remain low, LTO producers will fail, but it is highly unlikely that oil prices will remain low. If the AEO reference case is followed, they will be profitable and be able to pay down all debt. The EIA’s AEO 2018 reference case for Brent oil prices in 2017$ is very conservative (see chart below). The Permian basin LTO producers would have all debt paid to zero by 2028 if oil prides are at least as high as this scenario. By 2040 cumulative net revenue is about 300 billion in 2017$.
Amazon didn’t have a depleting product.
LTO companies don’t have the same business model. Their supplies go down over time, so their window to make money on their investments is shorter.
Amazon was able to convince investors to wait it out, but LTO companies probably won’t be able to. And besides, why invest in LTO companies if you can invest in future Amazons? Some investors look for rapid growth. LTO companies can never equal the growth that Amazon was able to deliver.
Boomer 2,
I think you are right. There are those that believe LTO producers will continue to increase output, if they are correct and oil prices follow the EIA’s AEO 2018 oil price scenario, then for some plays such as the Permian basin, the producers as a group will be able to pay off debt and cumulative net revenue reaches 300 billion by 2040 (output in the play peaks in 2024 in this scenario) total URR is about 31 Gb.
If oil prices match the average of the AEO 2018 low oil price case and the reference case, then the Permian basin, does not manage to pay off its debt and never becomes profitable.
I do not know what future oil prices will be, but the AEO reference case has Brent (in 2017$) reaching $80/b in 2022 and $90/b in 2028, the scenario is pretty conservative. My expectation is that oil prices will be at least this high.
Where we differ is that I’m not confident they will pay down debt even if the money is there. I don’t think the LTO model is built on corporate sustainability or longevity for many companies.
Boomer II,
I cannot predict what companies will do, but the fact is there will be enough cash flow to pay the debt, if the AEO reference case for oil prices is correct and the real cost of wells (adjusted for inflation) remains constant.
Boomer- “Where we differ is that I’m not confident they will pay down debt even if the money is there. I don’t think the LTO model is built on corporate sustainability or longevity for many companies.”
The majority of the companies may choose Trumps business model- bankruptcy after moving as much assets as possible to other holdings.
Some of the remaining companies will get assets for cheap.
Hickory,
As I have pointed out, the debt gets fully paid off in roughly 2027, after that there is 300 billion dollars of cumulative revenue that the bankrupt companies leave for others, so yes the smart companies will pick up assets on the cheap from those companies that choose the Trump business method. 🙂
Crude oil production for October, the countries that report their numbers first. (m/m change in kb/day)
Russia +44
OPEC15 +128
China +96
Norway +199 (back from maintenance)
Total +467 kb/day
Up +1417 kb/day over the last 5 months from the low in May. May marked the end of the OPEC+ agreement.
Chart https://pbs.twimg.com/media/DsbwkNAWwAA5pOC.jpg
Colombia crude oil production, +10 kb/day m/m to 879 in October
https://pbs.twimg.com/media/Dsbxq0ZXgAA5HDQ.jpg
Azerbaijan crude oil production, -13 kb/day m/m to 783 in October
https://pbs.twimg.com/media/Dsby9CsWkAA8WQC.jpg
China crude oil production to October
https://pbs.twimg.com/media/Dsb1ZACX4AEKrqY.jpg
https://www.reuters.com/article/us-husky-energy-leak/husky-assesses-damage-after-oil-spill-curbs-canadian-offshore-production-idUSKCN1NO2J0
HUSKY ASSESSES DAMAGE AFTER OIL SPILL CURBS CANADIAN OFFSHORE PRODUCTION
A leaking flowline from Husky’s White Rose Field to the SeaRose storage vessel was detected on Friday, when Husky was restarting production after suspending operations a day earlier due to stormy weather.
…
The spill involved 250 cubic meters (1,572 barrels) of oil, Husky spokeswoman Colleen McConnell said on Monday. She said the company is monitoring the area for oil sheens and any impact on wildlife.
The leak forced Husky’s White Rose to shut down, along with all other producing oil projects in the area until the regulator, Canada-Newfoundland & Labrador Offshore Petroleum Board, determines it is safe to resume, the board said in a statement on Sunday.
…
There were no injuries to oil workers during the storm, one of the worst in decades …
I’m not sure if the other platforms would be shut in because of an accident elsewhere, but they were definitely shut in for the storm. One of the big oil industry accidents was the loss of the Ocean Ranger rig during a major storm offshore Newfoundland in the 80s.
If I remember correctly that was due to an unsecured porthole in the control room.
How ’bout them oil prices huh?
https://www.chron.com/business/energy/article/Energy-companies-lose-1-trillion-in-value-as-13404799.php
Time to borrow some cash and increase the dividend!
Oil price is dumping again – now at 55$.
How deep has it to go this downturn until LTO starts to decline – especially this time when junk bonds are harder to sell than 2 years ago.
Shale companies are hamsters on a wheel, they need the money so how much will they really cut production with all that outstanding debt. Hard to believe we have gone from $76 WTI to $54 in 6 weeks time.
(pssst maybe supply and demand is not relevant)
In the short term they are not very relevant. Prices move in part on expectations of future supply and demand. Most expected US would follow through on the announced sanctions on Iran, that expectation drove oil prices up. In fact, the Trump administration did not follow through, it kicked the can down the road (delaying sanctions for 6 months), so we went from an expected 1 Mb/d drop on supply to no drop in supply essentially overnight. The shift in expectations of future oil exports from Iran caused oil prices to fall. Not really hard to understand. Just difficult to predict in advance.
A year ago, almost to the day, prices for WTI surged above $55 for the first time since 2015. There was a lot of reporting about companies buying hedges to lock in those juicy prices at which they would definitely always make a profit.
I don’t know exactly how those hedges work, but if entities have instruments that “protect” them from falling prices by guaranteeing they can sell oil at $55, then it may work the opposite as well, “forcing” them to sell at $55 even if prices have risen. Just imagine these ma-and-pa shale companies as the Puerto Ricos of the energy industry.
Western Canadian Select was down to $14 a barrel a few days ago.
At this speed it should be zero soon.
The big question here is: Is this spike down already big enough to reduce investment of big oil or the OPEC states – or is everyone still on full throttle speed.
Good point! Maybe they will have to pay to get rid of it! Oh, I guess they are doing that now since it costs more to produce it.
If you have to have it, and you DO have to have it, printed pieces of paper don’t really matter in association with it.
the artificial financial system around oil/world has been managed well and is clearly resilient, but even it will have limits.
the whipsaw of “No Iranian Exports in 6 months” to “Waivers for Everyone” at a time when a zillion other things are happening, has created a destabilizing wobble/vibration that does look extremely menacing from where I’m sitting.
There’s been quite a few reports stating that the IOCs were going to use the higher 3Q profits for buybacks, dividends and M&A, not for investment, and I think that has been shown by no noticeable uptick in exploration or FID rates. Partly it may be that there are few attractive projects left in the backlog and no recent major discoveries, but also why would anybody make long term decisions when a fuckwit like Trump and psychos like Putin and MbS are making totally self-serving decisions (i.e. personally beneficial not for the good of their citizens) that control almost all of marginal supply and demand in the next year and maybe longer. LTO is a bit different as they need continuous investment to keep production up for the next month and so satisfy the share and bond holders, or at least keep pushing out the day of reckoning.
It can be argued that low oil prices can slow the need for higher interest rates. Interest rates have to move up at some point due to inflation fears (interest rate parity to inflation and to have a weapon when a recession hits). And therefore postpone and also set up for a softer landing for the economy and a milder inevitable recession. But at the same time peak oil (final or if wrong the top point for at least 5 years) is going to be brutal and the economy will not recover like in 2009-10.
I think the IOCs see the future and are pulling the money out as fast as they can without triggering a panic which would make it harder to cash in what’s left of their companies.
The LTO companies don’t appear to have a future plan and will just keep going until OPM runs out.
If by the IOCs you mean their shareholders then I’d agree, but the companies’ boards might have a different view.
I was thinking of the senior execs. When buybacks and dividends look better than investing in the future, that suggests to me that cashing out now is their plan.
Why didn’t those share buybacks elevate the stock price?
Buybacks tend to be scheduled in advance through the year, not opportunistically depending on share price. I guess it’s to do with capital allocation and general planning but it is also much to the advantage of executives who often sell their share options into buybacks – it’s a question how close this is to insider trading. In the short term they are neutral, in the long term they reduce total dividend payouts and improve income per share metrics so should support the price, but a company with extensive buyback programmes is likely not in its early, big growth phase (most oil companies main assets, their oil reserves, are declining and eventually they will be gone along with he company itself and any share value whether artificially supported or not). Throughout the markets, not just for oil, buybacks are probably the biggest factor supporting share prices through the recent run up, not real value, and that could only happen to the degree it has with near zero interest rates.
We may need to stop thinking of the oil/energy industry as a single entity – Just like E&P vs refining. The gear speeds with which LTO and BigOil/IOCs run are so different, and they have not found the ratio at which they can be combined. The engine is sputtering, and then flooded, and it will probably be like that until collapse. It certainly won’t be easy to have all these actors coordinate their actions like some sort of singular entity.
#Canada: Canadian Oil Sands Cos. Shut ~160k b/d Amid Low Prices: TD Volume of shut-in production could rise to 300k b/d should current differential remain
First reaction to the price diving.
Yeah, if they increase Permian, discounts can reach $17 again, and they will be getting $38 a barrel.Should have a nice quarter?
11.8 million bpd for the US in 2019 GuyM….if you click those heels fast enough the EIA believes it could become reality soon enough! The legacy production drops per month have got to be huge, could be 2015-16 all over again.
Yeah, that’s what they say the average will be. It will rock along at 11.1, give or take 100k, until the new pipelines open up the last quarter. By summer, reality will settle in, and prices will rise substantially. The last half of the year will be difficult to predict. But, if demand doesn’t go negative, I can’t see production ever keeping up with demand, again, for a very long time. I’d say never, but that is too absolute.
GuyM,
What is your expectation for the price of WTI (12 month average) for 2019? Mine is $70/b+/-10, with Brent about $10/b higher.
It’s going to be “volatile”?
Yes it will. So 0 to 1000/b? 🙂
Pretty much?
Hmm,
I guess I’d say monthly average prices for WTI will be in the $30/b to $165/b range over the next 36 months. If we assume a maximum entropy probability distribution with a mean of $90/b where we use lambda=70 and assume zero probability that the monthly WTI oil price falls to less than $20/b. That distribution has a mean price of $90/b with a 63% probability that prices will be less than 90 and more than 19.99/b and a 50% probability that the price will be in the 30 to 90/b range and a 37% probability the price will be between $69 and $163/b and a 37% probability the price will fall in the range of 30 to 69 dollars per barrel. Median price is $69/b, mean price is $90/b. A 50% probability price will be from $40/b to $117/b, with 25% probability prices range from $40 to $69/b and a 25% probability prices will be 69 to 117 per barrel. Also 25% probability oil price will be 20 to 40 per barrel and a 25% probability prices will be above $117/b.
CP, oil price($/b)
0%, 20
13%, 30
25%, 40
50%, 69
63%, 90
75%, 117
87%, 163
92%, 200
CP=cumulative probability
India crude oil imports for October (1000 barrels per day)
Up +589 m/m to 4,951
Up +470 compared to October 2017
First 10 months of 2018 are up +296 from the same period in 2017
Chart https://pbs.twimg.com/media/DsdjMQnXcAActQJ.jpg
India refinery Crude Processing for October (1000 barrels per day)
Up +79 m/m to 5153
Down -53 compared to October 2017
The first 10 months of 2018 are up +202 from the same period in 2017
Chart https://pbs.twimg.com/media/DsdqGInX4AA9_9s.jpg
India oil production about 860K bpd. Last year’s consumption was 4.69 mbpd. So they imported 3.9 mbpd last year.
With imports up 300K bpd from last year, that looks like (0.3 / 3.9 = ) 7.7% import increase.
India domestic oil production had a small uptick last year after a small downtick the year before, so call it flat and that means consumption increase will be just about equal to that same 7.7% increase.
It is quite difficult to focus on the global fundamental development of oil supply and demand in times like these, when we have these wild swings in oil prices based on marginal surplus/deficit of oil in the market place and other forms of manipulation on national level that almost confuse everyone. The peak oil story is soon forgotten in all the turmoil, but I guess before not too long more important than ever because of all the havoc caused to oil producers and service companies through too low and volatile oil prices over a long period of time.
Well Dennis, we are now below the $55-65 WTI range after being above it for several months.
Shallow sand,
I am more focused on the World Oil market and thus the best proxy for the World Oil Price is Brent. The most recent weekly spot price for Brent was about $70/b down from a recent weekly peak of $83/b. If OPEC and Russia announce a cut on Dec 6, oil prices may increase.
The expectation of Iranian sanctions drove up oil prices and the waivers drove them back down, some analysts claim prices have reached a bottom, I expect eventually oil prices will rise, date unknown. Wow Brent futures at $62/b, down almost 7%.
Chart for WTI Futures contract 1, data from link below
https://www.eia.gov/dnav/pet/hist/LeafHandler.ashx?n=PET&s=RCLC1&f=W
53 week centered average and weekly average data, last data point in data set is Nov 9, 2018, but stopped at last 53 week average point for May 4, 2018.
The oil industry seems like it is at a tipping point, it wobbles with small changes.
Gone fishing,
Perhaps, there is likely to be quite a bit of volatility going forward, a mercurial executive in the White House is not a recipe for stability.
mercurial ~mercury= mad hatter disease —> A++++ job
thx
WTI Oct 3, 2018 $76.40
WTI Nov 1, 2018 $63.67 Down 17ish%
Nov 2 . . . sanctions waivers announced. One guesses the HFT engine on oil can predict the future 1 month
tra la tra la (btw Nov 2 was a Friday — the price at the close Nov 5 (Monday) was unchanged from Friday.
WTI not really affected by Iranian sanctions, that’s in part pipeline issues in the US. Brent is the relevant price. Of course there is more to the story than just the sanction waivers, Saudi Arabia and Russia were also ramping up output along with the US in anticipation of the sanctions and international tariffs were thought to potentially lead to an economic slowdown in Asia, all of these factors impact expectations of future supply and demand which is what the futures market is based on.
In the short term, the oil market is moved by political news over the longer term actual production and actual consumption of oil will determine the long term market price of oil (say the 12 month moving average).
Brent dropped $10/b since Nov 1, the sentiment in the market shifted in early Oct as the rise in prices was over done relative to the supply and demand in the oil market, many may have anticipated the sanction waivers as Trump tried to talk down the price of oil.
Dennis.
I disagree with you that the Iranian sanction waivers affect Brent but not WTI.
Compare the WTI and Brent charts. Moving in lockstep.
Interesting that Trump continues to call for oil prices to go even lower. Last time oil fell hard, so did the US stock markets (early 2016). I guess Trump doesn’t understand how many jobs in US are tied to the price of oil, and that sub $55 WTI isn’t helpful in that regard.
This isn’t 2005.
Shallow sand,
Not what I meant to say, just that I focus on the Brent price rather than WTI, the spread between Brent and WTI varies quite a bit, that was what I intended to say, so Brent and WTI don’t always move in lockstep (though in this case they did, I agree.)
I always have to laugh when Trump claims he is smarter than everyone else, when my children were 12, they knew 10 times more than he does.
I agree that low oil prices are a bad idea, at one point I think you hoped for $55 to $65/b, unfortunately in the 97 weeks since the end of 2016 only 20 weeks have been in that range, with 33 weeks above and 44 weeks below.
What a difference in a month!. I recall back in Oct POB posters thought Oil would be near $100/bbl by next year.
Looks like to me a lot of global economic weakness. Most Major nations are facing falling housing prices (Canada, US, Australia, China, etc). With the Fed Tightning and the US tariffs its putting a big hold on the credit markets. Without credit expansion the whole global economy implodes.
FYI: sometime between 2023 & 2024 US goes full insolvent a Outlays for just Entitlements, Welfare & Interest payments exceed all Revenue collected. Look for a not so distant future with a world filled to the brim with very unhappy campers.
Er, falling house prices???? Sales are falling, yes. Because of rates, and rising house prices. In the US, anyway. I haven’t looked elsewhere.
Techguy,
My expectation was 75 to 95 for Brent in 2017$, with a best guess of $85/b for 2019. This would be a 12 month average price. No doubt that my guess will be incorrect, I am consistently wrong about future oil prices.
Brent and WTI have a direct correlation, as Shallow points out; its a world oil market. I don’t understand the need to predict oil prices in 2017 dollars; that’s confusing and irrelevant. If you’ll take notice, few actually IN the oil business try to predict long term oil prices; its fruitless. The EIA, nor the IEA, nor the DOE nor the NCAA can predict oil prices either. The last five weeks of madness has had very little to do with supply and demand fundamentals, for instance. Trump was only part of that madness. As was China, the reporter that got hacked to death and Putin having the flu.
Its easy to say prices will go up someday, so what? They’ll go down again someday as well.
https://www.oilystuffblog.com/single-post/2018/11/20/Cartoon-Of-the-Week
Happy Thanksgiving, y’all.
Hi Mike,
Using real dollars accounts for inflation, it is the way economists think. If one does an economic analysis (or a business analysis) one has to assume some price level. I attempt to do economic analyses, so some price level must be assumed. Pretty easy to adjust the analysis and add in an unknown future rate of inflation to the already unknown future price level, but I try to reduce the number of unknowns to less than infinity. 🙂
Yes Brent and WTI often move in lock step, except when they do not.
See
https://www.bloomberg.com/news/articles/2018-10-01/citi-warns-looming-glut-will-push-u-s-oil-discount-to-2013-lows
I agree the price movement in the short term futures market is based on changing expectations of future production and consumption of oil rather than current levels of production and consumption of oil.
Short term oil prices are very volatile and it is not a good thing for the oil industry, I have said this before and I will repeat, I do not know the future price of oil, I have never made such a claim.
My economic analyses make several different assumptions about future oil prices, to attempt to “bracket” the future price of oil and consider what a “rational” oil industry (one that tries to maximize profits) might choose for output levels if the oil price actually followed a given oil price scenario.
I imagine when you plan your business one year ahead you have to make some assumption about future oil prices, I do the same, but just carry the analysis forward by several years.
The long term trend in oil prices has been higher at about $3/ year on average from 1997 to the present (nominal WTI prices), that trend is likely to continue with prices returning to the trend line (roughly around 80 to 100 per barrel) by the end of 2020, the trend hits $100/b in 2023, with volatility it might be anywhere from $70/b to $130/b, impossible to guess any closer.
Thanks Mike. And a happy Thanksgiving to you and yours.
Japanese weekly inventories & weekly change (million barrels)(PAJ)
Crude Oil: 77.2 -5.35
Total Distillates: 73.1 +2.64
Total (Crude + Products): 150.3 -2.71
Chart https://pbs.twimg.com/media/DshBs81XcAAFwAX.jpg
Total https://pbs.twimg.com/media/DshGHC6WkAEg_wb.jpg
Inventories usually peak around now, monthly seasonal chart
https://pbs.twimg.com/media/DshVqPqX4AAr7mh.jpg
Saudi exports to the USA are said to be down according to tanker tracking but still their oil production is said to be higher, at least at the start of November, I’m wondering if this oil was ordered before the waivers were announced???
2018-11-21 (Bloomberg) Saudi Arabia oil production said to surge to record in early November
Crude output has run at 10.8 to 10.9 million b/d
Supply passed 11 million b/d some days including draw down from stocks
Output may decline in the 2nd half of November, lowering the monthly average
2018-11-21 DJ Trump Twitter – Oil prices getting lower. Great! Like a big Tax Cut for America and the World. Enjoy! $54, was just $82. Thank you to Saudi Arabia, but let’s go lower!
https://twitter.com/realDonaldTrump
Brent chart with prior tweets
https://pbs.twimg.com/media/DsWyIwFXQAA11Wc.jpg
An oil price chart that shows the date of Khashoggi’s murder
https://pbs.twimg.com/media/DsiOaiaXgAA8iD5.jpg
Goldman sucks predicts a decrease in demand, largely due to the effect of tax cuts wearing out by 2019. While this may be true on the corporate end, a substantial amount of those tax cuts were to individuals. I am in the business, and most people are unaware, yet, of any tax cut. Won’t be until tax time 2019, When there will be a lot more money in their pockets, in general. IRS has been unable to update the W4, so most are still withholding at the old rate. The big question still remains on how much of this additional will be spent?
U.S. Petroleum Balance Sheet
EIA pdf file: http://ir.eia.gov/wpsr/overview.pdf
various chart summaries
Saxo Bank https://pbs.twimg.com/media/DsiXC2gW0AEiEpb.jpg
Oilytics https://pbs.twimg.com/media/DsiYwmGXgAEqWY7.jpg
Chart summary of oil imports by country
https://pbs.twimg.com/media/DsidYeBX4AECowY.jpg
Products https://pbs.twimg.com/media/DsiazAeXgAEoPUr.jpg
Oilytics tweeter link https://twitter.com/OilyticsData
Saudis cut to the US will make a big difference.
Big news day…hate to put this comment in a stale post.
Aramco Abandons Plan For Massive Corporate Bond Sales
https://www.wsj.com/articles/aramco-abandons-plan-for-massive-corporate-bond-sales-to-fund-sabic-deal-1542639560
looking instead to options requiring less public disclosure, people familiar with the matter said.
Interesting that this was announced after the Khashoggi murder.
Energy Losses Prompt Emotional Video to Options Firm Clients
https://www.wsj.com/articles/energy-losses-prompt-emotional-video-to-options-firms-clients-1542709800
On Friday, the founder of OptionSellers.com, James Cordier, apologized in an emotional video to clients that losses from bad bets on energy prices would likely lead to the demise of his firm.
From reading the article, it looks to me like this firm was heavily into oil field hedges.
Deep Division Hinders Canadian Oil Patch In Fight of Its Life
https://www.bloomberg.com/news/articles/2018-11-20/deep-divisions-hinder-canadian-oil-patch-in-fight-of-its-life
Most notable is the split between Canada’s pure producers, who are being devastated by plummeting local prices, and the large, integrated energy companies that have been mostly unscathed. (snip)Companies that focus mostly or solely on production, including Cenovus Energy Inc., Canadian Natural Resources Ltd. and Nexen Energy ULC, favor a mandated cut spread among the country’s producers that would bring supply down below pipeline shipping capacity. They argue that could clear the glut within weeks and bring prices back into a more normal range, helping their income statements as well as government coffers.
But companies who have refineries that are benefiting from the cheaper crude prices — such as Suncor Energy Inc., Imperial Oil Ltd. and Husky Energy Inc. — opposed the push, saying the market is working to clear the glut and that companies have to live with the investment decisions they’ve made.
My thought on this is that the big companies are not “unscathed”. It goes to the reasons that majors are buying up smaller producers in the US Shale fields: to pretend they’re still a viable business. They’re not making it up on the refining end: they’re propping up the stock price.
No idea why the post got stale. Another should have been started when the off topic post appeared last night.
EIA Weekly U.S. Ending Stocks to November 16th
(million barrels) week/week changes
Crude oil (without SPR) +4.85
Light -1.30
Middle -0.71
Heavy +0.59
Total Distillates -1.42
Total (Crude+Distillates) +3.43
SPR down -0.76
Propane & NGPLs -4.19
From the end of December 2017
Crude oil (without SPR) +22.4
Light -7.9
Middle -19.9
Heavy -1.9
Total Distillates -29.7
Total (Crude+Distillates) -7.3
3 charts
Total (Crude+Distillates): https://pbs.twimg.com/media/DsjYV5mWwAA208Q.jpg
Crude Oil & Total Distillates: https://pbs.twimg.com/media/DsjZnNAW0AE29XY.jpg
Light & Middle: https://pbs.twimg.com/media/DsjZywVX4AAc1fz.jpg
Including SPR crude plus other inventory is down by 22.8 compared to this time last year. A 1.1% decrease. Not substantial, but surely should not affect prices negatively.
Some international inventories week/week changes (million barrels)
Total (Crude + Products): +5.02
Chart https://pbs.twimg.com/media/DsolbLfX4AAx8WH.jpg
Total Distillates: +5.52
Chart https://pbs.twimg.com/media/DsoktLnXQAEDE5y.jpg
Crude Oil: -0.50
Light Distillates: -1.11
Middle Distillates: +2.47
Chart https://pbs.twimg.com/media/DsomVe2WkAMuNfv.jpg
Heavy Distillates: +4.16
SAN RAMON, Calif. – Nov. 21, 2018 – Chevron Corporation today announced that the Chevron-operated Big Foot deepwater project, located in the U.S. Gulf of Mexico, has started crude oil and natural gas production.
The project is designed for a capacity of 75,000 barrels of oil and 25 million cubic feet of natural gas per day.
https://www.chevron.com/stories/chevron-announces-first-oil-from-big-foot-project-in-the-deepwater-gulf-of-mexico
FRED OLSEN ENERGY RISKS BANKRUPTCY WITHOUT REFINANCING SOLUTION
Another offshore driller in trouble.
https://www.offshoreenergytoday.com/fred-olsen-energy-risks-bankruptcy-without-refinancing-solution/
http://www.npd.no/en/news/Production-figures/2018/October-2018/
Norway production up from last month but below last year and below forecast.
Two months with maintenance/technical problems (May, Sep), other than that decline on most fields. No significant pipeline of projects coming online now for approx. 1 year. Decline rate for oil maybe 6%-10% going forward until Johan Sverdrup (nov 2019). It depends on how many outages we will get.
I think Troll is having more trouble than they expected getting the last oil from the oil rim before they start gas blow down there.
More on the ridiculous Permian projection growth. As Bill Thomas of EOG says, production of shale will grow, but slower than projected.
https://www.mrt.com/business/oil/article/PBPA-panelists-say-pipelines-are-just-part-of-13340131.php
As 600 VLCCs is slightly less than all of the VLCCs in the world, it raises the first question. To top that off, VLCCs can’t get to the Texas ports yet, except for the Loop, which can only do a couple a month max. As per their description, we’re only moving the takeaway constraints further south. A lot of noise has been made on expanding ports, but we are still years away. Why the heck are we trying to export it all, when we will need it later. But, apparently, we couldn’t do it if we tried.
Just counting the additional pipelines that are expected to come online by 2020, it would take over 40 VLCCs loading a month to get it out, or a much higher number of smaller vessels. Can’t wrap my head around that. It doesn’t compute. It’s already over 2 million a day, and will have to double by beginning 2020 to handle it. So, even if the pipelines are complete by the end of 2020, it is still not going anywhere.
The constraints against the projected increase by EIA and others continue to mount.
Imagine the reaction when the “public” figures out we will not come anywhere close to the increase, and it’s about 600k bpd under what EIA is trying to feed us, now.
In the meantime, Saudis are moving opec members and others to reduce production by one million, because we will be producing over one million barrels of phantom oil. Should work, if demand goes to negative two million barrels?
You overestimate the interest of the public. The public cares about the price at the pump, which is likely determined by almost anything other than how much flows and how much is burned.
Public was put in quotation marks. Public was meant to be the public that cares about oil, and production. Sorry, it wasn’t clear. The public thinks chocolate milk comes from brown cows. Seriously. Something like 12% of the adult population came up with that in a recent government study.
I guess this thread is still going and is the petroleum thread.
Climate change is making drilling in the Arctic more difficult and therefore more expensive.
https://www.npr.org/2018/11/21/669373081/climate-change-slows-oil-company-plan-to-drill-in-the-arctic
Suncor.
A recent history of dividend increase. They seem to increase in their quarterly distribution of February in recent years, so in three months we’ll see just how serious the oil sands price situation is.
That was going fast.
WTI at 52 now.
Edit: 51 now. It’s even faster than the internet.
Does anybody know whats up there? A hedge fond under a margin call, or other nonsense from the derivate market?
At this speed we’re under 0 next summer. Something has to give soon.
a better question would be – does anyone know what IS NOT up there? Its extremely difficult to find any good economic news, and it seems in the age of QT bad news is actually bad news*.
not that I don’t believe GUYM when he says the inventories are skewed – unless it creates actual shortages – which it won’t – they can lie for eternity about them.
everything is leaning towards tightening – and the feedback loops between deteriorating credit, stocks, and growth are creating minor margin calls (e.g. optionsellers.com) that could turn significant. I.e. low prices lead to lower prices and onward.
*if news gets bad enough its likely the Fed will either not raise rates or signal a one-and-done. and that could ease tensions – or have the exact opposite effect.
I don’t think they are lying about inventories, just the production is over estimated. Ron’s comment below is probably true. I’m at the point where I take EIA, opec, and IEA information on supply/demand with less than a grain of salt. After months, supply is measurable to some extent. Current demand, or future demand is really not one of those things that can be measured worth a durn. I have been following IEA projections about demand, and they can’t be anywhere close. If we look at past production, and can see measurable increases or decreases in inventory, we could get to demand, somewhat in a distant rear view mirror. Otherwise, listening to any wags on demand from these institutions is really a waste of time.
On another note, I feel US production for 2019 will be fairly flat most of the year. Even if they unleash the Permian before year end, it will find more constraints as it tries to get out the door. Discounts on MEH may hit a high. Canada won’t pick up, and we are still a couple of years before Brazil increases. If SA and the rest cut back on production, I see more probability that 2018 will be peak. But, that’s a constantly changing situation.
Does anybody know whats up there?
There is simply a glut of oil right now. Demand is falling at the same time production is at an all time high. What is happening is nothing out of the ordinary.
Next month production will start to fall and prices will start to rise again. It’s simply a case of supply and demand.
Trump wants to destroy the US upstream oil industry and US farmers.
Someone give me proof otherwise?
China tariffs have not only hurt US agriculture, but have hurt US oil producers, as over 1/2 million BOPD is no longer being imported by China.
Trump wants oil prices in the $30s, which clearly is not high enough for US shale.
He is stabbing rural America in the back.
BTW, I note the stock market is also tanking as he continues his oil producer bashing and China trade war.
Perhaps Trump believes the PDFs of the oil companies being able to earn money at 30$ with LTO?
Lol.
Wonder what Trump booster Harold Hamm thinks of Trump’s bloviating about oil.
CLR stock was $68 in early October. This morning it is $44 and tanking.
CLR has never approached its 2014 highs. Neither have most of the shale stocks.
If you own mutual funds in your 401(k) you own an indirect interest in US shale.
Donald Trump wants to destroy your investment, based on his recent comments that $54 WTI is too high.
Edit: Helima Croft just said the same thing today about Harold Hamm re Trump on CNBC.
Yes, THAT is a good point and one I find very ironic. Breakeven prices are a cleaver, useful tool of the shale oil industry. Accordingly, they are doctored, altered, tweaked, lied about and otherwise diluted greatly by the BOE metric. The shale oil industry uses breakeven to infer success, profitability and sustainability.
Its also now another way the shale oil industry is shooting itself in the foot, or other foot, or now maybe its shooting itself in the knees. This administration, like all US administrations knows nothing about oil and gas. It hears the shale oil industry say its doing OK at $30 (PXD is good down to $20!)…so it wants to drive the price of oil down lower. It won’t hurt the shale oil industry; its still making money.
Shale oil in the US has sucked all the air off the oil planet; its all anybody can think about. It represents only 55% of America’s domestic production and less that 7% of world production. Its become the #mefirst in the oil world.
And that is precisely why in a few decades we will look back on this pile of shaleshit and realize that in the long run, for how poorly it was all managed, it was actually not good for America at all.
Mike, at least maybe Halcon will go bankrupt again.
That way Ralph can pay himself another big bonus.
Edit: I meant Floyd. My bad.
Perhaps, Shallow, you mean, Floyd.
There is nothing “ordinary” about oil prices falling 35% in 6 weeks, excess supply or not. Net back prices in the Bakken are now likely below $30. It will be interesting to watch the mighty US shale oil industry whine like little girls again about OPEC trying to drive it out of business with low oil prices, particularly since its their best friend Trump doing the driving.
Mike. Yes, you are correct.
Floyd Wilson paid himself a retention bonus when HK went BK in 2016.
I am afraid he might get to do that again.
Of course he believes it, everyone does by now. They want to believe it. It’s not profitable at this price, much less $30 or $40.
The Saudis are bleeding more than 200 million $ a day – they didn’t hat a black 0 at 80$ for their state.
Looks like Trump has them in this hand to continue pumping.
Additional I think there are many Wall Street jugglers with margin calls – it’s going much too fast to be only demand/supply.
“The Saudis are bleeding more than 200 million $ a day, Looks like Trump has them in this hand to continue pumping.”
Eulenspiegel,
You are not seeing clearly. You are trying to make some logical explanation for madness. Your mind is craving to find a logic in madness. That only means that you don’t understand what madness is.
There is only a difference of proportion of madness between average politician (or any human) and mad politician (or any human) but the QUALITY of madness is the same. Saudis are bleeding X amount of $, Americans are bleeding Y amount of $, Russians are bleeding Z amount of $, Canadians are bleeding Q amount of $ and so on. Difference in an amount of bleeding of $ is proportional to level of madness. But everyone is mad.
I still think the free fall has to do with OPEC trying to justify a production cut in december. If helping Trump was the purpose it is way overdone by now, and if prices go lower it doesn’t help anybody (as Khalid cleverly stated himself). At the same time dealing a blow to shale oil is what they want – I suspect they “hate” how they operate.
Today’s Wall Street Journal says fracking companies are not happy with Trump’s push for lower prices.
———
“The American oil and gas producer has shown that our economy doesn’t have to rely as much on foreign sources of oil anymore, but the country needs to realize that higher prices are a part of that equation,” said Kirk Edwards, president of MacLondon Energy, an independent producer in West Texas. “We need a $60 or $70 crude price in order for the business to stay healthy.”
Few industry participants were willing to discuss the presi-dent’s remarks publicly, but people at several of the largest U.S. shale producers privately expressed unhappiness. One such executive said Mr. Trump’s tweet Wednesday had frustrated company leaders. …
Shale producers largely accept the president’s earlier advocacy, intended to prevent damaging spikes in crude prices, but they are very concerned about his recent remarks, said Robert McNally, president of Rapidan Energy Group, an analysis firm that advises oil-and-gas companies on public policy and markets.
“The president is shifting from protecting the ceiling to delivering a tax cut via indefinitely lower oil prices, and this poses a real risk to shale finance and economics,” said Mr. McNally, who has discussed the issue with energy executives. “Memories of February 2016, when prices went below $30 a barrel, are fresh in the shale sector and among investors.”
There are stories around that the CIA has proof that MBS authorized the murder. There is speculation that Trump is holding that over MBS to get him to keep pumping. We will see if Saudi cuts back at the next meeting.
If they don’t cut it will be 2015-17 all over again.
They waited over a year last time, and oil had to hit $26 WTI to convince the Saudis and Russians.
Oil can go to $10 folks. 90%+ of the oil contracts are traded by computer algo.
Some of those algo are directly tied to tweets by Trump. If Trump keeps tweeting lower, it will happen.
There aren’t enough humans trading oil to counteract the algos in the short to medium term.
I wish Ron Patterson was right, but he is pretty far off when it comes to supply and demand being the sole or even primary factor which determines oil prices.
The moves are just too great over the past 12+ years to say it is a supply and demand only story.
I think someone has a great research project on how oil price is determined. Algos is a big factor, morons listening to EIA and bank projections for fundamentals is another. The last would be fighting over that next barrel of oil, when inventories tank. We haven’t gotten there, yet.
I don’t understand why the oil industry in the US takes this lying down. They are like a deer in in the headlights as Trump is about to run them over.
Greenbub.
There is nothing the US oil industry can do.
The Democratic Party wants the US oil industry weak.
Donald Trump wants the US oil industry weak. Donald Trump for all purposes is the Republican Party.
Commodity producers are not valued in the US. The vast majority of the US population is urban. Most give little thought to the health of US commodity producers.
Democrats may not love the oil business due to the environmental impact, but they are fine with high prices. I point to the years above $100.
There are more votes by people who buy gasoline than by those who make gasoline. Why would a President not want to make them happier?
Which, btw, is why high price won’t depress consumption. This is why God gave us subsidies.
Ya might want to examine the change of the definition of urban. They managed to get it down to an area of 10,000 ppl. Used to be 50,000. Urban and urban clusters.
All such things have agenda.
The Democratic Party wants the US oil industry weak.
Now why on earth would the Democratic Party want the oil industry weak? And just who the hell is “The Democratic Party” anyway?
There are approximately 30,700,138 registered Republicans in the U.S, and approximately 43,140,758 registered Democrats.
Now you could poll each of those 43 million Democrats and ask them if they want the US oil industry to be weak. You would probably get a million or so who do and a million or so who don’t and about 40 million who really don’t give a shit.
The moves are just too great over the past 12+ years to say it is a supply and demand only story.
That statement makes no sense whatsoever. Oil always goes down when there is an oil glut and always go up when there is a scarcity of oil. And there was never a case in history when the opposite was the case. Yes, investor sentiment can cause wild “short term” swings in the price of oil. But the long term trend always follows supply and demand. And there are never any exceptions.
I am not a member of any organized political party. I am a Democrat.
Will Rogers
Ron.
The Democratic Party platform is “keep it in the ground.” Don’t try to BS me. The methane rules, if they ever come to pass for existing wells, will destroy the small producer. The administrative burden of those is intended to put small guys out of business.
Same for the elimination of tax breaks for “Big Oil” that Obama proposed, plus his 10% federal severance tax on domestically produced oil that he proposed.
Believe me, I am no R. Ask Mike. We both pretty much feel like we have no one to support.
As for volatility, look at a 40 year chart and show me that oil is no more volatile since 2005.
We just need to divest and be done with it.
The Democratic Party platform is “keep it in the ground.”
Nope: Here is the Democratic Platform and nowhere does it mention “keep it in the ground”. They do, just like this blog, advocate less emissions and more EV vehicles.
THE 2016 DEMOCRATIC PLATFORM
The fact is, many Democrats reject the “keep it in the ground philosophy”. Bold theirs.
Democratic Group Calls for Party to Reject ‘Keep It In the Ground’ Agenda and Embrace Fracking
“… Because Democrats have been so closely aligned with environmentalists for years, many voters do not distinguish between the views of “keep it in the ground” oil and gas prohibitionists, and those of the Democratic Party as a whole. The U.S. shale oil and gas revolution of the past decade has exacerbated this divide.”
“The shale gas revolution has, in fact, been embraced, but often silently, by most Democrats…”
And I don’t bullshit Shallow, I just post the facts. You should know that by now.
As for volatility, look at a 40 year chart and show me that oil is no more volatile since 2005.
What the hell is that supposed to prove. Volitity is a measure of short term swings. Of course there have been periods of high volitity in the past decade or so. Long term trends always follow supply and demand. Short term swings are often very volitle and have little to do with supply and demand.
Shallow, you are no Republican. I am. As to energy/oil policies, no party or administration I can remember in 60 years knows its ass from a mouse hole shuck about oil or natural gas. The last two we’ve had/have are now tied for idiocy. Dems want it left in the ground, for sure. They might not in states that HAVE oil because that would cost them votes. Democrats, just like Republicans, don’t take a dump in the morning unless somebody will vote for them doing so. If allowed Democrats would regulate and tax oil to the point nobody could get it out the ground regardless of need. The worse the economy is the bigger government people need. Point me in the direction of the party who believes there is legal or moral ‘merit’ in suing big integrated oil companies over climate change, as though they actually made the stuff a hundred million years ago. Who opposes offshore drilling like clock work, year after year after year? New York, THE mecca for liberalism in America, won’t allow frac’ing, or pipelines. California, not exactly a hang out for conservatism, won’t allow its offshore resources to be drilled, then whines like little girls when Texas won’t deliver cheap natural gas. The worse oil spill in history occurred in Alaska, from a tanker bound for California.
There is no precedent in a 35% drop in oil prices in six weeks. Ever. We at least saw the 2014-2015 thing coming. Price volatility the past decade is killing the American oil industry, except for shale, who just needs low interest capital to piss off. That volatility has gotten way worse and that is a result of speculators worldwide, not fundamentals or inventories or rig counts or anything else, particularly not supply and demand.
You should know by now Shallow that if you actually know something about the oil business, your spinning your wheels around here. To get along you’ve got to go along. We’ll be likely going the way of TT now.
What I do know for sure is that our small company’s oil check will be $100K+ less than it was just a month ago.
What I do know is that we cannot find anyone young willing to work for us in the oilfield, so the oil price won’t matter before too many years anyway.
I don’t blame the young people for not wanting to work in the upstream oil industry. It is hard work, winter is tough, most Americans don’t like oil companies, half of the Federal government and several state governments are trying to legislate it out of business, even the Right Wing President hates it, and with the oil price being so volatile, it is a month to month question as to when a layoff could occur.
We are operating leases in a field that has been economic for over 100 years and it appears for the third time in a decade we will see prices drop below our operating expenses.
What a crock.
Mike and Shallow Sand,
Many who comment on this blog believe that eventually we will need to find an alternative to oil and natural gas as both will peak and then decline in the future.
In the mean time, I believe it would be best if oil and natural gas prices were much less volatile (and note that nobody disputes that short term oil prices are indeed very volatile) and also believe higher oil prices (maybe $70/b for WTI) would be a very good thing for oil industry health and a gradual transition to alternatives to oil over the next 20 to 30 years.
I use gasoline just like most other people, so without oil producers I and probably most everyone reading this blog would be in a World of hurt.
legal or moral ‘merit’ in suing big integrated oil companies over climate change, as though they actually made the stuff a hundred million years ago.
No one is suing oil companies over climate change. No one.
They’re suing oil companies that LIED about climate change. Companies that knew very well that climate change was a problem, but ran advertising and lobbying campaigns that said the opposite.
In the same way, no one ever sued a tobacco company for growing tobacco, or selling cigarettes. They sued tobacco companies for lying to the public, and smokers, about the risks of smoking.
https://www.nytimes.com/2018/06/25/climate/climate-change-lawsuit-san-francisco-oakland.html
Lying, costs, high tides, trauma from frost bite, emotional stress, whatever; America is full of fragile little cupcakes like yourself, Nick, always needing desperately to blame somebody else for problems, most of which they have created themselves and cannot take responsibility for. The Koch Brothers, for instance, to some can often seem like monsters living under the bed.
Get a night light; that might help.
An Ode to all the “get it all out of the ground” people.
Read this to the kiddies at bedtime.
Humanity’s fossil-fuel use, if unabated, risks taking us, by the middle of the twenty-first century, to values of CO2 not seen since the early Eocene (50 million years ago). If CO2 continues to rise further into the twenty-third century, then the associated large increase in radiative forcing, and how the Earth system would respond, would likely be without geological precedent in the last half a billion years.
https://www.nature.com/articles/ncomms14845
It’s not the good ole days of early life anymore, it’s 50 W/m2 TSI greater radiation to start with. No way that 400 to 800+ ppm CO2 and extra methane will act like it did 50 or more millions years ago. There is already a big hammer in play. So playing more just gets one hit harder and longer.
But what’s an extra watt or two from the sun, another couple from loss of ice and snow and a few more from CO2 and methane? Burn baby burn! We need the money honey!!
Feedbacks anyone? Nature has just started with us.
Mike,
It looks like you’re mostly right in this case – if you look at the text of the court decision, you see that IOC misinformation was a factor in the lawsuit early on, but that’s been mostly dropped.
Still, telling the truth is very important. Despite your comments about sensitivity and “cupcakes” (I thought the fashionable term was “snowflakes”), you seem to be care a great deal about a general lack of respect for the oil industry.
You only get respect if you tell the truth.
Nick, I agree, my industry should do much better at telling the truth, but only as to things it is responsible for, like recoverable reserves for instance. And the role debt will play over the next two decades in recovering those reserves, before getting all you anti-oil, city boys into electric cars. My industry is not responsible for climate change; only YOU can prevent forest fires.
As to telling the truth, I am glad you read the link. Read the case history itself, you guys did a whole bunch of “lying,’ really bad lying, obviously, just to even get that lame argument before a judge.
Your clever with words, Nick. With some. Not me.
“My industry is not responsible for climate change”
That’s correct, just lying to the public about it’s source and that it’s happening. You remember, those money grabbing scientist are responsible. Right ?
Hi Mike,
Look at WTI from Sept to Dec 2008, several 6 week periods with drops in oil price over 50%.
All of which were quite explainable in 2008. How about this 35% (going to 45%), did you see this coming? No, I guess you didn’t. What happened? Was it fear of recession, falling demand, vast inventory increases in a month? Bigfoot coming on line, the discovery of 5MM BOPD of OPEC spare capacity. Trump leaning on someone with a tweet? Four weeks ago the MSM was yaking about how tight the market was. All theory aside, and links to outside sources explaining to oily guys how the market works, this is unprecedented.
Hi Mike,
Everyone always says they saw it coming after the fact. Before prices fall, there are those that think they will stay the same, those that think they will go up, and those that think they will fall.
Nobody knows in advance, that is just a fact.
If you see these moves in advance, you should be a very wealthy man. 🙂
Of course I didn’t see the steep drop in prices in advance, I thought prices would rise, but I also didn’t think Trump would give waivers to so many nations on the Iranian sanctions. Even after hearing about them, I didn’t expect such a rapid drop in oil prices.
Somehow you seem to believe I am rooting for the oil industry to fail, that is true maybe long after you are retired (say 2040 or so), in the mean time we need the oil to make an orderly transition and need stable higher oil prices to accomplish that. I know that hoping for higher oil prices will not make it so but I am certainly not rooting for low oil prices,$65-85 would be fine with me and would probably be pretty good for you and Shallow sand.
They are quietly grumbling. See my excerpt from today’s Wall Street Journal.
Pathetic to see the leaders of that industry kowed by the President.
Some input to the great study of how oil prices are determined can be:
– Saudi and Russia control storage and “spare production” that nobody measures and control because it is not public info
– China answers by not sharing detailed import or maybe even credible inventory data
– Saudi and Russia have invested heavily in downstream (refineries) and control what they purchase and when
– Financial players (e.g. investment banks) can trigger stop loss, and that is exaggerated by algo “programming”. And who controls them?
Good luck with the thesis: “how oil prices are determined” for anyone that feels the task calling. It derserves a Nobel price if good. But look out for those state players who don’t wan’t you to publish it. They are going to bash you good.
The Wall Street Journal just had an article about how US LTO producers aren’t happy with Trump right. I posted an excerpt under another comment.
Hi Dennis.
WTI going to test $50 today.
They say after Thanksgiving is a good day for the traders to go on attack. Light volume. See 2014.
You were so sure oil was going up.
No moderation. $55-65 WTI is moderation IMO. But no, we cannot have that.
I see stock market indexes are down also. Will the 2020 Democratic Party mantra be, “Donald Herbert Hoover Trump?” Or maybe Donald “Smoot-Hawley” Trump! Lol.
Trump has insulted veterans and the military. He’s hurting farmers because of tariffs. He’s trying to drive down oil prices, which hurts both local and international producers. Tax cuts to individuals will likely disappear when withholding isn’t adequate.
Bit by bit he is chipping away at his base.
The 2020 Democrat nomination process will be something like this:
No, you will not backstab the black voter by staffing up another pasty faced old white man from Scranton Pennsylvania and sending money to those mostly white staffers. Where is the DNC support for black polling firms? Why isn’t that mandatory to achieve diversity in campaign expenditures? Why is the DNC rejecting Senator Kamala Harris from California, who is a black woman? Why isn’t money going to her? Do we only support certain women? Is it racism? Why this decision to pursue “the white swing voter” in Michigan and Pennsylvania and Wisconsin? This is racism and do not think we blacks have to put up with it just because a white man has D by his name.
Oil won’t even be on that radar screen, unless there are gasoline lines.
Why is the DNC rejecting Senator Kamala Harris from California, who is a black woman?
They would rather lose than nominate someone outside the circle. (Clinton and Trump had much more in common than Clinton and Sanders– just look at the voting record of Clinton).
Harris is tough and literate–
Irrelevant. The black monolithic vote is done with money cutting them out of the nomination process.
In terms of more willing to lose than nominate outside the circle, that will be exactly the (black+far left) perspective. If it costs the white swing voter in the absolutely vital states, they won’t care — provided campaign money flows where they want it to flow.
In terms of more willing to lose than nominate outside the circle, that will be exactly the (black+far left) perspective.
Exactly what happened, if we are to believe the poll numbers.
California will be selecting the Democratic nominee this time, having moved the primary from June up to early March.
I have very little confidence they will make a good choice.
I have zero confidence in the political process in USA, Thanks to every single Trump voter.
Not to mention gerrymandering, voter suppression, the electoral college, and
most importantly- a nearly idiot level of the average voting public who has very little ability to sort real from fake news, an attention span for non-sports related issues of 27 seconds, and a third grade level of knowledge of science and history.
Reformist politics are way in the rear view mirror.
Things will be decided on the other side of the wall we are about to crash into, by the survivors, if any.
But making a CA primary more significant (5th largest GNP on Earth) might be making our conservative friends, who have manipulated a very undemocratic system to their advantage, a bit uneasy.
Voters In Wyoming Have 3.6 Times The Voting Power That I Have. It’s Time To End The Electoral College.
https://www.huffingtonpost.com/william-petrocelli/its-time-to-end-the-electoral-college_b_12891764.html
“might be making our conservative friends, who have manipulated a very undemocratic system to their advantage, a bit uneasy.”
They only have reason to be uneasy if the Democratic voters make a choice that is pragmatic and palatable to the majority of the countries voters (+3million).
Far from a certainty.
Agree, “far from a certainty”
Shallow sand,
Hey on oil prices I am very consistent, I never get them right 🙂 Sorry about the low prices, I think we will get back to $60/b by Jan 1 and maybe we will stay in your 55-65 sweet spot for a while, though my guess is that will not be a high enough price so that production will meet consumption (with a zero stock level change) and oil prices should creep up to $75/b by Dec 2019. I doubt this will be a gradual increase there will be many ups and downs along the way, but my guess is the monthly average WTI price in Dec 2019 will be $70 to $80/b.
Nothing organic about reflation since 2009. It’s all easy money hot air fluff. FED pulled the plug on it. End of story. No reason for any market or price to go higher. For 10 years any kind of bad news just meant more easy money more for longer. Markets and prices rallied on awful news. Problem Fed has now is were at the end of the credit cycle that started in 2009 when interest rates were dropped and QE was introduced. They could cut rates back to where they were before they started tightening and it would make no difference. Ship is sinking. Won’t go completely under overnight. Bottom is somewhere lower than the lows 0f 2008-2009. Make no mistake FED can’t fix it this time. Neither can fiscal policy. Because issuing more government debt. Well the money has to come from somewhere. FED isn’t buying. So old debt has to be rolled over with money that is in the economy currently. New debt also has to be bought with existing money that currently in the economy. Economy doesn’t have unlimited funds like the FED to pay any price. So if you think the FED has to save the day think again. Market senses that there can never be an end to easy money and interest rates no matter where they are they have to go lower every few years even if they are already negative they still have to go lower. Means FED has lost control. This all ends in deflating the biggest everything bubble ever. Maybe reflation can take place afterwards maybe not. Unless your local gas stations have no gas to sell i’d look for prices to stay low. Margin debt used to pump oil price in futures market just it’s going to be there either.
The FED can no longer fix America; that is correct. Oil prices will not reach $120 and stay there, very little of all the ridiculous TRR oil will actually be recovered and oil does not ‘need’ to flow, “therefore it will.” Learning which end of a horse to feed is your best bet.
Rather a lot of over-reaction to a stock market down about 1% YTD.
The most critical issue with oil is not how much there is, but where it is. Russia has a lot more surface area to look in, and given the years of demonization — no reason for them to provide oil to the demonizers on some particular day when financial structures are teetering (again) for a price that involves something other than disarmament.
A lot money that flowed into the shale patch came from pension funds. If there ever comes a reason for pension funds to sell or worse if they are force to sell (margin call) shale funding could dry up quickly. This will eventually be what happens but timing of it is unknown. As leveraged as everything is in this current market is it could happen at anytime. Pension funds are very leveraged up because lack of return on money in low interest rate world we currently live in. Market has already turned against them. It’s just a matter of time before they run out of room and are forced to sell. In all likelihood these pension funds borrowed the money they lent shale oil and gas companies.
If you just walk into a bank and say, “Hey, I’ve got some savings and want to put it to work in something safe” – that bank will put you into a bond fund at somewhere between 3.0 – 6.0% and say, this is a safe bond Mutual Fund, or whatever. But if you were to dig into the holdings it will be… Shale Oil and mostly B+ rated bonds. I’m not even sure they will be those direct bonds, but maybe derivatives of those bonds or something. Fixed income is propping up shale oil, but savers who are just trying to put money to work in any way outside of CD’s – they are supporting shale. And even those CD’s – are probably being turned around and invested at least partially in shale.
But October was one of the worst months in years for Credit. That’s why you are seeing the ripples. The drop in the markets are nothing – its all happening in credit.
Mike,
For the North Dakota Bakken/Three Forks the USGS estimated about a 10 Gb TRR in 2013. With an AEO reference case price scenario probably 9 Gb could be recovered (note that this scenario goes to $113/b in 2050 (2017$) and $244/b in nominal $.)
At the end of 2016 proved reserves plus cumulative production was 6.8 Gb (ND Bakken/TF), perhaps probable and possible reserves are zero, much will depend on oil prices and the AEO reference oil price case is quite conservative with nominal prices remaining under $100/b until 2025 ($85/b in 2017$).
If oil prices remain under $60/b long term, then URR will be far lower, probably 6 Gb in the Bakken. maybe less. Permian ends up with about 16 Gb of output if oil prices remain at $60/b or less in 2017$. This is about half the output under the AEO reference oil price scenario.
http://www.pemex.com/en/investors/publications/Indicadores%20Petroleros%20Archivos/eprohidro_ing.pdf
Mexico dropped 75 kbpd for C&C + NGL in October, now down exactly 200 kbpd so far this year.
Mexico (Pemex) crude oil exports in October: 1,027 kb/day
Down -179 m/m
Down -148 from the (full year) average in 2017
.
Net product exports: (without LPG) -765 (-ve = imports)
Total net exports: (crude oil + products without LPG) 262 (shown on chart)
Chart: https://pbs.twimg.com/media/DsyL9m5WkAAdJVf.jpg
Chart, refinery production: https://pbs.twimg.com/media/DsyMXVuX4AAoOlb.jpg
Mexico crude oil production in October (kb/day)
Total -61 m/m to 1,764
-185 from the (full year) average in 2017
.
Light (Ligero+Superligero) -41 m/m
-208 from the (full year) average in 2017
.
Heavy (Pesado) -20 m/m
+24 from the (full year) average in 2017
https://pbs.twimg.com/media/DsyMfRHXgAM_eb8.jpg
Hi George
I noticed that Claire ridge has finally started up with expected capacity of 120K per day. The weald basin tight oil play continues testing near Gatwick.
What drives oil prices
There seems to be a lot of misunderstanding concerning oil prices. The oil futures price reflect traders estimate of where supply and demand will drive prices, in the next hour, the next day, the next week and so on. Traders guess! If more traders guess supply and demand will fall, then they go short oil. If they guess supply and demand will drive prices higher, then they will go long in their buying positions. And if they guess wrong, that will cause wild short term swings in oil futures prices. That is called volitity.
But understand, the real price of oil is set by the spot market, not the futures market. The actual price of oil, on the spot market, reflects an agreement between buyer and seller. That being said, a futures contract, held until expiration, is binding and does reflect the actual price paid by buyer and seller in that case. However actual futures contracts delivered, are but a tiny fraction of total oil sales.
Traders are always guessing. If they guess right, they will make money. If they guess wrong they will lose money. Oil futures are a zero sum game…. minus commissions. And that is why most traders eventually lose money.
What’s really driving down oil prices?
The reason for the price drop was partly due to a sizeable increase in production.
“There is too much oil in the market,” reads a recent report by Matt Badiali, a senior analyst at Banyan Hill Publishing, an independent publishing house and research firm.
A portion of the supply increase was due to Saudi Arabia and some other oil-producing countries upping their output.
Oil Prices Hit A New Low
Falling oil prices mirror signs that global growth is fading, says Bloomberg Senior Editor Michael Regan. He points to a report out of Germany Friday showing the country’s economic growth has fallen to its weakest levels in four years. And the U.S. stock market just saw its worst Thanksgiving week since 2011.
Oh, come now. Why should they guess? Of all parameters on the planet, why would not absolutely solid knowledge of production and consumption be known by now?
Besides which, this is wrong. Traders . . . and when you say traders you no longer mean humans, it’s machines . . . don’t guess what oil transfers are going to take place. They guess what other traders are going to do. The goal is defeat the competition. Being “RIGHT” doesn’t mean guessing correctly about oil supply. It means swamping the trading machines of the enemy (aka competing computer) with frozen quotes so they can’t act while you drive the market in a direction that will hurt that competing computer. Being RIGHT means defeating the competition, even if you lose money. As long as the enemy lost more money, you were RIGHT.
BTW commodities are not the latest to the HFT party. Word out is that US Treasuries are being HFT moved now, too.
Oh, come now. Why should they guess? Of all parameters on the planet, why would not absolutely solid knowledge of production and consumption be known by now?
I hope that was a joke. No one knows what oil production was, or will be, today, tomorrow let alone next week or next month. And no one knows exactly what consumption will be today, tomorrow or next month. Therefore no one knows if the pressure on oil prices will be up or down. You shouldn’t make such stupid jokes Watcher, someone might think you are serious.
Besides which, this is wrong. Traders . . . and when you say traders you no longer mean humans, it’s machines . . .
No, machine oil futures trading is very rare. Machine trading is primarily used in equitity trading and equity futures trading. And they, that is the computers, trade in milliseconds, holding positions for an extremely short time, from a fraction of a second to minutes. And even there, most trading is still done by humans and fund managers, not machines.
The goal is defeat the competition.
No, the goal is to guess correctly the diriction oil prices will move, up or down.
Being RIGHT means defeating the competition, even if you lose money. As long as the enemy lost more money, you were RIGHT.
No, fuck no, there is no enemy. The goal is to make more money than you lose. If you lose more money than you win, then you lose. There is no enemy whom you wish to defeat. Your only goal is to make money. All traders are trying to do is guess the correct direction oil prices will move. That is all they are trying to do, nothing more. If they guess right they make money. Otherwise they lose money. End of story.
Ron, most US oil producers’ prices are set by the futures market.
We have a basin posted price and it is so many $$ less than WTI. We then get a volume bonus.
If WTI goes up $1, our price goes up $1. Same in the other direction. The only caveats are that the purchaser rounds to the nearest .25 and that the differential to WTI has changed some over the past 20 years. But, the basis differential has only changed a handful of times for us, nothing like Bakken or Permian crude.
But, from what I understand, almost all US producers see their prices fall when WTI falls, and the same the other way.
There are four crude oil purchasers that we can choose from. All have the same posted price, Plains Marketimg, LP, posts a price and the other three follow suit posting the exact same price everyday. The differences are in the volume bonus that can be negotiated with each.
We don’t sell any oil on the “spot market”. What we can do is enter into paper hedges to lock in a floor or a fixed price. We have bought WTI put options in the past through a broker. Cargill is big into that now. We receive a daily quote from them.
Puts used to cost less than $1 per barrel for a one year fixed price about $5 below the 12 month WTI strip. Now, that same contract costs $3-4 per barrel, BECAUSE VOLATILITY HAS INCREASED.
We should be hedging, I know it. We need to find someone good to advise us.
The futures set the price in the US. Look at the 10K. Find the companies for me that are selling oil whose price is not directly tied to the wild swings of the futures market. They all appear to be, except, of course, for hedging.
I wish we could find a company that would buy all of our oil for $65 for calendar 2019. But it doesn’t work that way.
We don’t sell any oil on the “spot market”. What we can do is enter into paper hedges to lock in a floor or a fixed price. We have bought WTI put options in the past through a broker. Cargill is big into that now. We receive a daily quote from them.
Not correct! While it is true that today, only about 10% of oil is sold on the spot market, the bulk of the rest is sold by short and long term contracts negoatied by buyer and seller.
The spot oil market despite international criticism and attempts to control it, is booming. Officials of European and international agencies estimate that this market where oil not under long-term contract is bought and sold, now accounts for at least 10 per cent of the world oil trade.
The URS dealing with short and long term crude oil contracts are far too many to list, there are even courses you can attend to learn the ins and outs of oil contract negoations.
Oil & Gas Commercial Contracts and Negotiation Skills
About 10% of all oil sold is sold on the spot market. That is immediate sales, on the spot delivery, no future deliveries. The bulk of the rest is sold by long and short term contracts negoatied by the buyer and seller. Just one of many, many examples found on the net:
Exxon Seeks Long-Term Deals for U.S. Oil Exports
Only a tiny fraction of all contracts bought and sold on the NYMEX wind up being delivered. The bulk of all contracts are closed before expiration, and even if they do expire the vast majority are still settled for cash. Again, the bulk of oil sold on the world market is sold by negoations between buyer and seller.
Puts used to cost less than $1 per barrel for a one year fixed price about $5 below the 12 month WTI strip. Now, that same contract costs $3-4 per barrel, BECAUSE VOLATILITY HAS INCREASED.
No, that is simply incorrect. Of course volitity has increased but puts have never had a fixed price. The price of long term puts, as well as calls, changes by the day. and as they get closer to expiration they change by the hour, then by the minute. Puts and calls have a time premium. The long term premium is higher and as they get closer and closer to expiration the price gets lower and lower. Out of the money puts and calls expire at $0.00 and in the money puts and calls expire at the amount they are in the money plus $0.00 time premium.
Ron, you give an example using XOM.
We aren’t XOM or an IOC. I’m sure they do things differently.
As for puts, we aren’t speculating, we are hedging. We hold all to expiration. We buy a 12 month contract, not a series of one month contracts.
If we start speculating, we cannot expense the put premiums, they would become capital losses.
The cost of a 12 month contract generally is much more expensive than it was 15 years ago.
The last quotes I have for calendar 2019 floors (puts) are for Tuesday morning. $53.75 floors had a quoted premium of $4.28 per barrel. $53.75 floors for calendar 2020 had a quoted premium of $6.78 per barrel. These are both WTI quotes. As the price tanked again Friday, I am sure premiums at that price went up substantially.
I recall us paying premiums in 2004 of about $1 for a calendar 2005 floor. We could have sold those in 2005 before expiration for a few pennies, but, again, we sure want to be able to expense those for income tax purposes.
I am just trying to convey the experience of a small producer, of which there are thousands in the USA. None are seen by the general public with anything but scorn, because the general public doesn’t understand these businesses and barely is aware they exist.
We employ 8 full time employees and a part time bookkeeper. We feel we provide a benefit to the economy. However, after several years of favorable economic conditions, since 2014, conditions have been generally unfavorable.
As all should know, even if the entire fleet goes electric, there will still be a need for petroleum. Demand for plastics is expected to increase dramatically from now to 2050 with regard to petroleum for industrial uses.
It also would seem we are decades away from non FF air travel. Same thing with ships.
We are operating extremely small footprint operations. Almost all of our pumping units are under 10’ tall. Our gathering facilities consist of small vessels, less than 1,000 barrels of capacity total. Minimal emissions. We think we are in compliance with the proposed methane rules with regard to emissions, it is the compliance costs that would do us in.
It is really a pretty good small business, except for the extreme price volatility and concerns over hostile government policies. Those two concerns are just about to overweigh the benefits for us.
That was a very informative post Shallow, thanks.
Ron, you are welcome.
I think you and I are sometimes taking past each other, with neither being factually incorrect. No harm in that.
I wish I could find a way to get mainstream US and, in particular, the political left, to understand that stripper oil and gas well producers are very different from the public upstream companies.
I think there are many similarities between stripper well operators and farmers. Both are generally small businesses located in rural areas. Both are wholly dependent on commodity markets, which seem to have become more volatile in recent years. Both do care about the local environment, because that is where the owners and employees live. Both are fearful of urban left wing politicians because they are afraid those persons are a direct threat to their livelihoods.
Not sure if those fears are completely warranted. However, I was a fan of Obama and generally approved of how he acted during his two terms. However, he flat out lied about “tax breaks for Big Oil.” The tax breaks were not Big Oil tax breaks, but for stripper well operators.
We can debate whether stripper well operators should receive those tax breaks. Just don’t lie about them.
I felt Obama was generally pretty honest. He is also very intelligent. But, he was willing to lie about this issue, and also not at all concerned about whether he was going to hurt small, rural businesses in the process.
There is about 1 million BOPD of stripper well production in the US. This is not a small number, nor is the number of employees. Tens of thousands directly and indirectly employed operating stripper oil and gas wells.
It would seem the D’s should not be hostile to small commodity producers. I wish they could be a little more nuanced.
I went to college with mostly people from urban areas and have many close relatives living in urban areas. Not many ever think too much about where the food and fuel comes from. That’s a shame, IMO.
Hi Shallow sand,
On those “big oil tax breaks”, do only small oil companies get them or does every company that operates low volume wells get those tax breaks?
If the tax breaks are not limited to small oil producers, then it is not really a lie.
I have no problem with tax breaks, though if both small oil and big oil get those tax breaks, it would seem that calling them tax breaks for big oil is accurate in a technical sense in that big oil gets those tax breaks, though from your perspective it is a lie of omission because small producers are the main beneficiaries.
Generally people don’t know much about small oil producers. When they think of an oil company they think of Exxon/Mobil.
Dennis. It is a lie of omission.
Apply to first 1,000 BOEPD.
So XOM does get them on first 1,000 BOEPD.
I stand corrected.
Those deductions can only be taken by independent producers.
XOM, CVX and other integrated majors cannot take them at all. Wikipedia defines “Big Oil” as the integrated majors.
Likewise, if one considers EOG “Big Oil” keep in mind, a deduction on 1,000 BOEPD is pretty nominal for a company that produces over 1/2 million BOEPD.
Again, I’d say I cut O more slack than most in oil and gas (or Ag for that matter).
Shallow, thank you; it is important you corrected that.
Yes Mike, I agree.
Even if they could take it, and they CANNOT, to say you are ending TAX BREAKS FOR BIG OIL by ending IDC and percentage depletion is pretty deceptive.
But, turns out it was a lie.
Shallow Sand,
In my mind Big Oil could include any large oil company. I had forgotten the rules on the percentage depletion allowance, thanks for the correction.
I found the link below which explains it, if it is wrong let me know.
https://www.energytaxfacts.com/issues/percentage-depletion/
The article below covers the Obama “big oil” tax breaks, there are several different things in there, and these are breaks that some fairly large oil companies receive, though I agree percentage depletion would affect mostly smaller producers and there is no reason to pick on the oil and gas industry. Seems a fair tax code would have the same percentage depletion allowance for all mineral producers.
https://business.financialpost.com/commodities/energy/obama-says-tax-breaks-for-big-oil-need-to-end
And so . . . Sovereign Wealth Funds and Shale. Are they funding those loans?
Answer — not really. There was a hyped announcement of Singapore’s SWF sending money to Chesapeake. But that was in 2010.
Reporters who dare to look into this don’t seem to find much. They retreat to the sanctuary of narrative. Something like this “With renewables smashing oil’s future, SWFs that are mostly funded by oil and gas are reluctant to invest in anything related to oil or gas.”
Uh huh.
Worth noting that China has 4 SWFs that clearly were not funded by oil or gas — but they aren’t really SWFs either. They are just money in accounts at the PBOC and of course that entity can declare itself to have whatever amount it wishes (just like the Fed’s Balance Sheet). (Note surprisingly in this context that Hong Kong (listed as one of China’s) has a “SWF” of about 1/2 trillion dollars, which is absurd). But . . . China’s money isn’t oil or gas derived and even they aren’t pouring into profitable oil or gas so diversification may not be the motivator in this. (Venezuela doesn’t count, there will be no profit there)
BTW narrative embracers, y’all might want to examine why Tesla’s stock didn’t fall. Answer, Saudi’s SWF owns 5% of the company in total and they don’t sell more or less any of their holdings. This is a common trait of SWFs. They seldom sell anything. tra la tra la
Last but not least, and wow this is intriguing, there is CONSIDERABLE talk of the UK creating a SWF funded by shale gas that hasn’t flowed yet. Gotta be an agenda there.
http://www.artberman.com/2018-oil-price-collapse-explained-macrovoices-interview-20-nov-2018/
Brazilian oil exports, ANP (Units 1000 barrels per day)
6 month moving average of net exports (crude oil + products)
September is at 678
Average 2018 so far 446
Average 2017 full year 492
Chart https://pbs.twimg.com/media/Ds1_S8EXQAAmY0n.jpg
Crude oil – The recent spike highs in crude oil exports must be coming from inventory draws. As the sum of refinery processing plus net crude oil exports is higher than crude oil production.
Chart https://pbs.twimg.com/media/Ds2Aqz9WsAANjjJ.jpg
In the longer term, from 2014, crude oil net exports have increased due to an increase in production and a decrease in refinery processing
https://pbs.twimg.com/media/Ds2CmdiWwAEQrF2.jpg
Twitter – Donald J. Trump
So great that oil prices are falling (thank you President T). Add that, which is like a big Tax Cut, to our other good Economic news. Inflation down (are you listening Fed)!
1:46 pm – 25 Nov 2018
https://twitter.com/realDonaldTrump
He’s right about the Fed and inflation. That’s pretty serious stuff. If the Fed suspends its increases a lot of things are going to change globally.
What exactly is going to change if the Fed suspends it’s increases? Dollar liquidity is still going to be an issue globally. Low oil price means less dollar liquidity particularly outside USA. Market demands nothing less than full blown more QE and lower interest rates. There is globally about 20 times the amount of dollar denominated debt as there is physical dollars to service that debt. That is what happens when the FED drops interest rates from 5.25% to 0.25%. Everybody borrowed dollars. FED can’t exit without putting us right back where we were in 2009. They also can’t continue. Why can’t they continue? Answer is simple, the amount they create to keep things going has to be an ever increasing amount at an ever lower interest rate. Otherwise debt deflation happens. They hit a brick wall and can do nothing. So they will try to deflate it a little at a time. By raising interest rates and unwinding QE a little at a time. Then something major happens and it deflates a bunch all at once.
There’s a lot of babble out there. There’s probably too much Fed watching and too much Fed predicting, especially for parameters that are claimed to be “data dependent”. There is certainly a sense that the data is watched by the Fed, but they have no threshold predefined for various actions. They are not hitting their inflation target, but they’re continuing to increase rates. The way that’s handled is to announce that they will tolerate overshoot.
It is not an extreme claim to simply say that there are acting in a whimsical way. The talk of data dependence would seem to be meaningless.
But the question is what happens if they cease their rate increases? The answer is the public concludes that the data must be very poor and they see profound weakness. Maybe more significantly the negative real rates in Europe might become negative nominal rates in response. That, of course, really cannot work for any lengthy period of time.
https://www.zerohedge.com/news/2018-11-25/oil-sends-crude-warning
These guys know what they are talking about, and they dont see the huge increase in the Permian for a different reason, other than constraints.
https://www.fool.com/amp/earnings/call-transcripts/2018/10/19/schlumberger-nv-slb-q3-2018-earnings-conference-ca.aspx?utm_medium=amp&utm_source=google
Nobody is putting numbers to it, yet, but the potential of shale oil being the saviour of oil supply is much in question, now. It took six years for it to be noticable in the EF, and in two years its already noticable in the Permian.
GuyM
From your link
We added additional rigs during the quarter in Saudi Arabia, keeping us on track to have mobilized 25 rigs by the end of the year. These positive effects, however, were partially offset by lower hydraulic fracturing activity as a major contract was completed and demobilized in Saudi Arabia.
I wonder are they fraccing for gas or to boost oil production?
Thanks Guym,
From your link (Schlumberger 3Q2018 conference call), I thought this part especially was instructive, the CEO made these comments and I agree this person knows his stuff, not the usual smoke blowing often heard in oil industry conference calls:
The North American production base, which makes up the remaining 20% of global supply, has absorbed close to 70% of the demand growth since 2010, initially supported by the Eagle Ford and Bakken, and more recently by the Permian basin. However, the well-established market consensus that the Permian can continue to provide 1.5 million barrels per day of annual production growth for the foreseeable future is starting to be called into question. In this respect, we do not believe that the temporary off-day constraints are the main issue, as this will largely be addressed within the next 12 to 18 months. Instead, we believe the main challenge in the Permian going forward is more likely to be reservoir and well performance as the rate of in-field drilling continues to accelerate.
At present, our industry has yet to understand how reservoir conditions and well productivity change as we continue to pump billions of gallons of water and billions of pounds of sand into the ground each year. However, what is already clear to us is that unit well performance normalized for lateral length and pounds of proppant pumped is dropping in the Eagle Ford as the percentage of child wells continues to increase. Today, the percentage of child wells drilled in the Eagle Ford has already reached 70%, and in the three-year period since this percentage broke the 50% level, we have seen a steady reduction in unit well productivity.
In the Permian, the percentage of child wells in the Midland Wolfcamp basin has just reached 50%, and we are already starting to see a similar reduction in unit well productivity to that already seen in the Eagle Ford, suggesting that the Permian growth potential could be lower than earlier expected. Therefore, assuming that oil demand will remain robust despite the trade war worries and market concerns around economic weakness in the emerging markets, we believe that the level of EMP investment must increase, both internationally and in North America, first of all to counter the multiyear drop in investments, and second to develop and deploy the new technologies needed to overcome the emerging shale oil production challenges.
Yes, so the immediate concerns are the constraints. Then, the fact that tier one stuff is not forever, and lastly the production on child wells is starting to drop in the EF and the Permian. These are facts. Per the CEO of EOG, shale will grow, just not at the rate of current projections. Your estimate is very conservative, and may hold up after 12 to 18 months. The pipelines are probably less than a year now. However, the Port constraints will probably take up to 18 months. Plus personnel, general transportation issues, water, electricity, and ad naseum. I believe that shale production is set to really upset the overall supply estimates.
Guym,
What jumped out at me is the estimate that unit well productivity (which is normalized for lateral length and pounds of proppant used per foot of lateral) is already in decline in the Midland Wolfcamp basin (mean estimate for undiscovered technically recoverable resources by the USGS is 20 Gb for that basin, it’s the biggest Permian tight oil basin assessed to date), if this estimate is correct (I don’t have access to the data I would need to confirm their estimate), then my estimate for Permian basin output may be too optimistic. My current “medium” scenario assumes average horizontal well productivity (for the average lateral length and average proppant loading used in 2017 and 2018) for the Permian basin (all tight oil formations) remains at the average 2017-2018 level until 2022, and then average well productivity (estimated ultimate recovery or EUR) starts to gradually decrease starting in Jan 2023.
So this information from Schlumberger is quite important in my view.
I wonder if Enno Peters can confirm the finding of Schlumberger?
When you look at the Enno website, productivity increase has slowed down a lot in the last year, almost coming to a halt. But this is gross data, not broken down to well feets.
Eulenspiegel,
I agree, but my thinking was that Bakken average well productivity continued to increase through 2017, Permian really didn’t start ramping up horizontal drilling until about 3 years after the North Dakota Bakken (2011 vs 2008), so I am guessing the Bakken may start a decrease in average well productivity in 2020 and Permian in 2023, from 2018 to 2023, my expectation was that average new well estimated ultimate recovery (EUR) would be relatively constant in the Permian basin, that expectation may be too optimistic.
The North American production base, which makes up the remaining 20% of global supply, has absorbed close to 70% of the demand growth since 2010, initially supported by the Eagle Ford and Bakken, and more recently by the Permian basin.
Did this exclude Canada?
Not sure, but probably the company recognizes Canada as part of North America?
The main comment was actually pretty new to me regarding the EF. Read before about this in the Permian. I try to keep up with these things, but missed it as production is reported by lease in Texas. Impossible to compare.
Guym,
Yes North America would include US, Canada and Mexico, though perhaps any increases from Canada have been offset by decreased output in Mexico.
Based on EIA data from Jan 2010 to Aug 2018, Mexican and Canadian C+C output has increased by 985 kb/d (5144 to 6129 kb//d) or about 17% over the past 7 years 8 months. Over the same period US C+C output increased by 5956 kb/d or 71% (5390 to 11346 kb/d).
World output of C+C increased by 8916 kb/d from Jan 2010 to Aug 2018, North American output (Canada, Mexico, and US) increased by 6941 kb/d, which provided 77.8% of the increase in World C+C, US alone provided 66.8% of the increase in World C+C output since Jan 2010.
London, (Argus) — Oil product stocks held in independent storage within the Amsterdam-Rotterdam-Antwerp (ARA) trading hub rose by 1.4pc from a week earlier to 4.95mn t (approx 37.3 million b), after reaching an 11-month low a week earlier.
A monthly chart but with weekly data for October and November
https://pbs.twimg.com/media/Ds4l2RdXcAIAsNt.jpg
2018-11-26 (Bloomberg) After a brief hiatus in late Oct and early Nov, the problem with low water levels in the Rhine river is back, with BASF now announcing production cuts a its big petro-chemicals complex in Ludwigshafen
BASF – the water level of the Rhine has fallen to “an all-time low, impacting transport by ship”.
Bloomberg, water level chart https://pbs.twimg.com/media/Ds7hv_xWoAAulS_.jpg
I think there is some rain forecast for later this week but it takes time to refill the water table
Still 2.5 meters of water missing. Rain forecast for the next 2 weeks altogether round about 3 cm. More than usual this year, but not enough.
The discussion about the viability, or lack thereof, for shale oil companies has me wondering about the environmental legacy they’re likely to leave behind if/when they fail? In Alberta, there are about 155,000 wells that are listed by the regulator (AER) as shut-in/not producing/abandoned but not yet reclaimed/remediated. About 3,000 wells are identified as “orphan wells”, whose owner is now defunct or unable to shoulder the financial burden of the required reclamation/remediation. As a result, the Alberta Government (read general public) will be on the hook for the cost of proper abandonment and remediation at these well sites. Estimates of this liability range from hundreds of millions to billions of taxpayer dollars as additional small oil producers are likely crumble if the current unfavourable enconomic conditions persist.
Are state governments likely to be left holding the bag when shale oil producers begin to fall? If so, what magnitude of environmental liability cost are these governments likely to inherit from the shale oil industry?
It could be very large if not managed properly.
However, given the high volatility of oil prices, wells that are abandoned during one time period can be economic later on. Further, many times the wells are economic, it was just the current owner had too much debt, went BK and walked away from them.
1998 crash caused a lot of wells in our field to be abandoned. We picked up a few out of the state plugging fund, spent a little on them and started them up again.
Turns out even in 2016, when we were losing money overall, some of these wells were economic. Just had been poorly operated by fly by night types.
Wells can be swedged in safely and temporarily abandoned for years. One of ours was shut in 1998. Was in state fund till 2011, when we took it over. Has been very economic. Cable tool hole drilled in 1957. Must be a very straight hole, little down hole failures over 7 years.
Might be a concern with hz wells with regard to how long the lateral can hold before it collapses? Beyond my knowledge. However, as for vertical wells, we are proof they can last over 100 years and still be economic.
Again, another reason for me to beat the drum for the small guys operating the old stuff. Doesn’t cost too much to plug a shallow vertical well in relation to a 20,000’ TD shale well.
In Texas, first the producers, then the insurance companies who issued the bond, and lastly the overall insurance companies who have to support the reserves are responsible. The State tries to protect itself. That said, it’s unlikely that all cost will be covered:
https://suretygroup.com/surety-bond/texas-oil-gas-performance-bond/
The rule needs to be updated for current costs. But, most leases are taken over by another producer, if an entity fails. If it produced oil to any substantial amount, the lease usually has potential to another producer. In Texas, most producing areas usually have several potential plays that could be drilled. In the Permian, they are legion, EF has several levels, too. Unless, the royalty owner was smart and wrote in depth clauses. And the answer to that for me, is I was not smart.
An interesting article about the challenges of dealing with orphan wells in Ohio, Kentucky and West Virginia:
http://www.wkms.org/post/orphan-wells-states-wrestle-soaring-costs-oil-gas-industry-mess#stream/0
That article also mentions that horizontal wells are likely to be more difficult and more expensive to plug. For horizontal wells, will it be necessary to plug the entire horizontal section or just get good plugs in the vertical section, which has proved difficult enough based on leakage experience from previously plugged wells to date?
Given the sheer numbers of shut-in wells being reported and the large potential additions from shale oil operators, is well plugging an emerging opportunity for the oilfield service sector?
Well plugging always has been a decent business. Just like any other, management is key. Likewise, finding experienced workers is key.
Getting paid is an issue in the plugging business.
To plug a well under 1,000’ that is cased, it can cost as little as $5K.
I understand plugging a hz well with at least 15,000’ TD can cost at least $250K.
Orphan wells in Colorado.
https://www.denverpost.com/2018/07/18/hickenlooper-executive-order-orphan-wells/
https://www.denverpost.com/2018/07/14/orhpan-oil-gas-wells-growing-problem/
One problem with abandoned wells is that states and lease terms tend to not address the issue of equipment removal by the operator.
If the surface and downhole equipment is not removed, that equipment many times will pay for P&A costs. However, those issues can be tricky, especially if the equipment is security for a loan.
In fact, I have seems banks repo surface and downhole equipment, leaving the open hole sitting there.
That’s banks for you. Take the donut, and leave you the hole?
If the bank removes equipment and leaves an open hole, seems to me they’ve created a potentially unsafe condition. Is the bank liable for any contamination resulting from the open hole?
We continue to talk here about whether debt, both gas and oil debt and debt in general, is a going to be a problem.
According to William D. Cohan, a former investment banker and the author of four books about Wall Street, it is a problem.
When Blue Chip Companies Pile on Debt, It’s Time to Worry
https://www.nytimes.com/2018/11/26/opinion/corporate-debt-bubble-att-ge.html
Boomer 2,
Most agree that too much debt is a problem. Where the disagreement lies is where the line is drawn, how much is too much?
On that question there are as many answers as people. Look at Japanese debt to GDP, that is probably the line and most nations are pretty far from that line. Data on this question at page linked below.
https://www.bis.org/statistics/totcredit.htm?m=6%7C380%7C669
2018-11-26 (S&P Global Platts) Seoul — South Korea’s gasoline demand dropped 16% year on year in October, the sharpest decline in 20 years since October 1998 when the country was hit by the Asian financial crisis.
“The sharp declines in auto fuels are attributable to higher pump prices and the economic slowdown,” a KNOC official said.
Pump prices of 92 RON gasoline — the more popular grade — averaged Won 1,681/liter ($1.48/liter) in October, up 11.8% from a year earlier. It was the highest price in four years, according to the official.
Due to the sharp decline in consumption, the country’s stocks of gasoline jumped 34% year on year to 6.98 million barrels, according to the KNOC official.
South Korea’s demand for auto fuels are expected to rebound in November, driven by tax reduction and lower international crude oil prices.
https://www.spglobal.com/platts/en/market-insights/latest-news/oil/112718-south-koreas-gasoline-demand-suffers-biggest-decline-in-20-years
There’s often uncertainty about economic growth but now we have higher rates, trade tariffs and also at the start of October we had higher fuel prices.
Petroleum Stocks in South Korea up to August
Iran’s exports are down more than production
Exports are said to be down approx -900 kb/day from 2600 during H1 2018 to 1700 in Oct
But production from May to Oct is only down -526 from 3822 to 3296
Chart of OPEC15 production lowered to match the fall in Iran’s exports
https://pbs.twimg.com/media/Ds_xsaoXoAAXAbt.jpg
Even after accounting for Iran’s exports decreasing more than production, World oil production from the low in May to Oct is still up more than +1500 kb/day. As we know due to big increases from the USA, Russia and other OPEC members. USA +900 Russia +439, OPEC15 +375
Another issue – OPEC15 exports are already significantly lower
As HFI is saying according to tanker trackers OPEC15 has cut exports
Chart: https://pbs.twimg.com/media/Ds6PyjXU4AAl_uo.jpg
HFI twitter account https://twitter.com/HFI_Research
Permian natural gas Waha benchmark averaging just $0.625/MMBtu on Monday & dipping below $zero intraday. It seems the Sunrise Expansion might be the reason – more oil pipeline capacity but not gas…
11/26/2018 (RBN Energy) Permian natural gas skidded toward a new threshold: zero! That’s not basis, but absolute price, a long-anticipated possibility that became reality on Monday.
The Permian gas market is flooded with associated gas and won’t see significant new takeaway capacity until the start-up of Kinder Morgan’s Gulf Coast Express (GCX) pipeline in late 2019.
Prices near the end of this period (Monday morning) traded one penny below zero at Waha, according to the daily range posted by NGI.
https://rbnenergy.com/keep-breathin-sky-falls-for-permian-gas-prices-on-cyber-monday
RBN: Waha $MMBtu chart https://pbs.twimg.com/media/DtAuXzhUUAAI2ET.jpg
US shale producers just cannot help themselves.
Likewise, they only have themselves to blame for current oil prices.
While speculators do swing prices wildly, US has added 2.8 million BOPD from 9/16 to 8/18.
Yet, almost no debt reduction by US shale. The stock prices generally aren’t strong either.
We can complain about Trump, but US producers that are increasing production while not strengthening corporate balance sheets bear a lot of the fault.
We haven’t drilled a new well since fall, 2014. We are trying to do our part! Lol!!
At one time, the Texas RRC was THE swing producer in the world. They regulated price with allowables, well spacing, etc. They told producers what they could produce. Like OPEC. This was about conserving and managing the oil and gas to ultimately produce more of it, even if it was over a longer period of time. To prevent waste.
I understand it is about Tax revenue now and waste is irrelevant, but someone needs to explain to them that taxes generated on product given away for free is $0.00.
I don’t think Permian is continuing to grow that much, now. However, to keep up production, they seem to be concentrating in the far West Texas and New Mexico portion which is the newer area. That is the more gasier and higher condensate area. Gas production keeps creeping up, and so is the percentage of condensate to oil.
2018-11-28 (Bloomberg) Natural gas prices in the Permian region (Waha hub) briefly fell below zero for a 2nd consecutive day on Tuesday due to booming output and limited pipeline capacity, according to @NGInews
If anyone is interested in how small of pumping units we use, go to jcpump.net.
We mostly use 16’s and 25’s, but we do also have many 10’s, 13’s and 40’s.
We have found JC makes the best new units. However, we typically will take a refurbished unit from the 1980s over new.
JC doesn’t import its gearboxes from China, and manufactures them at its factory in Coffeeville, KS. They are much higher quality than the Chinese gearboxes, based on our direct experience.
Disclaimer. We have no interest in JC. Just thought a couple who read here might be interested.
The Wall Street Journal has been running at least one oil article daily. This is new. The paper hasn’t been that interested in oil until the volatility. Today’s article talks about supply exceeding demand.
2018-11-27 Petrobras October crude oil, condensate & NGLs production in Brazil: 2,041 kb/day up +163 kb/day or +8.7% m/m
Chart https://pbs.twimg.com/media/DtCxTRfXcAEnKUE.jpg
(Petrobras) In relation to the previous month, there was an 8% increase in total oil and gas production due mainly to the start-up of platform P-69, in the Lula field, located in the pre-salt of the Santos Basin, besides the end of maintenance stoppages of the platforms P-57, in the Jubarte field, P-52, in the Roncador field, and P-25 and P-31, in the Albacora field, located in the Campos Basin.
http://www.investidorpetrobras.com.br/en/press-releases/oil-and-natural-gas-production-october-2
Pemex Triples Size of Biggest Onshore Find in 25 Years ~Bloomberg
https://www.bloomberg.com/news/articles/2018-11-27/pemex-s-massive-ixachi-field-three-times-bigger-than-thought
Where do we go from here ?
Here is a bit of forecasting from back in June.
•Oil prices are heading for a downturn later this year and will sink even lower in 2019 as the fundamentals of supply and demand weaken, J.P. Morgan forecasts.
•Crude futures could have one last “hurrah” if OPEC eases its production caps, but the rally would likely be short-lived, the bank says.
•Growth in oil consumption looks weaker than anticipated due to softer-than-expected economic growth in Europe, Latin America and the Middle East.
https://www.cnbc.com/2018/06/08/oil-prices-heading-lower-this-year-and-even-lower-in-2019-jp-morgan.html
Huntington beach,
Back to $70/b by May 2019 (perhaps sooner depending on the OPEC+ decision in early December).
Concerning debt and GDP and the debt/GDP ratio. Part of the equation is investment — and this includes interest. Think about it.
Interest is just a transfer of income from borrower to lender, so not clear what your point is. Investment spending will depend on both interest rates and ROI and the ROI will be determined in part by relative prices and the relative growth rates of different economic sectors. There is not a simple rule of thumb, there are multiple intersecting factors that determine the outcome and it can never be predicted accurately in advance. Human behavior is not easy to predict.
2018-12-28 Oman Production of Crude Oil & Condensate MTBE
October 995.3 kb/day … Up +5.1 from September
Average during 2017 was 970 kb/day
Chart https://pbs.twimg.com/media/DtFMgL8WkAA2f3M.jpg
2018-11-28 (Platts) Fujairah faces the added complication of US sanctions on Iran, which includes exports of fuel oil. Fujairah has traditionally been reliant on Iran for the bulk of its fuel oil supply
Platts link: https://fujairah.platts.com/fujairah/#analyst
Total Products 17,170 kb down -3,354 kb w/w
Chart https://pbs.twimg.com/media/DtFdj4mWkAADPxi.jpg
Japanese Inventories – Weekly Change (million barrels)
Crude Oil: +4.25
Total Distillates: +1.81
Total (Crude + Products): +6.06
Chart https://pbs.twimg.com/media/DtFfa32WoAM9F5x.jpg
[…] Peakoilbarrel.com […]