A Guest Post by Guy Minton
(Details for the chart above are explained in the post.)
The Texas Railroad Commission (RRC) had the oil and gas production reported online in early 2005, and became fully online for producers and the public on Feb 14, 2005. At the time it was set up, it required the producers to input their production in the production file for existing approved leases, and in the pending lease data file for those leases which have not yet received an approved lease number by the RRC. Each month, the RRC only reports the oil and condensate that is currently updated that month which is in the production file.
Historically, the production did not seem to be completely reported. The lag time to near full reporting of RRC production went from almost 18 months, down to about nine months within the past two years. Even at nine months it leaves interested parties trying to find some way to estimate what current Texas oil production is.
EIA, of course, has been one of those interested parties. RRC, also, attempted to provide an estimate of current production from the initial report of the production file. The two entities were not close, at times, and left many calling RRC to find out why there was a discrepancy. Eventually, RRC stopped reporting an estimate, leaving EIA to be the primary estimator for Texas production in the month it is reported. EIA has improved its method, which is described on their website. Basically, it involves using drillinginfo.com current estimates compared to production reports sent in by the majority of the producers. That is simplified, as it is a massive effort to estimate Texas production for the current reporting month.
Others, have tried their methods to estimate the production, the most successful being Dean Fantazzini, who is the Deputy Chair of Econometrics and Mathematical Methods in the Economics Department of the prestigious Moscow State University. Dean has been kind enough to lend us some of the supporting data in our effort. Others have been successful, at times, only to find they were way off, later.
If EIA involves such an expensive, and massive undertaking, why would we question the monthly data as reported by the EIA? Because, within the past six months, the estimations could not come close to what EIA was reporting, so that raised the question, why? The data reported by EIA was as much as 500k or more different than a lot of the estimates.
From discussions, we learned of the Pending Lease file, and wondered if it held any clues. This was the end of November 2017, and we found that beginning December 1, the Pending Lease file would no longer be in Oracle format, but downloadable as a text (csv) file. Requests for that file could be obtained by contacting Ernest Oviedo, Digital Data Coordinator at digital@rrc.texas.gov for the grand sum of $10. The file would contain data going back to 2005. So, we obtained September data, sorted and totaled about 3 years of the data. Then we added that to the initial reported data for each month. Chart below shows the resulting estimate.
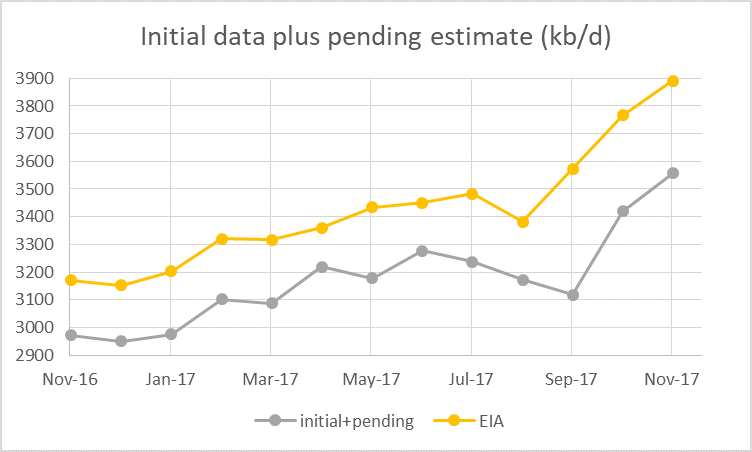
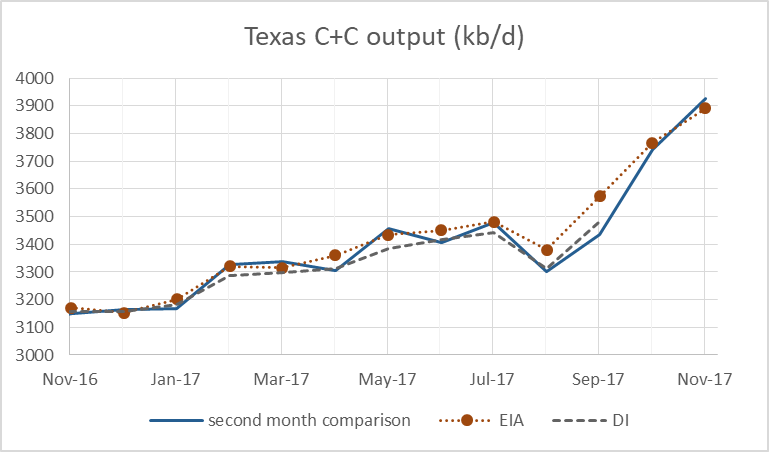
What was clear, was that the reason for the difference between the estimates and the EIA was because the Pending Lease file has been increasing the past six months, dramatically. It went from 225k barrels per day in January 2017 to over 800k barrels per day currently. We believed that the pending lease file could assist in projecting what the current month’s production is, so we decided to try again the next month and see if the pending lease file increased from the previous month’s reporting. It did, and we decided to see what it would look like for that month if we added the “second month production”. That would be defined as what is reported for September in the production file, as October’s data was released. It was very, very close to EIA figures. With the caveat, that August pending data file actually had another increase (third month), and that is what made it close. We tried November’s reports to see if there was any more increases. There were not, and December’s pending lease file did not increase either. Chart below shows the “second month” estimate with EIA and Drilling Info (DI) data shown for comparison.
So, yes, Texas does report most of its production within two months. Having only one month to jump to, makes estimations a little easier. Sometimes, you may have to adjust the third month back, slightly, to make the leap. For instance, while it is not reflected in the chart above, if we used the third month in pending lease data and production file, it brings September within 10k barrels of EIA monthlies. Care has to be taken not to add the leases that have a “y” coded to it indicating that the file has been moved to the production report, otherwise, you include it twice.
So, basically, these numbers are not estimations (except the most recent month), but are actual production. The logic behind that might not be so mystifying. Royalty owners have to be paid a month after the last month production. Exceptions are made for new leases that have to be paid within 120 days. But that 120 days is not four months for any practical purpose, it is three months. Producers only pay once a month, based on what they produced the previous month, so four months gets squeezed to three maximum. When the royalty owner gets his check and production data, many are going to go straight to the RRC site and see if production matches. If they can’t find it, RRC gets a complaint of late reporting by the producer. Enough of that, and they get shut down. Yes, RRC does report pending lease data to the public, but only if you are looking for a particular well, or producer. Not for all leases. Why? I don’t know, but have put in a request to RRC to discuss this with someone.
Before we malign the RRC for hiding data, remember, it is only $10 for the total, and free to royalty owners. Probably, there is no budget for what we are looking for within RRC. EIA maligns them, because if you check EIA’s website, they tell you Texas has delayed reporting of their production of almost nine months, and they can’t use that data. But they do, indirectly, as drillinginfo.com pulls that pending data file directly from the RRC website, and EIA relies on drillingingo.com data.
I am not saying we are the first to know this, as drillinginfo.com has had to have figured it out, but that is proprietary information.
In regards to estimating the most recent month’s production and pending data file, we could enlist Dean’s help with mathematics, or take the simple approach and use EIA’s monthly data, which can always be compared to the second or third month’s actual production data from RRC later.Why reinvent the wheel? The EIA has already required a huge expense from the private sector in manpower, expense from their own organization, and are using data from drillinginfo.com. Drillinginfo.com has, no doubt, a huge expense to gather and update the info from RRC. We proved they are doing a good job, so why fix something that isn’t broken?
An alternative for the most recent month is to use the EIA 914 survey divided by 0.9, this is slightly lower than the EIA estimate in most cases. Chart below takes the average of EIA, drilling info, Guy Minton’s method and 914 survey divided by 0.903 (average of past 25 months up to Aug 2017 comparing 914 survey to drilling info, drilling info is probably the best estimate up to Aug 2017). After Sept 2017, three estimates used (DI dropped), and only two estimates for Dec 2017 (EIA and 914/0.903).
That’s consistent and close. You would find out any difference the next month, anyway. It does seem to appear that their is a very slight underestimating, currently, by the EIA. The DI for nine months back is the real gage, as that is Texas final, pretty much.
There are alternatives, although yours is a great one. Mine had a little more moving parts for estimating December. Basically, regular production had not moved much from the previous. Pending initial increased 41 from the initial pending in Nov. For the past three months, second month increase in pending has remained about the same. So, I just added 41 to the second month’s total of 3912. Or, 3952. Yours is much simpler, and probably better, because remaining the same is not to be expected.
When I first started off, I went to the first report data in the chart above, and put an average difference of 222k barrels, which usually got within 50k, but yours is closer.
Hi Guym,
Note that the 914 survey divided by 0.9 is simply a suggested alternative, especially for the most recent month (December at present). I think your method is just as good and probably better as it relies on RRC data directly. The drilling info data is also pretty good through August or perhaps September. I think no method is perfect, but maybe averaging several different approaches may be the way to go.
Item:
Given refinery gain is added to US oil production, and Venezuelan oil imports to the US have cratered, and imports in general ditto, that refinery gain on that imported oil should have disappeared. Ya, the products get exported to wherever, south america, but still, that refinery gain (read US oil production) is lost.
Is internal production overwhelming this loss of “production”?
Watcher,
Refinery gain is not added to reported C+C production by the EIA, this is only included in “total liquids” numbers which include NGL, biofuels, as well as refinery gain.
The “total liquids” number is only useful if reported by mass or in energy terms (boe, joules, or BTU), in my opinion.
You Kenia, its a bit harder to get Refinery gain out of light crudes, so if imports of extra heavy blends are cut back, then refinery gains might cone down. But I suspect they are importing crudes with the heavies to replace the Venezuela crudes.
Why doesn’t the RRC just include the pending numbers and then correct it as they go, just like now. It probably costs them more to administer the sales of the file than they get in revenue anyway.
I don’t think they are trying to make money on the sales, just offset a small part of the cost. Administrative costs for maintaining this file in good condition over time is probably a factor. It has two purposes for a short period of time, in that forces operators to report production, and it makes queries available to royalty owners for Wells not reported in the production file. So, for a few months this file has some information value. Then you have thousands of operators going in to transfer the data from pending to actual. They manually enter the data in the production file, and eliminate it from being counted as active in the pending data file for each month reported as a Y in a data entry. That’s not always done. I have found pending data from years past not marked with a Y, and sure enough there are ghost pending data on those wells in queries for those months, way back. They simply do not make these files interactive enough, with any bulletproofing. They concentrate on the production file in reporting, only.
It is beyond me, why the RRC would allow themselves to look like they don’t care about how long it takes to report oil based on the untimely production report, when the data could be fixed at far less of the cost EIA is demanding from the operators, and their own internal operations. Can’t get anyone with some authority to reply, yet.
There has to be some serious programming going on at drillinginfo to filter this.
This is a very old argument on POB that reminds me of the Energizer bunny; I tried to explain how this works 4 years ago. Enno Peters and I worked on Texas production reported under drilling permit numbers (pending files) vs. lease identification numbers over a year ago. The data has always been there, one just has to look for it. Producers, which I are on, must report production every month for production the prior month; new wells, old wells…barrels represent dollars and the accounting is precise and immediate. The barrels sold must jive precisely with the barrels bought and purchasers must file their own reports of barrels bought off each lease to the TRRC. $11.6 billion were disbursed to royalty owners and taxing authorities in 2017, all of it paid on time, and correctly.
Operators file production under drilling permit numbers until the TRRC can process thousands of completion filings and commingling permits on multiple well leases, or PSA type “units.” The TRRC is understaffed, its employees poorly paid, and it is just overloaded. It takes time to process 500 new wells a month, or whatever. There are completion filings that often need to be revised and or corrected until released from pending to lease numbers.
The TRRC handles it’s data the way it wants, or can, and frankly I don’t find it a mystery at all why it does not coddle to data hounds. Its obligation is to royalty owners and taxing authorities in Texas. Dennis once said that anybody living in Texas should be embarrassed by the way the TRRC practices its reporting and that is insulting dung heap. It does its job. Its Texas.
Some folks seem to need to make estimating an exact science. It ain’t. Golf, I am told, makes a good hobby.
Ok, but we proved they are reporting it within two months with hard data that we shared. Also, explained in detail how someone with $10 can do the same thing with only excel spreadsheet abilities. There is no magic here. I am not demeaning the RRC, just explaining how to get there. I have talked with individuals at the RRC, and they are most helpful to explain what they know. Understaffed, no doubt. I have no doubt it has been discussed before, and that the conclusion was RRC was doing their job. We just proved it with totals, and for that we are demeaning RRC? Hardly.
That was really my thought – it doesn’t seem particularly difficult to show more meaningful numbers, so I wondered if maybe something to do with data protection.
It’s all public information at any time, anyway. I think it is mostly related to costs associated with that upkeep. As Mike indicates, they are peddling as fast as they can with budgets, no doubt. But, again, to everyone: it is not about estimates, at this point. Anyone can do that, if they have hard numbers from the previous month, and some numbers to work with in the currrnt month (production and pending). The main point is that you no longer have to estimate for months. Only one month, as RRC is doing what it is supposed to do. Being a data hound is in my nature, as being a CPA is my vocation. I also live in Texas, and have income producing properties, so I am interested in Texas production. I don’t know the first thing about drilling a well, but data is damn important.
You have done a fine job further explaining all this, Guym; I am simply saying it was never necessary to estimate Texas production to the extent it was being estimated. You have clarified that. I am no ‘protector’ of the TRRC; it simply does no good to rag on it, or to insult Texans about it, as others feel it necessary to do. The Commission is not going to change. I am busy getting the shit out of the ground to care too much about long term production trends for stinking shale wells; its going down, that’s all I need to know. If data is your deal, goodonya. Ignore the IEA and EIA completely, however; neither knows come here from sic ‘um. https://www.oilystuffblog.com/single-post/2018/03/05/Leaky-O-Rings
In collecting and presenting actual reported data IEA and EIA are excellent, I have never seen any problems. But neither of them hold a light to BOEM/BSEE who have the best government data site by far. Hopefully their regulatory control and resource management is as good, and since the reorganisation after Deep Horizon I have no reason to think they aren’t.
All fall down a bit on estimating unknown data sometimes, but i’m not sure how much you can expect, and all are quite poor on forecasts for the future. It’s not just that they are frequently wrong it’s that they are always wrong on the high side of the production trend.
Hi George,
Mostly that is correct. If one looks back at EIA forecasts from 2008 or so (AEO 2008), you will find that the forecast for US C+C output was too low, especially for 2014 to 2017.
So it is not quite correct to suggest that the forecasts are always too high.
I’ll make sure I put an “almost” qualifier in there next time.
One of the “estimators” was in Houston, trying to confuse the conference. That is funny.
Hi Mike,
As Guym has showed, the EIA C+C output estimates for Texas are pretty damn good.
If you are talking about EIA or IEA production forecasts, I agree those are not great (or at minimum they seem quite optimistic).
Hi Mike,
I apologize for saying that, I just don’t understand why some states can accomplish this in a timely fashion and other states cannot.
Hey if Texans think its ok, that is all that really matters.
Maybe the EIA should pay Texas to straighten things out rather than waste a lot of money, and the money of large oil companies who are required to fill out the 914 survey.
Did you and Enno find it an easy job to match up the thousands of wells which are not included in the PDQ data?
Seems this should be easier for the public to access, total C+C output in Texas that is.
Basically nobody really knows what it is, not for any month from Oct 2017 to December 2017.
Perhaps you know, but the secret is well kept. 🙂
I think it is because Texas is Texas and for the most part, Texas does not care. We have been at this for almost a century… production goes up, it goes down, its just the oil business. The shale oil business is just another play, another big deal for the moment. There are thousands of big plays in our history but unlike the stinking shale oil phenomena, most of those big plays required 1/100th the number of wells. The people that need to know about oil production in Texas, know. You and Mr. Kaplan are of course correct, both the EIA and the IEA agencies do pretty well collecting data, but suck at making guesses.
That is a grave disservice to American’s and to the world. Making guesses are dangerous. For trying to understand the role that shale oil will play in our future, folks must rely on the shale oil industry itself, who lies thru its oily teeth every millisecond, like light impulses, or it must rely on the EIA or the IEA, who are minions. Everyone has an agenda and everyone lies for reasons I can’t even understand anymore. But lying creates false security, and hope for the future, it prohibits conservation and rational thought about foreign policy, about reservoir management, changes the way people look at renewables and investment in renewables and…its a bad deal. People should not accept lying under any circumstances and I am ashamed of the US LTO industry for its lying. The dickheads.
Who gets the CERA weenie-neck of the week award? Rick Perry, who says that not using fossil fuels is “immoral.” Attaboy, Rick. You knotheads are going to lose in 2020 by a tidal wave and as a conservative…you are an idiot. They are eating pelicans in Venezuela because, in part, of US sanctions and you say its immoral because poor countries need to produce oil to survive? How about reeling in your beloved LTO industry in cooperation with OPEC and Russia to raise prices, to the benefit of the rest of the world? I can’t believe I voted for you, dude.
America is being led by the blind. Mark Papa is right, somebody needs to step up and tell the truth.
Mike,
Someone will be coming out with some NASTY truth on the tremendous amount of fraud taking place in one of the larger shale oil companies. Look for the next BIG ENRON, but this one will probably take down a good percentage of the U.S. Shale Oil Industry with it.
steve
Looking forward to it
One question for those living in Texas:
Do you notice this huge fracking boom? I think with all this fracking going on, roads and interstates should be crowded with trucks transporting supply of any kind or driving back empty to fetch more. Motels should be booked out for years, temporary housing extra expensive?
I notice an economic boom here in Germany when truck on the Autobahn (Interstate) are driving bumper to bumper in 10 miles or longer queues providing supplies for factories.
I did a search about a month back to see if housing was becoming more expensive in the Midland Odessa area. I found plenty of available apartments at reasonable prices. I believe most quarters are made available by man camp style. Also, in their efforts to cut costs, they have tried to make operations less person intensive. We will see how that works out for drivers. There is definitely a dearth of drivers. I live in Fort Worth, and see a lot more trucks on the road, but nothing creating bumper to bumper, except during normal rush hours. It’s over a five hour drive from Fort Worth to Midland Odessa. I can’t give any account for what it looks like out there. Loving County is much further away, and only has a population of several hundred people. Two cars in ten minutes would be rush hour to them.
No we dont. Texas is much larger than Germany and the boom takes place in less populated areas.
Yeah, the boom is in a deeply rural area. More rural than the part of North Dakota which had the previous fracking boom. The people *in* the area probably notice it, but anyone outside wouldn’t.
Thanks Guy for this interesting post. As I told you directly, it is my intention to write an academic paper about it when I will finish my current (heavy) workload.
Thank you for the data, and Dennis for bearing with me, and the charts. If you need any additional info, I will be glad to help.
Thanks Dean for sharing your data as we would not have the “second month” data from April 2014 to December 2017 without your work.
Thanks Guy for sharing this interesting way of determining Texas output in near real time. Some Texans may not care what Texas output is, but I am glad that you do.
Thus far WTI is trying to hold in the $55-65 range. Concerned still about a replay of 2017 oil prices. Held a lot of promise, but 2017 ended up being a year of little to no earnings for US shale, when the one time tax benefit of the corporate tax cut is excluded.
Wish I could get a good handle on PB well costs. I am thinking many are above $9 million, based on lateral length, stages, proponent use and escalating service costs.
Will be interesting over time to see who ends up operating the hundreds of thousands of shale wells in the USA.
Also interesting to see XOM announced plans to increase CAPEX in PB in future years, and the stock dropped.
It is interesting to see XOM trading at such low levels. It is as if it’s midstream and downstream assets are deemed worthless? XOM produces 4 million BOEPD, those barrels are valued at less per than almost all US shale, and that is putting zero value on any other XOM assset.
General Electric’s share-price collapse is a reminder that investing in a company based solely on past reputation and dividend yield is dangerous.
The oil giant was one of the world’s most-respected companies. Its stock was passed from generation to generation, often with a deathbed whisper “Never sell Exxon.” And for a long time, if you listened to that whisper you grew richer as Exxon continued to grow earnings, raise its dividend, and buy-back stock.
These days are long gone. Today Exxon is slipping into the sunset. The company has been in self-liquidation, but investors never got the memo.
Over the past 10 years Exxon spent $275 billion returning money to shareholders through dividends and stock buybacks while earning $318 billion of net income. On the surface these numbers look great. There is only one problem: Exxon’s reported earnings dramatically overstate the company’s true earning power. Finding new oil and extracting it has become much more expensive, and thus Exxon’s capital expenditures — the cash it spends on replenishing reserves and extracting oil — significantly exceed the company’s depreciation expense (an income-statement figure).
https://www.marketwatch.com/story/this-popular-dow-stock-looks-ready-to-join-ge-on-the-discard-pile-2018-03-13
Concho, being entirely in the Permian, is a relatively good data source for this kind of information. For 2017, they report (if you divide the numbers yourself) a total exploration and development cost of $8.37 million per NET well. This includes increases in drilling in progress, and DUCs, and subtracts royalty interest from the number of wells, so we have to be looking at something around $7 million or less actual cost for a well of on average 8100′ and frac’ed to 2100#/lateral foot.
2015 was 5300′ and 1500#. The smaller players are greatly trailing this.
Enno Peters has a great site, but you need to be very careful about comparing the cost of a modern large well to the revenue derived from a much older, smaller and cheaper well.
Estimation of future revenue based on historical production is always a bit of a hand wave, but when I look at Permian wells of I know to be around 10000′ lateral length, on Enno’s site, they pretty much all, regardless of location seem to give 10-year oil output around 300,000 barrels. Smaller wells don’t differ much from this, either, when normalized by length.
So, taking actual Concho realized revenue of $48/barrel for 2017 gives $14.4 million oil revenue over 10 years, but about half in the first year. Adding proportional gas and gas liquids revenue gives around $18 million, for a well which should cost around $8-9 million. Add in interest, corporate overhead, royalties, relatively high operating costs (~$12/bbl), even relatively high acquisition costs, and it’s still moderately but not spectacularly profitable, pretty much perfectly in line with reported results.
Note that, without the relatively small gas revenue, it’s an unprofitable venture at 2017 oil prices. It’s not terribly improbable for local spot gas prices to collapse in the future as pipelines fill up.
No, Permian producers aren’t worried about a rerun of 2017. They’re perfectly fine with a rerun of 2017. They’re worried about a rerun of 2015 or 2016.
And, yes, completion cost is up, but no, not to the point that it seriously starts to affect margins…yet. But if it does get to that point, completion costs will only stay up if completions (or at least completion effort) remains up from current levels, so it can seriously slow production growth but not reduce production.
XOM’s essentially worthless.
The existing oil wells would be worth something, if not for the rest of the company. Particularly the management, who have shown a talent for destroying value.
Money spent on exploration and development has consistently been wasted for over 15 years — burnt. Found nothing. Worthless. This is a sign of *bad management*, which leads to lower valuations for the company. Any news of increased upstream capex is basically “we’re going to set more money on fire”, and is understood as such by Wall Street. Of course the stock dropped.
Upstream has lost money for Exxon repeatedly over the last several years.
Transportation is a business which will shrink, which has high fixed costs and low variable costs — this is a bad business.
Refining has overcapacity and is going to require expensive retooling. If Exxon revealed that they were refocusing refineries on jet fuel and plastics, it would probably be considered positive, but they’re still making mostly gasoline and diesel.
Refining is starting to lose money for Exxon too.
Petrochemicals and plastics — well, Exxon just isn’t the biggest player. Wall Street expects DowDuPont to outcompete Exxon.
Acquisitions? All money-losing.
Ther’es just no positives for Exxon.
NEW U.S. RECORD-LEVEL OIL PRODUCTION! PEAK OIL THEORY DISPROVEN! NOT.
http://www.resilience.org/stories/2018-03-06/new-u-s-record-level-oil-production-peak-oil-theory-disproven-not/
Richard Heinberg has this article, which is fairly standard stuff about LTO, no profit, debt, lack of discoveries etc. But it has the chart below showing a peak in August 2015 and a decline, to which he makes absolutely no reference. Is this the latest data or what, I think not quite what EIA and IEA have presented? The decline of conventional oil is higher than I had expected, but I think he excludes deep water there as unconventional (I think that is the Lahererre normal way as a lot of it is still in source rock). It’s also labelled as oil but is actually liquids and therefore includes a lot of NGL.
He lost my interest in it, when he started off by implying $150 oil precipitated the financial crises of 2008. There may be some facts somewhere in it, but don’t start off with absolute BS. Someone needs to set him down in a Mr. Rogers class, and say: “kids can you spell derivatives?”.
Yes, it was interest rates rise because of 150 dollar oil, not the 150 oil itself. Also 3 fold increase in commodities prices, because of 150 dollar oil, could have also played a “little” role. In fact it was 100% the cause. If now oil would go to 150, some other weak link in global economy would break, and it would be blamed, not the real cause.
It probably passed over into other derivatives as the market plunged, but it started with mortgage derivatives. Big time with mortgage derivatives. Margin calls. And we did not learn a single important lesson from that. The derivatives were piled a mile high on mortgages, because they were safe. Bear sterns, Lehman Brothers, AIG, Congress initially failing to pass a bank bailou, do those ring bells?
I know this may be classified as non-oil, but the reason I am elaborating is because I am tired of know it alls blaming the 2008 crash on oil at $150 a barrel. They either were not old enough to remember it all, or too forgetful to remember huge facts. Construction went crazy to 2006, because all you needed to get a loan on a new house is if they saw you beathing occasionaly. Prices skyrocketed unti 2006, and then started to drop. The bubble. 2007 saw much longer unemployment lines from the housing construction industry. The mortgage industry started getting real sickly in 2007. Loans started to go bad then, and construction still suffered. It came to a head in Oct 2008, when Congress initially voted not to assist the banking industry over bad loans. Stock market cratered then. It wouldn’t have been so bad just with the bad loans, but the derivative market was much, much bigger than the outstanding loans. Oil did not have a thing to do with those facts.
but then how to explain that the derivatives market hasn’t really diminished and in fact leveraging in general has only escalated relentlessly since 2008 onward? in fact the major response by the banking system has been to juice the entire global public and private with nothing but financial leverage and instruments. but yet it still runs – the largest bubble, an everything bubble, largest in human history. so bubbles do not “of themselves” pop. something must pop them.
so bubbles run until they can’ t get fed – and when commodity prices went up in 2007 – 2008 it squeezed the marginal buyer of housing and even a lot of construction companies and crashed the system as you describe above. oil was a part of that. people were buying houses 1 to 3 hours from work with a razor thin to negative budget and hoping they could “make it work”. well when their commuting fuel bill doubled that broke a lot of budgets in places like California.
2cats:
I distinctly remember reading about that at the time. There were some new exurbs well outside of Los Angeles that turned into ghost towns as no one could afford the commute.
this is what I found now:
https://www.csmonitor.com/Business/2008/0725/p03s02-usec.html
And the twenty thousand dollars in incentives they were offering and nobody was taking wouldn’t make up for extra gasoline costs? It was the popped housing bubble. The homes used to sell for 370,000, now they couldn’t get an offer at 259,900? Yeah, it got a lot worse than that later. So, in 2009. When oil was at forty, home sales in the area surged? Naw, the air from the bubble did not stop for long after that.
People all over the nation were using the increase in value of their homes up to 2006 as a piggy bank. Run out of money, get some more on another, or second mortgage. It just popped, and oil prices did not pop it.
Hi Guym,
Population in that city (Victorville, CA) grew 5.5% from April 2010 to July 2016.
I agree it was more than just oil prices that caused the financial crisis, it was mostly due to a lack of banking regulation, oil prices might have played a role, but I agree it was not a major role.
In fact people seem to forget that the economy recovered while oil prices were high from 2011 to 2014, and the fall in oil prices in 2015 did not cause a spurt in economic growth.
The price of oil plays a very small role in the big picture of macroeconomics, in my view.
There may be some oil price where it becomes a major factor, but my guess is that the oil price where it becomes an important factor would be about $160/b or more (in 2018 $).
To Dennis. 2010 was in the beginning of the new upswing. I bought another home in 2010, which lost half its value up to that point. Increased very slowly, at first. I even had a mortgage license and company from that period up til 2015, so I was constantly keeping up with the housing industry until then. What happened, and the direction it was going. Up until that time, I went back and got two masters degrees in the UT system, and the A&M system to catch back up for my taxation at age 60, while the bubble was popping, and after. It was heavily discussed. Not once was oil mentioned as a primary factor.
I got burned in the dot com bubble as an investor, but the housing bubble affected the whole economy, not just the investor. It was a Main Street event which lasted years.
Yes, those bad loans should never have been written. However, to complicate things, there was an over reaction. It went from the underwriter asking if they signed the form that they made enough money to pay for it, to underwriters acting in fear of the new regulations. Had a loan turned down, because of a potential foundation problems. In the inspection, the inspector clearly did not indicate a foundation problem. However, in one of the fuzzy pictures, Fido’s actions had caused a dark spot, causing the underwriter to identify that as a foundation problem. It was a pier and beam, with concrete blocks surrounding it.
Hi Guym,
Agreed, the reason for the popping of a bubble is always multi-faceted and usually no single cause can be proven.
It does seem logical that gasoline prices at $4/gallon or higher may have played some role in pushing a few mortgages in exburbs into default.
Your point is that those mortgages should never have been originated in the first place (I think that is what you are saying). If I am interpreting you correctly, I agree.
Oil prices likely played a minor role, or perhaps no role at all in the Global Financial Crisis (GFC).
He was correct. $150 oil was the catalyst that diverted money away from other sectors of the economy and began the process.
The severity of what came next was exacerbated by the financial shenanigans going on at the time
As the damage to the economy was done by 2007, and unemployment spikes long before 2008, I fail to see oil price as a factor, as it was in the $80 range during that time. I assume you can give some credible references for this wild statement?
The beginning of the first time homebuyer credits started in April of 2008, because the construction industry was in shambles before then. $80 oil did not precipitate all of these problems.
Although, there is some argument that oil investment greed was a factor, but I think no more than any other greed that is a constant in the equation of Wall Street;
http://www.resilience.org/stories/2009-12-08/was-volatility-price-oil-cause-2008-financial-crisis/
Hi George Kaplan,
Laherrere typically divides crude plus condensate into extra heavy and “everything else” with an API Gravity>10. It is Colin Campbell that has a very narrow definition of “conventional oil”, excluding oil sands, Arctic oil, and deepwater offshore.
An alternative definition is used by the USGS which distinquishes “continuous oil” with other types (conventional). The “continuous” oil would include Laherrere’s “extra heavy” oil as well as LTO.
He definitely has treated deep water as separate as here:
http://www.theoildrum.com/node/9169
I think it’s not whether it’s source rock as I said, it’s whether there is a water contact that he uses, but I can’t find where he specifically discussed that for deep water.
Hi George,
I stand corrected.
In other presentations he has focused less on deep water.
Many of Mr. Laherrere’s presentations are at the link below
http://aspofrance.viabloga.com/texts/documents
I was specifically thinking of the following publication from Feb 2013, Oil & gas production forecasts 1900-2100
http://aspofrance.viabloga.com/files/JL_2013_oilgasprodforecasts.pdf
I think it is interesting to look at what happened to “non-shale state” producing states in the lower 48 over the last three years. Compare 11/14 to 11/17 for each of the following states (BO in thousands):
Florida 183 down to 148
New York 29 down to 18
Illinois 778 down to 701
Indiana 223 down to 146
Kansas 4078 down to 2919
Michigan 579 down to 445
Missouri 14 down to 8
Nebraska 279 down to 178
South Dakota 150 down to 103
Tennessee 27 down to 24
Alabama 849 down to 526
Louisiana 5,524 down to 4,011
Mississippi 2,156 down to 1,476
Utah 3,446 down to 2,772
Arizona 4 down to 1
California 17,085 down to 14,215
Nevada 25 down to 24
The rig count has been almost zero in all states for most of the last three years. Very little drilling going on in any of them.
Might give an idea of what is going on in other parts of the onshore world where rig counts are very low historically?
The problem I see is the lack of secondary and tertiary recovery methods for shale to date. EOG apparently has had some success, as has a company by the name of Granite, in Canada. Hopefully there will be some more breakthroughs. If not, expect a rapid decline in shale once the peak is hit.
I keep going back to the history of our little very old field, which will be 113 years old later this year. Annual production during the Great Depression was not much higher than it is today. However, right after WW2, major waterflood projects were implemented, which increased production to over 5 times the bottom hit during the Great Depression. It took over 60 years for annual production to drop back down below the Great Depression levels.
I suspect secondary and tertiary recovery has been extremely important to most fields in the world that have produced in excess of 100 million BO. Without secondary and tertiary recovery, the world would have had a major shortage a long time ago.
I have a difficult time conceptually with how secondary and/or tertiary recovery methods will work in shale. We have tight oil zones below our sandstone and dolomite pays. All waterflood efforts have been completely unsuccessful.
However, I am not a geologist, petroleum engineer or any other type of professional, so I stand to be corrected. In summary, the secondary and tertiary recovery methods not only have recovered enormous amounts of oil, they have greatly flattened decline. Worried shale will not see the same thing.
Diffusional flow from a reservoir causes a 1/time or 1/sqrt(time) decline over a long stretch. This is very gradual compared to damped exponential declines that many seem to favor. It explains why stripper wells seem to keep going for years. They would be long dead if an exponential decline were operable.
SS – I think it’s very difficult to be able to get a sweep through the rock with fractured shale. The fractures only have one opening so you’d have to get stuff to go in and then come out again. Voidage replacement works best if started immediately; in the shale the best production has already been depleted to dead oil. So I’d guess you have to go directly to some sort of tertiary mechanism that lightens the oil and makes it mobile again. If you drill a second well it’s difficult to be specific with where the injected material goes. EOG (if I remember correctly, but definitely someone) are trying with gas on groupings of wells. I can see if successful you might get a longer tail, but not much of a production boost.
Coffee gave this link (he referred to 100% recovery (improvement?) IIRC)
EOG Resources disclosed that it had found a way to get from 30 to 70% more oil from Eagle Ford shale wells….Based on lab results, natural gas injection should be able to extract more oil from Bakken rock. Small samples from various parts of the Middle Bakken were tested by the University of North Dakota’s Energy and Environmental Research Center (EERC). When exposed to natural gas or CO2, the chips produced more than 90% of the oil in the rock samples within 24 hours
https://www.spe.org/en/jpt/jpt-article-detail/?art=3391
the article’s photo of young scientists/engineers has a medical MRI scanner in the background, for some reason. I dont know what would happen to that kit if exposed to those MRI magnetic fields.
Ian
The EERC folks, as shown by the several presentations from Steve Hawthorne, found that ethane is by far the best gas to use to get mobility from Bakken samples (100% over a few hours at 500 psi).
The speculation is that the high temperatures (129C) play a big role.
A few months back, Core Lab was doing a Bakken EOR field test using a confidential mix of gasses..
I have not heard any followup on this project.
I posted that one about a month ago, but I really like to see the potential of enhanced recovery revisited. EOG in their latest dog and pony show indicated that they continue to get 30% to 70% more in 2017 (started in 2016) and will continue the testing into 2018. Tests include in excess of 100 wells.
Shallow
I just came across QEP’s somewhat detailed explanation of what they are attempting in the Permian with 330 foot spacing by manipulating the induced, elevated formation pressure from frac’d, but not yet producing, wells.
The 3 and 4 quarter presentations have the graphics along with the conference call transcripts which go into a little more detail.
Essentially, they are adding 2 to 3 thousand psi into the formation with injected water while fracturing, unsaid is the use of diverters to control the pressurized region.
This is why there is such a high (150,000/200,000 barrels) amounts of produced water coming from Bakken wells this past year.
These guys continue to modify the completion procedures to maximize production.
Continue to find shaleprofile.com displays very interesting data. Thank you Enno!!
Looking at October, 2017 US, and excluding the “shale gas” regions such as Marcellus and Haynesville.
4,468,131 BOPD from 65,827 wells.
2,665,523 BOPD from 10,787 wells with first production 1/1/2016- 10/31/2017
1,082,671 BOPD from 21,934 wells with first production 1/1/2014-12/31/2015
719,937 BOPD from 33,106 wells with first production 1/1/2005-12/31/2013
So, 21.75 BOPD average for each of the 33,106 wells that are from just under 5 to almost 13 years old.
Maybe the thinking is if USA drills 500,000 shale wells USA will have 10 million BOPD of fairly steady production for many years?
I may be getting my math wrong, but figuring with land and infrastructure looking at $10 million per well, or $5 trillion dollars? Is this the goal?
From my experience “steady” doesn’t work. Whenever we reached a nice operating plateau we were always asked if we could accelerate some production and push the maximum.
In an interview at CERA Bob Dudley of BP said this:
https://www.bloomberg.com/news/articles/2018-03-09/down-is-up-as-aging-oil-fields-defy-gravity-to-pump-more-crude
That was after his speech transcribed here:
https://www.bp.com/content/dam/bp/en/corporate/pdf/speeches/cera-week-2018-bob-dudley.pdf
I think the interesting thing is what he didn’t say: no real emphasis on new discoveries, new FIDs or new start-ups. Also in terms of BP I think he was being a bit disingenuous, the main reason they had negative decline is beacause they restarted Schiehalion and Loyal, mature fields which had been off line, through the new Glen Lyon FPSO which added up to 130 kbpd. They also added Thunder Horse South, a new production centre at 20 kbpd, but on a mature field. Most of their other fields continued to decline, like Azerbaijan. I don’t think BP is in great shape, they switched towards gas, but are running out of options there as well.
Overall IEA had decline rates dropping to 6% as below. This was supposed to be a surprise, but is it if you have to concentrate on near field developments because they are cheaper and with better return on investment, and because the big, new developments just aren’t available or cost too much. Field redevelopments really started to be important news in GoM and the North Sea last year, I think they wouldn’t have if there were good quality, new discoveries where the money could have been spent.
The world’s largest oil company is Russian (Rosneft), and so is the largest gas company (Gazprom).
This graph supports the thesis that oil companies adapted to the low price environment by extracting as fast as they could today at the expense of future production.
From the article:
But that might be catching up now: three major outages in GoM, continuous news of problems with the older fields in UK and, a bit less so, Norway, at least three major safety offshore incidents last year where production should have been shut in or drilling stopped but wasn’t (those from regimes with proper reporting requirements, other places might have to wait for headline producing accidents).
Also the last paragraph in that Bloomberg article:
“In countries like Brazil and Mexico, the slowdown at old fields jumped to double-digit rates last year, but things could change there, too, as they lure multibillion-dollar investments from oil majors to help them develop their riches.”
is rubbish. What other countries are there “like” Brazil and Mexico? The decline didn’t suddenly jump to double digits, it’s always been around there for the fields that come off plateau. And they aren’t looking for outside capital to reduce decline rates but to develop new fields.
I agree. “Negative decline” is baloney. I have turned fields around by drilling wells, installing high pressure water injection pumps, improving efficiency, doing workovers and recompletions, and installing larger well pumps. It takes a good staff driven to work extra hours, a decent budget, and having a management structure which allows a couple of persons to deal with the company higher ups, employees making sure permits arrive in time, and somebody in the trenches making sure things get done.
Canadian Crude Oil & Equivalent Production
average 2016, 3870 kb/day
average 2017, 4199 kb/day
December 2017, 4553 kb/day up +66 month/month
https://pbs.twimg.com/media/DX3mVXDWAAA3xIE.jpg
Canadian Crude Oil Closing Inventory
December 122 million barrels up +4.6 month/month
https://pbs.twimg.com/media/DX3nSbGXUAArJs4.jpg
Canadian Capex – oil and gas extraction industries – Yearly
https://pbs.twimg.com/media/DX3nmpyX0AApWhG.jpg
Canada has some serious transportation problems. Rig count is down, a little, and I read discount to crude was about $31?? You reported Brazil’s output was up a whopping 3k bpd over last month. Not including US, which we have no idea, yet; two of the three countries that IEA projects to produce close to 1.4 million bpd more in 2018, is not looking so healthy in growth.
On another note, Barclays just upped 2019 oil pice projection a couple bucks to $85. Keeps edging up. Even the banks have more fingers and toes to count with than EIA or IEA has. Citicorp says the inventory is now balanced, because EIA did not count drops in floating inventory, and many other places. (Like Saldanha Bay, Saudi Arabia, Brazil, ad nauseum.)
So, demand figure for 2017 is accurate, how?
Yes it is going to be difficult for Canada to increase production in 2018 because it costs more to transport it by rail but I don’t know one way or another…
Platts interviewed the CEO of Cenovus about rail, here is what he said
2018-03-06 https://pbs.twimg.com/media/DXn6gWzX0AAtBGT.jpg
I was just looking at Canadian exports, US imports. The chart is work in progress, I was going to look at net crude+products next.
https://pbs.twimg.com/media/DYCC1oBW4AMTsn7.jpg
Good info, thanks.
My model says $67 for year end 2018.
Fernando,
I looked around your blog for your “model” for oil prices.
Do you have a link?
Maybe this
https://21stcenturysocialcritic.blogspot.com/2016/07/world-oil-production-and-prices.html
It seems in that July 2016 post you expected about $80/b for the 2018 average price (in 2015 US$) and about $63/b in 2017, if we assume June 30, 2017 the price was $63/b and the oil price rises linearly to $80/b on June 30, 2018, that would be about $75/b at the end of March 2018 and $68/b at the end of February 2018.
Your forecast calls for $100/b by 2020, and then a slower rise in oil price to $135/b (2015$) by 2050. Interesting, thanks.
Hey Fernando,
Could you redo this forecast with x-axis 2000-2050? or even 2015-2050?
Hard to read on the 100 year x-axis.
I calculate that the current substitution price for oil — the price at which it’s cheaper to operate an electric car — is $26/bbl. Which means I’m watching EV production rates, pretty much exclusively.
My model says that EV production rates, globally, will exceed the growth of auto sales, globally, in 2 to 5 years (2019 to 2021). (And from then on, EV growth will continue to grow.) At that point, the number of gasoline cars on the road will drop continuously; the result will be continuously dropping demand for oil. I’m not sure when the demand drop will be faster than the natural decline rate of the fields, because I can’t pinpoint the decline rate of the fields. It’ll be less than 10 years after that, though.
The crucial point, however, is: when this happens, capital will dry up for the oil industry. Once total gasoline car sales are declining year over year, if you have the choice of throwing money down holes which might get a little bit of oil, or investing in an electric car factory, which would *you* choose?
As the capital disappears, so the wells can’t be “juiced” any more (nobody will give them the money to do that any more) we’ll finally see what the real decline rate is. If it’s on the high side, we’ll see one last oil price spike. If it’s on the low side, we won’t.
I’m not sure which it’ll be actually. At the moment I’m leaning towards sharp decline rates, as I think they’ve been juicing the fields a lot recently (producing more now at the expense of later), which would mean we’d get one more price spike.
That price spike won’t help the oil industry, though, because by the time it happens investors will know that electricity is a better investment.
Ohio just released 4th qtr. production results (almost all Utica).
The 503 Bcf produced is an astonishing 5.5 Bcfd, which is 38% higher than 4th qtr. 2016.
2017 was 24% higher than annual 2016 output.
Cowboyistan in the Buckeye State.
India oil imports
average 2016 4,296 kb/day
average 2017 4,329 kb/day
January 2017: 4,737 kb/day, up +119 kb/day month/month
(conversion, 7.3b/tonne) https://pbs.twimg.com/media/DX8i2D0W4AIb4mB.jpg
Longer term in tonnes per month (no conversion) https://pbs.twimg.com/media/DX8jCpIXcAAph5q.jpg
Surprisingly low growth rate.
Yes 2016 to 2017 looks flat, I don’t know enough about India’s economy and energy mix to say why. As you can see the latest number January 2018 at 4737 kb/day is up +10% from both of those yearly averages.
https://www.thehindubusinessline.com/markets/commodities/indias-2017-oil-demand-growth-posts-lowest-gain-since-2013/article10026236.ece/amp/
All demand seemed to have been screwed up by their policy. One time thing, it will probably resume 2018.
The writer does not seem aware that LPG is a major transportation fuel in India. He mentions incentives for its use in the households, but not for transportation.
There was talk several months ago about the elimination of particular money bills as inhibiting purchase of fuel. That would not seem to make very much sense however, in that the population did not decline nor did GDP and one has to consume oil to live. Puzzling.
https://oilprice.com/Latest-Energy-News/World-News/Venezuela-Sues-Oil-Traders-For-Corruption.html
Got them oil traders “quakin in their boots”!
That case will be interesting, because the claim says Rafael Ramirez oversaw the operation. However, the financial side was controlled by Erik Malpica Flores. Erik is Cilia Flores’ nephew, and Cilia is Maduro’s wife. Erik was found to have over a dozen Panama companies in the Panama papers, was transferred out of pdvsa and is now hiding in the presidential palace supposedly managing the cash flows being looted at this time. So what’s happening is a gang war between factions or mafias. It appears Maduro got mad at Ramirez for writing a few articles in Aporrea.org explaining Maduro was making a mess, and now he’s on the run.
Filed in the Southern US Dictict Court of Miami. Hazy concepts of fraud. Someone accepts a bribe for insider information of a company that does not involve stock sales. Illegal bribes are received by government employees. Bribes to company employees can get you fired, or sued by non-disclosure agreements. But can the damaged company sue the other company for paying off their employee? I’m sure they could, at least in a tortious interference claim. Surely is not FCPA status. However, when the person claiming the damage is someone with the moral standing of Maduro, I can’t see a judge swayed much by the plaintiff. I can’t help but thinking that requests by defendants can produce enough garbage to throw it out. How can you have tortious interference with a train wreck?
PVDSA is being sued by the Chinese, and now they are suing the Russians. Tough to find friends, nowadays.
https://seekingalpha.com/amp/article/4155197-permian-takeaway-capacity-issue-watch
Permian oil takeaway capacity. Definitely, some constraint. What I have read about gas pipeline constraint is tighter. I don’t see projections of 1.1 million increases fitting very well, here. Increasing completion costs, now steel price increases, temporary sand shortages, personnel shortages (including drivers), do seem to conspire against the “estimators” inspired projections. Though, logical increases might not be in the E&P thoughts. They could always flare the oil, along with the gas. RRC doesn’t seem to give a shit. Or, how about a bucket brigade from the Permian to Corpus.
The graphs in the link in my post above makes it look like local refining capacity is close to 700k bpd, although current capacity, I read is close to 300k bpd; which will only increase to 400k bpd by the end of 2018.
Should oil companies deserve all the income they can make, just based on the risks they make? I couldn’t imagine putting up 200 million plus on some cube, that I have no idea that the amount of oil out of it would even eventually pay out; then even if it could, I could not be sure of getting it to market. But, what the heck, it’s OPM, so that answers the risk question. I will never have 200 million, anyway. If I did, and put it into this, I would wind up being a Wall Street cliff jumper, long before I found out anything.
Do any of the technical guys on here think this will work?
http://www.networknewswire.com/petroteq-energy-inc-tsx-v-pqe-otcqx-pqeff-deploys-patented-oil-sands-extraction-technology-expand-production-capacity/
Doesn’t this company have a subsidiary that is involved with something to do with kleptocurrency? Sorry, probably uncalled for, but after losing a pretty nickel in the dot.com debacle, I am pretty skeptical.
I think I read that they were experimenting with blockchain but it’s as clear as pea soup to me. The reason I am sceptical about the recovery process is that I can not believe that the solvent can be reused indefinately.
Well, my memory is not great, but I read basically the same article about a year ago, and they were then MCW, and producing at the same level. They were trying to get investment money, so they could expand. Obviously got money, no expansion seen.
I evaluated this 10 years ago, told management to leave them alone. They have been open to being bought out. I seem to recall Shell bought a piece, but I may have the wrong outfit.
George posted a chart for Angola’s oil fields last month, this is Bloombergs version, essentially saying the same thing, I guess…
2018-03-11 (Bloomberg) In most cases, production from Angola’s deep-water fields peaks early and declines rapidly. Linking a number of fields into a single production unit and staggering their start-up can help to prolong plateau flows, but recent projects show that even this has a limited impact.
Start-up of Total SA’s Kaombo Norte project has been pushed back from 2017 to later this year, while the Chissonga project — which Total also acquired when it purchased Maersk Oil last year — was shelved indefinitely when oil prices collapsed in early 2016.
Chart https://pbs.twimg.com/media/DYARPH8VoAAO_3w.jpg
Article https://www.bloomberg.com/gadfly/articles/2018-03-11/opec-sacrificed-venezuela-angola-for-greater-good
For clarity Saturno is part of PSVM, Olombendo is part of the East Hub and Sangos part of the West Hub. I think they all have smaller fields that they plan to bring on that should arrest the decline a bit (or is the article saying that has already been done); but having said that there are few rigs operating there now (4 in Feb., up from 1 in Jan., but through 2014 they typically had 15 to 20). Kaombo Norte is this year but it’s identical sister ship (Sul) is next: delayed projects don’t always go through start-up very well.
Well IEA is counting on US oil getting well over one million barrels to add with Canada, Brazil, and not mentioned, but probably Kazakhstan to get supply to their very low demand of 1.4 million bpd average for 2018. Brazil is starting slow with 3k bpd in January increase. Canada is fighting transportation problems to increase, but even if they do, they can’t get to the rest of the world (the front door). Kazakhstan can maybe get up to 200k bpd?? Based on their own transportation problems, the US is probably only going to get about 800k bpd more, and even if they did get over one million, they would be hard pressed to get it out the front door. Then, you have decline rates that have been largely ignored, Venezuela is circling the drain, demand is, no doubt understated. While we may have plenty of oil within the US, the world won’t be as happy towards the end of the year. Assuming OPEC maintains their “cuts”, which they intend to. In the meantime, EIA and IEA will keep singing the Permian song, and doing their excellent act of a Scarlett O’Hara. “Tomorrow is another day”.
John Hess had some interesting quotes at CERA week.
“Irrational exuberance in the US. Overhyped.”
There’s at least 100 kbpd coming from UK, but it might just give a false sense of plenty as after the peak production will decline fast.
Yes George
But if we join opec at the peak then we can reduce production to support prices. How’s that for an original stratergy….not.
5 Key Takeaways From CERAWeek
https://oilprice.com/Energy/Energy-General/5-Key-Takeaways-From-CERAWeek16702.html
For me it would be: 1) more talk of conventional gas than conventional oil, 2) Everything that was not said: lowest discoveries on record, no big FIDs, no long lists of coming start-ups (which I guess go with item 2, but mean there isn’t a quick off the shelf fix just waiting for higher oil prices)
This is similar from Forbes:
https://www.forbes.com/sites/ellenrwald/2018/03/07/4-market-insights-from-oil-ceos-at-houston-energy-conference/#29db14b24a8b
I think Forbes, Bloomberg and Reuters are getting worse in their oil and gas coverage. This from the article:
The head of the International Energy Agency (IEA) also discussed the need for investment when he said that the global oil industry must add the capacity of one oil field in the North Sea each year in order to replace declining oil fields.
Actually he said the entire production from the North Sea, which is a couple of hundred fields.
I remember reading an article from someone who works with fund managers for part of their living. I think it was Phil Flynn, but I could be wrong on that. Basically, they are clueless, but why shouldn’t they be, they get their info from Bloomberg, and the rest of the clueless press.
I used to write about the tech industry during the dot com boom. Most business writing back then was poor, too. Most writers just copied and pasted press releases. They didn’t understand the companies in depth, didn’t read financial info, and didn’t ask tough questions about the companies.
The reporting tended to drive up stocks because reporters always said everything was fine.
Ah, oil & gas execs talking their book.
Peak demand is about to hit them like a freight train hitting a brick wall, and they’re still trying to ignore it.
The talk they are making about peak supply should be understood as an attempt to convince investors to throw more money at the oil companies (to look for this mythical “new supply”, y’know, which will supposedly be profitable because oil will supposedly be superexpensive). It’s a con.
(Obviously we have reached peak cheap-to-extract oil supply, but the oil execs don’t take peak supply seriously, or they’d invest in renewables; instead they’re using it as a way to con investors.)
Brazilian oil statistics – 2017 Averages – ANP
Crude Oil Production, 2,622 kb/d
Crude oil Refined, 1,742 kb/d
Crude Oil Net Export, 850 kb/d
Products Net Export, -403 kb/d
Crude Oil + Products Net Export, 447 kb/
Low crude exports in Oct, Nov & Dec have no doubt increased inventories
In 2017 Brazil had, in theory, an average net export capacity of 477 kb/d (without accounting for inventory changes)
Just Net Products https://pbs.twimg.com/media/DYFbj3eW0AA6TTd.jpg
Long Term https://pbs.twimg.com/media/DYFb3vgXcAAS_fR.jpg
I believe this link is as relevant to the oil industry as anything else in this thread, looking at things from a long term perspective.
https://www.bloomberg.com/news/articles/2018-03-08/the-battery-will-kill-fossil-fuels-it-s-only-a-matter-of-time
I posted it in the non petro thread as well.
Here’s one thought that most non investing people generally overlook when talking about the oil industry’s funeral.
Money to be made NOW, profits to be collected in the near future, are worth hundreds of times more than equal amounts of money thirty or forty or more years down the road.
Pull up a thirty year amortization schedule, and you will see instantly that paying as little as a couple of dollars extra on the principal during the first year of payments will wipe out an entire payment at the end of the thirty years.
And by then…… all the EASY oil will SURELY be gone, except maybe whatever is still coming up slowly from old legacy fields. There will likely be an excellent market for that much oil, because there will still be a market for it as a chemical feed stock, and to run the many millions of machines that will still be in good running order that will be built between now and then.
Nobody is going to scrap a hundred thousand dollar machine that is in good running order that can be profitably used, except for two reasons. Using it will be outlawed, or else it will be impossible to get fuel for it.
Can the battery industry ramp up fast enough to outrun oil and gas depletion?
Personally I’m pessimistic about that, considering all I read about the well known decline rates of legacy oil fields. Maybe there’s enough new oil still to be discovered to offset depletion for another decade, or even two or three, but this seems unlikely to me.
The longer you hunt, and the better the tech you hunt with, the less there is left to be found, and the number of people who want oil and can afford to buy it is increasing fast, and will likely continue to increase. So the owners of legacy oil have every incentive to use any method they can to get it to market as the price inevitably goes up again.
As Ron points out, the methods they use to do this mean they have postponed production decline in the short term, but at the expense of a very sharp drop off from these fields later on.
Whoever still has oil that can be affordably produced is very unlikely to have any problems selling it for the next thirty years at least.
Just my guess, but it’s very hard to imagine that the battery and storage industries can ramp up fast enough to make it otherwise. Lithium may be recycled, but it can’t be recycled until the battery it is IN is scrapped, lol.
Bloomberg has an agenda, I am sure you know that.
Tesla is always mentioned. Yet Tesla seems to have some issues.
Mac,
I don’t see this article on the non-oil side.
Can the battery industry ramp up fast enough to outrun oil and gas depletion?
Well, that’s a technical question, and I can’t give a technical answer. What I *can* say is that money will pour into the battery industry at a tremendous rate; they will have absolutely no financing obstacles.
The *current* growth rate of the battery industry should be easy enough to maintain. This, by itself, eliminates gasoline cars from the new car market circa 2030.
Oil will be essentially unmarketable around 2035. That’s a lot less than 30 years away. 17 years away, to be precise.
Aramco IPO Delayed.
I consider this report from UK officials to be “alleged”. It’s getting splashed, but . . . nah. The prince will decide.
The issue outside KSA is who gets the listing. NYSE, London, Hong Kong . . . who? The Saudis want $2 Trillion valuation. And they want that to happen from selling 5% of the company. So $100 billion.
I think NYSE has regulated themselves right out of that $100 Billion. KSA will not want to submit to the sort of scrutiny required for an NYSE listing. Hong Kong probably would have the inside track.
It also has not really occurred to the relevant reporter phone call recipients that Aramco can go public without a listing. They can do a placement to Sovereign Wealth Funds. Personally, I’d put the odds on that about the same as a listing.
(Note this company would by itself be 1/10th the size of the entire US GDP)
I heard some Saudi mention the listing on the NYSE was unlikely because of possible lawsuits over 9/11.
The FT, Bloomberg, and others are basically saying “Aramco isn’t worth that much; it’s a sucker’s bet.”
Aramco will never go public for that $2 Trillion valuation. Nobody will buy it.
Here is an interesting article dealing with oil supply:
http://www.resilience.org/stories/2018-03-12/the-world-oil-supply-is-infinite-i-know-that-because-i-believe-it/
Good article.
If these charts are right, then copper looks like a rapidly depleting resource too.
Glencore’s Ivan Glasenberg paints bullish fundamental picture for copper at BMO’s annual metals and mining conference
Copper mine project pipeline has more than halved
Exploration has been increasingly unsuccessful
Chart https://pbs.twimg.com/media/DW-ADhfX4AYaqvA.jpg
Copper demand https://pbs.twimg.com/media/DW-ALmtW4AEx-nZ.jpg
Capex https://pbs.twimg.com/media/DW-AWxKWsAADgfG.jpg
Metal on Twitter: https://twitter.com/hashtag/METL?src=hash
Copper recycling is becoming increasingly important.
Hi Roger,
Nice piece. The energy in a lithium ion battery is used at about 95% efficiency, so if we take a 100 to 1 estimate for the specific energy of gasoline vs a lithium ion battery (based on current Tesla battery packs), but recognize that we only get about 20% of the energy from fuel as Work (due to low efficiency of ICE vehicles), that drops the difference to 20 to 1, for long distance trips (over 250 miles) the gasoline vehicle will be faster to refuel. Battery costs will continue to fall making EVs competitive with ICEV. The Bolt is already available and the Tesla Model 3 is also available, but currently only to those who already own a Tesla.
In fact demand is there, customers are simply waiting for supply which might fulfill current demand by the end of 2019 (about 400k to 500k customers are waiting impatiently for a Tesla Model 3).
Other manufacturers are preparing to jump on this bandwagon.
For oil, I believe Laherrere’s estimate from 2013 (2700 Gb) is too low and have a medium model with 2800 Gb of conventional (not continuous) oil, 300 Gb of extra heavy oil, and 100 Gb of LTO for a total of 3200 Gb.
I use Paul Pukite’s shock model with fallow, build, and maturation periods of 13 years for conventional oil, the oil sands and LTO are modelled separately. Peak is in 2025, annual decline rates remain modest (under 2% per year until 2050). High oil prices after 2025 may lead to more rapid decline than this scenario if EVs are taken up very rapidly from 2020 to 2050.
The high cost of oil is likely to make EVs very competitive in both trucking and personal transport.
Wow! Fifty years ahead. I will be 118 years old. Not. I was going to say that jet fuel would still be required, and used more, but the Chinese have already been successful with one photon being teleported to a satellite in outer space. Don’t think I would want to be a test pilot on the development though. Whale oil was replaced within a short period of time, so fifty years, who knows.
Guym,
You’ll only be 88 in 2040 then, and might even see 2050. Doubt I will make it to 2070, but might make it to 2055, if I live as long as my Dad.
I expect if this scenario is roughly correct, that oil prices will rise from $115/b in 2025 to about $165/b in 2050, unless a transition to non-fossil fuel transportation (EVs, plugin hybrids, electrified rail, light rail, and bus, as well as walkable neighborhoods, bike paths and better urban design) proceeds very rapidly and reduces demand in response to higher prices.
That scenario might see more rapid decline due to less demand and lower oil prices, especially after 2050. This would reduce the development of oil sands, deep water, and other expensive oil resources, URR in such a scenario might be considerably lower (perhaps 2800 Gb or less).
There’s also stuff like this:
https://www.youtube.com/watch?v=LeFxjRMv5U8
A lot of the calculation people do assume that the next generation of technology will be the same as the previous, but with one component swapped out. That’s rarely the case. Instead, really innovative often redefines the entire industry.
So you might prove that air travel is impossible without jet fuel and wake up 20 years later to discover that nobody cares.
Dennis, I like your supply-side modelling. I’ve told you my modeling from the demand-substitution side; before the 2025 peak which you project for oil production, we’re going to see permanent demand declines. The result is that the highest-ever oil price will have to hit beofre 2025 (probably before 2023, actually).
That leaves only 5 years to have another oil price spike. It may not happen at all; the highest-ever oil price may have been in the past.
Too many oil tankers (with little or no demand to use VLCCs as floating storage)…
London, 12 March (Argus) — The cost of freight for very large crude tankers (VLCCs) on key routes is unseasonably weak, and average first-quarter rates are on pace to hit record lows.
Tonnage oversupply remains the single largest factor to weigh on VLCC freight rates. Around 47 newbuild VLCCs were delivered in 2017, far outstripping the 22 demolished or converted for other uses. Around 50-60 VLCCs are scheduled for delivery this year, which would equate to 7-8pc of the global fleet, followed by another 40 or so in 2019.
Scrapping rates have accelerated recently but it is likely to be some time before that is sufficient to support rates. There is little or no demand to use VLCCs as floating storage, although if this were to change that may help alleviate the oversupply.
(free) http://www.argusmedia.com/news/article/?id=1642452
Interesting article @FinancialTimesOOTT ‘The wrong barrels – the dirty little secret of Shale is that few refineries really want it.
This is exactly what I am experiencing in my environment.
In addition, the EIA publishes US production classified as API from different states. Bakken produces just 90k bbl per day crude oil (API 37 -42), a 40% decline from last year. Most of Bakken production is outside of WTI classification. Of the total US production just a little bit more than2 mill bbl per day can be classified as WTI crude. Everything else is condensate or heavy oil.
I was also surprised that the latest production number from the Gulf of Mexico was just 1.5 mill bbl per day of which 500 mill bbl per day are heavy oil.
There is an huge mismatch what the US produces and what refineries can take. This is also the reason why US imports of oil and products rose within the last few years to over 10 mill bbl per day. US refineries just cannot take so much light distillates, which must be exported at a cheap price.
This is also a major headache for many shale companies, which receive for plant condensates just 20USD per barrel.
Dilution with heavy oil is also a weak option as the generated oil mix produces too much coke petroleum, which is difficult to get rid of. Despite the hype of high production numbers there are still many challenges left.
Why they don’t build new reffineries suited to the new mix? Even in pessimistic calculations shale oil will stay there for many more years, so there will be enough feed stock.
This exporting / importing costs lot of money, too. It could be avoided with direct use of the oil.
Refineries are continually being upgraded, a few, including one of the biggest at Beaumont (Exxon), had FIDs for upgrades to handle lighter oil in 2015 and 2016. It takes a bit of time to make the upgrade – maybe one or two years, depending on the extent. The loss of heavy oil from Venezuela (and maybe Canada because of the pipeline issues) might not have been in their assumptions though.
It isn’t expensive to ship oil by sea, and might be getting cheaper based on the VLCC glut that EnergyNews posted about, similar to the cost of using an internal pipeline and a lot less than by rail.
The FT article is really about potential future issues, not current. It is easy to see what refineries do and do not like just from the WTI/Brent price spread. I think this had been narrowing but might be going the other way again.
On shipping – USA is an exporter of products. What’s the difference between exporting crude and getting back what is needed for the local market, or producing something that is oversupplied locally and exporting the excess? It is just the refinery spread, and it may not be worth the CAPEX for a big refinery upgrade or new build to get that … or it might.
Mr Kaplan,
The US net exports of oil products ( gasoline, middle distillates and aviation fuel ) is just 1 mill bbl per day. The US is again a net importer of aviation fuel as there is a shortage of middle distillates. Exports are mostly 3 mill bbl per day plant condensates, which trade at a huge discount of 40 USD per barrel to WTI and 1.5 mill bbl per day field condensate ( which many label as crude oil) which commands a discount of 20 USD per barrel .
So 4.5 mill bbl per day are exports, which the US refineries simply cannot take and must be sold at an huge discount into a totally oversupplied condensate market, which grew fivefold over the last twenty years.
Why do you think it’s a “huge discount”, it’s just normal arbitrage, if and when local refinery capacity is available then prices will adjust accordingly, some people will make a bit more money and some a bit less.
In terms of aviation imports – how much is that due to current refinery outages and/or an overhang from the loss of refining capacity due to the hurricanes (when the WTI/Brent spread increased a lot).
LTO is not condensate, and no matter how many times you want to say it is that will not change.
Eulenspiegel,
In this case letting the market figure what is most efficient makes sense to me.
Reuters just reporting a few hours ago that Exxon will upgrade and expand 3 refineries along Gulf Coast to handle shale oil.
Beaumont plant will double capacity to 850,000 bbld making it biggest refinery in US.
Completion date is several years off and FID is pending.
If it takes “several years” (4?) to complete the conversion, they’re running headlong into peak demand.
It is possible to generate octanes from condensate, yet it is a complicated manufacturing step. Refining is best when the products are already there. Middle didtilates are even more difficult to produce from light distilates. Exxon plans to extend a refinery in Beaumont, yet it will take years until it will be ready to produce. The best thing for shale would be if the diesel market would dissapear altogether, yet diesel is superior in energy density, security and reliability.
The diesel market may actually disappear if electric trucks take off, as they might. But it will start to go away circa 2021, with a major impact around 2023. Around then, both the diesel and gasoline markets will be declining simultaneously. None of the refineries are prepared for this.
Heinrich,
Most people in the oil industry define condensate as liquids above API Gravity of 49.9.
There are lots of high priced crude blends that have a higher API than WTI.
The refineries in the US Gulf coast (over 50% of US refining capacity) have been set up to handle oil that is heavier than WTI, so heavy oil is not really a problem. The lighter oil can be exported to nations that have the refining capacity to handle the lighter grades of oil.
Dennis,
There is however a price problem. I have checked from the US export statistics that NGL exports just get less than USD 20 per barrel. Ethane is for instance nearly for free and buyers just pay for transport.
Ironically, despite the decrease in net imports in barrel terms, the US trade deficit in oil and products increased last year in dollar terms.
No wonder that shale companies have huge cash flow problems.
Heinrich,
There is a big difference between lease condensate (liquid at standard temperature, 25 C and pressure, 1 ATM), and NGL (butane, propane and ethane).
The latter is mostly from natural gas production, rather than LTO output, though from some LTO plays there is considerable natural gas output (Eagle Ford).
I know the difference between plant condensates and field condensates. It is just you, who did not understand again the whole background. You are just giving here the expert, yet I can assure you that anybody, who works in this field can realize that you do not have worked in any oil project and you are just presenting platitudes which you have read over internet.
Heinrich,
Perhaps you know more than your comments indicate.
You seem to lump condensate and NGL together, they are not the same. Most NGL produced at gas processing plants is not C5 or higher, it is C2 (ethane), C3 (propane), or C4(butane). None of these “liquids” are liquids at standard temperature and pressure (STP=25 C and 1 ATM).
You may be aware of this, but your comments talk about API>42 and then jump to talk of ethane so it’s not clear what you are talking about.
You are correct that I am not an expert, George Kaplan has oil industry experience as do many others who post here.
Many gas plants can operate to leave ethane in the natural gas (up to a point if the gas is rich) or extract for a petrochemical feed. There has been a lot of talk of building new US ethane crackers but I don’t know the status of any projects, some might also be off for maintenance at the moment. Ethane has nothing to do with LTO production as Dennis says, but it can be reformed to give hydrogen for hydrotreaters (if used like that, and if so I think it would be as part of a nat. gas stream, it would partially show up in refinery gains). Some heavier NGL and condensate components are used in alkylation units for high octane blending, which also can show as refinery gain I think as I don’t know if or how they prevent double counting.
One other thing that may be impacting oil grade prices and refinery operations at the moment is that high sulphur marine fuel is due to be banned by the IMO in 2020. That means heavy oil has to be hydrotreated to remove the sulphur or cracked to give marine diesel, which I think is the way a lot of ship owners are going. USA and Europe already have low sulphur requirements but I think they export their residual fuel oil, which they may now be planning to keep and process.
One can feel the disturbance in the Force of global oil GeoPolitics. Trump to T Rex. You’re FIRED !
Yes, tweets disturb the force, and ignites the dark side. Unfortunately, the last Jedi the force had was Obi Wan Simon in 1974. Anything we seem to do now, only disturbs what force is left there.
2018-03-13 ND Director Cut – seven days with temperatures below -10F
Crude oil production 1,176 kb/day in January down from 1,183 kb/day in December
https://www.dmr.nd.gov/oilgas/informationcenter.asp
North Dakota oil regulator forecasts 1.3 million b/d by end of 2018
Are there any pipeline people here? Or, some of the producers probably know. The situation is the same all over, but let’s take the Permian as an example. Lease A has API of 42, the production is measured at the wellhead, and as it is dumped into the pipeline, I am sure it is measured, again? Lease B has API of 55, and Lease C has API of 65. They all go into the same pipeline, I assume. That mixture screws up the combined amount, if that they way it happens. So, each lease gets credit for the oil as it connects to the pipeline? Sounds pretty confused to get proper credit, as the end result has to be screwed up. I would ask my operator, but they believe royalty owners are no higher on the food chain than mushrooms.
All of our oil is truck hauled. Each load is gauged by representative of crude purchaser, which includes measurement of gravity.
I assume this occurs before oil goes into pipeline and lease owners are paid based on that gravity measurement.
What is the API of condensate?
[API gravity is a measure of density relative to water where liquids that sink in water have an API of 10 or lower and liquids that float on water have an API greater than 10]. The generally accepted delineation between condensate and crude oil is 45 API.
WTI’s number has changed. You can always change definitions.
Condensate is defined by it’s source not some cut off number. I seem to remember that number being used my whole career, but could be wrong as it was never of much importance. I think it’s only real relevance was to do with US export limitations that have now been lifted. What mattered were the physical properties for fluid mechanics and thermodynamics in design and composition for sales. I worked on a couple of very rich gas wells that might have had higher API, but can’t remember for sure, but it was still condensate.
Hydrocarbon condensate is anything that drops out of a gas stream anywhere in the processing system. Lease condensate, which is what all the discussion is about, is what comes out of a gas well at the wellhead before the gas is first metered. A gas well comes from a gas reservoir.
2018-03-14 (Reuters) China’s crude oil production in January and February fell 1.9 percent from a year ago to match a record low marked last August, data showed on Wednesday.
The NBS data also showed China’s oil refinery throughput rose 7 percent in the first two months of 2018 from a year earlier to 93.4 million tonnes, or 11.56 million bpd.
https://www.reuters.com/article/us-china-economy-output-crude/chinas-january-february-crude-oil-output-matches-record-low-idUSKCN1GQ096
OPEC continues with cuts/quotas
2018-03-14 Saudi Aramco released its customer allocation for April. Crude oil production levels will be maintained below 10 million barrels a day, and exports will remain under 7 million barrels a day – statement energy ministry
Reuters chart https://pbs.twimg.com/media/DYPrJjQWkAEJVCD.jpg
2018-03-14 (Reuters) – Iraq, OPEC’s second-largest producer of crude, is hitting a roadblock in the next phase of expanding its oil production capacity as the appetite of international energy firms for investing in the country’s low-return environment slackens.
https://www.reuters.com/article/us-iraq-oil-contracts/oil-companies-temper-iraqs-dreams-of-production-expansion-idUSKCN1GQ1ID
OPEC, citing secondary sources, says its February oil output fell -77 kb/day m/m to 32,186 kb/day; compliance with supply cut increased to 147% according to Reuters calculation
OPEC table on Twitter: https://pbs.twimg.com/media/DYQBIboX4AA9CJT.jpg
Platts: https://www.platts.com/latest-news/oil/london/opec-feb-oil-output-3219-mil-bd-down-80000-bd-26908807
Supply/Demand – OPEC’s forecast is now the same as the IEA and EIA in that supply growth is higher than demand growth…
OPEC raises 2018 non-OPEC oil supply growth forecast to 1.66 million bpd (previous forecast 1.40 mbpd), led by higher US estimate
OPEC says global oil demand to rise 1.60 million bpd this year (prev. forecast 1.59 mbpd)
https://pbs.twimg.com/media/DYQCraYWsAAvLG0.jpg
OPEC says OECD oil inventories rose by 13.7 million barrels in January to 2865 million barrels, 50 million barrels above 5-year average
I think someone already posted about this but here is the link…
Will US shale give the refining industry indigestion?
https://www.ft.com/content/2e7f9964-21f8-11e8-add1-0e8958b189ea
If that link doesn’t work…try this one. Click on the first article
https://www.google.com/search?q=amrita+sen+oil&safe=active&source=lnms&tbm=nws&sa=X&ved=0ahUKEwjauYbR-OvZAhVk7YMKHY_0B5MQ_AUICigB&biw=1509&bih=703
If we are looking at too many barrels coming from shale and the global refining system cannot handle it… LTO will trade a discount to heavier grades from many years as shale production grows. This means the economics for shale are even worse than the what they appear to be today.
Wow. And the economics for shale already appear to be garbage.