The OPEC data for the charts below are from the OPEC Monthly Oil Market Report.
and is thousand barrels per day.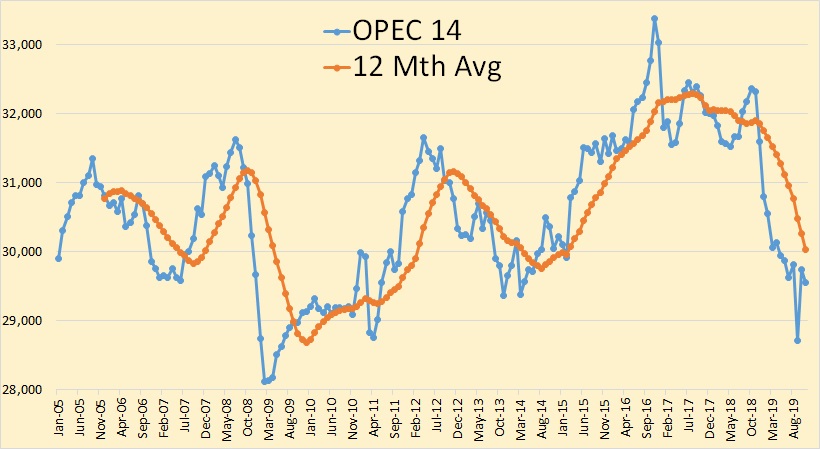
OPEC 14 was down 193,000 barrels per day in November but that was after October production had been revised up by 94,000 bpd.
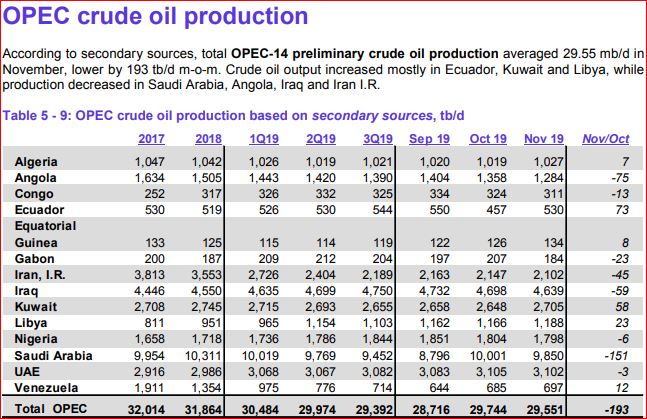
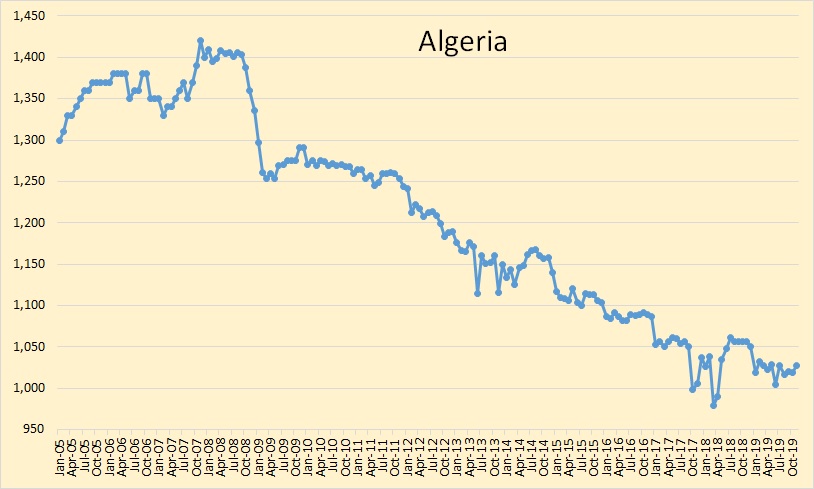
Algeria slightly increased production in November. Nevertheless, they are in a slow decline.
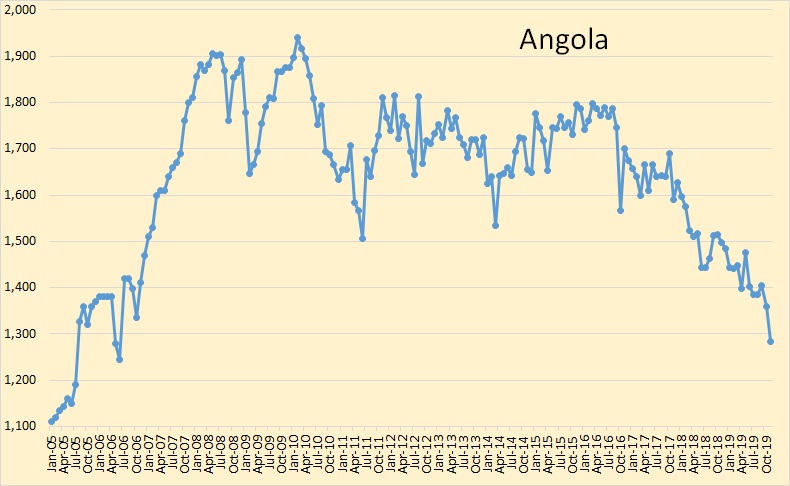
Angola took a hit in November, down 75,000 barrels per day. They are now 197,000 barrels per day below their quota.
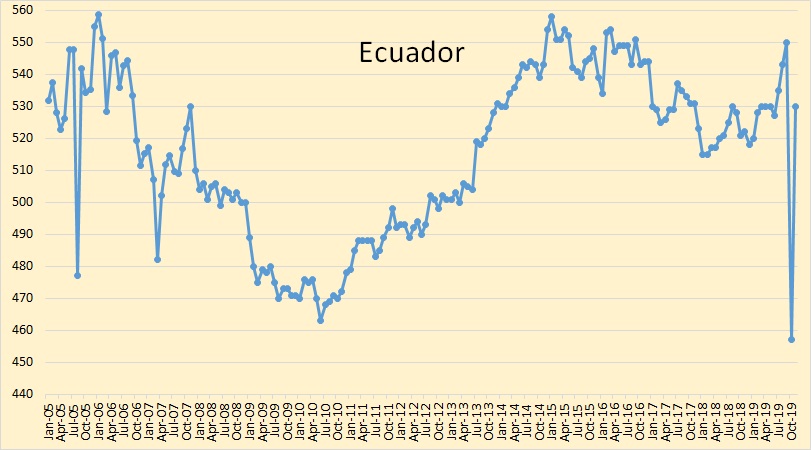
Ecuador recovered from the huge hit they took in October but are still down 20,000 barrels per day from September. Ecuador will be leaving OPEC at the end of December.
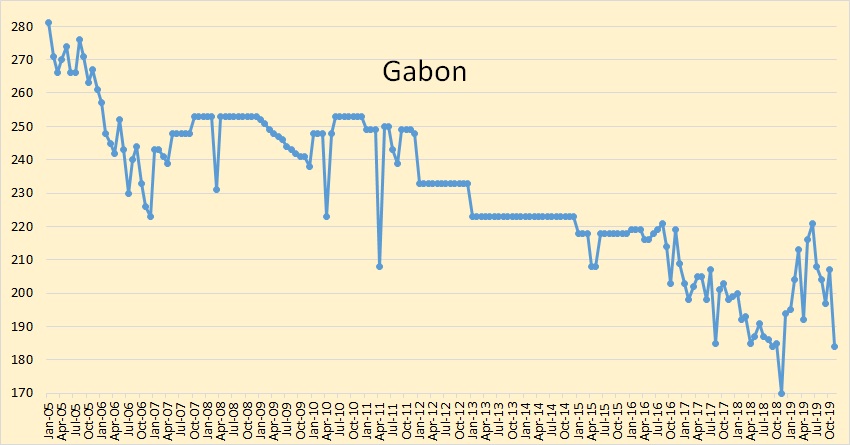
Gabon was down 23,000 bpd in November. Big hit for such a small producer.
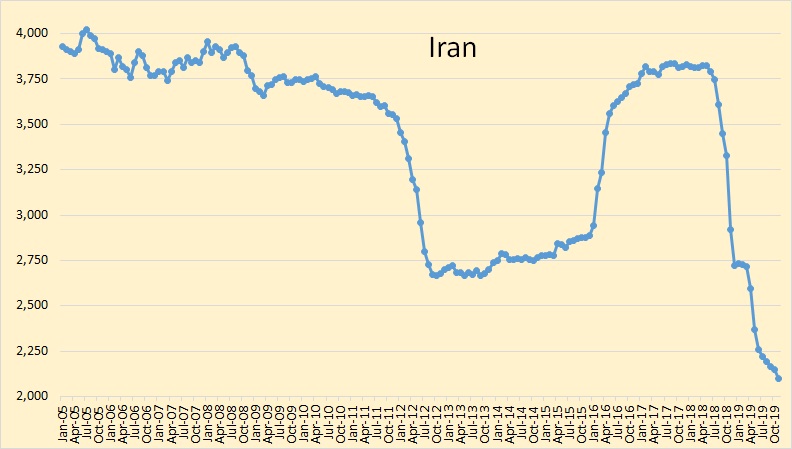
Iranian production was down another 45,000 bpd in November. I don’t understand why sanctions is hitting so much harder this time than the sanctions that began in 2011.
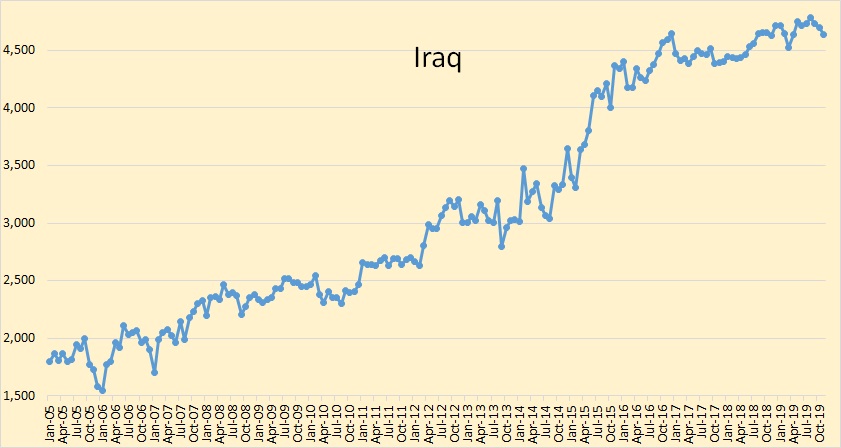
Iraqi production was down 59,000 bpd in November. However, I think they are still producing flat out, or very nearly so. Iraq is producing 127,000 bpd above their quota. In other words they are ignoring their quota.
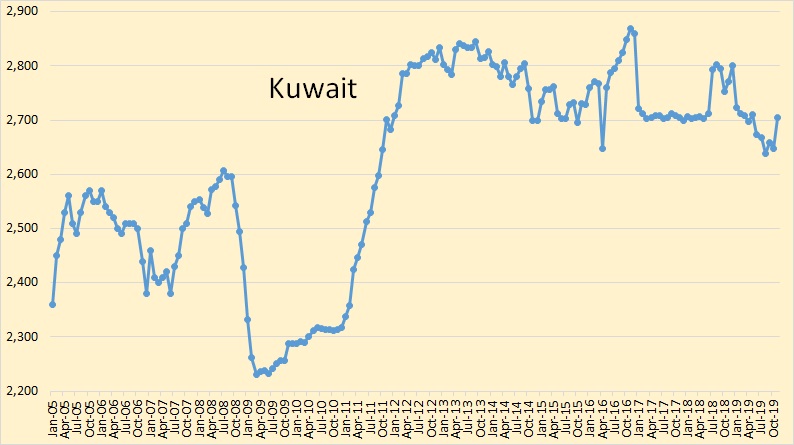
Kuwaiti production was up 58,000 bpd in November. However, their October production was revised down 26,000 bpd.
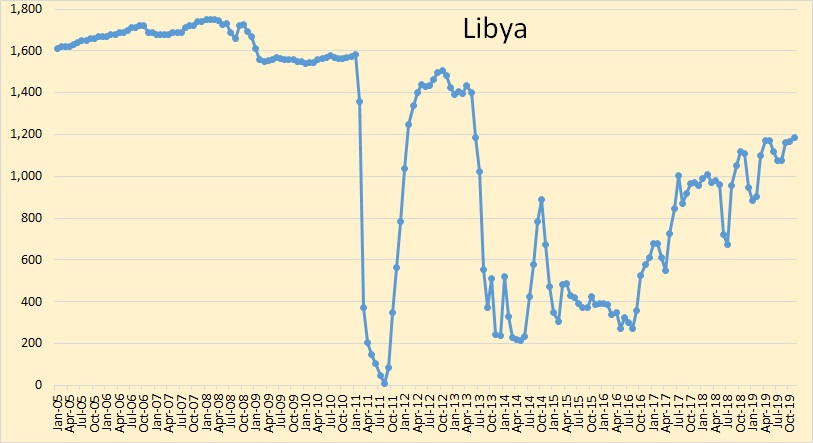
Libya, like Iran and Venezuela, are exempt from quotas. They are exempt because of conflict in the area. However, I doubt if they could produce much more with no conflict.
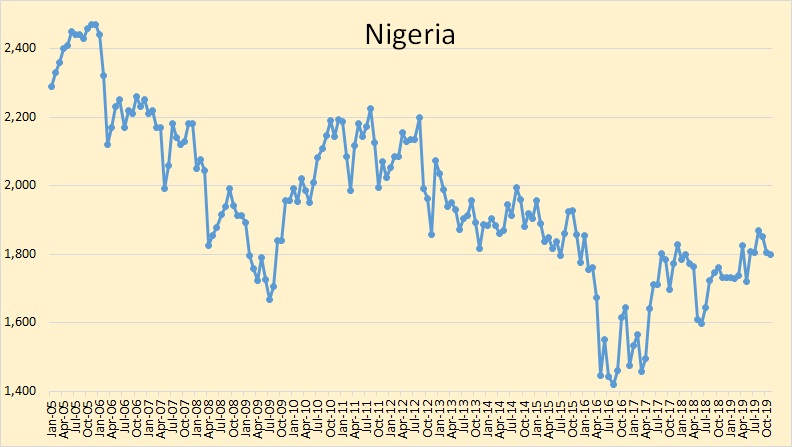
Nigeria, like Iraq, is ignoring its quota. They are producing 113 bpd above their quota.
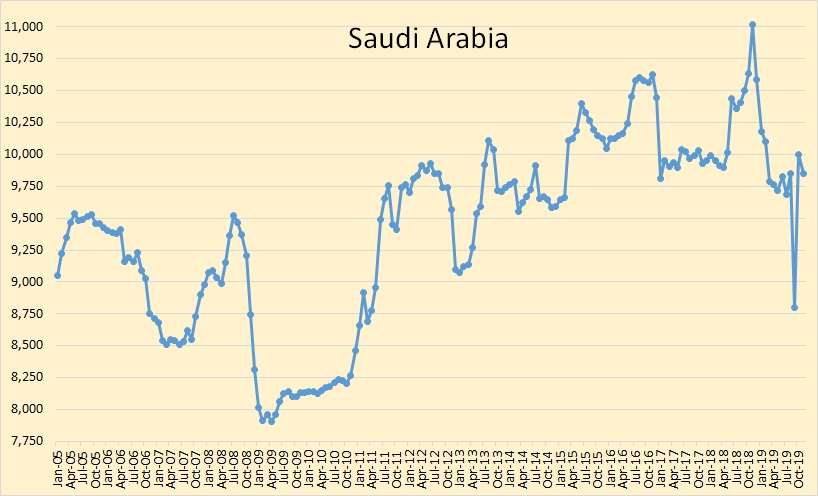
Saudi production was down 151,000 bpd in November to 9,850,000 bpd. However, their October production was revised upward by 111,000 bpd to 10,001,000 bpd. Saudi, in November, produced 461,000 barrels per day below their quota.
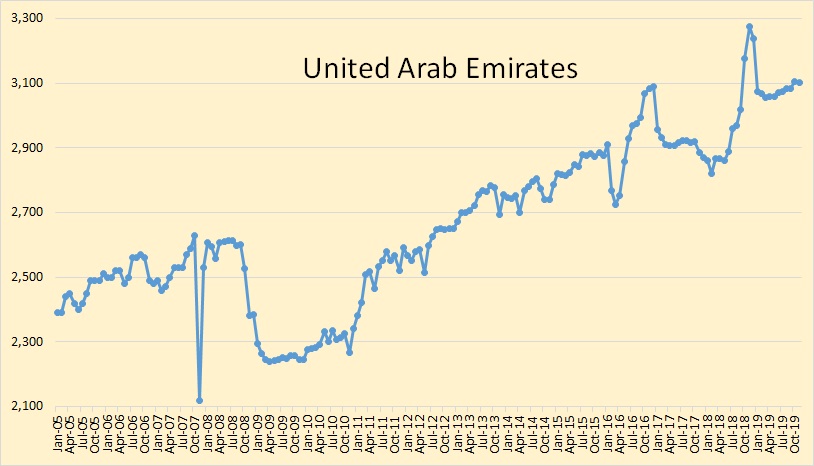
UAE production is holding steady. They are 30,000 bpd above their quota.
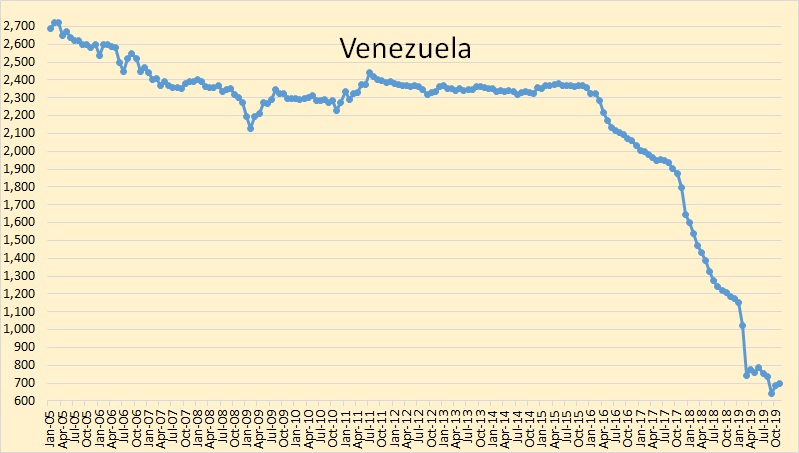
Venezuela seems to have bottomed out at just under 700,000 barrels per day.
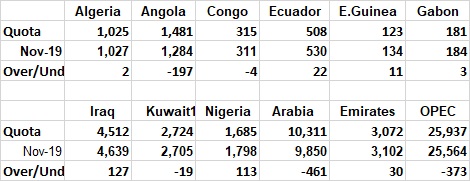
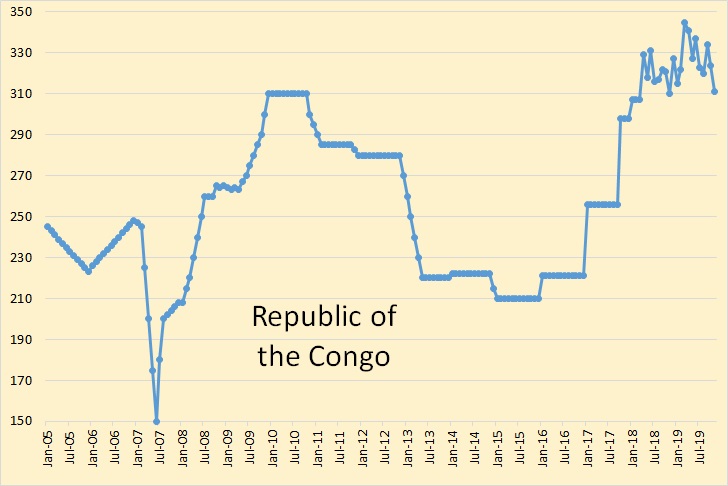
Here we have production versus quotas. The “OPEC” column excludes the three countries not subject to quotas.
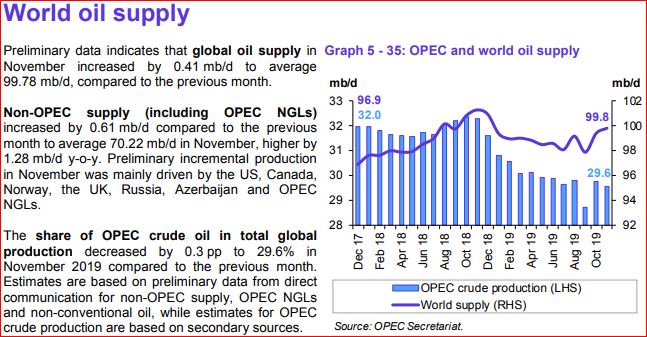
This is the OPEC Secretariat’s opinion of world total liquids production. I am not sure how accurate it is.
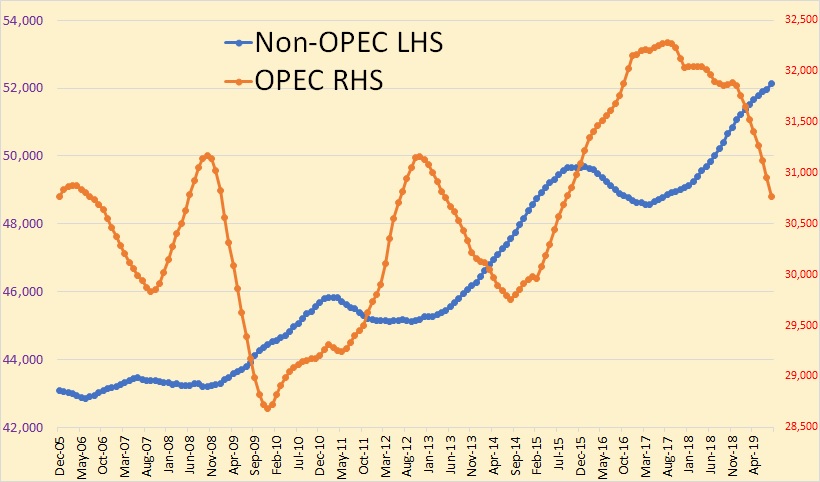
As of December 2005, Non-OPEC 12 month average stood at 43,099,000 barrels per day. In August 2019 that 12-month average stood at 52,127,000 barrels per day, an increase of 9,028,000 barrels per day. As of December 2005, OPEC Production 12-month average stood at 30,769,000 barrels per day. By August 2019 that 12-month average stood at 30,766,000 barrels per day, a decline of 3,000 barrels per day.
Note: August is the last month I have World data for. The OPEC 12 month average in December of this year will be down about another 875,000 bpd.
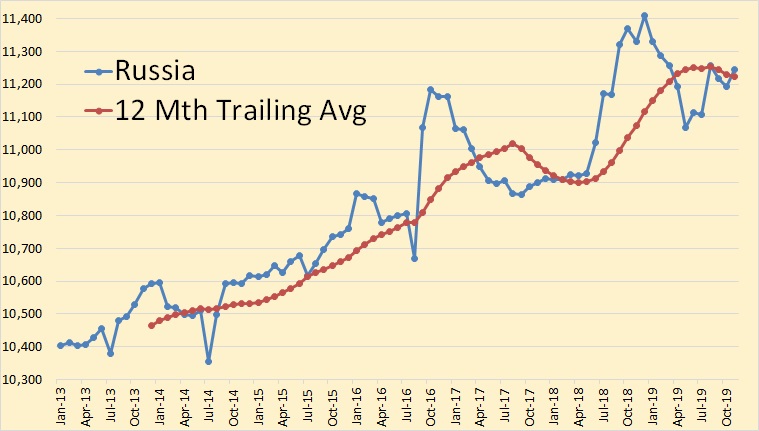
Russia through November 2029. This is Russia Ministery data using 7.33 barrels per ton.
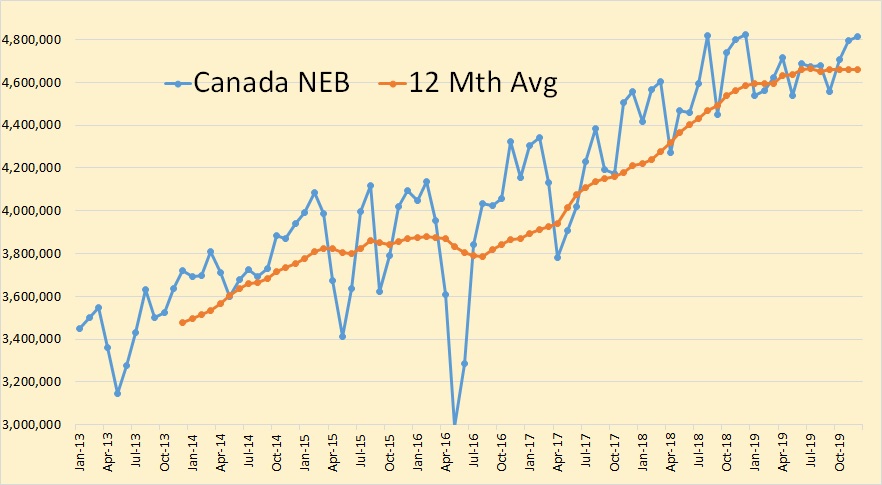
Canadian production through December 2019 according to the Canadian National Energy Board. All 2019 is a projection but only the last three months are subject to any serious revision.
252 responses to “OPEC November Production Data”
Any credence to the story around Iran producing more than they are reporting to Opec?
Iran has stopped reporting production to the OPEC Secretariat. What you see here is what several sources estimate as their production. The OPEC MOMR looks at them all and makes a “best guess” estimate or their production. They refer to these reports as “secondary sources”. They do this with all other OPEC countries as well. It is just an estimate and yes, it could be off by several thousand barrels per day.
Can’t it be they produce full out and are smuggling it with transponder off tankers and other tricks?
I doubt seriously that they are producing flat out. But they are trying to evade sanctions with every means they have. An article from this past May:
Iran to sell oil in ‘grey market’ as US tightens sanctions
Iran has mobilised all its resources to sell oil in a “grey market”, a top official said, after the United States told buyers of Iranian oil – including China, India and Turkey – to stop purchases or face sanctions.
Amir Hossein Zamaninia, Iran’s deputy oil minister, told state media on Sunday that Iran will continue to export oil despite the US sanctions, which he said were neither just nor legitimate.
You will need to read the full article to get the whole story. But it will give you new insight on how these sanctions work, and how they are supposed to work.
The issue is probably finding buyers, sure some is for sure sold that way but they probably cant sell millions of barrels per day under the radar to buyers willing to eat the added risk. Witch will lead to filling up storage witch leads to lowering production.
The smuggled oil probably have a hefty discount also, so there will be loss in income even in the imaginary case they manage to smuggle all the difference.
There are also rumors that some of their oil is being exported thru Iraq.
FYI to you newer folks. Iran has a path of export seldom talked about anymore. It was on the radar screen in the Obama years but not so much now.
Namely, look at the map. There are many tankers on the Caspian. Iran oil is easily mixed at receipt point on the Russia coast of the Caspian. Russia can sell the mixture and reimburse Iran.
If you do a search for Iran pipelines, there are maps showing access to the Caspian sea.
All five of the countries bordering the Caspian have fleets of tankers. Oil can move out of Iran.
Neka oil terminal, on the Caspian, was once reported to be in the process of developing a loading capacity of 1.5 million bpd by 2016. I would imagine there’s likely an addition to the Caspian swap program going on. As well as refining Central Asian crude, existing infrastructure at Neka could facilitate exports, with Russia buying highly discounted Iranian crude. Iraq is also likely involved in numerous swap schemes with Iran.
https://www.transport-exhibitions.com/Market-Insights/Iran/Archive/A-guide-to-Iran’s-oil-exporting-ports
What is the explanation that Non-OPEC produces more than OPEC, but OPEC has 70% of world reserves? Although this might have been the case in the early history of oil production, I would think that this should not be the case near the peak. If I recall correctly, Campbell thought that OPEC’s stated reserves are actually the estimated ultimates for each OPEC country?
No, no, no, OPEC has almost 80% of World oil reserves:
OPEC Share of World Oil Reserves, 2018
Well, 79.4% to be exact Some people really believe that unbelievable crap. Well hell, there are still people who believe the earth is flat and that the sun revolves around the earth. So why should we be surprised? Some people will believe anything.
I would like to think that most people on this list know that OPEC quoted reserves is pure bullshit.
Hey, we have a president who lies every time he tweets. And sometimes he tweets 200 times a day. And perhaps 45% of the nation believes him. The capacity of humans to believe the absurd is unbounded.
Anyway if IEA and EIA projections are made on the basis of OPEC claimed reserves, we have a serious problem.
“there are still people who believe the earth is flat” if it only were so, for as Al Bartlett pointed out in his New Flat Earth Society
https://www.albartlett.org/articles/art1998jan.html
“The flat earth removes all the need for worry about limits”
Still, what would you and Dennis estimate of reserves be based on actual production rates.
Well, I have always stated, on this blog as well as The Oil Drum, that every nation produces what oil they can produce. Production must have some relation to reserves.
The normal R/P ratio is around 20. That doesn’t mean a nation with an R/P ratio of 20 will run out of oil in 20 years. Because as their production declines, their R/P ratio will still hold at about 20 because they are producing less oil therefore their reserves will go further. So an R/P ratio of about 20 is the norm for normal size conventional fields.
For giant and supergiant fields the R/P ratio would be greater and for smaller fields, as well as shale fields, the R/P ratio would be smaller.
If a giant or supergiant field is nearing the end of its life, but infill drilling, creaming the top of the reservoir, this will throw a monkey wrench into their R/P ratio. While in its prime, the field may have had an R/P ration of 40 or even greater, its R/P ratio while being creamed will be much smaller, less than 20.
Using OPEC’s reserves data for both OPEC and Non-OPEC, OPEC has an R/P of 109 while Non-OPEC has an R/P ratio of about 12. That OPEC number is absurd beyond belief.
Ron,
According to Hubbert methodology, at the peak production the number of years to exhaust the reserve is N = 2/a in which “a” is the intrinsic growth rate
dQ/dt=a Q (1-Q/Q_0)
From Laherrere’s reports for world peak, this is between 0.04 and 0.05. This means that the R/P ratio is between 40 and 50 at the peak. Thus if we say that 1/2 of the reserves are left at the peak and we take Laherre’s URR = 2500, this gives R/P=1250/35=36 years. These are ball park figures, but suggest that R/P ~ 20 is low. These numbers are for the entire world and for example for North Sea at its peak Hubbert’s analysis gave a = 0.12, so R/P=2/0.12=16.6, and this illustrates the fact that smaller fields are closer to your number R/P=20.
If we exclude the heavy oil then OPEC’s share is close to the 70% I suggested. How does this square its share of the production numbers for the world. This was my original question. I would like to read what the thoughts of other posters are on this as well.
Seppo,
OPEC’s 2P conventional reserves are about 575 Gb and non-OPEC 2P conventional reserves are roughly 512 Gb. Note that there is likely to be some future discoveries and reserve growth (these combined is called cumulative discovery). We are likely to reach the 50% point of conventional URR by 2023, if my 2800 Gb estimate is correct, if it is 2500 Gb for conventional URR (a 2018 Laherrere estimate was 2600 to 3000 Gb) we are past 50%.
Seppo,
OPEC “proved” conventional reserves ( excludes Orinoco) are likely to be 3P reserves.
The best reserve number to use is 2P reserves as there is roughly 50% probability reserves will be higher or lower than that estimate.
For UK where we have 1P, and 2P estimates the 2P/1P ratio is 1.7 from 1975 to 2016. Note that OPEC has chosen to develop resources more slowly to prevent oversupply. We would expect some difference in R/P when comparing OPEC with ROW.
Yes, Dennis, you are likely correct in that assessment. However, OPEC post those figures to actually represent the difference between OPEC reserves and Non-OPEC reserves. The “P” they are implying must apply to both sides of that statement, Non-OPEC as well as OPEC. They should not quote 3P for OPEC and still use 2P for Non-OPEC. That means OPEC is either totally ignorant or deliberately lying.
It is comforting to know that you really doubt those OPEC numbers. However, I still believe it is a gross overestimate even if they are quoting 3P reserves.
Ron,
I know you think it is far less than they say because you believe reserve estimates should be fixed. A look at US reserves over time suggests that reserve estimates get revised higher over time as prices increase and as the development of resources increases knowledge and leads to better estimates of resources.
This happens in the US and it also happens in OPEC, it just is far less transparent in the case of OPEC.
Basically we do not have a good estimate of OPEC reserves, we are left with a wide range of guesses.
https://aspofrance.files.wordpress.com/2018/10/35cooilforecast-oct.pdf
On page 134 of document linked above (Oct 2018) Jean Laherrere has an estimate of about 570 Gb for OPEC 2P conventional reserves (excluding 96 Gb of Orinoco reserves).
Typically Mr. Laherrere’s estimates are conservative.
Mr Laherrere’s estimate for World conventional remaining 2P C+C reserves in Oct 2018 was 1296 Gb, with a URR of about 2600 Gb. My best guess estimate is for World conventional C+C URR is a bit higher at 2800 Gb.
Dennis, you are seriously mistaken here. I very well know what the word “estimate” means. By definition, an estimate cannot be fixed. Otherwise, it wouldn’t be an estimate.
However, reserves are fixed. Estimates of oil company reserves, of oil companies traded on the NYSE, are and almost must be, very conservative. That is if oil companies err, they must err on the conservative side. Otherwise, they are in trouble with the SEC.
National oil companies, or companies not traded on any exchange, are under no such obligation. They can simply declare their reserves to be whatever they desire them to be. And, that is exactly what OPEC nations do, especially since it reserves, at least partially, determine what their quota should be. And also, prestige is something that matters greatly in the Middle East. The more reserves one has the greater the respect they believe they deserve.
Dennis, reserves that are simply “declared” by the company possessing them, have no basis in reality. Especially, especially if the nation declaring their reserves have an ulterior motive for exaggerating them.
Yes, yes, yes, Middle East reserves are nothing more than an estimate. But they are far more likely to be an overestimate than an underestimate.
But then overestimated reserves can still grow. All the countries possessing them have to do is declare that they have grown.
Mr Laherrere’s estimate for World conventional remaining 2P C+C reserves in Oct 2018 was 1296 Gb, with a URR of about 2600 Gb.
Dennis, that means that 50% of conventional world C+C reserves have gone, according to Laherrere.
If OPEC 2P conventional remaining reserves are 570 Gb, they have almost 50% of world conventional C+C remaining, although they (almost) never were producing flat out from their oilfields in production, according to you (and many others ?). With Iraq being one of the few countries that certainly for many years had fields in production that didn’t produce at max. capacity. From this 2P numbers must be concluded that OPEC is exaggerating their reserves indeed, as pointed out many times by Ron. A few decades ago the decision was that each country from OPEC was allowed to produce quantities of crude oil according to their published reserves. We know what happened then.
3P reserve numbers cannot be characterised as educated guessing, because you wrote:
The best reserve number to use is 2P reserves as there is roughly 50% probability reserves will be higher or lower than that estimate.
If world conventional C+C remaining is less than 2P, then the world could soon have a big problem, regarding production decline percentages (unless crude oilprices go very high, which world economy cannot bear (bear market).
By the way, the estimates of the quantity of crude oil extracted since the year 1850 vary considerably.
In an article published in 2015 can be read:
In 2008, two chemists from the Hungarian Academy of Sciences theorized that less than 100 billion tonnes of crude oil was produced since 1850 and the annual rate of production is around 700 million barrels. However, John Jones from the University of Aberdeen’s School of Engineering recently debunked this estimation. Jones pointed out that Istvan Lakatos and Julianna Lakatos-Szabo – the two chemists behind the dubious estimations – gave no references for their estimation and the actual figure is much higher.
Doesn’t make the projections more easy.
Han,
See section 3b of
https://www.ncbi.nlm.nih.gov/pmc/articles/PMC3866387/
Gives Oil Resource estimates, note that they use “all liquids” for cumulative output.
I use EIA data for 1960-2019
see link below for 1960-1972 data.
http://don.geddis.org/bets/peakoil/eia-doe-1960-2006.html
Data for 1973 to 2018 can be found at EIA.
Earlier data is from
https://cdiac.ess-dive.lbl.gov/trends/emis/tre_glob_2013.html
Multiply tonnes of Carbon emissions from liquid fossil fuel by 1.2745 to get tonnes of oil, then multiply by 7.33 to get barrels of oil for data from 1870 to 1959.
Most liquid fossil fuel before 1960 was C+C so this is a fairly good approximation.
I get about 1335 Gb of conventional fossil fuel at the end of 2018 when extra heavy oil and tight oil are excluded. About 30 Gb of cumulative unconventional C+C has been produced from 1965 to 2018.
The data is far from perfect, but this is what I use.
Ron,
If we take the BP OPEC conventional reserves of 979 Gb (we will assume this is 3P) and compare Laherrere’s estimate of 570 Gb (that is a 2P estimate), we get 3P/2P=1.7, very similar to the 3P/2P ratio for UK reserves. In short, I do not think the OPEC reserves are grossly overestimated from a 3P reserve perspective.
For conventional OPEC reserves we would have 1P=335 Gb, 2P=570 Gb, and 3P=979 Gb. For non-OPEC less oil sands we would have 1P=324 Gb and 2P=550 Gb using BP data at the end of 2017. Higher oil prices in the future are likely to lead to some discoveries as well as reserve growth, about 380 Gb for my best guess scenario.
Higher oil prices in the future are likely to lead to some discoveries as well as reserve growth, about 380 Gb for my best guess scenario.
Dennis,
So reserve growth would be more than conventional 1P OPEC reserves now (335 Gb)
Han,
The 380 Gb is “cumulative discovery” which is the combination of new discoveries and reserve growth from 2018 to 2400. This is my best guess, actual might be 200 Gb more or less.
Rig counts among OPEC countries mirrors US tight shale count. Reflects collapsing net-energy return.
Refined products (gasoline and diesel) are consumed to drill and deliver crude. However they are produced, distilled and measured elsewhere at the refinery, not the well where they are used.
These refined products are sold/purchased in an open market, mostly by private companies and contractors, and so are not tracted by any agency. The amount of refined diesel required to drill is not published, and so we have no idea how soon that consumed oil exceeds produced oil. That simple ratio is the most critical value in the entire world. And we have no idea.
Pioneer & ExxonMobil Pumping Out A Lot More NatGas In The Permian
According to the data from Shaleprofile, not including some unreported wells in Q3 2019, both Pioneer and ExxonMobil now producing a lot more NatGas.
Pioneer Q4 2018 to Q3 2019 Permian Production Increase
OIL = +25,161 bopd (54%)
GAS = +21,080 boepd (46%)
ExxonMobil Q4 2018 to Q3 2019 Permian Production Increase
OIL = +35,190 bopd (50.4%)
GAS = +34,623 boepd (49.6%)
ExxonMobil’s total 69,813 boepd production increase in the Permian for the first three quarters of 2019, without a few wells reporting, about half is NatGas.
LOL
No wonder Chevron is writing down $10-$11 billion in assets, mainly Shale Gas Assets in the Marcellus.
Watch for 2020 for the U.S. Shale Industry to start to disintegrate. A Little Birdie told me.
Steve
EOG Permian Q4 2018 to Q3 2019 Production Increase
OIL = +17,123 bopd (48%)
GAS = +18,247 boepd (52%)
While there are some wells not yet reported, I don’t believe it will change the overall Oil-Gas percentages.
What a FRICKEN MESS… LOL.
Steve
“What a FRICKEN MESS… LOL.”
Steve, you really are the only person I know that spews economic ignorance and laughs at himself in this own private conversation.
The tight shale play has turned the worlds oil market supply from shortage to excess for the last 5 years. It’s cut the price of oil and NG in half for the last 5 years compared from the previous 3 years prior. It has doubled the U.S. oil production and cut it’s imports to record 50 years lows. It’s lowered the cost of transportation fuels to everyone in the world and created millions of new jobs here in America. It’s the major factor inflation is almost non existent. The industry is suffering current pain from it’s own overwhelming success.
What’s your “FRICKEN” problem ? Poor gold sales. Because your a “MESS”. Exxon and Chevron are enormous multinational companies that are managed not for the next quarterly report, but for decades into the future. The current world surplus is not going to last forever and swing back to shortage. Pay attention.
The jokes on you, “LOL”
LOL,
Steve
HB, yes of course tight shale oil will last forever and ever. It will never peak. And those tight oil jobs will also last forever and ever. Yes, we are living in the golden age…. and it will last forever and ever.
So What’s the “FRICKEN” problem with those folks like Steve and Ron who think this golden age will one day come to an end?
“oil will last forever and ever. It will never peak.”
“golden age…. and it will last forever and ever”
Ron, nothing in my comment deserve those sarcastic references. You don’t dispute any of the facts of my current view. I clearly finish my statement with:
“The current world surplus is not going to last forever and swing back to shortage”
I my life time, I would say there has been two swings to an era of shortage. The first would be from the early 70’s to the mid 80’s. Basically from peak U.S. to Alaska online and CAFE standards kicking in. The second era of shortage being early after the turn of the century to the oil price collapse in late 2014. A good example of long term price increase stimulating production and balancing markets. Plus, a viable EV alternate to oil in the future.
BTW, the U.S.A. is at record low unemployment and Laker tickets start at about $250 a pop in the rafters.
I clearly finish my statement with:“The current world surplus is not going to last forever and swing back to shortage”
Yes, and I’m not sure I understand it as it seems to undercut everything you’ve said before it. Steve indicates that the “fricken mess” is about to come, I think (“Watch for 2020 for the U.S. Shale Industry to start to disintegrate”), so your comment then shows some agreement…?
Ron, nothing in my comment deserve those sarcastic references.
Right, and nothing in Steve’s post deserved this sarcastic remark.
What’s your “FRICKEN” problem ?
You are wearing rose-colored glasses man. That is your fricking problem. But that is okay, those glasses are all the rage these days. Almost everyone has a pair. But when you talk down to people who are not wearing them, it really pisses me off.
“when you talk down to people”
Ron, being you seem to understand the language of SRSrocco. Here is my response for you:
http://peakoilbarrel.com/opec-november-production-data-2/#comment-693444
Let me know what it means.
“You are wearing rose-colored glasses”
Not at all. I’m completely aware oil isn’t a infinite resource. It’s a commodity that is priced in the moment. That can take at times a decade of major amounts of capex to move the supply needle upwards. You understand overshoot. The market will swing back towards balance and miss it’s target again. I can assure you of that. That’s the nature of capitalism. Enjoy the good times while they last.
HB. The problem with shale is that it is expensive oil, despite what companies such as XOM and CVX put out publicly. However, it has a big advantage in that it is onshore, USA.
I think part of the reason that XOM, CVX, COP, MRO and other companies with worldwide operations keep at it is because it is onshore lower 48.
I remember when everything that these companies were doing was international. It required employees to live in some less than desirable places. Recall the stories I have related here about employees of these companies having less than 24 hours to leave Libya, or being herded out of the office in Venezuela at gunpoint.
Working offshore can’t be a picnic. Also, the liability is great, see BP’s disaster.
The management and employees want shale to work very badly. And it does at a high enough oil price. Unfortunately, the price hasn’t been there since 2014. But they keep making stuff up because they don’t want to be sent back to the Middle East and other tough places, or work offshore deepwater.
But what has been bad for the companies has been great for consumers. I can’t believe how much Bernie and Elizabeth ignore the benefit shale has been to the US economy.
What would have happened without US going from less than 5 million BOPD to almost 13 million in eleven years? I suspect a lot of bad things.
My primary beef is that the companies lie about what price they need for shale to work and completed too many wells when prices were low.
I think maybe shale is finally figuring out they need above my preferred $55-65 WTI price band. We have been slightly below that and it appears things are really slowing down.
Good points SSand.
And I have to agree that most ‘progressive’ voters don’t want to acknowledge the dramatic economic benefit that shale oil production has had on the economy. The decade long (and longer) extension on peak oil has been a huge gift to the ‘business as usual’/perpetual growth stance of the country (and world).
Has this grace period been used wisely?
Hickory,
I think it could be argued that a more gradual development of the resource would have been better for both the oil industry and the US economy, the US economy was doing fine when oil was at $100/bo, and higher oil prices would have spurred growth in other industries, wind, solar, EVs, plugin hybrids which are going to be needed for a successful transition. The low oil prices brought about by a development of the tight oil resource that was too rapid was overall a net negative for the US economy, we are way behind were we would have been in moving forward as oil resources deplete, the low oil prices will rapidly give way to a very high oil prices and all the people that have bought large vehicles because oil prices were low may regret their buying decision.
Note that I am not claiming tight oil should not be produced, but I would agree with Mr. Shellman that we may have shot ourselves in the foot.
https://www.oilystuffblog.com/single-post/Thrust-Fault-Reverse-Fault-OPECs-Fault
“The low oil prices brought about by a development of the tight oil resource that was too rapid was overall a net negative for the US economy”
Interesting perspective.
I certainly think that for long term stability and growth of the country, and the lower 48 oil and gas industry, a much slower pace of development would have been healthier.
This hyper-caffinated growth in tight oil we have seen over the past 8-9 years is a result of lack of a coherent policy, and a national culture of massively obese debt financing. (even if Paul Krugman thinks the debt is OK).
“the dramatic economic benefit that shale oil production has had on the [US] economy.”
I am affraid on this blog most of the expressed views do not look outside the US. The mayor difference the shale oil production boom has made, was not visible in the US, I believe. The US has reduced its dependency on foreign oil, which was a good thing to keep business-as-usual going in the US, not more then that. But that foreign oil, that used to be shipped to the US, kept flowing too. It goes to China now (most of it). China has showed the world it has the capacity to import that amount of oil. With the word ‘capacity’ I’m not talking about seaport infrastructure, I’m talking about becoming a global economic and political superpower. I do not believe the US will ever, after the shale boom, regain the capacity to import such amounts of foreign oil. The US should have used shale to compensate for the declining conventional domestic production only, so it could keep importing huge amounts of foreign oil. The foreign oil would have stayed out of reach of China.
It would be in the US national interest to import less oil.
It could do so very easily by reducing consumption for low value, unimportant uses like commuting in single occupancy SUVs: about 50% of US oil consumption is for passenger vehicles, at an average of less than 23MPG and an average occupancy of only 1.2 people.
Raise the average MPG to 46 and raise average occupancy to 1.8, and you could reduce US oil consumption overall by about 6M Bopd.
“It would be in the US national interest to import less oil.”
It wouldn’t. It could, but it isn’t. Because someone else is importing it now. They are not burning it in SUVs. They are powering their industry!
Do we have any reports showing how Chinese oil consumption is allocated between industry, passenger transportation, freight, etc.?
Shallow, I’m going to guess shale needs a little more than your preferred price band for a financially fit industry. Once a commodity is in an over supplied market. It becomes a fight for market share and the big boys don’t like giving up that. Think back to the response of Saudi Arabia a few years ago. They doubled down and it became a blood bath.
Small fish like yourself can’t do much more than to hunker down and weather the storm. Hopefully during the good times you weren’t out popping $1000 bottles of champagne. Because those guys are the first to go down when the going gets tuff.
I agree with you that there are signs of financial discipline that seem to be on the rise of late. I hope to see a stronger price market for 2020. But I won’t count my chickens until the fat lady sings. This is probably the best time to buy industry assets when everyone is turned off and burned out on the idea. The market will turn around.
https://oilprice.com/Energy/Crude-Oil/IEA-An-Oil-Glut-Is-Inevitable-In-2020.html
IEA is calling for a glut in 2020. Perhaps oil price will take a bit of a dive.
I’m expecting a continuing firming in price from here into the driving season and refinery turn up. With a collapse going into the election. I’m pretty sure the Russians and Saudi’s will back their man.
“I’m pretty sure the Russians and Saudi’s will back their man.” ~ HB
Israel too I would suppose
The glut forecast by IEA depends on strong growth in US tight oil forecast by IEA of 1000 kb/d in 2020. IHS forecast is for 440 kb/d growth in US tight oil in 2020, if IHS is correct there will be no glut in 2020, currently the days of forward supply for OECD petroleum stocks is below the 5 year average, the trade deal recently announced might lead to stronger demand growth than forecast by the IEA, the combined effects of more demand and less supply might lead to higher oil prices.
The IEA is almost always too optimistic in its forecasts, unlike me who tends to underestimate future output, despite my reputation as an optimist, generally my oil forecasts (unless I specifically state that the forecast is intentionally optimistic to try to match some unrealistic forecast by others) that are my “best guess” scenarios have always been less than actual output.
HB. I have used leases developed in our field in the past ten years to demonstrate that shale is high cost. Again, rule of thumb the cost of a conventional well in our field is approximately 1/100 of a shale oil well ($70K range v $7 million range).
Here are some examples with production through 10/31/19:
8 producers 4 injection wells. Cumulative BO 83,466. YTD BO 2,085. First production 4/2003.
10 producers 4 injection wells. Cumulative BO 116,065. YTD BO 2089. First production 9/2005.
10 producers 4 injection wells. Cumulative Bo 55,595. YTD BO 3,023. First production 3/2006.
4 producers 1 injection well. Cumulative BO 37,418. YTD BO 1,289. First production 8/2008.
8 producers 3 injection wells. Cumulative BO 42,494. YTD BO 2,328. First production 10/2008.
4 producers 1 injection well. Cumulative BO 19,216. YTD BO 1,220. First production 12/2010.
8 producers 3 injection wells. Cumulative BO 46,463. YTD BO 1,877. First production 8/2011.
4 producers 2 injection wells. Cumulative BO 10,700. YTD BO 634. First production 10/2011.
8 producers 3 injection wells. Cumulative 59,592 BO. YTD 4,956 BO. First production 11/2011.
1 producer. Water disposed of in adjoining lease. Cumulative BO 7,872. YTD BO 444 BO. First production 5/2012.
8 producers 3 injection wells. Cumulative 56,500 BO. YTD 3,858 BO. First production 6/2012.
4 producers 1 injection well. Cumulative BO 11,758. YTD BO 1,457. First production 6/2013.
2 producers. Water disposed of on adjoining lease. Cumulative 3,524 BO. YTD BO 393. First production 11/2013.
6 producers Two injection wells. Cumulative 25,988 BO. YTD 3,233 BO. First production 9/2014.
Figure in anywhere from $60K-80K to drill, complete and equip each well including electric, flow and/or injection lines. Figure another $20-30K for a tank battery.
Assume anywhere from 12.5 to 20 percent royalty.
Of course, some projects do better than others. But compare this to shaleprofile.com wells.
There was very little drilling in our field from 1987 to 2003. There has been very little since 2015. Century plus year old stripper field.
Shale is expensive oil.
There have also been many reclamation projects in our field during 2005-2014 of abandoned wells wherein the producers went bust in the 1990s, with 1998 being a knockout blow.
We took over 2 wells drilled in the 1950s they were abandoned in 1998. We just had to equip them and build a new tank battery. We also took over three wells also drilled in the 1950s where we had to do the same, plus plug the injection well and convert one producer to an injector. These work well at $55-65 WTI also.
I can also point to many projects developed in our field in the 1980s where cumulative per well has topped 40K BO to date.
Conventional oil is a much better deal than shale usually when you can find it. And also when you aren’t trying to pay for 8 figure CEO pay, skyscrapers and jets out of it.
Shale just has the scale. Huge scale. Worldwide game changing size.
Shallow, I can’t thank you enough. Alot to digest here. My first glance gave me the feeling shale drilling dollars are about half as productive. Maybe you have a better number.
When a new field is drilled, is it always under pressure without the cost of lifting it from the hole? Then once the pressure is exhausted it becomes a stripper?
A lot of the Huntington Beach field lays under the ocean. There is over a mile long row of wells along the shoreline. I’m assuming they go horizontal under the ocean. Only a few wells have lift Jacks. Can strippers wells go horizontal?
There isn’t enough down hole pressure here for natural flow. Everything goes on pumping unit immediately and injection wells are also drilled at the same time as production wells.
To put into perspective, the field was originally drilled over 100 years ago. Waterflood was initiated on a large scale right after WW2. Many wells were plugged in the late 1960s-early 1970s when oil prices were low. The field was redrilled in the late 1970s – early 1980s. Little activity after 1986, until prices took off during the Iraq War.
For example, we operate a lease that was originally drilled in the 1950s. It was plugged out in 1972. In 1979-81, all of the plugged wells were drilled out (casing had not been pulled). New injection wells were drilled.
Cumulative from 9 producing wells since 1979 is over 140K BO with production currently at 5.5 BOPD. It is difficult to tell what these wells produced from 1953-1972, because they were part of a larger unitized waterflood project. Our guess is around 200-250K BO during that time frame.
Only a small company would be interested in 9 wells making 5.5 BOPD, but they have been economic even during the worst part of 2016 (barely during Q1 – 2016).
There haven’t been HZ wells drilled in the shallow zones (1,500’ and below). However, there has been some success with 1,800’-5,000’ TVD hz wells. Not sure of the economics.
There has been success with slick water fracks in deeper vertical wells also.
Correction. Project discussed above was not economic Q1 2016.
Had not included overhead, which is primarily labor. Labor is usually the major expense with stripper wells.
Great comment, SS.
Thanks Greenbub.
Yes great comment by shallow sand.
They all are, but a ton of info in that last one.
You sound angry HB.
I imagine the cornucopian gang will respond poorly to their future hopes… er I mean ‘predictions’ not coming to fruition.
Contributions from research on anger and cognitive dissonance to understanding the motivational functions of asymmetrical frontal brain activity.
https://www.ncbi.nlm.nih.gov/m/pubmed/15130525/
Not at all. Mowed the yard this morning and headed for the gym in a few minutes. It’s another beautiful sunny day here. Probably spend the evening downtown watching the game over a drink.
Life is good and set up to be better as the price of oil rises.
And you ?
Nah, you sound quite cantankerous, perhaps childish even, re: SRS’ POV
Me- I can’t complain
Life is good
Gonna get a BJ later
“Egotists have a strong tendency to talk about themselves in a self-promoting fashion, and they may well be arrogant and boastful with a grandiose sense of their own importance.”
https://en.m.wikipedia.org/wiki/Egotism
Good for you, don’t tell the wife
Price of oil is headed south HB. Temporary dollar weakness is over. You can go look and see the turn in every single currency pair. Particularly the Euro against the dollar and the chinese yuan against the dollar. But you can see it everywhere. In all currency pairs against the dollar. Take a second and actually go pull up these charts and look at them.
Now when the dollar index breaks above 100.00 Let me know where the price of oil is. Dollar index is at 97.10 at the moment. It’s fell off around 200 points since October. Allowing a rebound in the price of oil.
This whole idea of high price oil leading to a switch over to EV’s is so off base from what reality is going to be.
I’m just telling you what the price action is saying. What the actual market is saying. What people with actual money in the market are doing.
Oh one other thing. Make sure your looking at a candlestick chart not a line chart on the daily chart. Otherwise you might just miss what i’m talking about.
Getting price right or really close to right isn’t that hard. You just got to tune out the talking heads. Telling you opec cuts this and shale production will be this by such and such date. Tune out opinions and watch the price action.
HHH correct if I am wrong, but I thought earlier in the year you said that oil would be $20 by now?
that was before the super-predictable thing happened – Fed reversed tightening. But many “in the biz” apparently don’t think the Fed is going far enough, and so will create a dollar rise anyway – it just delayed it by a number of months. HHH might have a different answer, but this is one possible snarky one.
Permian Drillers Are Struggling To Keep Output Flat
Newer wells in the Permian see their oil and gas production declining much faster than older wells, and operators will need to drill a large number of wells just to keep current production levels, an IHS Markit analysis showed on Thursday.
IHS Markit has analyzed what it calls the “base decline” rate, calculating the actual or expected production of all the operating wells at the start of the year and tracking their cumulative decline by the end of the year. Over the past decade, the base decline rate of the more than 150,000 producing oil and gas wells in the Permian has “increased dramatically,” according to the analysis.
https://oilprice.com/Energy/Energy-General/Permian-Drillers-Are-Struggling-To-Keep-Output-Flat.html
LOL,
Steve
Through oct 2019 Permian output has continued to increase. Seems the death of tight oil has been grossly exaggerated. 😉
Yes, when subjective terms such as “increased dramatically” are used, take it with a grain of salt. Nothing beats tracking the data and plotting the trends on a chart to get a quantitative number.
Chart below based on the EIA estimate of Permian tight oil from Jan 2018 to October 2019.
Permian is sum of Wolfcamp, Bonespring and Spraberry colums in spreadsheet at page linked below see “tight oil production estimates by play”
https://www.eia.gov/petroleum/data.php
I am just not seeing the dramatic slowdown in Permian basin output, perhaps it is the rose tint in my eyeglasses. 🙂
Completion rate in Permian basin averaged about 490 wells completed per month from Jan 2018 to Oct 2019 and the annual rate of increase in the completion rate was about 49 new wells per year (about a 10% annual rate of increase.) For the first 9 months of 2019 the average completion rate in the Permian basin tight oil plays has been 510 new wells per month and for the past few months the rate has been 550 new wells per month.
Scenario below is based on a simple model with well profiles developed using data from https://shaleprofile.com/. The scenario assumes the Sept/Oct 2019 Permian basin completion rate of 550 new wells per month continues from November 2019 to May 2035.
The scenario is quite conservative as higher oil prices in the future are likely to lead to an increased completion rate in the Permian basin, it is also assumed that new well EUR will start to decrease in Jan 2019 and by May 2035 the average new well EUR has decreased to 75% of the Dec 2018 average new well EUR in the scenario presented. The URR for the scenario is about 55 Gb.
Hi Dennis, The graph you show doesn’t have a dramatic slowdown. Yet. Consider that the Baker Hughes rig count for the Permian has declined as follows:
486 on 12/14/18
454 on 3/29/19
441 on 6/28/19
414 on 9/27/19
399 on 12/13/19
There is a large lag between the time a rig is drilling and when a well reaches peak production. One approximation is to use 6 months as an average. We all know that due to the rapid declines shale wells have, a large effort is needed just to maintain production. I don’t know how many rigs are needed just to maintain permian production, but my guess would be that we are nearing that level today, if so your graph will be moving toward flat over the next six months or so.
Meanwhile, Scoop, Stack, Bakken, Eagle Ford, and Niobara as well as conventional production are all going to be challenged to maintain current production. I still expect lower 48 onshore to begin declining with the November 19 monthly report.
dclonghorn,
It seems that from Dec 2018 to April 2018 the fall in the rig count had little effect on the completion rate (if the EIA estimate of Permian completions is correct), over that period the rig count fell, by roughly 36 (interpolating on the data in your comment) while completion rate increased by 27 (519 to 546). Possibly this was due to more DUCs being completed, we have seen a bump in oil prices of late, this may lead to higher rig counts.
So far US tight oil output has been more resilient than I expected, perhaps rigs are being utilized more efficiently, if you are from Texas (as your name implies) you would know better than me. I am just looking at the output data and completion data, the completion rate has increased at about 50 per year, the scenario assumes that falls to zero, perhaps that will occur at current rig count levels. At some point rig counts may increase as oil prices rise. We will have to wait for the data.
Hi Dennis, I have seen some reports that DUCs have been falling both overall and in the Permian. The effect of the fall is to partially offset the declining rig count, at least as long as DUC count keeps falling. There appears to be quite a few DUCs left although some folks say a lot of them are “dead ducks” because they are bad holes, or exist as bungled paperwork. I don’t know how much excess DUC inventory there is, but from reading quarterly press releases, it seems that the excess inventory is probably thinning out pretty quickly.
One of the other factors that I believe has helped maintain the growth rate of Permian production recently is the completion of some oil and gas pipeline projects in August and September. These projects increase takeaway and decrease the cost of takeaway, which results in a production bump in the areas affected. Additional pipelines are under construction although the recent completions seem to have solved much of the current takeaway issue.
Yes, I am from Texas and was in the oil and gas biz some time ago, now I just observe. From what I can tell, the industry continues to become more effective in many ways, although the big productivity gains seem to be over for now.
Thanks DC I agree a combination of more DUCs and greater efficiency of operating rigs might explain continued Permian output growth.
I expect the rate of growth will be lower due to the fall in rigs and frack spreads. May show up in output data in a month or too, typically there is a seasonal slowdown in winter, though perhaps less so in Permian basin than Williston.
Have looked at the Chevron specifiers. No evidence they are backing away from Vaca Muerta.
Further, Total has sent some money there.
Chevron will regret its Vaca Muerta Shale Investments.
It is amazing to see seemingly intelligent people throw money away into the neverending Shale Energy Pit.
We will look back ten years from now and wonder how completely insane it was to believe in the Shale Energy Ponzi Scheme.
steve
Only if one believes the world will transform to a carbon free energy system to save plant earth soon
LOL,
steve
The economy is decarbonizing, slowly, but not to save the world, and maybe not in time to save the world.
The reason for the decarbonization of the energy and transportation sectors is that carbon based energy can only be accessed by first collecting and then burning carbon rich materials, and then making use of the hot (fluid) liquid or gas collected from that fire to produce mechanical energy.
This is a Rube Goldberg solution that has served mankind well for centuries, but it makes less and less sense as methods of directly harvesting ambient energy improve.
Just as word processors replaced typewriters, electronic readers replaced dead tree media, and chip storage replaced scratchy LPs, wind and solar are replacing fossil fuel. Nobody tried to save the world from typewriters. They vanished because the technology was no longer up to date.
Put another way, cheap oil isn’t much of a defense against EVs. Oil gets sold because there are vehicles on the road that burn it, just like hay used to b big business in the horse drawn era.
Car makers are going to dramatically slow or stop manufacturing combustion engine vehicles in the next few years. It’s already happening. New ICEs are too expensive to design, and new IC vehicles are too expensive to build.
Fleet sales will switch first. The main effect of that in the short term will be to worsen the already doubtful business model for developing new engines. So ICEV innovation will fall behind EV innovation.
Americans think they will be immune because Americans love gas guzzlers. But what Americans really love is what there corporate overlords command them to love on TV. Rmmbr when very American household watched I Love Lucy, and GM used the ads to tell Americans that those stupid fins on Cadillacs we (get this) “beautiful”? Some people still believe that. People were shocked by the lack of fins, paint, and other doodads on the Tesla truck. Trucks are supposed to “look tough”.
So what does corporate America want? Short term profits to please the bankers. Just look at the Boing 737 MAX saga to see what lengths corporate America will go to avoid development costs. Detroit is piling into EVs now because it cuts development costs. Stay tuned for the ads explaining to you why after decades of worshiping gas guzzlers, you suddenly don’t like them any more.
You may not be aware that the price of oil in Argentina is not the same as the price of oil elsewhere in the world.
Production numbers for Norwegian oil and gas for November are out:
https://www.npd.no/en/facts/news/Production-figures/2019/production-figures-november-2019/
Growing towards 2 Mbpd for November as the new 2.2 to 3.2 Bn barrel Johan Sverdrup oil field comes online. The field is expected to produce 440 000 bpd next year, and peak at 660 000 bpd by 2023. The field is planned to produce for at least 40 years.
Also interesting is that Norway’s oil output is 216 kb/d higher than forecast.
Well Johan Sverdrup is already at 350000+ boepd, that is a lot sooner then expected so there is your 200 difference.
Norway peaked years ago at 3 mbpd (around 2010). Is it really news that one of the last offshore bonanzas has managed an inconsequential production bump? All the way past 2 mbpd.
Nobody has suggested Norway will reach a new peak. The decline rate will be reduced for a few years and then will continue.
It happened with the UK when Buzzard came online
Price of oil does have problem that will play out over next 6-8 months. Without a trade war and Brexit hanging over markets. There isn’t a whole lot of reason to be holding government bonds which yield next to nothing or less than nothing in some cases. Fed is buying bills so Repo market won’t implode into another 2008. Only problem is they need to be buying coupons or treasuries also. They are buying some treasuries but it’s not near enough to hold interest rates down. Yields on debt are going to rise without something like a trade war holding them down. That is a problem if your long oil.
Keep an eye on 10 year US treasuries. If they become just a little less liquid and yields rise as i believe they will. These OPEC cuts aren’t going to mean as much as some might think.
Some people believe ‘the market’ for crude oil is a fair and effective arbiter of the industry supply and demand.
But if we step back an inch or two, we all can see it has been a severely broken mechanism during this up phase in oil.
For example, there has been long lags between market signals of shortage or surplus.
Disruptive policies and mechanisms such as tariffs, embargo’s, and sanctions, trade bloc quotas, military coups and popular revolutions, socialist agendas, industry lobbying, multinational corporate McCarthyism, and massively obese debt financing, are all examples of forces that have trumped an efficient and transparent oil market.
And yet, the problems with the oil market during this time of upslope will look placid in retrospect, as we enter the time beyond peak.
I see no reason why it won’t turn into a mad chaotic scramble.
We had a small hint of what this can look like in the last mid-century. The USA responded to military expansionism of Japan by enacting an oil embargo against them. The response was Pearl Harbor. This is just one example of many.
How long before Iran lashes out in response to their restricted access to the market?
People generally don’t respond very calmly to involuntary restriction on food, or energy, or access to the markets for these things.
The new US defense bill, agreed on by both parties, includes sanctions on executives of companies involved in the completion of Nordstream 2. This is companies involved in laying the remaining pipe, and also companies involved in the infrastructure around the arrival point.
This could include arrest of the executives of those companies, who might travel to the United States. One of the companies is Royal Dutch Shell, who have 80,000 employees in the United States.
So much for the “Free Market”.
The EIA has just released the data for US Oil and Gas proven reserves for 2018.
Table 1. U.S. proved reserves, and reserves changes, 2017–18
They say US C+C proven reserves total 47.1 billion barrels. Assuming our average C+C production is 12 million barrels per day that puts our reserves to production ratio at 10.75. That is a real shocker. I thought it would be much higher than that. Check my math. The data is in thousand barrels.
Daily production 12,000
Days per Year 365.25
Annual Prod.. 4,383,000
Proven Reserves 47,100,000
R/P ratio…… 10.75
Ron,
Your arithmetic looks spot on. Last year the R/P was 10.64. Not sure why you are surprised, I am guessing you thought it would have fallen rather than increased, note that in 2009 SEC rules were changed so that reserves are based on a different price than 2008 and earlier, see article below.
https://www.stout.com/en/insights/article/understanding-sec-oil-and-gas-reserve-reporting/
2019=$55.65/bo
2018=$65.66/bo
2017=$51.03/bo
all based on EIA spot price for WTI for first day of each month from Jan to Dec.
Prices used for SEC oil reserve calculations were pretty high in 2018 relative to 2017 ($14.63/bo higher) which may have bumped up reserve estimates for year end 2018.
Dennis, I am not surprised that it increased. They said they found 7.2 billion barrels of new oil, in the Permian I assume. I have my doubts but for the time being, I will take their word for it. My surprise was that it was so low. I had just assumed the US R/P ratio would be somewhere around 20.
Interesting article by HFI Research yesterday, making the case for the start of a multi year bull market for oil.
https://seekingalpha.com/article/4312385-oil-things-are-starting-to-look-brighter
Also lots of Goldman Sachs charts, with the one below showing a peak plateau from 2022 to 2025. The legend is missing 3 shale plays. The bottom dark blue is Delaware (Permian), Midland (Permian) above and Bakken, the grey.
My own guess is US shale oil will peak in 2021.
This Goldman Sachs chart from the same HFI article above shows a US shale oil peak in 2023, followed by a decline to 2050.
The chart says Big 4 but should be Big 6. The dark green is STACK/SCOOP and light green, Marcellus.
If so, output will not drop below current production levels for 20 more years!
I’d be curious to see if they had production estimate for US nat gas as well .
Note that these charts are “liquids production”, which would include NGL. A better estimate would look at C+C, but NGL output from “big four basins” might not be that great. The scenario above looks reasonable through about 2027 (if NGL output is not significant), decline from 2027 is likely to be steeper, my best guess scenario (all US tight oil) has a peak in 2025 around 10 Mb/d and output falls to about 5.4 Mb/d in 2040 and to under 1 Mb/d by 2050, so the Goldman Sachs scenario seems optimistic. My best guess scenario for all US tight oil has a URR of 89 Gb. Permian, Bakken, and Eagle Ford about 75 Gb, peak for these 3 basins (equivalent to big 4 above) for my scenario is 8.7 Mb/d in 2025, output falls to 4.5 Mb/d in 2040 and to 600 kb/d in 2050.
NGL’s go to the refinery and market just like the rest of shale oil liquids don’t they?
If so, it makes sense to keep them in the same bucket for projection purposes, no?
Hickory,
NGL is a very small input to refineries, mostly it is used either as a heat source (propane and other bottled gases) and as an industrial input for petrochemicals (mostly plastic and synthetic fibers). As the product that is likely to be constrained is liquid fuel (and here I will refer to fuel that is a liquid at 1 atmosphere of pressure and 20 C).
So no, I would disagree that bottled gas should be lumped together with Crude plus condensate, it is crude plus condensate that is the major input that produced gasoline, diesel, home heating oil, jet fuel, residual fuel (used in ships and industrial boilers), and kerosene.
Most of the rest of the “petroleum products” are by products that we have found a use for, but are less important in my view.
Interesting article on seeking alpha about why Opec can now push up the price without starting a third shale boom.
https://seekingalpha.com/article/4310727-analysis-why-opec-can-push-up-price-and-not-risk-third-shale-boom
The basic premise is that productivity per completion has stalled, and there is no longer a huge overhang of cheap frac spreads keeping the frac market oversupplied.
dclonghorn,
Your article goes into a lot of depth. I noticed these statements:
“The main driver of Legacy Loss is Total Production, which is logical.
In Permian, higher Initial Production (IPt) increased legacy loss, probably because new wells deplete faster than old wells”
New wells depleting fasting than old wells partly explains why the monthly legacy loss keeps increasing from month to month. It’s not close to 600kbd/month, according to EIA DPR.
The chart below from the article shows Jan 2015 as Peak Shale No 1 as legacy loss was above new monthly shale production. The author says when “red line gets above new monthly initial production then that’s Peak Shale No 2”, which might happen as soon as early 2020. This is shown by the dashed line “IPt minus Legacy Loss” reaching zero, which means Peak Shale No 2. The author says that this could happen if WTI stays at $55.
It’s not close to 600kbd/month, according to EIA DPR.
I think you meant: “It’s now close to 600kbd/month, according to the EIA DPR.” I added the total legacy decline, from the DPR, for all seven basins for December. Totals below.
(274,421) Permian
(55,430) Niobrara
(1,282) Haynesville
(120,388) Eagle Ford
(74,415) Bakken
(7,654) Appalachia
(45,027) Anadarko
(578,616) Sum
I find it very interesting that total production of new oil peaked in mid 2018 and is now in decline while legacy decline continues to increase.
A lot of people fail to realize that this is a race with the Red Queen. They will have to produce almost 600,000 barrels per day of new oil in December just to stay in the same place. That is a herculean task.
Ron
Both Tony and I posted projected DPR data for December in an earlier post showing the closeness of production and decline. Production only exceeds decline by 48.2 kb/d in December. Essentially decline consumes 92% of new production. I think you had previously put a chart/info showing how decline was eating a significant portion of new production.
Ovi,
Another way to do legacy decline and new well increase is to use shale profile ( https://shaleprofile.com ) data for maximum well output in 2016, 2017, 2018, and 2019 and then used DUC data for Bakken, Eagle Ford, Permian, and Niobrara (coincides with the shaleprofile areas covered.)
From shaleprofile well quality tab (maximum per year)
2016, 523.1 b/d
2017, 582 b/d
2018, 642.9 b/d
2019, 683.8 b/d
https://shaleprofile.com/2019/12/03/us-update-through-august-2019/
This chart gives a different story from DPR.
Note that if we consider only data from Jan 2018 to Oct 2019, the legacy decline and new well increase cross in mid 2024. Note that I doubt such an extrapolation would be accurate.
Dennis
I don’t have access to Enno’s data and cannot comment. I have comment further down.
Ovi,
For shaleprofile data see well quality tab at
https://shaleprofile.com/2019/12/03/us-update-through-august-2019/
I just picked the maximum output from the well profiles for 2016, 2017, 2018, and 2019.
Then I used completion data from the EIA DPR page see right column of page below (DUC data has completion data as well). The Niobrara, Bakken, Eagle Ford, and Permian data was used for completions as that lines up best with the shale profile US data.
https://www.eia.gov/petroleum/drilling/
All of this data is publicly available.
Also you need the tight oil data from page below, see “tight oil production estimates by play” excel link at page linked below.
https://www.eia.gov/petroleum/data.php
So new well production is completions times max well output, total production increase from monthly difference in “tight oil production estimates by play” (or monthly delta tight oil output) and legacy decline is new well increase minus tight oil output monthly production change (delta output).
My guess is that this estimate will be far better than the DPR estimate.
Ron,
You’re right I meant “now close to 600 kbd/month”. Maybe it will be 600 kbd/month in the next EIA DPR on Dec 16.
https://www.eia.gov/petroleum/drilling/
Yes it is a race with the Red Queen and the monthly legacy decline rate keeps increasing linearly, month to month.
Ron,
I think you might mean the change in total production peaked in 2018. Over that period the completion rate was rising rapidly in the Permian basin. It is expected that the rate of increase will slow down.
How fast this slow down happens will depend in part on the price of oil.
Dennis, what actually peaked in mid-2018 was barrels per day of new oil. That’s what I meant to imply and that’s what happened. If you read my post again, you will see that is exactly what I said. I am not a fool Dennis, I know that the total amount of shale oil has continued to increase. Yes, that new oil kept the total production increasing but increasing at a lower rate.
What this means is that the total production of shale oil will soon start to decline. That is the bane of shale oil that most folks simply don’t understand. The legacy decline rate of shale oil is about 12 times that of a conventional field. That is, a shale basin declines at about 6% per month while a conventional reservoir declines at 6% per year or less.
Therefore barrels of new oil must continue to increase because the decline rate is applied to the entire basin, not just new wells. Of course the newer the well, the greater the decline.
Nevertheless, unless monthly new oil increases the legacy decline rate will soon equal new production rate and the production of the basin will flatten out. That does not mean it will decrease, it will flatten. The peak will have been reached.
Bottom line. If the rate of new oil peaks then the total peak must be only 12 to 24 months away. When the legacy decline equals barrels per day of new oil, then you have a peak plateau. And when barrels per day of new oil falls below the legacy decline rate, that will be the start of shale oil decline.
Ron,
Sorry, I missed the “new”. Legacy production change does not always decrease (or increase in absolute value). As fewer wells are completed the legacy production decrease gets smaller (absolute value). See DPR data for legacy production change from 2015 to 2017 to convince yourself of this fact. Basically when completion rate stops increasing the legacy decline rate gets smaller in magnitude (absolute value).
Eventually the US tight oil output level will stop increasing, but not until 2024 at the earliest and possibly as late as 2026.
The belief that peak output is 12 to 24 months after peak “new oil” depends on the assumption that legacy production decline maintains a steady slope, this is not generally the case, the slope will change as the completion rate changes, when completion rate is unchanged (held steady) the slope of legacy production change quickly approaches zero.
Dennis, new production went from about 500 kb/d in the middle of 2017 to about 650 kb/d in the next year or so. It is now around 610 kb/d. I expect it to keep dropping and apparently you do not. However, I believe it will be around 500 kb/d by the end of 2020.
Of course, legacy decline will decline also. Buy it will lag new oil decline. That’s exactly what happened in 2014-2015. Look at the chart Dennis, there is no reason that legacy decline will not lag this time exactly as it did before.
If new oil declines then overall production will decline also, with some lag time. Why, in the name of Posiden, or whatever God you happen to worship, would you expect it not to do so. 😉
Hi Ron,
It depends on the relative rates. Note that it is not that I expect it will not occur, just not in 12 to 24 months.
From March 2015 to March 2016 the US tight oil completion rate (Bakken, Eagle Ford, Permian, and Niobrara) fell from 1063 to 429, today the completion rate is about 1059 (similar to March 2015) do you expect the completion rate will fall to 429 in the next 5 years? I certainly do not. I use models that match history very well, USGS TRR estimates and economic assumptions based on what I have learned from industry professionals like Shallow sand, Mike Shellman, and others (http://theoildrum.com/node/9506). The models suggest that if the completion rate gradually rises through about 2026, then tight oil output peaks around 2025. After 2026 the completion rate flattens then gradually declines as gradually falling EUR makes completing new wells less profitable as sweet spots run out of room.
I have no opinion on God. Some things are beyond our understanding.
The models suggest that if the completion rate gradually rises through about 2026,…
And you actually believe that completion rates will gradually rise through 2026? Rigs are being retired and frack spreads are being sold for scrap. But the model suggests that completion rates will rise?
I just don’t understand what planet you are living on Dennis.
Ron,
No the model assumes nothing about completion rates. So far completion rates have risen since 2016. It maybe that the rate of increase slows (I assume as much), but with oil prices rising completion rates are likely to continue to rise in my opinion.
Even if completion rates are flat (I doubt they will fall before 2026) output continues to rise until at least 2023.
As I often suggest, higher oil prices will tend to lead to higher completion rates, the more slowly tight oil output rises, the higher oil prices are likely to be.
completion rates average about a 180 well annual increase in completion rate form Jan 2016 to Oct 2019. The best guess scenario has completion rate increasing at an average annual rate of 42 wells per year. That is 4 times slower than the past 3.75 years. A pretty conservative scenario in my opinion.
One of the comments from the above referenced article seems to be from one of the principals at primary vision, they know a lot about the fracking biz.
mjohnson1
Comments4 | + Follow
Supply is gonna be tighter in 2020, we wrote a note a few weeks back: Roughly 10,000,000 horsepower of equipment has been subjected to weakened demand, field rotation, unplanned maintenance, consolidation, moved abroad, sold off for parts, or been deemed unusable in the last 18 months.
Matt – Primary Vision
08 Dec 2019, 04:09 PMReply4Lik
I have no personal knowledge of it, but it makes sense that with high fluid pressures, abrasive sand, and strong chemicals frack units should wear out more rapidly compared to say a drilling rig. With completion costs around 70 percent of well cost the lack of cheap pumping horsepower may be a harbinger of increasing well costs. How much is 10 million horsepower? I think that equates to around 180 spreads. If that comment is close to correct, we may not have much cushion left. How does Halliburton spell pricing power?
As most everyone who is watching the shale biz knows, one of the major reasons it has been able to persist is the continued reduction of the cost to produce a barrel of shale oil. When costs to drill and complete wells quit declining it messes up the model even for the top producers. Add in parent/ child well issues, tier 1 locations mostly developed, and Wall Street wanting a return on investment.
These statements are from this Oct 30 2019 article.
https://www.rigzone.com/news/wire/frackers_scrap_idled_equipment_amid_shale_drilling_downturn-30-oct-2019-160198-article/
1 With almost half of U.S. fracking firepower expected to be sitting idle within weeks, shale specialists including Patterson-UTI Energy Inc. and RPC Inc. are retiring truck-mounted pumping units and other equipment used to shatter oil-soaked shale rock.
2 Estimates for total U.S. fracking capacity vary but Bank of America Merrill Lynch puts the figure at almost 25 million horsepower. Just 13 million of that is forecast to still be at work during the final months of this year, down from 17 million during the second quarter of 2018, according to Bank of America’s Chase Mulvehill.
3 About 2.2 million horsepower, or roughly 10% of industry capacity, already has been earmarked for the scrap heap, according to Scott Gruber, an analyst at Citigroup Inc.
The more aware I become of these shale oil indicators, the more I guess that US shale oil could peak in March 2020.
Tony,
Keep in mind that trends often change over time.
If you are correct about a 2020 peak in tight oil, it is likely to be temporary, peak will be 2024 to 2026 with 2025 my best guess.
And what, Dennis? How, pray tell, will 17 million horsepower -and other infrastructure including manpower – magically re-appear in 2020 and inflate another peak? With existing shale finances in the tank, $300 billion of already accumulated and un-repayable debt, and Wall Street financiers demanding repayment on their investments, your prognostication for a rebound has a tinge of ‘wildly unrealistic’ about it.
ExxonMoble boe per day is 2.25 millon and has a market value of $300 billion. The tight oil shale play over the last decade has increased production 7 million bpd. Is $300 billion of debt really out of line? Do you have CFO experience with a multi-billion dollar company?
In the trucking industry the major freight companies running 24/7 turn their tractor fleet over on a 5 year rotation receiving 20 cents on the dollar at retirement. Ready mix trucks are turned over after 10 years rotation at 20 cents or less on the dollar running 12/5. When the business environment is good. It’s easy to delay retirement a little to meet demand. When times are difficult, the old trucks sit in the yard and can be stripped for parts.
I have to question your hair on fire comment. Do you know the life expectancy of a drilling rig for a large corporation ? The related article is talking about retiring 10 percent. That’s a 10 year rotation. Maybe replacement is just cost efficient verses down time. The big boys don’t work on the same time frame as the little guy.
HB. $300 billion divided by 7 million comes to over $42,000 per barrel of debt. IMO that is a high level of debt unless oil prices recover to 2011-14 levels.
Only the best oil production is selling for that in our part of the world and that is production with a decline rate of 3% per year or less.
Regarding XOM, keep in mind that includes not just the upstream, but the midstream and down stream, both of which are substantial.
XOM also has substantial international upstream assets which are generating substantial cash flow at $60s Brent.
Shallow, XOM has a chemical business too.
OXY spun off CRC with $6 billion in debt and 150k boe in late 2014. Based on $100 oil. $40,000 per barrel of debt. They get Brent pricing.
Is shale expensive? I don’t know. But, it cost $100 plus to replace it on the open market(2011 to 2014). At 7 million bod, that’s a lot of jobs here and keeping the money in house(U.S.).
Cheap market oil is keeping inflation in check and the economy rolling. Long term, I expect the price of oil to increase as markets balance reflecting production costs. Iran,
Libya and Venezuela are all wild cards on the supply side.
I also believe CRC is a $100 stock with firm $100 Brent and the shale play is based on that pricing too.
HB. CRC has generally good assets in not such a good location. CRC was saddled with too much debt, the max reasonable at $100 Brent.
CRC isn’t a bad one to gamble on. Better than the lottery.
But make sure you can stand to lose it all too.
Mr Sutherland,
Perhaps there will be a temporary peak in US tight oil output (or an inflection point where the output curve flattens) in 2020 or 2021. Can you predict what might happen to the price of oil if that occurs? Do you think oil prices are likely to rise or fall?
What happens to tight oil profitability if oil prices should rise (will it be higher or lower)?
What are tight oil producers likely to do in the face of higher profits?
The average annual rate of increase in the US tight oil well completion rate was 265 wells aver the Jan 2016 to June 2018 period. The annual rate of increase in the tight oil well completion was 90 wells from July 2018 to November 2019. The scenario below is based on a “Red Queen” type model (see http://theoildrum.com/node/9506) and well profiles based on the Arps hyperbolic model fitted to data from https://shaleprofile.com (thank you Enno Peters).
The average annual increase in the tight oil well completion rate for this scenario is 23 wells over the Dec 2019 to Jan 2025 period. In my view the scenario is quite conservative, it assumes Brent oil prices (2018$) gradually rise from $65/bo in Dec 2019 to $90/bo in Jan 2027 (a linear increase of about $3.57/year in 2018$.) After reaching $90/bo it is assumed oil prices remain $90/bo until 2037 and then gradually fall to $40/bo by 2067 and then remain at $40/b until 2079 (end of scenario). Peak for this scenario is 2025 at 9.73 Mb/d, URR is 86 Gb.
Last thing, most people here think my “best guess” scenarios are wildly or outrageously optimistic, but historically they have either been close to correct (not often though) or too pessimistic (nearly every time). The scenario presented here is actually a bit lower than my best guess which is about 10.2 Mb/d in 2025 with a URR of about 88 Gb. In other words I expect the scenario presented here will be low, I would guess about a 60% probability US tight oil output will peak at a higher level than this scenario.
I very much agree, and I don’t know why this is not a more mainstream view. A limited amount of frack spreads going into the winter can only mean production will suffer. The oil price lives its own life, but if the market really is misinformed (strong suspicion)…the ketchup effect will come in 2020. I really think the investment cycle in oil should have started in 2018/19. But when just about everyone try to demonify oil as an investment, then that scenario has to wait until 2020 as far as I am concerned. Not sure the physical market can withstand it longer than that.
The interesting part is what happens if/when oil prices go up. What is the response from shale oil?
kolbeinh,
I expect an increase in oil prices will lead to a higher completion rate and higher tight oil output. There is typically a 4 to 6 month lag between the move in oil prices and a response in the completion rate. So if the current oil price move is sustained we might see the rate of increase in tight oil output increase in the April to June 2020 time frame.
https://www.rystadenergy.com/newsevents/news/newsletters/UsArchive/shale-newsletter-dec-2019/
In this article from December 2019 Rystad have studied the break even cost of the biggest Shale field in US. Seems from this break even price have been stabile since 2014 and is now aprox. 45 usd each barrels. I believe if this is true the operators manage to offset the impact of fewer sweet spots Thiere 1 or what is emention in Reports as Thiere 6 wells that had break even price 18 usd with increased drilling productivity and lately we have seen more use off DUCs. I also believe Capital cost like interest and vallons are not including. If profit where 10 usd each barrels I believe 3 of 4 Companies in US shale would not deliver red inc on the bottom line 3Q 2019. Interesting to read others view of this report… espesialy from pepole that have grown up in this Shale Buisiness and are a part of it every day. Another question , think it was SS that emention the production pipe could get hole in the production section that could lead to pressure drop and is a very exspensive issue to repear that could dammage all profit of that well. I am interesting in this issue, what cause thoose whole, is it tear from oilflow that carry with back propant? How can this be repeared. ?
https://seekingalpha.com/article/4293580-wrights-law-continues-drive-shale-breakeven-costs-lower
Here is another article regarding breake even price US shale. Seems from this there was a change in profit in 2019.
Thanks Freddy. Another good article here about Wright’s Law and EV battery prices…
>> Moore’s Law Isn’t Dead: It’s Wrong – Long Live Wright’s Law <<
https://ark-invest.com/research/wrights-law-2
Yes, it isn’t time that drives price reduction, it’s number of units produced. That is why the “Crossing the Chasm” strategy works when new products are introduced. First you target early adopter niches with a relatively expensive product, und then the price falls thanks to the sales to those customers. That allows you to address niches that require lower prices, and the cycle repeats.
Or you can start with a lower price, if you can afford to subsidize the product until it reaches scale. This has been popular with Japanese companies, e.g., Toyota and the Prius.
OT:
1900 — German physicist Max Planck publishes his groundbreaking study of the effect of radiation on a “blackbody” substance, & the quantum theory of modern physics lives.
Interesting analyze from Seeking Alpha.
https://static.seekingalpha.com/uploads/2019/12/13/5006891-1576233676424615_origin.png
This shows the peak in US shale was in 2018 and from now the increase yoy will be lower. I strongly believe their estimate regarding offshore discoveries is true, lots off wells that was very promising was drilled in 2019 and was dry or not economical to develop. Equinor is now drilling a very promising deep water well in Brazil with huge potential , but even with a good result it takes 5 – 10 years to build out. We might need to relay on Opec , Saudi if they have spar capacity left…
Freddy,
Again 2018 was the peak rate of increase in shale output, different from a peak in output. The slope of the output curve will change over time. When the slope is zero we have reached a maximum, minimum, or inflection point.
Dennis, what actually peaked in 2018 was barrels per day of oil that came online in the last total month of measurement. That amount was about 650,000 barrels per day in mid 2018. Legacy decline was about 500,000 barrels per day. That left a net increase of about 150,000 bpd in 2018, or somewhere near that figure.
Today barrels per day of new oil is about 610,000 bpd. Legacy decline is about 575,000 barrels per day. Leaving a net increase of about 35,000 bpd. It will be above that some months and below that some months but I believe that will be the average during the first half of 2020.
Ron,
The EIA’s tight oil production estimates by play are better than DPR, see page below.
https://www.eia.gov/petroleum/data.php
For past 3 months the average increase in US tight oil output was 95 kb/d each month and for the past 9 months the monthly average increase was 77 kb/d.
Impossible to predict future increases, my best guess scenario has about a monthly increase of 57 kb/d in the first half of 2020.
Okay, you are guessing 57 kb/d average monthly increase for the first half of 2020 and I am guessing 35 kb/d. We will see who is closest.
I’ll guess 25kbd
Ron,
Based on the sharp drop in Permian basin completions reported for November, I think your 35 kb/d for the average monthly increase in tight oil output for Jan to June 2020 will likely be the better estimate. My initial guess will only occur if the completion rate quickly rebounds to the October level, that seems unlikely. There was about a 10% drop in the Permian completion rate in one month, yikes!
Dennis, Ron, Tony
Something is happening within the EIA that is making some of their latest data look more consistent, IMO.
The latest STEO data is showing some consistency with the DPR. Extrapolating the November DPR data via a straight line indicates that new monthly production and decline will be equal on Feb 4, 2020.???? That could change tomorrow when the latest update is released.
Early last week, the December STEO was released. On average it showed a reduction in US production of approximately 100 kb/d for each month in 2020 in comparison with the November report. More interestingly, it showed very flat production after May 2020. So between the STEO and the DPR, they are both showing a potential peak between February and May.
Below is a summary version of the December STEO and projected monthly increase to May 2020. The increase shown in November was based on optimistic output for both Alaska and GOM.
————— —— —Dec 19—-May 20—-Nov 20—-Avge Inc to May
Domestic Prod.—- 12.99——13.25—-13.30 ———50 kb/mth
L48 – GOM. ———10.46——10.72—— 10.79—— 50 kb/mth
L48. ——————- 12.60——12.75 ——12.80 ——-30 kb/mth
So pick your answers. More critically, output could peak in the first half of 2020, provided WTI stays close to $60. If it gets to $70, Dennis, rerun your models.
Ovi,
Compare Dec 2018 STEO with Dec 2019 STEO for L48 excluding GOM (probably reflects tight oil best) or see my comment downthread. The Dec 2019 STEO might be pretty good through June 2020, if it is similar to Dec 2018 forecast, it may miss badly by Dec 2020. My “best guess” models might be equally bad as they are based on an assumed future completion rate scenario for tight oil wells which is very likely to be incorrect.
For the Jan 2017 to Dec 2018 period the trend for completion rate for Permian, Bakken, Eagle Ford, and Niobrara was an annual rate of increase of 218 new wells (443 to 850).
For the Jan 2019 to Dec 2020 period (with a guess at completion rates from Nov 2019 to Dec 2020) the trend in the completion rate is an annual rate of increase of 61 new wells (a rate that is 3.6 times lower than the previous 2 years). The completion rate in Jan 2019 was 770 wells and in Dec 2020 it is assumed to be 912 wells, the Oct 2019 completion rate was 852 wells. Over the next 14 months the average annual rate of increase in completion rate is about 51 wells (60 wells over 14 months).
If anything, my scenario is likely to be too conservative as has always been the case for older scenarios I have created.
There was a decline in oil production in the Bakken a month ago. That decline disappeared in the most recent numbers. Was there an explanation?
Watcher
Attached is the latest Bakken chart, updated to October. The September dip is still there.
Ya, I was looking for a why explanation.
Watcher in Sept the inactive well count was 2104 and in August it was 1675 according to director’s cut from Nov 2019, so potentially just maintenance or perhaps tighter enforcement of gas capture rules, no explanation was given, but gas capture rate did go up a bit in Sept vs Aug (82% vs 81% with a goal of 88%). May have been coincidence, we do not know.
In Oct the gas capture rate remained steady at 82%, but inactive well count decreased from 2104 to 1683 from Sept to Oct. so inactive wells may be the better explanation for the Sept decrease in output. As to why the inactive well count changed so much, no idea.
Watcher
I misunderstood your question. I thought it implied that the Sept dip had vanished, i.e. September was bigger than August.
Don’t think we’ve seen this before any month weather was not an issue. Curious.
Watcher,
See May and June 2017 and June 2018 at
https://www.dmr.nd.gov/oilgas/stats/historicalbakkenoilstats.pdf
In both cases output dipped and then recovered, but generally you are correct that we tend to see this in winter in Williston basin.
https://www.market-ticker.org/akcs-www?post=237637
Given shale oil dependence on debt / financialisation for “sustainability”.
I find Denningers analysis that the financial system is about to blow up based on basic exponential algebra relevant.
His opinion is there is only one escape, and that is to blow up the entire medical industry (20% of GDP) in USA and end deficit spending.
Ironically, Mr. D is a peak oil denier because he thinks we can convert coal and kerogen to liquid fuel.
If you live is USA, (I moved a decade ago)
And you have a medical procedure you need done.
I would recommend not procrastinating and getting it done soon.
8% expense growth (faster than GDP) is unsustainable.
The real problem with american health care is bad management. Hospitals have no idea how much it takes to cure a patient, and they sell treatments instead of cures. They don’t know how much the treatments cost either, so they just make up numbers. Pharmaceutical companies charge whatever they can get away with, as the price of insulin shows.
Patients need more protection and better coverage so that insurers are forced to keep the healthcare providers honest. That is why insurers need to be forced to provide coverage. Markets economics works because the guy who pays applies pressure to the guy who delivers the goods. This idea needs to be applied to health care, and prices would get back in line with other rich countries.
The real problem with the medical system in America is that expenses are
growing at 8% annually because of illegal monopolistic behavior.
3% gdp growth vs 8% medical is mathematically unsustainable.
To stop it, you have to break up the monopolies. That will cause medical expenses to collapse by 80% effectively destroying the industry (until it recovers and than is better cause everything is cheaper).
K. Denninger (former tea party guy) has written on this extensively.
He is a climate change and peak oil denier but a super smart financial guy.
http://www.market-ticker.org
He thinks the nation is done.
This is an oil blog…so I will stop now.
thanks!
Don’t get me started; 2 decades in “the biz”.
“The practice of opulent tertiary medicine in the present context of increasingly desperate public health problems worldwide and an approaching catastrophe of human misery is not only immoral, it is obscene, horrible, terrible, and repellant.” ~ Andrew Jameton, Casuist or Cassandra? Two Conceptions of the Bioethicist’s Role (1994)
Breaking up the supposed monopolies won’t do any good. The problem is lack of control from the buy side.
Individual patients can’t negotiate with health care providers. Insurers, who should be the payers, have the resources to do so. But they find it easier to screw the patients than to take on the providers.
An example of this is America’s very poor record on hospital readmissions. The cause is not monopoly power, but a lack over oversight from payers.
Breaking up monopolies won’t do any good? Are you serious?
It will cause competition to enter the market and cause outrageous prices to decrease.
$100,000 appendectomies will become 20,000 or less.
Also, monopolies are illegal.
Also, medicare and medicaid won’t destroy the government financially.
I lived in America and you can’t switch jobs cause if you lose your insurance your f*cked.
I had a kidney stone one time and experienced a panic attack wondering what the bill was going to be. The panic was worse than the kidney stone.
They can pretty much make it anything they want it to be, without telling you what they will charge you.
I now live in a country where the medical is “free”. It is much much better.
And this country pays much much less while still using american medical equipment and procedures
because it is not a MONOPOLY
Pretty big riots in India. Should hit consumption. I would expect it won’t show up until next year’s January numbers, tho. Too late in the year.
A country not remotely survivable.
But I believe Pakistan will go over the falls first.
But I have been wrong before.
And both have nuclear weapons. Living in interesting times is a vast understatement. I think I need to dig that bunker faster.
India and Pakistan are likely to go to war. However, they are sufficiently proximal to one another that nuclear weapons used against one by the other would have severe consequences for the attackers. I’m also extremely doubtful that Pakistan nukes are in anyway deployable due to maintenance issues with physics packages and delivery vehicles, but I wouldn’t bet my ass in it. My WAG is they slaughter each other more conventionally with India dominating the battle.
Here is the EIA’s Short-Term Energy Outlook through December 2020.
I think they have finally gotten the message.
Ron,
The STEO is wrong more often than it is correct, so we will see if this is one of the rare cases it is correct, I doubt it.
Perhaps the STEO oil price forecast is too low and affecting their output expectations. Brent oil price forecast for STEO, below.
Below is the STEO for US C+C Lower 48 excluding Gulf of Mexico(GOM) for December 2018 (red dots) and December 2019 (blue dashed). The 2018 forecast was pretty good through June 2019, but by Sept 2019 was 375 kb/d below actual output and by Dec 2019 the difference between forecasts is 738 kb/d. Perhaps the December 2019 will be better.
Link to STEO archive page below
https://www.eia.gov/outlooks/steo/outlook.php
The EIA has December 2019 C+C production at 12.99 million bpd. They have December 2020 at 13.28 million bpd. That is an increase, December to December of .29 million bpd. Quite a comedown from the over 2 million bpd increase in 2018.
Hi Ron,
My “best guess” scenario has about a 550 kb/d increase in US tight oil for Dec 2019 to Dec 2020. The STEO (Dec 2019) L48 excluding GOM estimate is a 310 kb/d increase from Dec 2019 to Dec 2020. Note that the Dec 2018 STEO was low by 375 kb/d in Sept 2019 compared to actual output. If my scenario proves correct (roughly a 0% probability it will be correct), then the most recent STEO which has output 650 kb/d higher in Sept 2020 than Sept 2019 would only be 24 kb/d too low, my scenario has output 674 kb/d higher in Sept 2020 compared to Sept 2019.
Of course if the current STEO is as inaccurate as the Dec 2018 forecast, then both my scenario and the Dec 2019 STEO will be too low by 351 and 375 kb/d respectively.
This would be consistent with the past where my “outrageously optimistic” best guess scenarios have always proven to be pessimistic relative to actual future output.
I think you may have meant a 2 Mb/d increase over 2018, as the increase in 2019 will likely be roughly 820+/-100 kb/d.
I think the big picture is, that US-production is flattening out and going to peak somewhen in the 20ies. That means, that even before an US-peak the country can’t compensate for (accelerating) global decline anymore. It simply doesn’t matter if the US peak in 2020, 2022 or 2025. Probably not even for the country itself.
Yes.
What really matters going forward is how long a rough plateau [+/- 5%] can be maintained, globally.
Here is the latest from the DPR. Still looks like February or March to hit zero. More likely March since the EIA attributes Feb production to February 1 rather than Feb 29. Maybe the 2020 leap year is throwing them off. ??? So the DPR is projecting that at the end of February, there will still be a net positive increase in production of 8.94 kb/d. The net monthly loss is now 24.07 kb/d/mth. At this rate, March is it.
Ovi,
I agree that if your red trend line continues then March becomes a negative change. I’m guessing there could be a peak of about 9.15 mbd in Feb 2020. If production from new wells keeps falling, then it could be a long wait for oil production from these 7 US Shale regions to exceed 9.15 mbd.
Nov DUCS fell 131 to 7,574, down from Oct 7,705.
https://www.eia.gov/petroleum/drilling/#tabs-summary-2
Ovi,
Why not use a longer term trend, say Jan 2018 to Oct 2019?
Using “tight oil production estimates by play” EIA data from Jan 2018 to Oct 2019 we get a peak in 2024.84, if we assume the trend does not change from the trend of the past 21 months.
Dennis
The chart that is posted above starts in 2018 and somehow is different than your chart. For instance your first two data points have an equal height at roughly 160 kb/d. On my chart, the first one is at 225 kb/d and the second at 300 kb/d. I have a pre-Chart which is virtually identical to Tony’s above. His green bars are the difference between production and decline and correspond to my chart. Check the March and August peaks. March is 225 kb/d and August is 300 kb/d. Also note his last three green bars are the same as those on my chart. Clearly your data set is different.
More importantly, the data points from Jan 2018 to September 2019 appear to be close to a random walk. However since October, the data appears to be more regular. On that basis, I elected to calculate a straight line fit using the September to December data. I admit that putting a straight line through four points is a bit risky and possibly wouldn’t have a high R squared or pass a Student’s t-test with 95% confidence. Sometimes it all in the eyes of the beholder. However, when the January results came out I was pleased to see that it fell almost on the line. Call it luck or whatever. Anyways we will know in two months whether we hit zero and in six to eight months we will know whether we have a peak in US tight oil production and will be able to assess the reliability of the DPR data.
Ovi
The EIAs tight oil production estimates by play are the official EIA data. The last 3 months of the DPR are little better than EIA weekly estimates, they are best ignored in my view.
Also when DPR gives a different estimate from tight oil production estimates by play, it is likely the DPR is incorrect.
In addition adding in conventional in the shale regions confounds the analysis.
I will stick with tight oil estimats by play, completion data from duc spreadsheet and well output estimates from shale profile.
More work, but better data.
The “peak” that might occur in 2020 will be exceeded by 2021. Output growth might flatten a bit in 2020 but oil prices will rise completion rate will increase and output will continue to rise up to 2024 to 2026.
Dennis
I didn’t realize your data was sourced from the LTO site. Since the DPR includes conventional oil, that is a more realistic estimate of onshore production. The STEO data and the DPR data seem to be converging on a first half peak in production. That is quite a different than 2024.
If one looks at L48 onshore excluding GOM, most of the increase in C+C output is tight oil, my view is that it makes sense to focus on that.
Ovi,
tight oil data at link below.
https://www.eia.gov/energyexplained/oil-and-petroleum-products/data/US-tight-oil-production.xlsx
completion data at link below
https://www.eia.gov/petroleum/drilling/xls/duc-data.xlsx
maximum output per well in various years can be found by clicking on well quality tab at link below.
https://shaleprofile.com/2019/12/03/us-update-through-august-2019/
The estimate will be far more accurate than the DPR for tight oil.
Ovi
It is very easy to pull up old DPR reports to assess reliability. What I have found is that they are not reliable.
Dennis
I believe in progress. Maybe the DPR staff have upgraded their system and data gathering efforts. As I said, we will look back on these discussions in six months and come to an updated opinion on the accuracy/improvement of the DPR data.
Ovi,
The nature of monthly changes is pretty random.
data from
https://www.eia.gov/energyexplained/oil-and-petroleum-products/data/US-tight-oil-production.xlsx
Chart is percentage change in monthly output for US tight oil output using data from spreadsheet linked above (the official EIA tight oil production estimate).
The real data is far from regular, when it appears so it is probably model output which is likely to be flawed.
Here is the Permian. The net growth is declining at a slow rate close to 10 kb/d/mth. At this rate, net growth will go negative sometime near the end of May.
Ovi,
This chart on Permian well productivity from twitter @HFI_Research confirms Permian shale slowdown.
https://twitter.com/HFI_Research/status/1206673551354400768
One might wonder, will the chart turn back up in the future as it did in April 2018?
My guess is a rise in oil prices (as was the case in 2018) is likely to have that effect.
A scenario with low oil prices forever seems highly unlikely. That would be required for Permian YOY production changes to remain negative long term. In 2020 or 2021 we are likely to see an increase like the March 2018 to May 2019 period in the HFI Research chart above.
Here’s HFI forecast based on EIA DPR 7 shale oil regions.
https://twitter.com/HFI_Research/status/1206673495171747841
Note that HFI forecast growth for 2020 is 400 kbd which is a bit lower than IHSMarkit. However, the average production forecast for 2020 is 9.08 mbd, which probably means that both HFI and IHSMarkit are implying a monthly peak in the first half of 2020.
“IHS says that U.S. shale will only grow by 440,000 bpd in 2020, before flattening out entirely in 2021. It’s safe to say that the market is not using this as their baseline, so if IHS turns out to be right, there could be a substantial rise in oil prices.”
https://finance.yahoo.com/news/oil-prices-reached-inflection-point-010000002.html
When I look at this red graph regarding Permian growth 2020 and latest Rystad info that stated 14% decline in Shale investment in 2020 compared to 2019 future starting looking real bad. Hopefully Exxon and Chevron will sell more assets abroad and invest more in US shale as according to them is highly profittable even with WTI 40 usd.
The only reason there is any production of shale oil at all is that there is a combination of cheap money and a plethora of desperate investors starved for yield. Well guess what, the investors want a return on their investment and the cheap money is drying up. So, artificial life support is being withdrawn and the patient is now expected to get off the emergency room gurney and start working for his keep. We shall see how that turns out.
This whole exercise in perfidy is much like Uber, that has never made a profit to date, and yet was supported by billions of investor dollars. The whole ignominious affair put hundreds of thousands of cabbies into destitution and bankruptcy, i.e those who didn’t enjoy the largess of investors willing to put up with loss-making operations for years on end.
Uber and Shale; the twin shitstorms of inequity, capital misalocation, and widespread collateral damage to their respective proximal markets.
I agree with your concerns Mike. It seems to me that debt will be accumulated in the system until it needs to be defaulted on. The governments of the world have become expert on kicking the can down the road.
But that path will end one day, perhaps suddenly. Default will come via one of several mechanisms- currency devaluation and debt write-off, for example. Whatever method, it will severely hurt those who were expecting pensions or government payments (Medicare/SS), or to live on savings or investment yield. These things will be massively de-valuated. Negative interest rates you have been hearing about are just the early symptom of this process. A president who cannot release his tax returns because he has a long pattern of committing severe financial crimes, is another. The extreme accumulation of wealth among the super wealthy is yet another.
I have given up expecting a ‘fair’ or rational game.
I don’t think I’ve ever looked. Is there a section on the eia website showing their historical predictions and what reality turned out to be and the magnitude wrong?
It would be particularly useful to relate that to the salary expense of that particular department.
Watcher,
Forecasts are always wrong, the only way to be right is to make no forecast. Instead just look back at history and say, that exactly how I thought it would happen. 🙂
https://www.eia.gov/outlooks/aeo/retrospective/
from AEO retrospective, US C+C in millions of barrels per year.
Dennis
I think someone said predicting the future is difficult. Doesn’t mean we can’t keep on trying to see if we can’t do better than the EIA.
Ovi,
Yes Yogi Berra reportedly said “Predicting is hard, especially the future.” 🙂
When I look at the predictions of a peak in 2020, it seems looking back in time we would have predicted many tight oil peaks, pretty much every January for the past few years. The completion rate is the important number, combine that with that with average well productivity and one can predict output, if the guess at the future completion rate is correct (and it rarely is).
US tight oil model at link below,
“other US tight oil” is fixed in this spreadsheet, but you can play with Permian completion rate and create different scenarios in row 4 of the spreadsheet.
https://drive.google.com/file/d/1JY-Ysy_uo17lN7HywJvil2x7YVN0VV7p/view?usp=sharing
Niels Bohr said that i believe.
My mistake.
Maybe he was quoting Yogi. 🙂
Haha
They probably both said it. 🙂
I realized that Bohr came first, so likely he said it before Yogi Berra. So probably Bohr was not quoting Berra. I agree they may have both said it, but Bohr probably said it first.
blah blah blah
“The projections presented in the AEO are not statements of what will happen but of what may happen given the assumptions in the underlying National Energy Modeling System (NEMS)”
Why are we paying for this? They aren’t even predicting what will happen. You don’t need a NEMS to predict what may happen. You can do that with one GS-7 and 5 minutes of typing time.
This needs defunding. It provides no value to the taxpayer.
Watcher,
Perhaps. There is no amount of money that will buy an accurate forecast.
Thinking about predictions of the future I realized we really only have data through Sept 2019 (weekly data is best ignored as it is often far from the mark), so in a sense any predictions of Oct, or November output which is past rather than future are quite speculative. In a sense we cannot predict the past two months of output, even though they are history.
I though of this when looking at the December 2018 STEO and their estimates of October and November 2018 C+C output were quite far off, then I realized that these were forecasts rather than actual data.
For oil data even predicting the past 2 to 3 months of output (say October, November and December 2019) is difficult.
Oil price going up
https://oilprice.com/
E&E News recently highlighted what this reality means for Texas’s Eagle Ford shale play, where production is now 20 percent lower than at its peak in early 2015. For an oil basin that’s only been producing oil via fracking for just over a decade, that is a pretty grim number. However, an analyst quoted by E&E News highlights the secret to making money while fracking for oil: Simply stop fracking.
“Generating free cash is easy: Stop spending on new wells,” said Raoul LeBlanc, vice president for North American unconventionals at IHS Markit. “The catch is that production will immediately move into steep decline in many cases.”
https://www.desmogblog.com/2019/12/17/us-fracking-shale-wood-mackenzie-child-wells
The latest well completion data showed a major drop in completion activity. This lines up with frac spread count, which has fallen more than ~30% YTD. Assuming modest completion activity in the Permian of 6,000 wells down just slightly from 6,250 wells in 2019, we have US shale production growth stalling to just +522k b/d y-o-y from 2019 to 2020 at 9.1 mbd.
https://seekingalpha.com/article/4313016-u-s-shale-growth-in-2020-will-disappoint-consensus-estimates
Tony,
Correct, completion activity has fallen to about the level of Oct/Nov 2018, and about an 11% drop from the October level, YTD the completion activity is up 10%. We will need to wait until the 4th Friday of Dec for tight oil output in November, we might see a decline, but I would not bet on it. If the completion rate continues to fall at 11% every month then we will see a temporary peak in tight oil output, then oil prices will rise, completion rate will rise and tight oil output will also rise. Peak in tight oil will be 2024 to 2026.
“Peak in tight oil will be 2024 to 2026.”
No way. It’s already here, and there will be no rebound. BTW I did carefully read your comments above Dennis and thank you for your time to respond. As always, your responses are significantly better than what my caustic remarks deserve.
As has been said many times, money does not equal geology. Even if a new tranche of ‘investment’ could be begged, borrowed, or stolen (likely stolen) it would be spent to build new drilling equipment, pay for new leases/roads/infrastructure, with all of it into new wells that will produce less than any before them. If inflation is a factor (and it is), the borrowed & eventually defaulted upon money will buy less than before.
Shale started bad, and it will stay bad. No shale well was a gusher…instead, they all needed huge horsepower, millions of gallons of water, hundreds of tons of sand, and lots of investment dollars just to get started. None of these were ever a Texas gusher. To me, this is no business model to follow, it is a debacle.
We have seen hundreds of shale companies go bankrupt over the last couple of years. Going forward, there won’t be hundreds of bankruptcies because there won’t be hundreds of shalies to go bankrupt. Like the motorcar companies of old, it’ll go from dozens of market participants to a handful through M&A and bankruptcies. There is still plenty of surface carnage to come and it is far from over. Bear in mind, this is largely the same crowd that kept exclaiming a dropping ‘breakeven’ price from 2010 forward, to the point where $20 was wildly shouted from the rooftops (particularly from John Mauldin) as the point of profitability. Of course, none of it was true. Now we see at long last that $60 (and probably $75) was the true breakeven point. Lots of C-suite executives should be in jail for their malfeasance, but of course none are and with the exception of Aubrey McClendon, all of them are still ‘at large’.
So with all this in mind and to round off a long screech, I summarize by saying that 2019 is peak shale.
Peak shale is either 2019 or 2020. Ovi and I guess that peak shale month February or March 2020.
This is a good guess in my opinion.
The small companies, which have gotten only B class land will have to reduce, leading the decline.
The bigger ones can continue to grow to a certain amount – but using up their A class land. Especially all non-Permian will see this very soon and start declining. So Permian growth soon will not be enough to keep up all shale decline – and this at the cost of the Permian Tier A claims.
Oil production from shale will have a long future if prices settle at 100$ – but with worse land it will just not be a bit boom.
A boom means high drilling … everything costs, in a long calm era everything has more normal prices (why should a truck driver carrying fertiliser to farm tows earn much less than a truck driver delivering sand to a hole). And so finally some money can be earned in the oil spot.
If the Democrats take over and get more green, taxes on oil production will be increased anyway, and tax credits cut – so more calm drilling anyway. This is a big “if”, I don’t know how the D – R battle stands now.
Mike and Tony
Try my model in the spreadsheet.
One has to make unrealistic assumptions to get a peak in 2020. Perhaps 2023 at the earliest but only if Brent remains under 60/bo long term.
Does low oil prices forever seem a realistic scenario to you guys?
Seems a ridiculous assumption to me.
It is the only way an ultimate peak in US tight oil occurs in 2020. A temporary peak is possible, but it will be surpassed within 12 months.
Updated spreadsheet at link below, well completion rate for Permian basin in row 4, best guess scenario shown, change to get scenario you prefer and decide if the completion rates make sense.
well profiles based on data from https://shaleprofile.com (Enno Peters excellent blog and data service).
https://drive.google.com/file/d/16hJD-MFFM4XZIGNQzbTdPWsc2HZXVElg/view?usp=sharing
Note that I assume well profile EUR starts to decrease in Jan 2019, this assumption may be incorrect as so far there is little evidence that such a decrease has occurred. For that reason the model may be too conservative.
Chart below gives tight oil scenario from this spreadsheet for best guess scenario, beyond 2030.37 (May 2037) no wells can be added for this spreadsheet (not enough rows), any estimates beyond that date must assume no new wells are added after May 2030 (not likely to be a correct assumption.)
In short, model ends in May 2030. Start date is August 2019. (2019.71)
Model is consistent with Mr. Patterson’s estimate of an average monthly increase in tight oil output of 35 kb/d for the first 6 months of 2020.
Tony
I am moving to April for this reason. The DPR puts February production on Feb 1. If the DPR trend continues, then March data will be posted to March 1 and will be a tad short. So I think April is the month. Interestingly this is getting very close to the May peak in the STEO.
I don’t particularly like how the EIA uses its dates. Considering changing the date system in my charts to end of month.
I shifted the time base on the EIA date system and the straight line hits zero close to March 12. We will have to wait about 4 months to see how close this is.
I am guessing February 2020, or sooner.
Scenario below has relatively flat tight oil output from Oct 2019 to 2026 with peak in 2025 at 8250 kb/d, URR about 82 Gb, completion rate assumed to fall by 14% from Sept 2019 peak at 1145 well completions per month and remain steady at 1007 well completions per month from March 2020 to Dec 2021, the completion rate gradually rises to 1129 in July 2027, an annual rate of increase of 22 wells per year (about 2 per month).
Permian completion rate for this scenario falls from 545 in Sept 2019 to 408 in March 2020 (a decrease of 33%), the changes in completion rate from Sept 2019 to July 2027 are simply changes in the Permian basin completion rate, other basins are assumed to have constant completion rates (as a group) over that period.
I expect such a scenario would lead to rising oil prices, with Brent probably exceeding $100/bo by 2023. For that reason I would put the odds at about 9 in 10 that actual output will be higher than the scenario presented here.
This is a low case scenario.
For comparison my best guess scenario is below, about a 50/50 chance output will be higher or lower than this guess. Odds it will be exactly right equal to zero.
Her my latest presentation of Texas RRC oil well completion data.
November seems to be bit of a catch up, almost on par with 2018, however it looks like we will finish 2019 in Texas with roughly 16-18% below 2018 numbers.
Makes sence that the Dallas Fed sees a business slow down.
together with other process optimizations, you sure need a lot less workforce to achieve this
– even if absolut oil production with 16% lower completions but further improved design can still grow.
Looks like MoM, November activity is up. Any reason for this.
this data is really bad, in this case the EIA DUC report, which has completion data is far more accurate, completions in the Eagle Ford and Permian basin were down significantly in November compared to October see
https://www.eia.gov/petroleum/drilling/xls/duc-data.xlsx
From DUC spreadsheet,
Completions for Permian and Eagle Ford peaked (Feb 2015 to Nov 2019) in July 2019 at 756 completions, in November the completion rate was 666 completions, down about 12% from the peak. In October 2019 the completion rate was 738, so a 72 well drop in one month (11%).
This data likely reflects reality better than the RRC data which gives that month that paperwork gets filed, if you sample the actual reports the completion dates are all over the place, in some cases the wells reported for November were completed 18 months ago, in other cases it was two months ago. When I realized how bad the data was I decided it was not worth looking at. The data from shale profile sorts this out, but it still suffers from all those wells that get reported late, so the data does not become fully accurate for 12 to 18 months. It is unclear where the EIA gets its estimates in the DUC spreadsheet, it may be based on a statistical sample based on survey data, or it may be model based.
In document below it seems to suggest a combination of actual data and models, no doubt the more recent data is relatively uncertain and gets revised monthly as data gets updated and models are adjusted as a result.
https://www.eia.gov/petroleum/drilling/pdf/duc_supplement.pdf
Tony,
Good piece, thank you.
My best guess scenario (revised to account for sharp drop in completions in November) has US tight oil output up by 367 kb/d from Dec 2019 to Dec 2020 and by 472 kb/d from Sept 2019 to Sept 2020.
My scenario has fewer wells completed in the Permian basin than assumed by HFI, only 5856 wells in 2020. An increase to 6000 wells completed in Permian increases Dec 2019 to Dec 2020 output for US tight oil to 437 kb/d. The difference may be my assumption that new well EUR will decrease starting in Jan 2019, few make that assumption, and it may prove too conservative.
https://www.heraldscotland.com/business_hq/18108577.us-shale-oil-gas-market-slowdown-will-impact-scottish-firms/
Worth bringing to folks attention an obscure thing called Repo funding. Here’s the relevant graph:
https://www.federalreserve.gov/monetarypolicy/bst_recenttrends.htm
Keep in mind this is a substance (money) created from nothingness. The Fed’s balance sheet is an assessment of the value of assets owned by the Fed. QE bought up government bonds and mortgage backed securities. They remain on the balance sheet. In 2018 an attempt was made to get to normal. Several hundred billion in assets were sold off. This drained money from the economy and 2018’s S&P closed the year at -6%. The 10 yr T note lifted to 3.25%, which coincided with the equity fall to -6%.
January of this year the Fed announced a mid course correction in its path to normalcy, which was euphemism for cut rates (that they had been raising). The S&P stopped its decline and reversed.
The Fed also stopped selling bonds from its balance sheet, and within weeks of that started Repo funding, which involved BUYING instruments, which are short term. This allows them to say it is something different than QE, which was long duration bonds.
That uptick on the end of the graph shows the magnitude of the REPO effort, which mostly is targeted at keeping the short term Fed Funds rate where the Fed wants it, despite clear market forces trying to move it. But of course the market does not have infinite money. The Fed does.
Roughly 1/2 of the entirety of 2018’s effort to lower the balance sheet has been erased by the desperate measures taken for Repo funding.
This is off most people’s radar screen.
In general it means the Fed is injecting 100s of billions of money back into the economy. And the US govt is running a 5% fiscal stimulus. Do not presume this money won’t find its way to shale. Again.
Watcher,
Surprised no one has talked about this either. The Fed is in complete control of the stock market and is completely distorting the free market. And hence why the record highs. They will continue their QE4 program for the repo market, sorry did i say QE lets not call it that.
The Fed has no other option now than to keep pumping that money out of nothingness into the economy, until well no one really knows wtf will happen, central banks around the world are doing an experiment with MMT to see what happens. Hence why they are shit scared if a recession was to come, since all their efforts to avoid one.
I agree with your last statement too, i think this free money would be lent again to shale companies so they can keep pumping. We might be on the way to helicopter money the way they are going.
I cannot see QT happening within the next 5-10 years even. I just don’t see how interest rates can go back to normal. Only way is sustained 2.5%+ inflation. Then the stock markets would see the biggest crash possibly ever, that’s if it doesn’t happen by another mechanism, black swan event maybe who knows.
There is only one way out.
It’s not a crash down, it’s a crash up. Dow Jones 100 Million points or more.
You haven’t experienced this in the USA yet, but it’s more common world wide when a money management get unsustainable.
Every stock crash will be papered over immediately – as even the small correction in December last year. So there is only the way up left.
When the trust in money is lost, or the real estate market too high so nobody can repay a home credit – then the game is over.
And there’s nothing a central bank can do against it. Drying up the money suddenly destroys everything immediately, everybody will be bancrupt so complete chaos , they can only continue printing until the end.
The global ‘easy money’ is how we play kick the can down the road.
Its much easier for everyone, than living within your means.
The risk is that one day, you will be forced to live within your means the hard and sudden way.
When you owe the bank a little money, the bank owns you. When you owe the bank a lot of money, you own the bank.
Yep—
https://www.nature.com/immersive/d41586-019-03749-0/img/greta-thunberg-large.jpg
Moving right along, let’s remember that during that 2018 decline in balance sheet, and S&P 500, oil consumption globally increased over 1%.
And when a fiscal deficit of just about 5% of GDP is in place, it’s pretty hard to have a recession. This is new money injected into the economy. It’s borrowed, yes, and one might say that means the money is just drained from somewhere else in the economy to be spent. And one would be wrong. That money was sitting idle in pension funds. Or it was sitting in other countries waiting to be loaned to the US. Or. . the Fed may loan it buying short term Repo instruments. So damn near none of the borrowing is a drain. (other countries in recession or near recession for some bizarre reason never have considered this)
And so, it’s very hard to get negative GDP growth when there is a constant influx of 5% of GDP coming in. Recession in the US is very hard to achieve while all this stimulus is in place, and with the spending bill approved yesterday it’s even harder to see happening, especially before election day.
How do you get recession? Natural disasters. You can’t just have a storm that shuts New England down a few weeks. You’re going to need a body count of people who can’t ever go back to work. Or doing new work as disaster recovery bills come out of Congress to fund more economic activity. War? It would have to wipe out the entire gulf coast refinery complex, and that’s pretty hard to envision, methodology wise. Oil is definitely an instrument that can grind GDP down, but it’s hard to see a scenario. Anything less than that for a war and it just turns into supplemental military funding from Congress, raising the stimulus from 5% to 10%. Bombs at the stock market? There are probably backups. Bombs at the NY Fed? Hmmm. well, that probably has backup processes too.
“Money is a token in a message flow system used to convey information to control the flows of matter and energy” ~ George Mobus
https://static.financialsense.com/historical/broadcast/insider/fsn2016-0415-mobus-u4t7x9w.mp3
I guess it’s hard to convey information when you create tokens and splash them about in preferred corners.
Rick Rule on money. https://www.youtube.com/watch?v=Uqzj6BRmhr8
” The golden age of U.S. shale is far from over, with an expected slowdown in the Permian Basin likely to be temporary, according to the new U.S. Energy Secretary.
The shale boom helped transform the U.S. into a net exporter of crude and petroleum products in September from a major importer a decade ago. Even as growth is set to slow next year in the Permian and elsewhere as drillers respond to investor demands for capital restraint, Dan Brouillette said the shale boom has further to run.”
Shale boom has further to run. Time will tell.
https://www.rigzone.com/news/wire/us_energy_sec_shrugs_off_permian_oil_slowdown-18-dec-2019-160598-article/
It (Shale) still reminds me of the old joke, “Well, we’re still losing money with every unit sold, so let’s just make it up with volume.”
EIA weekly supply estimates released, declining from the last two weeks of Nov at 12.9 mbd down to 12.8 mbd for the first two weeks of Dec.
https://www.eia.gov/dnav/pet/hist/LeafHandler.ashx?n=PET&s=WCRFPUS2&f=W
HFIR is showing a US peak for 2019 in November of 12.7 mbd.
https://twitter.com/HFI_Research/status/1207413992848674816
IHS stated that “The new IHS Markit outlook for oil market fundamentals for 2019-2021 expects total U.S. production growth to be 440,000 barrels per day in 2020 before essentially flattening out in 2021. Modest growth is expected to resume in 2022.”
https://news.ihsmarkit.com/prviewer/release_only/slug/energy-base-decline-rate-oil-and-gas-output-permian-basin-has-increased-dramatically-b
EIA STEO says US oil production in 2019 is 12.25 mbd. That means that IHS is forecasting 12.69 mbd in 2020. This 0.44 mbd growth is assumed to come from the 7 US shale regions on EIA DPR. In 2019, shale region production was 8.60 mbd. 2020 shale region production is forecast to be 9.04 mbd, after 0.44 mbd growth. EIA DPR says that Jan 2020 shale region production is 9.14 mbd which is greater than 9.04 mbd which means that IHS 0.44 mbd 2020 growth implies that a US peak oil is happening about now.
IHS says that modest growth is expected in 2022, but they don’t quantify how much growth. I believe this sentence was added because IHS does not want to be accused of implying US oil production has peaked. Dan Yergin, vice chair of IHS, founded CERA in 1982 which is now owned by IHS. Dan Yergin “clearly doesn’t care about converting peak oilers. He really wants to influence Washington.” In other words, IHS says modest growth in 2022, to please Washington politicians. US shale growth might increase in 2022, even with higher oil prices, but I’m guessing it won’t.
http://transitionvoice.com/2011/09/whos-afraid-of-daniel-yergin/
Given decreasing money available to shale oil, declining frac spread counts and falling rig counts, I now guess that US peak oil month is Nov 2019. Permian oil production should continue increasing slowly but it’s not enough to offset falling production from other shale basins and other conventional oil basins.
Below is an attempt at a possible trajectory of US crude oil production forecast to Dec 2020, using the IHSMarkit growth of 0.44 mbd from 2019 to 2020. The dashed red line is a simplistic forecast. The Nov 2019 peak of about 12.85 mbd might be noticeable after a few months.
“It has often been said that we would only be able to see peak oil by looking in the rear view mirror.”
http://theoildrum.com/node/7909
Hi Tony,
It is not clear that IHS Markit thinks the average production level will increase by 440 kb in 2020, that might be a YOY estimate. Also, weekly estimates tend to be inaccurate, so basing anything on weekly estimates is a mistake, in my view. If we use the EIA tight oil production estimates by play and extrapolate the trend through Dec 2020 we get a Sept 2019 to Dec 2019 increase in output of 391 kb/d, then add the 440 kb/d increase in 2020 (Dec 2019 to Dec 2020) and we get a total increase from Sept 2019 to Dec 2020 of 831 kb/d, so a US C+C output of 13224 kb/d in Dec 2020. If we assume all of the increased US C+C output comes from tight oil (some might be GOM), then tight oil output would be 8726 kb/d in Dec 2020 and 8286 kb/d in Dec 2019.
The new IHS Markit outlook for oil market fundamentals for 2019-2021 expects total U.S. production growth to be 440,000 barrels per day in 2020 before essentially flattening out in 2021. Modest growth is expected to resume in 2022.
Quote above is from link below.
https://news.ihsmarkit.com/prviewer/release_only/slug/energy-base-decline-rate-oil-and-gas-output-permian-basin-has-increased-dramatically-b
Not clear which interpretation of “U.S. production growth of 440,000 barrels per day in 2020” is correct. It might be yearly average production or it might be Dec 2019 to Dec 2020, they do not really make it clear.
The average rate of growth of US tight oil output from Feb 2019 to Oct 2019 has been about 100 kb/d (1200 kb/d annual rate of increase), the 2020 forecast is about 440 kb/d, considerably slower than 2019 (February to October) by a factor of 2.7.
Also note that last December’s STEO underpredicted US C+C output in Sept 2019 by about 375 kb/d. For some reason people seem to think the STEO is always an overestimate, this may be true on occasion, but we only know looking back in time. So a year from now we can look back on the STEO and see how accurate it was. Generally the STEO is not very accurate, in July 2019 it was too high on the Sept 2019 US C+C estimate by 200 kb/d, the forecast gets adjusted over time, but as has been said predicting is hard, and rarely correct (probability of a correct forecast is infinitesimally small).
Dennis
The STEO data is correct up to September and close for October based on the MER. The STEO average production of 2019 is 12.25 Mb/d and should be reasonably correct. The 2020 average is 12.80 Mb/d. An average increase of 0.55 Mb/d. The YoY December increase is just 0.29 Mb/d.
So looking at these two numbers, IHS could be betting the the STEO 2020 predictions should continue to drop as the early next year predictions for 2020 are released. Note that the Dec 2019 STEO estimate for Dec 2020 was 120 kb/d lower than the November 2019 estimate and also lower across the board by close to 110 kb/d.
So best guess is that the Markit number is a year over year average, IMO.
Ovi,
Alternatively the IHS estimate might be higher than that of the EIA STEO. We don’t know because we do not have their report, only the news blurb.
I will keep it short. If you read their words it is not clear which interpretation is correct. The STEO uses the monthly estimates and the MER for their forecast so it is not surprising that they should match. If you look at STEO data from 6 or 12 months ago, 12 months ago their estimate was too low and 6 months ago it was too high, basically the STEO does a really bad job at guessing future oil output. This is not surprising, as Bohr and others have suggested, predicting is difficult, particularly the future. 🙂
See STEO archives to see past forecasts
https://www.eia.gov/outlooks/steo/outlook.php
When I say July I am talking about the July STEO see link below
https://www.eia.gov/outlooks/steo/archives/jul19_base.xlsx
Chart below compares July STEO and EIA monthly C+C estimates.
Dennis
The Markit release puzzled me also and I looked data up last night to get an idea of what they were reporting. Surprising for such a company to be so sloppy. Intentional??
For the latest STEO report, the monthly numbers are identical to EIA 914 up to September. My point is that the 2019 average must be close to being correct. As for 2020, I have noticed their estimates have been dropping each month recently. As I noted, my hunch is that Markit was reporting yearly averages.
Of greater interest now is the big jump in rigs this week in Texas. Is it real or possibly a more accurate count that found some errors?
Ovi,
the RRC data is crap, ignore it. Use the completion data from the DUC spreadsheet, probably not perfect, but about 10 times better than the completion report from the RRC.
Horizontal Oil rigs in the Permian, Williston, Eagle Ford, and Niobrara dropped from 533 in mid August to 498 in early December (5 week centered average) in early June the count was 557, so a drop of 12% since June and about 7% since August. Only a small increase recently from 494 for we 12/13 to 513 for we 12/20, a 4% jump (only a single week of data), the 5 week average barely moved (0.6%).
Average rig count from Jan 7, 2018 to Dec 20, 2019 for horizontal oil rigs in the Permian, Williston, Eagle Ford and Niobrara was 555 rigs. The current rig count is 8% below that average level.
Ovi,
Yes the STEO is probably accurate through Sept 2019, after that they are guessing, I judge future guesses based on past guesses. Past guesses have been very bad, I am less optimistic than you that they will improve in the future.
The 2019 average based on the STEO might not be too far off (that will depend on how badly they do from October to December compared to actual output.) For 2020, I will be surprised if they are within 200 kb/d of the actual average 2020 C+C output, it will be a coin flip as to whether they are within +/-200 kb/d of the final 914 estimate for the 2020 average US C+C output.
It all comes down to completion rates in the future, I just don’t think the 33% drop in Permian basin completions that would be needed for flat US tight oil output is a likely scenario, we will see.
Completion rate drops from 545 wells per month in Sept 2019 to 408 wells per month in March 2020, 545/408-1=33.6%. We assume in this scenario that the completion rate remains at 408 wells per month until December 2020.
Seems far fetched to me.
Ovi and Dennis,
I tweeted to IHS to confirm average growth is right
@IHSMarkitEnergy is your 0.44 mbd US crude oil growth from average production 2019 to 2020, as in my chart below? #OOTT
https://twitter.com/tony_eriksen/status/1208141895639040001?s=21
Tony,
Part of your story hinges on the Weekly estimates being correct, this implies a 400 kb/d increase in 2 months, that seems implausible, my guess is the Nov 2019 monthly C+C output for the US will be no more than 12.66 Mb/d, December, possibly 12.72 Mb/d (probably less as I expect perhaps a 250 kb/d increase from Sept 2019 to Dec 2019. So that would be 12.71 kb/d for the end of the year. I also doubt IHS was forecasting 440 kb/d for average output increase from 2019 to 2020, as that would imply flat output in 2020, where they say that doesn’t happen until 2021.
It is pretty easy to see this when you compare Dec 2019 output with average 2019 output, of you add 440 kb/d to average 2019 output it will be less than Dec 2019 output, which implies declining output in 2020 (from Dec 2019 to Dec 2020).
That does not seem consistent with the words in the IHS news release.
Exxon has a page up I don’t recall seeing before. It’s a profile of assays for various oils. I’ve seen them with that sort of thing before but not in this new configuration.
I also don’t recall seeing an assay for Alaska North Slope oil from Exxon before.
It is listed as medium heavy at API 32. It is also listed as sour with sulfur content of 0.96% by weight.
Energy crisis looms as forecasts ignore US shale oil quality
https://www.anasalhajji.com/publications/oil-market-general/energy-crisis-looms-forecasts-ignore-us-shale-oil-quality
Good article, I believe it will not only be related to US shale oil quality but also a more or less collapse in US shale , to use the shale pioneer Mark Papas words from 2019 ” the best in US shale is behind ” but the investors choose to not believe him as it not fits with what the shale producers had presented them. Perhaps this time wall street will learn a lesson that might be quite exspensive. I am waiting for how much Exxon will write down of their assets in Permian, that might be higher than Chevron have annonsed.
Tight oil output will not increase as much as forecast by IEA and OPEC so it is not likely a refining wall at the World level will be be reached. As to demand outrunning supply, when that occurs oil prices will rise to a level that demand is destroyed to the point that supply will equal consumption as it must over the long term. Demand (consumption) cannot be higher than supply (output) for very long as stocks cannot be less than zero plus pipeline fill and minimum storage tank levels needed to keep the overall refinery and distribution system functioning. Oil prices will rise from 2020 to 2030, of that we can be sure, unless a severe World recession occurs (I expect this to begin in 2030+/-2 years and last for 2 to 4 years if World economists remember their Keynesian economics, otherwise it could be 5 to 7 years, if nonsense like fiscal austerity in the face of severe recessions is recommended and we are foolish enough to forget the lessons of 1929-1933.)
Oil quality is not the way to address or label the issue. Quality is a word traditionally used in oil to describe sulphur content, not a scarcity of middle distillates in the yield. Needs a different word.
Further, from the article, diesel is not the consumption growth heavy constituent. It’s jet fuel. Up 3.7% last year. Gasoline was up almost 1%.
OT:
Starliner demonstrating 737 Max levels of reliability so far…
Big change in future drilling prospects in Texas. EF up 7 and Permian up 14. How long before these rigs bring new wells online?
Typically a 4 to 6 month lag from rig count increase to completed wells.
Seems the number of DUCs is significantly reduced every week, guess there will be needed to add a certain number off riggs to cover up for low DUCs base. Cost each barrel will than grow as now all need to be cover from free cashflow , before DUCs was depth funded mostely. Think soon Mr. President want cheaper oil price, he might believe 60 usd WTI is to high…
Ovi, the time lag from rig count to completed wells does average quite a while. From frac crew to completed well is still 2 or 3 months on average. It didn’t draw much attention but the frac spread count dropped an additional 13 spreads to 320 this week.
https://twitter.com/PrimaryVision/status/1208150602561327105?ref_src=twsrc%5Etfw%7Ctwcamp%5Eembeddedtimeline%7Ctwterm%5Eprofile%3APrimaryVision%7Ctwcon%5Etimelinechrome&ref_url=https%3A%2F%2Fwww.fracspreadcount.com%2F
Does anyone have data on the average number of wells a frat spread completes each month. Then the average oil production from these new wells ?
While i understand that the less efficient spreads are being removed you would imagine the loss of 130 odd spreads is the difference between solid growth in LTO and no growth/decline. The real fall off in spreads commenced in July 19 – with a 3-4 month long you would imagine this will start to show up in the next EIA 914 due in a week.
MSM misses the point that rigs don’t produce oil, with franc spreads continuing to plummet that red queen is going to rear her face fairly quickly. Would be good to see MSM media pick up on this point in the near term ….
Thanks dclonghorn
I am wondering if the increase in rig counts is real or possibly a more accurate count that found some errors in previous info.
Since there will be a lag between the increase in rig count, if real, and when the wells start producing, should we be looking for an increase in the frac spread count three to four months from now?
Ovi, In my opinion the increase of 14 rigs is real. Baker Hughes has a reputation of accuracy in such matters. It also does not change the long trend where rigs have declined by 267 in the last year. Should rigs show a continued increase, frac spreads are likely to follow up at some point, but for now they continue to decline.
Eventually, the spread count will lead to declining lower 48 land production. I still think will we see that when the November monthly reports come, but it could slide to December. If the count stays as low as it is now for awhile, we could see first Q 2020 declining in the neighborhood of 100,000 bopd per month, imo.
North American shale is expected to hit an inflection point in 2020. Our expert, Raoul LeBlanc, VP of Unconventionals, shared his insights on what’s ahead for North American #shale markets.
https://ihsmarkit.com/research-analysis/video-north-american-shale-hits-an-inflection-point-in-2020.html
Below is a copy of the email to Raoul about IHS article and session. I’ll let you know if I get a response.
From: Tony Eriksen
Sent: Sunday, 22 December 2019 12:24 PM
To: [email protected]
Cc: [email protected]; [email protected] ; [email protected]; [email protected]
Subject: IHS Dec 12 “Base Decline” article and US oil production
Hi Raoul,
I am an investor in the energy sector, and I read your interesting article on base decline for US shale oil.
https://news.ihsmarkit.com/prviewer/release_only/slug/energy-base-decline-rate-oil-and-gas-output-permian-basin-has-increased-dramatically-b
I also listened to your session on shale inflection point in 2020.
https://ihsmarkit.com/research-analysis/video-north-american-shale-hits-an-inflection-point-in-2020.html
I liked at your analogy of offsetting base decline to feeding the beast.
In your article you say that “total US production growth to be 440 kbd (0.44 mbd) in 2020”. EIA STEO estimates that total US average crude oil production is 12.25 mbd in 2019.
https://www.eia.gov/outlooks/steo/
Can I assume that you are expecting total US average crude oil production to be 12.69 mbd in 2020?
US crude oil production in Nov 2019 was estimated to be 12.85 mbd, according to EIA weekly supply estimates.
https://www.eia.gov/dnav/pet/pet_sum_sndw_dcus_nus_w.htm
The first two weeks of Dec 2019 was 12.80 mbd. I am assuming that the Nov 2019 production of 12.85 mbd is a peak.
I am guessing that total US crude oil production has peaked on Nov 2019 at 12.85 mbd. I’m not saying that this could be an all time peak but given the high shale base decline rates, this Nov 2019 peak might be the last peak. This Nov 2019 peak is shown in the attached chart.
You also say in your article that “modest growth is expected to resume in 2022.” Can you quantify that growth? Is it 100 kbd or more? Does the growth start at the beginning of 2022 or end of 2022?
The blue line in the other attached chart shows legacy decline or the amount required to feed the beast. The data for this chart is from the recent EIA Drilling Productivity Report.
https://www.eia.gov/petroleum/drilling/
The EIA estimates that in Dec 2019 oil production from these 7 shale regions is 9.105 mbd and in Jan 2020, 9.135 mbd, a difference of only 0.03 mbd. When the difference is negative, the beast wins, probably in Mar 2020. This oil production is mainly US shale oil but also has some conventional oil, about 1 mbd. My chart shows the decreasing gap between production from new wells and base legacy decline, indicated by the green bars.
The appetite of the beast, base decline for Dec 2019, was 573 kbd, according to EIA DPR. The beast’s appetite increased by 6 kbd/month for the year of 2019. In Jan 2020, base decline is expected to be 579 kbd. For 2019, the total of the monthly base declines was 6.5 mbd, which also includes some conventional decline. If it is assumed that Jan 2020 base decline is the same for all the months of 2020, then total 2020 base decline is about 7 mbd. In my opinion, the beast will win in early 2020 implying US peak oil is happening about now. I also don’t see how US oil can have modest growth in 2022, given the annual 7 mbd base decline rate.
All the best for the holidays and the new year,
Tony Eriksen
Sydney Australia
+61 407 924 722
A new Oil post has been published
http://peakoilbarrel.com/is-non-opec-oil-production-recovering/#more-24042
A new Non Petroleum post has been published
http://peakoilbarrel.com/open-thread-non-petroleum-december-22-2019/#respond