A post by Ovi @ peakoilbarrel.
Below are a number of oil production charts for Non-OPEC countries, created from data provided by the EIA’s International Energy Statistics and updated to August 2019. Information from other sources such as the IEA and OPEC is used to provide a short term outlook for future output and direction.
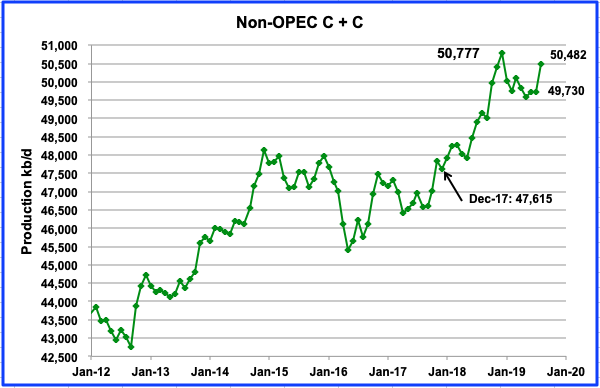
Non-OPEC production increased by 752 kb/d to 50,482 kb/d in August from 49,730 kb/d in July. This is the first significant monthly increase in 2019. Output declined from January to May. The main contributor to the increase was the US by adding 599 kb/d. This leaves August production just 295 kb/d short of the previous high of 50,777 kb/d reached in December 2018. New output from Norway and Brazil, along with increasing US output coming in the next few months could raise Non-OPEC output beyond the previous December 2018 high. The question “How much higher beyond the December high” is of great interest to OPEC+.
The charts and table below are primarily for the world’s largest Non-OPEC producers and are updated to August 2019, except for the U.S., which is updated to September 2019. The first set of charts is for Non-OPEC countries with production over 500 kb/d and the last few provide a world overview.
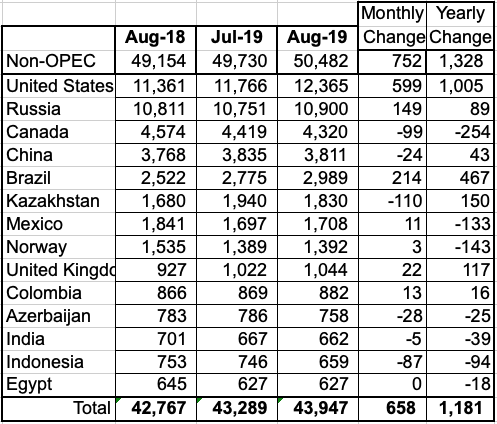
Above are listed the world’s 14th largest Non-OPEC producers. They produced 87% of the Non-OPEC output in August. One year ago, the US produced 550 kb/d more oil than Russia. In August 2019, that lead was extended to 1,465 kb/d. What also stands out in this chart is the large monthly increase in Russian production in August 2019 even though it is supposed to control its output according to their OPEC agreement. Also note the large increment from Brazil which is starting to produce oil from its deep pre-salt layer.
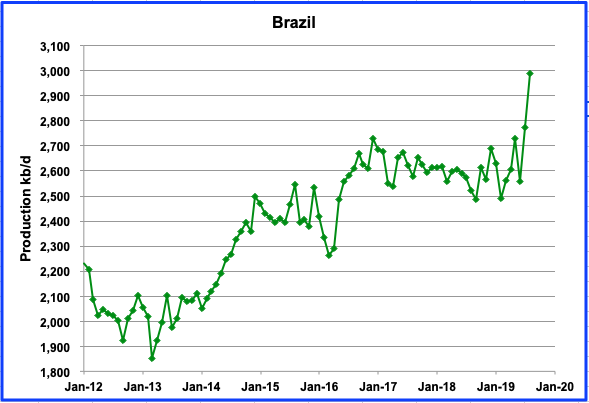
Brazil’s production added 219 kb/d in August, coming in just shy of 3.0 Mb/d. Its output is now beginning to show the results of adding four floating production, storage and offloading units (FPSO) in 2019 to its offshore fields. Output is expected to remain close to 3.0 Mb/d for the next few months. It is estimated that the deep pre-salt layer could potentially raise Brazil’s output to 7 Mb/d by 2030. In early November Brazil held an auction for foreign and domestic oil companies to bid on four offshore blocks containing the the pre-salt layer.
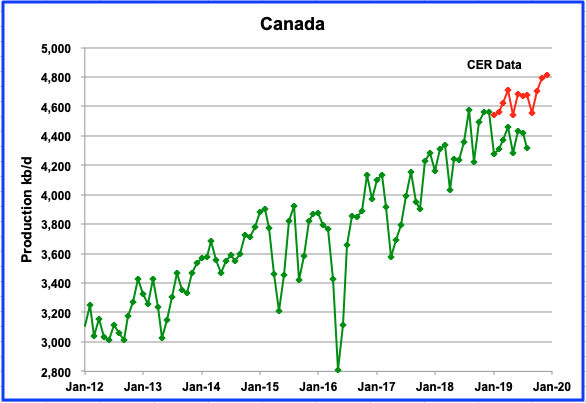
Canada’s production dropped by 99 kb/d in August. This drop appears in both the EIA report and the Canadian Energy Regulator (CER) report, shown in red. I am not clear why the CER reports higher output than the EIA. Output from Alberta continues to be limited by the curtailment rules imposed by the government. In August and September rail shipments of crude were 319,594 b/d and 310,146 b/d respectively. This is a significant jump from March when shipments were 168,483 b/d.
As long as the Enbridge line 3 expansion is on hold in Minnesota, it will be difficult for Canada to increase production significantly for the longer term. On December 9th, Line 3 received a favourable report from the state’s Department of Commerce when it found no serious threat to Lake Superior if crude oil leaked from the pipeline. Public hearings are next.
While exporting Canadian oil continues to be a challenge, Enbridge and TC Energy are looking at changes that could quickly increase capacity by another 100,000 b/d by adding drag reducing chemicals to the pipeline. Enbridge is also looking at additional strategies that could provide more capacity. In addition the Conference Board of Canada is saying that the outlook for Alberta production is brightening and that several factors will conspire to boost production in the oilsands by an average of 4.2 per cent per year from 2020 to 2024.
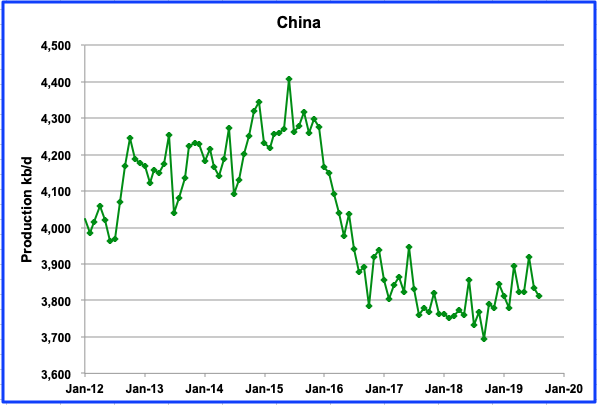
China’s production dropped by 24 kb/d to 3,811 kb/d in August. It is expected to maintain this level of production into 2020 due to increased spending by China’s major oil companies, according to the IEA.
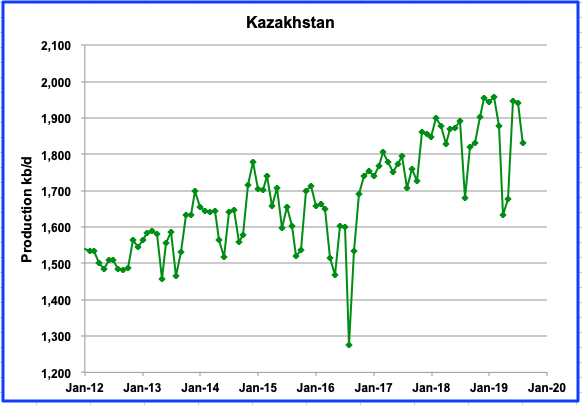
Kazakhstan output declined by 110 kb/d in August. It is expected that their production will stay close to 1,800 kb/d according to OPEC.
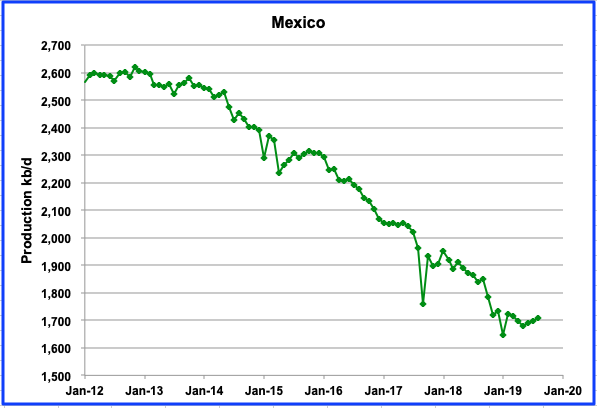
While production declined in the first quarter, Mexican output has shown a small increase in the second and third quarters. However, according to OPEC, the decline in Mexico’s mature fields, such as Cantarell, Abkatún-Pol-Chuc and Tsimin-Xux, will result in the resumption of overall declining output by 2020.
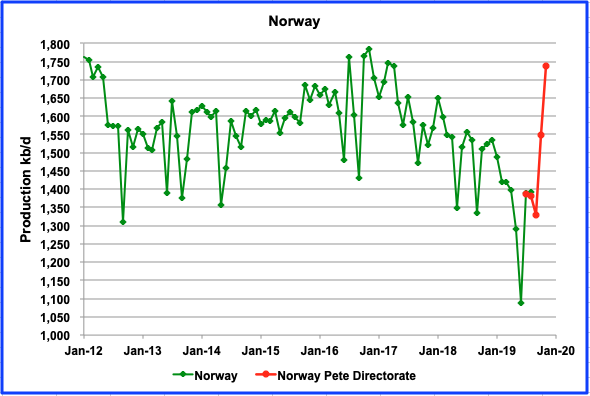
Norway’s output for August was flat due to technical and maintenance problems in some fields. However this is going to change in October when the Johan Sverdrup field comes online. Output began to increase in mid October and by early December it was producing at a rate of 350 kb/d according to Reuters. Phase I of the project is expected to add 440 kb/d of oil production by mid-2020, which will account for over 20% of total Norwegian supply.
The increased production from the Johan Sverdrup field should begin to show up in the EIA’s report a few months from now. However production data for C + C is published monthly by the Norwegian Petroleum Directorate, which reported output of 1,739 kb/d in November, and has been added to the above chart and is shown in red.
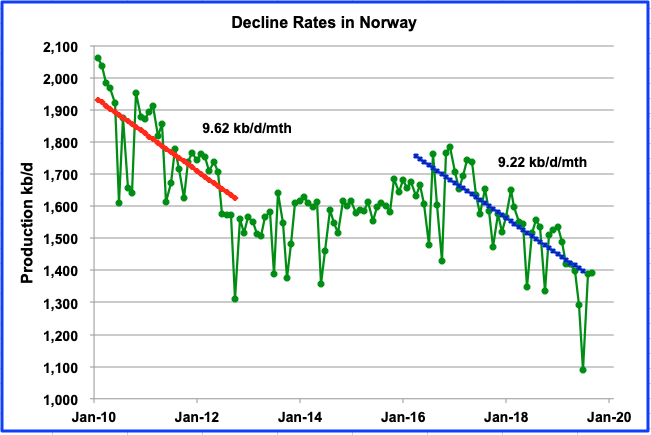
This chart shows the decline rate of Norwegian oil fields to be essentially somewhere between 100 kb/d/yr to 110 kb/d/yr or roughly 7.1% using 1550 kb/d as an average reference rate. The decline will re-appear again midway through 2020 when the Johan Sverdrup field achieves its expected peak rate of 440 kb/d. Adding 440 kb/d to its current August production should raise total output close to the previous high of 1790 kb/d in October 2016. It will be interesting to see if it achieves its previous high or whether the monthly decline will prevent it.
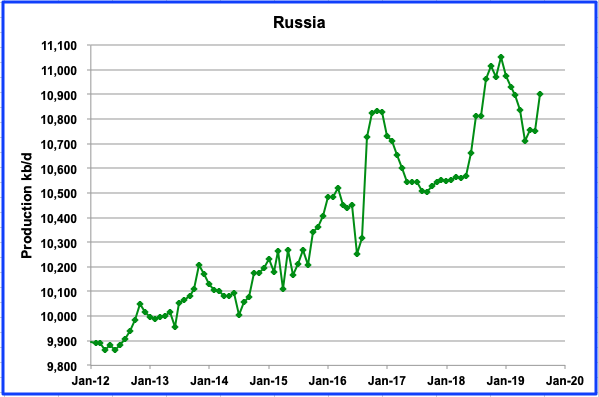
Russia continued to exceed its production targets in August. However, for Russia, which achieved its targeted cuts in only three months this year, full compliance got easier at the December OPEC meeting, as OPEC agreed to exclude condensate from Russia’s quota. The Russian Energy minister stated that the only reason Russia was falling short of its pledge was due to condensate production.
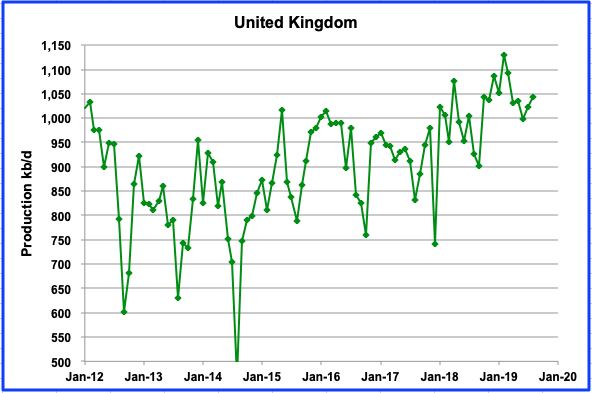
The UK’s output has begun to recover from unplanned outages. According to the IEA, “Overall, UK production is flat in 2019 and growing modestly by 20 kb/d in 2020, as field declines are just offset by rising production from fields West of Shetlands and Equinor’s Mariner project.” Mariner came online in August and will add close to 55 kb/d when it reaches its plateau next year.
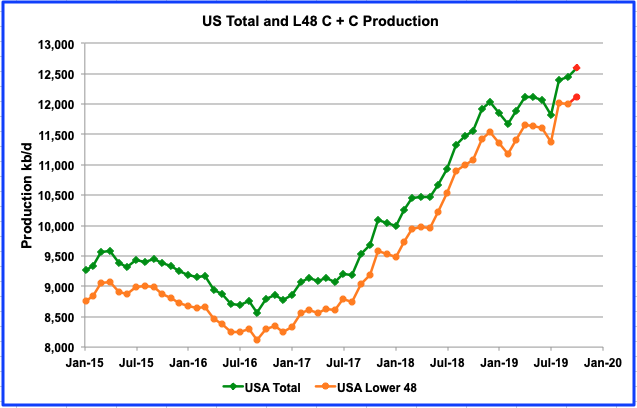
There continues to be much speculation and information pointing to a potential slowing of US oil production. However the latest production data from the EIA continues to point higher, albeit at a slower rate.
US production reached a new high of 12,463 kb/d in September according to the November EIA 914 report. Looking forward to October production, the November Monthly Energy Review (MER) estimates US production for October to be 12,600 kb/d, an estimated increase of 137 kb/d and shown in red as the last data point. Similarly, the October estimate for the L48 is 12,123 kb/d.
The initial growth estimate for 2019 is slower than for 2018. In 2018, growth to September 2018 was 1,432 kb/d. For 2019 it is 426 kb/d, ~30% of the 2018 growth rate. So while US production is growing, yearly growth is slowing.
There was little increase in September production relative to August in the L48 states. Increases in Texas, New Mexico and Oklahoma were offset by large decreases in the GOM (-114 kb/d) and North Dakota (-40 kb/d) that led to no growth.
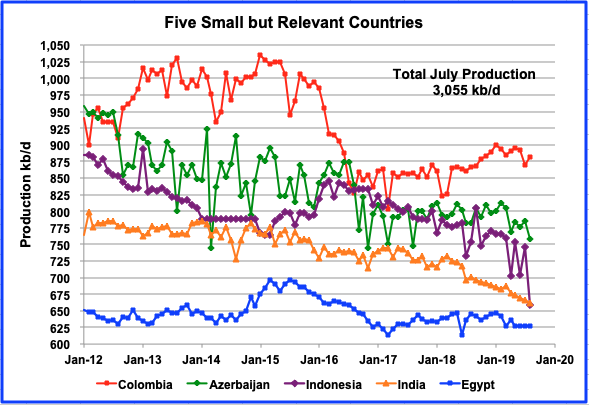
These five countries complete the list of Non-OPEC countries with annual production between 500 kb/d and 1000 kb/d. All five are/were in decline. However, Columbia started to increase its production in July 2018 but that has slowed now due to riots. Egypt started production from its newly discovered oil wells in its western desert in December. Initial flow rates are reported to be 7000 bbl/d.
Their combined August production is 3,588 kb/d. Indonesia’s August output dropped by 12% to 87 kb/d but is expected to recover in September while Azerbaijan dropped 28 kb/d.
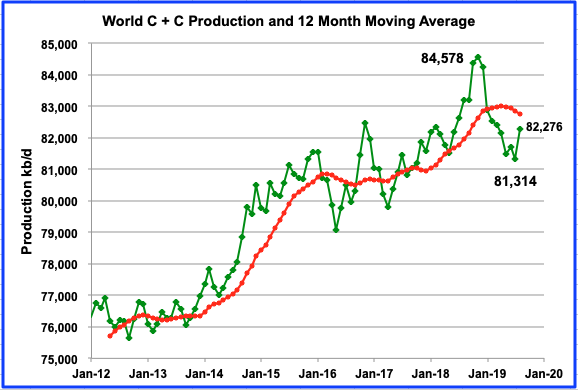
World oil output bottomed at 81,314 kb/d in July and added 962 kb/d in August to 82,276 kb/d. Of the 962 kb/d increase, 752 kb/d was contributed by Non-OPEC and 210 kb/d by OPEC. August production is still 2,302 kb/d below the November 2018 high. Note that even if the current OPEC quota cut of 1,700 kb/d were to be removed, it is not sufficient to overcome the 2,302 kb/d drop from the November high. It would take new production from Brazil, Norway and the US to fully overcome that drop, in addition to the repeal of the OPEC cuts.
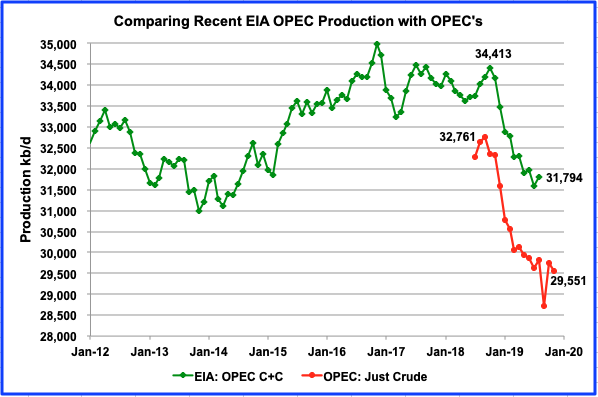
This is a comparison of the EIA’s estimate of OPEC’s C+C production vs OPEC’s crude output. The EIA’s estimate is roughly 2,000 kb/d higher, due to the inclusion of condensate. OPEC’s big production drop in September is shown in the OPEC graph but has not yet been reported by the EIA. Will it ever get back to 34,413 kb/d of October 2018 or the previous high at 34,976 kb/d of November 2016. Some say it is not likely using a conservative decline rate of 2% that never sleeps.
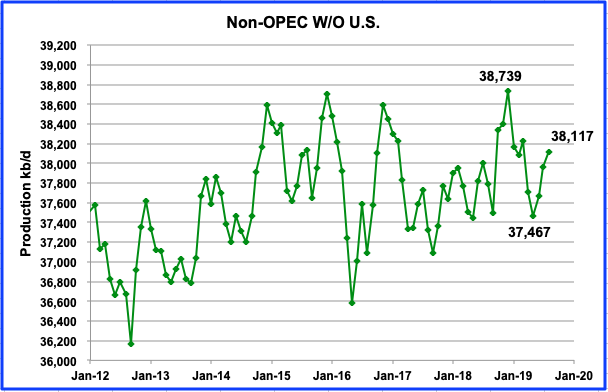
This chart shows Non-OPEC production without the US. This is one of the more critical charts that bears watching in the future. It is providing an early indication that Non-OPEC oil producing countries, excluding the US, could be on a plateau. This year will be critical since Brazil and Norway are both bringing new fields online with a production capacity of 400 kb/d and 440 kb/d respectively. Brazil has added one half of their expected increase this year and could add 200 kb/d next year. Norway has already added 350 kb/d before year end and could add an additional 50 kb/d to 100 kb/d next year. Adding the new production of 550 kb/d from Norway and Brazil to the 38,117 kb/d in August, would result in an output increase to 38,650 by year end. Of course, this excludes the decline that never sleeps and is discussed below.
Decline vs New Supply
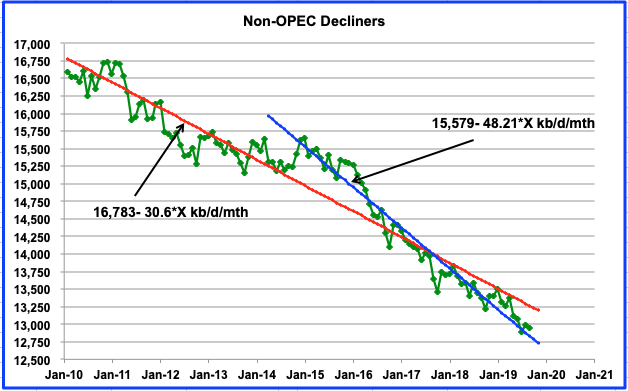
This chart shows the total C +C production from 45 Non-OPEC countries that are experiencing declining production. The red line shows the average decline rate from January 2010 and is slightly above 30 kb/d/mth. The blue line, covering the years after January 2015, has a higher decline rate. Provided the higher rate from January 2015 is on average representative of what is currently happening in those countries, then on a yearly basis, Non-OPEC countries are experiencing a decline rate of 48.2 kb/d/mth or close to 580 kb/yr.
Using a midpoint output level of 14,500 kb/d/yr in October 2016 as a reference point, and the higher decline rate, the yearly decline for these Non-OPEC countries is 4%. For 2020, both the IEA and OPEC are expecting world demand to rise between 1,200 kb/yr and 1,100 kb/yr respectively. After accounting for the 580 kb/yr decline, world oil supply next year will need to increase by close to 1,700 kb/d and possibly higher to meet the expected demand increase.
HSBC issued a report in 2017 that discussed decline rates of oil fields. It notes that 81% of world liquids production is already in decline. It further notes that the IEA and Uppsala coincidentally appear to agree on a ~6.2% average post-peak decline rate. This is higher than the 4% noted above and when combined with 81% of world production is in decline, the 580 kb/d estimated above could be conservative.
The report further notes that some analyses differentiate between natural decline (which purely reflects physical factors) from managed decline rates, which include the impact of reinvestment. The IEA estimates that the difference between natural and managed decline rates is between 2% and 3%, and has been rising over time. Based on the distinction between decline rates, the 4% estimated above would be classified as “managed decline” and accordingly, the natural decline rate of these NON-OPEC countries is closer to 6%.
So if the natural decline is 6% for these Non-OPEC countries, then the monthly decline estimated above may actually 50% higher at 870 kb/yr or 72.5 kb/d/mth. Considering that the above decline graph stops in August, we can expect an additional five months of decline or a further drop of 362.5 kb/d by year end. So the estimated Non-OPEC output without US of 38,650 k/d noted above could be closer to 38,300 kb/d. We will revisit this prediction in five months. If correct, this could be significant since it would be close to 400 kb/d lower than the 2018 peak of 38,739 kb/d.
Answer to Question in Title
Looking at the first chart, it is clear that Non-OPEC production is recovering from the the May low of 49,580 kb/d. However, the bigger question is will it exceed the December 2018 high of 50,777 kb/d. Looking at the charts above, the following production increases can be expected, Norway 350 kb/d, US 600 kb/d, and other 100 kb/d. Adding these to the 50,482 kb/d output in August gives 51,532 kb/d by year end. As above, removing the additional five months of decline, 362.5 kb/d, gives an estimated output of 51,170 kb/d by year end, which is close to 400 kb/d higher than the previous high. While it is higher, the year over year increase is only 12.5% of the 2018 increase and may be signalling a coming change.
241 responses to “Is Non-OPEC Oil Production Recovering?”
A chunk is Russia filling in for KSA when they got hit.
Ovi
It should be noted that the regulators have already jumped on the claims made for Egypt forcing the company to announce the following to prevent market abuse.
https://www.lse.co.uk/rns/UOG/egypt-update-in-response-to-media-reports-w54wwhxyjl17efa.html
Holy crap, is this spam? Here?
Thanks Lightsout for the heads up.
“Egypt said the newly discovered oil and gas wells in the Abu Senan area in the Western Desert started production on Thursday, the Ministry of Petroleum and Mineral Resources said in a statement.”
When I saw the above statement attributed to the Ministry, I took it to be official.
In Norway the Johan Sverdrup field will have full production off 440 kbpd in 2020. After this not much volume will be added , and as so far wells with high impact was dry or not economical to build out. In Norway most oil is already pumped up and gaz , liquid petroleum / condensate remains.
https://www.norskpetroleum.no/en/production-and-exports/production-forecasts/#production-forecasts
Low investment in maintenance have also increaced depleation rates since 2014.
Seens perhaps Brazil, GOM deepwater will add some barrels in future outside Opec. Russia have also lately made some onshore discoveries that might be built out.
Ok i will make a prediction, by mid summer 2020 JS will produce above 440.000 boepd.
There has been some very economical barrels found in Norway 2019, but size of those im aware of were close to or below 100m barrels, still if they are at 20$ barrel break even for full field life its kinda nice. Not high impact as you say but at least economical.
We also have the as far as i know best in class producer with opex sub 4$/barrel in Norway.
Then the new frontier on barents who sofar has delivered mixed results but is under drilled.
I would not count Norway out just yet but i agree they will never reach former peak.
Any opinions about how likely this is?
‘ It is estimated that the deep pre-salt layer could potentially raise Brazil’s output to 7 Mb/d by 2030’
[up from 3Mb/d currently]
Just as likely I will inherit the billions when my aunt dies . 🙂
you just speculating, or have any specific knowledge to share?
I am unable to get back to the original site directly but found a back way. Here is the statement:
“By the 2030s, the development of the offshore sites is predicted to raise Brazil’s daily oil production from 3m to 7m barrels a day, an increase that would make it the world’s fourth-largest producer, after the US, Saudi Arabia and Russia. Brazil is currently the ninth largest.”
Also found an update after the auction that appears to have failed.
“Officials in Brazil had hoped the auction would by the 2030s trigger a huge uptick in the nation’s oil production — from 3m to 7m barrels at day — a prospect that now looks unlikely.”
4 Mbpd increase in 10 years is about 1 Johan Sverdrup field anualy. Think that seems a bit to much also considering the time it took to develop the 3Mbpd they produce today. At the same time 4 Mbpd will be less than 30% of the world demand same period if increase is about 1.5 Mbpd average anualy. Will Saudi add the remaining 11 Mbpd + natural decline world wide ? I doubt it will ve US Shale as it seems now…
Well (no pun intended), even if its 2 or 3 Mb/d more by 2030, that ain’t shabby.
Iran and Venez could each add that much also,
in a world where things go smoothly.
Is there a world like that?
Possibly…but there’s also a world where they don’t even produce as much as they do today.
Venezuela – continued political decline seems to be the status quo
Iran – riots; military provocation; sanctions
Brazil – political corruption; extremely difficult area to develop
And of course the numerous other black swans that each have a 2-10% possibility of occurring:
– Iraqi political dissolution;
– Chinese debt bubble implosion;
– Terrorist attack on Saudi oil facilities;
– American shale debt bubble meltdown;
Etc…
Stephen,
The most likely scenario is that some negative stuff and some positive stuff will happen (negative means less oil, positive more oil or vice versa from an environmental perspective). Impossible to predict which specific events will occur, but highly unlikely they will be all positive or all negative.
I appreciate your optimism, Dennis, but a major escalation in the political situation in Iraq that would wipe out 5MM/day or Iran starting a war with KSA and taking 20MM/day+ off the market are NOT balanced by the upside of Brazil possibly producing a few extra barrels in 2030. Everything may very well end up hunky dory like your estimates suggest, that may very well be the most likely scenario in fact, but that doesn’t change the fact that one or two unexpected events could radically alter oil production to the downside.
Stephen,
It seems realistic to not expect a major war in the Middle East from my perspective, but bad stuff can surely happen. Oil prices would rise sharply under your scenario, no doubt, many projects that were not profitable at $60/bo for Brent would become profitable and output from non-OPEC would increase, as well as from OPEC producers not involved in the conflict. It would take 5 years, but the World would adjust and use the crude available. Oil prices would likely rise to $200 or perhaps $300/b, that destroys a lot of oil demand.
It also speeds resource development.
Dennis – I appreciate your optimism, the “can do” spirit of adjustment that you place so much faith in, but I don’t think you’ve fully internalized the role of money and debt as the prime organizing agents of our just-in-time economy.
Shocks to any system are bad. An oil price shock will slam into the largest aggregate and ratio-level debt pile in human history.
1 in 8 companies are zombie companies, meaning their operating cash flows are insufficient to even make the debt interest payments they carry.
What we call “subprime” is a line in the sand under current conditions, which are themselves primarily enabled by abundant oil. Remove the oil, and you see a price spike. Remove the oil and the current conditions shift. Remove the oil and the subprime line ratchets far higher. Move that line far enough and the entire edifice of debt becomes unstable and it topples over.
This is why I have been a fierce critic of the central bankers insane belief that credit cycles are preferable to business cycles.
Credit cycles are fun on the way up and offer the false belief that we puny humans are in control, and can manage the outcomes of an inherently chaotic and complex set of interlocking systems.
Business cycles are far more frequent and less fun. They tend to wipe out the excesses and bad decisions before they go “too far.” Little brush fires that happen frequently.
Credit cycles go on far too long and when they finally catch fire, it is a devastating crown fire that ruins the shrubbery and biggest trees alike. It’s an ecosystem reset.
There’s no “adjusting” to such an event. All the crap that really shouldn’t have happened gets reset, not adjusted. Shale companies that have lost a quarter trillion dollars simply go bust. 1 in 8 companies go out of business. But that number might be 1 in 4 once the subprime line migrates north during the deflationary bust.
It’s far more interconnected and complex than you lay out as something that can be adjusted to. And it’s very hard to see from our current perspective because everything seems to be working okay.
But it’s not. Not when you look at the growth in debt relative to actual income (GDP). Not when you understand the unmet pension and entitlement promises. Not when you see how governments at all levels (fed, state, local) have organized themselves around the “reality” of the credit machines.
But especially not when you see the extent to which the entire machinery of economic growth is addicted to perpetual growth and endless resource extraction.
The math just doesn’t work.
At a minimum credit growth needs to match actual organic economic growth. It’s vastly exceeding that and has been for a few decades.
That’s all just potential energy in the system, and that system is fine as long as it doesn’t receive any sort of a big shock.
Rapid oil price spikes have traditionally been one of the most reliable shocks in the data. No reason a future shock would be any different. Especially not with record levels of debt and unmet IOUs in the system.
Over the last 40 years the rich have turned their federal taxes into IOUs. The bigger they are the harder they fall. Poetic justice.
“Adjustment”, “reset” really. You seem most interested in an argument and part of the noise.
Chris,
My expectation is another financial crisis at least as severe as 2008/2009 or perhaps Great Depression 2.
I understand the World is far more complex than can be modeled by boiling things down to a few key variables (which I would call a reductionist analysis), that is why your claims that “energy is everything” seems far too simplistic. It is important, no doubt, but from my perspective, though I agree with much of what you wrote and also agree there can be too much debt, it is not clear where that line is.
Consider that a typical metric for mortgage lending is a total debt to income ratio of no more than 3. The same sort of metric for the World would put debt to GDP for the non-financial sector at no more than 300%. Using BIS data for the World we get the chart below. It is not that alarming.
The World economy will recover from the coming Great Recession/Depression that might begin in 2029-2031 that may occur in response to peak C+C in 2024-2026. The speed of recovery from that economic crisis will depend upon policy makers remembering their Keynesian economics. Unfortunately many graduate programs in economics (in the US) pay little attention to Keynes and are all about microfoundations for macroeconomics. Those economists will be of little help and will argue for nonsense like fiscal austerity in response to a lack of aggregate demand, much like Hoover’s advisers in 1930-1933.
“Using BIS data for the World we get the chart below. It is not that alarming.”
Couple of errors there. First, just counting the debt and forgetting the liabilities is a no-no. Any mortgage broker, to follow your household analogy, is going to ask about both your debt levels and your liabilities.
Got three kids entering college next year and nothing saved up? That counts against your borrowing capability. Got plenty of income but also ten years of alimony left? Another ding.
Second, as I’ve tried to illustrate for you before, if your income (GDP) is spiked by borrowing (debt) it’s not actually real “income.”
Remember the example of your and my hypothetical GDP’s but one was spiked 100% by debt?
The funny part about the BIS data you cite is that it (1) counts the GDP portion that resulted from borrowing in full but (2) does not subtract or adjust for debt at all.
It’s a glorified form of double counting.
That “system” works as long as everyone holds the same fantasy; credit growth can exceed income forever,
I’ve beaten my head against the wall for over a decade trying to get people to see this simple logical error. It’s hard.
Like explaining water to fish hard. That’s what happens after too many years in a given system, it’s never even questioned any more…
The data:
The noise continues
“It’s a glorified form of double counting”
No, it’s a means of investing against the future
Almost every metric of debt and financing is beyond 2007, so why was there a GFC in 2007 but not now?
http://creditbubblebulletin.blogspot.com/2019/12/q3-2019-z1-flow-of-funds-repo-madness.html
1) there is nowhere for capital to run – there are no healthy actors / parties
2) 2007 was relying on the credit stability of people commuting from Stockton to SF (4 hours a day), housing developments sprawled across Las Vegas, and the slums of Cleveland. 2019 is relying on companies with fairly direct access to the money hose.
so you are both likely wrong. dennis’ idea that $200/b oil would be a “tough adjustment but we’d get through it” is extremely improbable and chris’ idea that the credit cycle will end by some magical mechanic as to yet unnamed even after 10 years of digging (by many people) also has serious impediments to occur.
Two cents-
You don’t want to be around when this huge debt/credit bubble breaks. And it will.
HB- “No, it’s a means of investing against the future”
That’s straight-up word salad…what does it mean to “invest against the future?”
Maybe this is a verbal Rorschach test?
So true hickory. The end of this credit bubble will obliterate the global economy. But it won’t be an artificial trigger. I think only peak oil, true geological peak oil will end it.
Chris, good luck talking to fish, but for you I will keep it simple.
When a business or individual borrows money. They agree to pay it back, get this “in the future”. If you know of a bank that doesn’t have that requirement, please let me know.
Then the business or individual puts it to work. That’s an investment good or bad. Be it to drill a hole into the ground, put up a factory to build cars or pay their sales force. The objective is to profit enough to pay back the loan with interest and have an asset left over to keep.
When an individual takes out a mortgage. It’s an investment in real estate and a place to rest their head at night. Same with a car loan, it’s an investment in a vehicle and access to transportation. Even using a credit card at McDonalds is an investment against hunger.
I never said all loans are wise decisions. That’s for the borrower and loan officer to figure out.
No “glorified form of double counting” here. Just the opportunity for those who are short on capital to succeed and expand an economy beyond the wealthy.
Chris,
GDP is income, by definition. The debt is a balance sheet item, for every asset there is an equal liability. For planet Earth as long as there is no interplanetary economic interaction any debt that has spiked GDP is a liability for one citizen of the Earth and an asset for another citizen. I consider the terms debt and liability to be synonyms, so perhaps I should have used the term liability, I am not in the Mortgage lending business, all of my “liabilities” are debts. Low interest mortgages that there is no need to pay off early as the money earns a higher return invested.
You seem to have a very different understanding of GDP from economists.
https://en.wikipedia.org/wiki/Gross_domestic_product
I will go with mainstream economics on this one.
Quick question for you? When you borrow 200k for a mortgage does that show up as income on your W2?
Did not work that way for me, maybe the rules are different where you live. :)\
GDP=national income, debt is a separate issue. It is properly left out of GDP. One entity lends x and holds that promise to pay as an asset, another entity gets x and now holds a liability equal to x which is paid over time with interest.
I am confident that the BIS understands the economics quite well, perhaps their are some who understand less well.
two cats,
I doubt the price of oil will get to $200/bo in 2018$. Keep in mind that real GDP grows about 3% per year on average (at market exchange rates) for about the past 10 years.
So let’s take 2012 when oil price averaged around $110/b in 2018$, in 2022 if World real GDP grows at 3% per year on average from 2012 to 2022 then in 2022 World real GDP will be about 34% higher than in 2012 (1.03 raised to the 10th power is roughly 1.34). World output may be about 10% higher in 2022 vs 2012, so 1.34/1.1=1.22 and oil prices could be 22% higher and the proportion of World income spent on C+C would be about the same as in 2012, so a price of $134/bo would be a similar load on the economy in 2022 as $110/bo was in 2012. My guess is that the peak in 2025 would result in slightly higher prices perhaps $150/bo, if the economy does not slow its growth in response to peak oil.
Competing factors here, the transition will be disruptive, but it will also open up opportunities for new businesses (those that will need to expand to produce batteries for EVs, rail, light rail, EV production of cars, trucks, and buses) on balance the effect might be more growth, difficult to predict, I would say less growth perhaps slowing to 1.5% real GDP growth is the more likely outcome.
Despite everyone saying my scenarios are too optimistic, my best guess scenarios of the past have in every case proven to be too low rather than too high (so optimistic only from the perspective of environmental degradation).
I think we are well beyond the point that we should acknowledge that even in a world where things don’t go smoothly, the incentives to produce enough oil to keep the “civilized” world from collapsing are existentially astronomical. In addition, individual actors are well incentivized to maximize revenue (for state actors) and show “growth” (for market actors). Without the ability to “cartel” to limit production and maximize profits, market actors can’t really limit supply to adjust to demand. Some will reduce capital expenditures but others will raise capital expenditures. Some will bet on lower oil prices, others on higher.
This is all to say – oil production will probably stay near the top of what is possible geologically, and considering OVIs post, that should mean recovering or at least stabilizing.
Brazil got attention here some years ago.
The offshore presalt stuff is very deep and very high pressures, as I recall. Kashagan level pressures.
There was also a bizarre regulatory problem in that helicopters capable of that round trip range were very rare, and this was going to obstruct staffing of the platforms. Maybe more have been built by now.
But again, if prices crept up to even close to $100 for more than 4 months, I bet someone would find those helicopters.
Dennis thinks debt boosts the economy, yet when US debt was low in the 50s GDP growth was far higher than now.
https://www.zerohedge.com/news/2017-01-27/barack-obama-now-only-president-history-never-have-year-3-gdp-growth
The reason GDP is lower and debt spiraling out of control is obvious to anyone who really understands what debt can and cannot do.
Dennis
GDP is not income. It is the value of all goods sold. If a house builder builds a house, they first have to buy all the bricks and mortar, windows, piping and pay for Labour. Their income is the difference between all expenses and what they sold the house for.
US government income is NOT the GDP of the country, it is total tax receipts, which is about £3.4 trillion. The government is spending $1 trillion more than this. The government is having to borrow $1 trillion in order to pay the $350 debt interest and other liabilities.
When people buy a house they pay down the debt, in this case, the family is not paying down the debt. It is borrowing more and more simply to pay the interest and food and bills.
The fix is simple.
The next government must tell the people they must work 10 hours per month extra and all that money must go to the government to pay for pensions, medicaid the armed forces etc.
The alternative will be far worse.
Peter,
See section 2.2 (income approach) of page below
https://en.wikipedia.org/wiki/Gross_domestic_product
The second way of estimating GDP is to use “the sum of primary incomes distributed by resident producer units”.[5]
If GDP is calculated this way it is sometimes called gross domestic income (GDI), or GDP (I). GDI should provide the same amount as the expenditure method described later. By definition, GDI is equal to GDP. In practice, however, measurement errors will make the two figures slightly off when reported by national statistical agencies. (part left without italics for emphasis by me).
I agree that government debt levels should be reduced during periods of high employment either through higher taxes or lower government spending.
You might not realize this, but when the government spends money on military equipment, healthcare, or roads and bridges the jobs that are supported by that spending creates higher national income. This is described in any standard textbook.
See
https://www.amazon.com/Macroeconomics-Paul-Krugman/dp/1464110379/ref=zg_bs_2596_33?_encoding=UTF8&psc=1&refRID=APFZ057AFAP7SAASBCBA
or for a classic text
https://www.amazon.com/Economics-Paul-Samuelson/dp/0072314885/ref=pd_cp_14_2/145-5526016-7266342?_encoding=UTF8&pd_rd_i=0072314885&pd_rd_r=f80e09a0-5802-4c6b-8231-fdec497f331e&pd_rd_w=FzVYR&pd_rd_wg=Swwm5&pf_rd_p=0e5324e1-c848-4872-bbd5-5be6baedf80e&pf_rd_r=AJ8WTH132C4GZ8AY6PVT&psc=1&refRID=AJ8WTH132C4GZ8AY6PVT
No doubt there is something at your local library.
Also on GDP growth one should look at real GDP per capita
https://fred.stlouisfed.org/series/A939RX0Q048SBEA#0
The average real per capita GDP growth rate from 1950 to 1959 was 1.5% per year in the United States. From 2010 to 2019 the average annaul growth rate in real GDP per capita in the US was 1.57%. The average rate of growth of real GDP per capita from 1950 to 2019 was 2% per year in the US. From 1960 to 2007 the average annual growth rate in real GDP per capita was 2.15% per year.
Dennis
I am still not sure if you understand the difference between GDP and revenue.
Real GDP is like the turnover of a private company, if run properly that turnover will generate a profit. That profit is the equivalent of all the taxes a government can raise out of the GDP.
You do not appear to understand the difference between profit generated by a properly functioning business and a company that has to borrow increasingly more and more money to pay it’s workers.
The first can go on for ever, the second will crash and burn at some point.
I do not think you really have a grasp of what is coming down the road and what a sustainable economy looks like.
Keynes never envisioned his theories would be twisted to this level by such dishonest men in government.
Peter,
I understand very well. Did you read the Wikipedia page on GDP?
You could also try any introductory macroeconomics textbook. I used to teach this stuff in graduate school, I understand it quite well. I also have read and understand Keynes’ work quite well. One of us does not understand this well. 🙂
Dennis
I have a couple of friends who teach economics to degree and masters level.
They have explained to me what is structurally wrong with many economies particularly the US. It’s fiscal deficit and trade deficit are the result of gross malfunction. Just like an engine you can inject more power “money” to overcome a malfunction. However at some point things break up.
When it does people like you will blame everyone else except your own deluded thinking. Trouble is, you will take down many hard working people in the ensuing chaos.
I hate people like you who give legitimacy to politicians that they can run up large debts and there will never be a reckoning.
Nonsense, your hate is unjustified
Nonsense, your hate is unjustified
Huh? I detected no hate in anything Dennis said. I think your comment is unjustified.
There are many things that people do not understand, including myself. Simply pointing this fact out carries no characteristic of hate whatsoever.
My response was to Peter, not Dennis. I thought it was pretty clear if you read Peter’s comment.
Dennis shouldn’t even respond
Sorry HB, but you should indicate to whom you are replying when comments get to this level.
I agree, hate is almost always unjustified. I don’t even hate Donald Trump. But I do hate what he is doing to our country and to the office of the Presidency. Our president has become the laughing stock of the world.
Nancy prays for him 🙂
Peter,
I stand by what I have said.
Perhaps you have not understood what I have written.
I have said the fiscal government deficit is a problem at high employment rates and should be corrected.
Tax cuts when the economy is doing well is stupid policy unless there are equal reductions in government spending.
One needs to look at more than trade deficits, service, and capital flows must also be included to fully understand the international economics.
Your friends probably understand this, not clear from what you have written that your understanding is clear.
It is the value of all goods sold.
It is the value of all goods and services produced in a specific time period.
But also what Dennis said.
Actually the next government should undo Trump’s dumb tax break. And Bush’s dumb tax break. And Reagan’s dumb tax breaks. Also a lot more money needs to be spent on the IRS, because they are where to government gets its money.
America’s government debt is too high, but it is not the biggest problem facing the country. The biggest problem is the current account deficit, which is the result of excessive consumer spending. Taxes on consumption would help, and energy is an obvious place to start.
And now that we have a solution, I am going back to sleep . If wishes were horses beggars would ride.:-)
If horse turds were biscuits they would eat till they died. 😉
To get an emoji you must put a space between your period and your smiley face.
https://www.wsj.com/articles/banks-get-tough-on-shale-loans-as-fracking-forecasts-founder-11577010600?redirect=amp#click=https://t.co/Zg0IfVvcXf
Banks Get Tough on Shale Loans as Fracking Forecasts Flop
Oil and gas companies face tightened credit after wells produce less than projected
Dec 22, 2019
Some of the banks that helped fuel the fracking boom are beginning to question the industry’s fundamentals, as many shale wells produce less than companies forecast.
Banks have begun to tighten requirements on revolving lines of credit, an essential lifeline for smaller companies, as these institutions revise estimates on the value of some shale reserves held as collateral for loans to producers, according to people familiar with the matter.
Some large financial institutions, including Capital One Financial Corp. and JPMorgan Chase JPM -0.08% & Co., are likely to decrease the size of current and future loans to shale companies linked to reserves as a result of their semiannual reviews of the loans, the people say. The banks are concerned that if some companies go bankrupt, their assets won’t cover the loans, the people say.
JPMorgan Chase declined to comment. Capital One COF -0.01% didn’t respond to requests for comment.
The tightening financial pressure on shale producers is one of the reasons many are facing a reckoning going into next year. Chevron Corp. said Dec. 10 that it plans to take a charge of $10 billion to $11 billion, roughly half of it tied to shale gas assets, which it said won’t be profitable soon. Royal Dutch Shell PLC said Friday it will take a roughly $2 billion impairment, and other companies are expected to follow suit in writing down assets, according to analysts and industry executives.
The heat is greatest for small and midsize shale producers, including many whose wells aren’t producing as much oil and gas as they had projected to lenders and investors. Some of those companies may be forced out of business, said Clark Sackschewsky, the managing principal of accounting firm BDO’s Houston tax practice. Large companies are likely to weather the blow because of their size and global asset diversity, but for some smaller shale operators, tightening access to bank loans could prove disastrous.
“We’ve got another year under our belts with the onshore fracking assets, which includes less than optimistic reserves results, less production than anticipated, a reduction in capital investment into the market,” Mr. Sackschewsky said.
Oil and gas producers expect banks to cut their revolving lines of credit by 10% as a result of the reviews, according to a survey of companies by the law firm Haynes & Boone LLP. The cuts may be more severe, say some people familiar with the reviews.
Banks have extended billions of dollars of reserve-backed loans, though the exact size of the market isn’t known. JPMorgan said in a regulatory filing in September that it has exposure to $44 billion in oil and gas loans, and Capital One COF -0.01% said in October it has extended more than $3 billion in oil and gas loans. It wasn’t clear for either bank what proportion of those are backed by reserves.
Banks have typically applied a 10% discount to the value of reserves, meaning a shale company could borrow against 90% of its reserves as collateral. Banks have typically lent as much as 60% of that value. But some are now discounting the value by as much as 20%, the people say.
Meanwhile, some regional banks have begun writing off bad energy loans. Net charge-offs shot up at Huntington Bancshares in the last quarter. The Ohio-based lender attributed the move primarily to two energy loans where the borrowers’ production had not met expectations, Huntington Chief Executive Officer Stephen Steinour said in an interview.
“Geology and the assumptions were just flawed,” Mr. Steinour said.
Many investors have lost faith in the viability of shale drillers, as natural-gas prices stayed low and many companies broke promises on how much their wells would produce and when they would begin to turn a profit.
As investors have retreated, cracks have begun to show. Energy companies accounted for more than 90% of defaults on corporate debt in the third quarter, according to Moody’s Investors Service. There were more than 30 oil-company bankruptcies in 2019, exceeding the number in 2018 and 2017. Exploration and production companies are now carrying more than $100 billion in debt, according to Haynes & Boone.
Skepticism among banks has grown in part because lenders have more closely scrutinized public well data on production and seen that it is falling short of forecasts, as a Wall Street Journal analysis showed earlier this year.
Specifically, banks have begun questioning shale producers’ predictions about their wells’ initial rate of decline, which are proving overly optimistic, according to engineers. If shale wells, which produce rapidly early and then taper off, are declining faster than predicted, questions arise regarding how much they will ultimately produce.
Share Your Thoughts
What do you think tightened credit requirements mean for the shale industry as a whole? Join the conversation below.
Some lenders have flagged publicly that they will be less generous with loans in the future. “With respect to any new energy loans, we are highly cautious; it’s a very high bar we must clear,” said Paul B. Murphy, CEO of Cadence Bank, in an October call with analysts. The firm operates in Texas and the southeastern U.S.
Bank lending has slowed across the board in the country’s hottest drilling region, the Permian basin in West Texas and New Mexico. After leading Texas last year, loan growth in the region shrunk to 4.8% below the state’s 7.5% average in the last quarter, the Federal Reserve Bank of Dallas said Thursday.
More than a decade into the shale boom, investors are trying to wrap their arms around the true value of producers’ assets, said Michelle Foss, an energy fellow at Rice University’s Baker Institute for Public Policy.
“There is a struggle now for investors to determine what things are actually worth,” Ms. Foss said.
Dwindling access to bank loans will put more pressure on an industry that has already lost access to other sources of money. Without new cash infusions, many companies may be unable to drill their undeveloped reserves, which could further diminish the value of their assets.
Some shale companies have been lobbying the Securities and Exchange Commission to change its rules governing reserves reporting, allowing them to count undeveloped assets as reserves for a longer period. The SEC currently allows oil and gas producers to report reserves as “proved” if the companies plan to develop them within five years.
In an August letter to the SEC, Continental Resources Inc., one of the largest shale companies, pushed for the regulator to extend that period to 10 years. The company, founded by the billionaire prospector Harold Hamm, said its proved reserves would be around 16% higher with such a rule change.
A Continental spokeswoman declined to comment. An SEC spokesman didn’t respond to a request for comment.
“There is a struggle now for investors to determine what things are actually worth,” Ms. Foss said
although this is exceptionally true for LTO companies, it is broadly true for the whole economy due to the economic distortions frequently pointed out by Watcher, et al. I’ve read a lot of broader economic articles stating that ONE DAY these distortions will unravel, revert to the mean, etc, but rarely do I see discussion of the exact mechanics of how that happens. It is possible that a fall-out in oil/gas spreads contagion to broader economy, but is $100 billion enough to create that?
Doesn’t seem big enough. More likely something really big like Chinese debt bubble collapse. 30-40 years of unchecked growth fueled by massive debt has created some crazy distortions with huge ripple effect potential.
Agreed oil business not big enough. China has been straining for a while to maintain growth, while stopping capital flows, and fixing its currency, and juicing the economy as needed. But nobody can call them on it because its a Mutually Assured Destruction scenario. No one could take down China without also taking out themselves for quite a while (supply chains would shatter, Amazon business model destroyed, growth engine for STEM lords would vanish, etc). It may happen by accident…
Ovi,
Enbridge (Canada) has said that it can increase pipeline capacity without building more pipeline since that is currently difficult to do there. TC, which I believe was TransContinental, may be saying the same.
Two of Enbridge’s approaches are first to stop carrying crude from the Bakken, maybe completely, and second reverse the Sunshine pipeline which carries condensate from the US to be used for diluent in Canada. They say they can do this because more condensate is coming out of Western Canada so they don’t need it from the US.
Canada’s problems exporting its crude are looking to have more effect in the US than they have been having.
Synapsid
In looking at the Enbridge web site, they are enthused at what friction reducers can do for increasing pipeline through put.
I had read that they were thinking about reversing the sunshine pipeline. It sounds easy but if they have the same issues we had in Canada it can take a while.
Quebec asked Enbridge to reverse the pipeline from Sarnia to Montreal so that the two refineries there could keep functioning. Now that has been done, New Brunswick would like a pipeline to help their refineries. Quebec now says Canada does not have the social license to do that. (Note: pipelines are a Federal jurisdiction when they cross provincial borders) Excuse me for digressing into my rant regarding Social License
Back to reversing that pipeline to its original flow direction, Sarnia to Montreal when it was first built. It took three years of environmental assessments and hearings and protests to get it approved. I am not sure what the procedures would be in the US. The Canadian part being in Alberta might be easy.
TC Energy, formerly Trans Canada pipeline.
This crept up on us.
Canadian condensate 420K bpd. Canadian production is 4 mbpd and 1/2 of that is out of Edmonton and oil sands.
So 2 mbpd diluted with 420K? Doesn’t seem right. We need to know that ratio because if 420K is enough, the Eagleford is in big big trouble.
Permian sweet spots continue decreasing as shown by decline in production from high production wells > 800bd.
Mar 2019 681 wells producing 824 kbd, average of 1,210 bd/well
Sep 2019 575 wells producing 696 kbd, average of also 1,210 bd/well
https://shaleprofile.com/2019/12/19/permian-update-through-september-2019/
For Permian wells that started producing in 2018, the chart below gives the productivity distribution based on 4 month cumulative output. Average cumulative 4 month output is 68467 for the 5181 wells that started flowing in 2018.
For the Permian wells that started producing in 2019 and have at least 4 months of output we have the 4 month cumulative output productivity distribution in chart below. Average 4 month cumulative output for the 2444 wells that started producing in 2019 and have produced at least 4 months is 73383.
Based on this it would suggest little change in sweet spots.
The number of high output wells has decreased because there have been fewer wells completed, it is that simple. In addition the most recent months are incomplete with many wells not included.
There has been little change in productivity from 2016 to 2019 when normalized for lateral length, see
https://shaleprofile.com/wp-content/uploads/2019/12/Cum-vs-time-600×361.png
from https://shaleprofile.com/2019/12/19/permian-update-through-september-2019/
Tony,
If we look back at the July Permian report
https://shaleprofile.com/2019/07/04/permian-update-through-march-2019/
we find 643 wells producing 774 kb/d for Permian wells over 800 b/d, 1203 b/well for March 2019.
Using only wells with more than 800 b/d output is not a great way to define sweet spots, depends on acres per well, lateral length, type of completion, pounds of proppant, and many other factors that change over time, average well profile is a better measure. As sweet spots become fully drilled, the cumulative output of the average well will decrease. There is little evidence of this to date.
See chart below with quarterly changes in well profiles in 2018 and 2019.
Using only wells with more than 800 b/d output is not a great way to define sweet spots, depends on acres per well, lateral length, type of completion, pounds of proppant, and many other factors that change over time, average well profile is a better measure. As sweet spots become fully drilled, the cumulative output of the average well will decrease.
You listed many factors that influence well production. But at the very least production should be normalized, either per lateral lineal foot or acres per well. If drillers keep increasing lateral length, average cumulative output per well could stay the same even as drilling moves to less productive areas. Average well profile is a poor measure unless corrected for changes in well length.
Joe,
I agree, see the chart at the post below for the Permian basin.
https://shaleprofile.com/2019/12/19/permian-update-through-september-2019/
image at
https://shaleprofile.com/wp-content/uploads/2019/12/Cum-vs-time-600×361.png
what this shows is that the well profile has not changed significantly when normalized for lateral length from 2016 to 2019. I do not have access to the full analytics at shale profile, too expensive.
Thank you very much for the chart link, which is just what I wanted to see.
It looks like production per 1000 ft of lateral length increased until 2016 and has remained stable since then. I only know what I read here and at Oilprice.com, but my guess is that increasing the number of frac stages and volume of proppant led to increasing production per foot. It looks like technical improvements have maxed out, since per foot production isn’t increasing anymore.
When the average well cumulative production curve per foot starts declining, which hasn’t happened yet, we will know that the best acreage is saturated with wells and drillers have had to move to areas with poorer production.
Joe,
Agree 100%. From what I see, the sweet spots are not fully drilled up yet in the Permian Basin, when we see output per foot of lateral decrease significantly, that will be the key signal. Unfortunately I only have access to the free stuff on htpps://shaleprofile.com and a similar chart (well profile normalized for lateral length) for other plays like the Eagle Ford and ND Bakken is not freely available.
Correct web address for shaleprofile is
https://shaleprofile.com
The blog link has a ton of great information.
Thanks for the great post Ovi. I really like coming here for the condensed data and analysis.
A quick Q: In the first image of the article there’s an arrow pointing to a month and it’s indicating that it’s “Dec. 18- 47,615.
I think it actually might be pointing to Dec. 17. As it seems to precede the January 2018 data point.
Or maybe I’m confused, which is not uncommon BTW.
Survivalist
You go to the Front of the Class. Fixed
Thanks
Cheers Ovi,
again, great post. Thanks so much.
On the non-OPEC decliners, note what happened from Jan 2011 to Dec 2014 when Brent Oil price averaged about $110/b in 2018$, the decline rate was relatively flat. From 2015 to 2018 the average Brent oil price was $57/b in 2018$. The oil price matters as there are more oil resources that are profitable to produce at high oil prices. This fact will affect World decline rates.
Not that I am not suggesting that there will be no peak, simply that it is likely to be accompanied by high oil prices similar to 2011 to 2014 (and likely higher than that level). Using a low oil price period to forecast future decline rates is highly problematic from my point of view.
I agree Dennis and it also complicates projecting and or predicting peak even more so.
Iron Mike
As noted below, the objective was to find some realistic number to use for yearly decline rates to add to IEA/OPEC demand numbers. I have never seen one except as a percentage of wells that are in decline. No a very useful statistic. So we have a number now 500 kb/d/yr. As usual, I will continue to look for clues as to how real this is. My hunch is that it is too low.
Hi Ovi,
Thank you for the post. Are you basing the decline rate based on the linear regression ?
Some of the non-opec countries production rates look more like polynomial regressions, and projecting them based on different polynomial degrees might come in handy and interesting.
Iron Mike,
Random polynomial curve fitting without theoretical justification is unlikely to tell us much in my opinion. I agree linear regression is also not ideal, just gives us future trend, but again those trends are very likely to change so may tell us little about the future. Slope might become more steep or less steep or remain the same.
Totally agree, just for fun to see which future data points correlate the best or not at all with which polynomial curves.
It works rather well with climate, since we can justify it with a warming earth, and on different places on the earth the polynomial fitting differs by some margin.
Iron Mike,
One can play with historical data (say data up to 2005 or 2010) and fit some curves to that data (without looking at data beyond that date, no cheating) and see how well the polynomial fits will do. I am fairly sure you will find that it does not match the future very well, unless you cheat and use the “future” data to pick your best fit.
Predicting the past is not difficult, it is the future that is problematic. 🙂 (as Bohr and others have correctly suggested.)
Iron Mike
The best one can do with the current data is linear regression, keeping in mind that straight lines don’t go on forever. Doing a segmented analysis with lines can point to changes.
One can do better when there are multiple countries, fields, producing zones, etc. Group by type and do a linear projection for each type. Some types will project well. Others have problems or successes as events. They do not project reliably. But they will give an estimate of the reliability of the linear projection.
Dennis
Not quite sure what you mean that the slope from Jan 11 to Dec 14 is relative flat. See attached updated chart. It is 21.54 kb/d/mth or 258 kb/d/yr. Not insignificant.
The objective in undertaking this exercise was to see how much has to be added to world projected demand to meet the Real yearly oil demand increase which is “Market demand from OPEC/IEA + Decline rate”. As noted above Brazil and Norway are expected to add 750 kb/d over the next year. As you are aware, you just can’t add that to today’s output because decline is steadily working.
What we are looking at here, as noted above, is “managed decline rates ” which are affected by investment. This is why the calculated rates are lower than what is provided by hard data from individual wells. However, it was encouraging to get a managed decline rate of 4% since it tied in well with the IEA’s estimate of actual decline as obtained from individual wells.
So looking at the two extremes of decline rates of 258 kb/yr and 870 kb/yr, for our purposes, it is worthwhile to assume that roughly 500 kb/d should be added to the demand numbers published by OPEC/IEA.
Ovi,
I would disagree. The 260 kb/per year decline seems more likely in a high oil price environment. Output for the World is roughly 80,000 kb/d, add the 800 kb/d increase in demand (long term average) and we have 1060 kb/d extra needed each year, about 1.3%, but note that high oil prices are likely to reduce the 800 kb/d increase in demand to zero, so the 260 kb/d is 0.3% of 80,000 kb/d of World C+C output.
My point was simply that 260 kb/d is a smaller slope than 870 kb/d, so it is less steep.
So a beginner slope vs an expert slope and thus flatter (or less steep). I believe I said relatively flat rather than that the slope was zero.
Dennis
Not sure what you are disagreeing with, 500 kb/d decline rate?
Relevance depends on the denominator one chooses. I was looking 260 kb/d relative to demand. It is an increase of 25% using your 800 kb/d long term demand.
Also consider all of the effort and investment required by Norway and Brazil to bring on 440 kb/d and 300 kb/d, respectively. The 260 kb/d is a significant percentage of these two fields maximum output.
As an aside, I see no mention of zero in my response, only “relatively flat”.
Ovi,
My comment said relatively flat, you came back with, “not really”, I am comparing the less steep slope with the steeper slope that you highlighted, so where you seem to think it is likely to be steeper than 500, I think it is likely that it will be less steep than 500 kb/d for the annual decline of the non-OPEC decliners, probably around 270 kb/d. Canadian, Brazilian, US, and OPEC output is likely to be able to meet a 270 kb/d decline. Higher oil prices will reduce demand growth as Brazil, Canada, US, and OPEC approach peak output over the next 5 years. That is how I see things playing out, with the market adjusting to whatever supply disruptions occur.
Ovi,
I misinterpreted, “not sure what you mean by”… in your comment as you disagreed, I should have read it literally.
As all I meant, was the slope looked like it’s absolute value was smaller, which your chart confirmed.
And yes at the time I wrote that comment, my guess was that the decline rate might be closer to 260 kb/d in a high price environment, since then it has occurred to me that lags in response to prices may confound the analysis, so either 500 kb/d annual decline or perhaps 4% (if we look at the natural log) decline seems a good guess.
Regarding well decline rate we know reduced profit since 2014 have made oil producers to cut maintenance cost of wells and equipment. This have increaced decline rates and I believe a continuing low oil price in the 55 – 65 usd WTI range might have same impact of shale wells abd might add some decline. Else I read from a Newspaper in Texas hotell rooms in permian district are vacant, reduced rent level. Workers are layed off , sent home. Value off homes decrease. All this is sign of a slow down.
Dennis,
Fed is increasing it balance sheet to a all time high over next 4 months. Adding $400 billion to it. And guess what the dollar hit a bottom and will be going higher over next 4 months. Now if your able to answer how the dollar will rise in value while the Fed is expanding the balance sheet at the rate that they have stated it was going to be. You’ll also figure out why the price oil will roll over here and head south.
I believe the oil comes out the ground regardless of profit or price. Even if the government has to go in and produce it at a loss it’s coming out of the ground. Price really shouldn’t be part of the equation anymore. Peak will be a geological thing not a price thing. Sure we could see a lot of companies go bankrupt and cease operations due to low oil price. There will be a dip in production. Then the Fed will nationalize these fields and produce it at a loss if need be.
Capitalism isn’t going to make that oil flow at $140. Mainly because we don’t have true capitalism where things are allowed to fail. Or even allowed to run their natural coarse like oil price. Shit i can already imagine the tweets from the white house if price even gets to $80.
Interesting observation .I am saving this post for the future .Tks ,HHH . Your correlation of oil price to oil/dollar relationship is an out of the box observation .Always interesting .
Only thing is government can’t produce oil like crazy like now. They’ll have time lines, etas, some corruption(big buddy gets contracts), burocracy – like every big state oil company world wide. They won’t pay double price for fracking trucks, as in a fracking boom, too.
So they’ll produce, but not with these crazy growth rates. Propably much less than today, but perhaps even without much loss. Simply because they won’t pay oil boom moon prices anywhere.
Think more Statoil then, less Texas oil boom small company.
HHH,
It will be both geology and economics that will determine the peak. Currency values are relative. Other central banks will respond with easing as well. An expansion of the money supply does very little at the extreme, the velocity of money just shrinks as balances sit in the bank.
Tweets from the white house produce very little oil and will have little effect on long term oil prices.
Talk to an oil producer and they will explain that higher oil prices will lead to higher profits ceteris paribus.
Velocity of money for US MZM Money stock.
On no failures, there has been considerable bankruptcy activity.
Haynes and Boone has monitored the number of North American oil and gas producer bankruptcies since 2015. After the initial wave in the first two years of more than 100 bankruptcy filings (2015-2016), the number of filings decreased substantially in 2017 and 2018 (24 bankruptcy filings in 2017 and 28 in 2018). So far this year, however, there has been an uptick in the number of filings, (33 bankruptcy filings as of September 30, 2019, with 27 filings since the beginning of May). Over the entire period, 199 producers have filed for bankruptcy since Haynes and Boone’s Oil Patch Bankruptcy Monitor began tabulating E&P filings, involving approximately $108.9 billion in aggregate debt.
https://www.haynesboone.com/-/media/Files/Energy_Bankruptcy_Reports/Oil_Patch_Bankruptcy_Monitor
So you are thinking this was handled better in 1929-1933 compared to 2008-2011?
I would disagree. 🙂
Great post Ovi. The non opec less us sure looks like an undulating plateau.
Thanks
It will be interesting to see where it ends up in December. Will give an idea if the estimated decline rates are close or miles off.
Either way it doesn’t matter. We are having a great dialogue that might lead to better insight.
[…] Original post […]
On the opec side, Iran will not be isolated forever. That’s another 2m barrels when back online….
On non-OPEC decliners, I took a quick look at non-OPEC nations that had lower output in August 2019 compared to Jan 2005 and got 49 nations (Ovi may have chosen a different start date or end date to determine decline). From 1994 to 2019 those 49 nations combined C+C output is in the chart below.
From Jan 2005 to August 2019 the annual decline rate is 470 kb/d, and from Jan 2013 to August 2019 the annual decline rate was 277 kb/d. Also from Jan 2005 to August 2019 all of the increase in non-OPEC C+C output was from US and Canada (top two increasing non-OPEC producers over that period).
Wow great chart, peak happens at $10 barrel oil, and goes south as oil price skyrocketed over the following decade, strongly suggesting geology is key in these declines.
And global peak crude oil export was in 2005, I believe.
Has that changed?
Stephen,
It is geology and economics, each region competes with other regions for capital to develop resources, these declining regions lost that battle with regions where resources were more profitable to produce, part of the story is geophysics and part is economics, this is the case everywhere and at all times, it cannot be reduced to one thing, the World (or reality) is never that simple.
Dennis
My decline data starts in January 2010. It is interesting to note that the decline started in 2004 even as oil prices were heading for $145 in July 2008. Interesting that the average decline rate from 2005 to August 19 is 470 kb/d, darn close to my average 500 kb/d mentioned above. Also the average decline rate from 2004 to 2014 is close to 600 kb/d, even though the price of oil went through a few extremes doing that period. Not sure why the decline rate slows after 2014, since this a low oil price period. Maybe a better explanation is technology. Conventional oil fields migrating from vertical drilling to horizontal drilling?
Ovi,
For most oil projects (with the exception of tight oil) there is about a 5 year lag between decision to proceed with a project and first output. So the high oil prices for most of the period from 2007 to 2014 would have affected output from 2012 to 2019. The low oil prices starting in 2015 will hit in 2020 and thus steeper decline rates might occur from 2020 to 2025. From Jan 2005 to Dec 2012 the decline rate for the non-OPEC decliner group of 49 nations (based on Jan 2005 to Aug 2019 decline) was 599 kb/d. It is possible we might see this rate over the 2017 to 2024 period, if my guess at the lag in investment in non-tight oil resources, proves correct.
In short, your estimate may be correct and your guess that it might be conservative may also be correct.
On the technology idea, it is not clear there has been a technology shift in the period we are talking about (with the exception of tight oil.) Tight oil is very short cycle and very different for other types of resource development (particularly deep water offshore).
The sudden growth in Brazil’s production surprised me. If they manage to expand production further, this could push the peak into the future.
All the other things are the variables largely discussed here:
What’s going on in SA?
When US-production is going to flatten out?
How big is the global decline rate?
When will the sanctions against Iran be lifted (and the economical and political pressure against Venezuela)?
Wins and losses could easily wipe each other out – or one side could be winning. So many economical, political and geological uncertainties!
Westtexasfanclup,
Agree, there is much uncertainty.
Hickory,
Concern over net exports has been reduced as US net imports decreased from about 10 Mb/d in 2005 to 4324 kb/d in the most recent 12 months. This has taken considerable pressure off the World oil export market.
Friend , I disagree .Losses will wipe out the wins . Why ?
1. KSA will continue to be unstable and continue to tell lies . For lies you confirm with the boss Ron .
2 . US production not only flattens out but falls in 2020 . The fraud of shale is over .
3 . Global decline rate median will be 5% . Best estimate or guess ,take it any way .
4. Iran sanctions are not having any effect . They sell thru the black market . They mastered the art with about 40 years of sanctions . Sanctions only make selling difficult but not impossible .
5 .Venezuela is never coming back . They will produce until they can and then the party is over . Equipment is dead ,manpower has immigrated ,there is only stuff to salvage .
So now tell me where are the uncertainties .
holeinhead,
All of your “facts” are guesses that are highly uncertain.
Eventually oil will peak. My guess is 2025+/-2.
As Mark Twain said ^ There are only two certainties , taxes and death ^. 😉
Not totally sure about death 😉
holeinhead,
On Venezuela, never is a very long time, I expect output will remain low until 2030, perhaps longer, at this point Venezuela is producing about 700 kb/d, it might continue to decrease until democracy is restored in Venezuela, or a more competent leader is “elected” under the current system.
Saudi Arabia is likely to continue to produce at around 9 to 10 Mb/d, unless a major war erupts in the Middle east. Yes some older fields will decline while new fields will be developed.
Oil prices will rise and US tight oil will continue to grow through 2026 (where I expect the peak).
Little evidence that Iranian output has not decreased due to sanctions.
In short I disagree with 4 of your 5 points and sort of agree with number 5 at least for the next 5 to 10 years, I doubt Venezuala will have much effect on the timing of the peak, in my World Models I expect modest increases in Venezuelan output after 2030 when I hope the political situation will have improved.
I guess we have to wait it out to see who is correct .
holeinhead,
Only one of us has made a prediction. What is yours?
Is it peak in 2019, 2020? If so we won’t need to wait long. 🙂
Even my 2024-2026 best guess for a peak in World C+C is only a few years away.
If I were a betting man, the best bet would be against both of our predictions. If the bet was will the peak be after 2021, I would take that bet on the side of after 2021. Note that I define the peak of World C+C output with respect to the centered 12 month average as reported by EIA.
Denise for me the ^peak^ was when the black goo peaked . If I recall it was in 2005 . After that the definition of oil was changed to include NGL,NGPL,bio fuels and stupid refinery gains . This expansion of the definition means tomorrow we will add used cooking oil ,used frying oil and maybe also hair oil to extend the peak . Anyway for me the peak is unimportant ,what is important is affordability . If it is unaffordable then it is the peak . In my point of view we are already past peak even for ^ all liquids^ when you have to produce shale oil at $ 70(I trust Mike and SS more than the MSM) and sell it at $40-50 at the well head then the party is over . Affordability is the key and not the ^peak^ . At least that is the way I see it .
Holeinhead,
EIA reports World C+C output (which excludes NGL, biofuels, refinery gains, GTL, and CTL. The peak for World C+C was in Dec 2018 for the centered 12 month average, but this is likely to be surpassed by the end of 2020 in my opinion.
As to peak affordability, that was probably 1969, but your measure of “peak oil” is a bit unusual at least from my perspective as “affordability” is more difficult to measure than barrels of output.
I like to keep it simple. 🙂
Data from
https://www.eia.gov/beta/international/data/browser/#/?pa=00000000000000000000000000000000002&f=M&c=00000000000000000000000000000000000000000000000001&tl_id=5-M&vs=INTL.57-1-WORL-TBPD.M&cy=199401&vo=0&v=T&start=197301&end=201909
Oh,it is so simple . The world can^t afford $70 oil so to buy it they took on debt .If you got to have oil then you got to have oil .Frack it at $70 and sell it at $50 . Nothing can be simpler .;-)
Holeinhead,
Oil consumption is a very small part of total expenditures in the World economy, especially since oil prices dropped by a factor of 2 from 2014 to 2015.
An alternative explanation for expanding debt is simply better access to credit by more citizens of the World as the World has become more developed. Total World debt has expanded from 200% of GDP to 250% and has stabilized at that level. At some point Governments will need to reduce debt levels by either raising taxes or reducing government expenditures (or both) during periods when unemployment levels are low.
Such fiscal responsibility is not very fashionable, but will be necessary.
hole in the head- global demand includes the farmer in India, the bus driver in Nigeria, the Fed Ex truck in Cleveland, etc. They all can afford oil perhaps twice as expensive as it is now. Its cheap for what you get. People will divert money from other expenditures to keep buying such inexpensive energy.
Horsepower. Imagine how much more expensive horse power would be to achieve the same work. Almost 8 billion people now. Most use oil.
And will compete hard for it.
I will dismantle your argument .
1. The Indian farmer is broke . 35 farmers commit suicide EVERYDAY because they have no income ,I repeat ,Nada,Nulla. He cannot buy food where is he going to buy diesel .Unaffordable at any price .
2.The Nigerian truck driver is equally broke . He drives the truck with pilfred oil from the pipeline.Unaffordable at market price .
3.Fed ex man is driving his truck ,thanks to the QE and now the NOT QE policy of the FED . Otherwise unaffordable .
You say they could buy it if it was priced two times . What are you smoking ? At $130 a barrel India would run out of dollars in 45 days and then what ? Imagine this for countries like Pakistan,Thailand,Phillipines etc .All would go bankrupt.
I agree that it is cheap for what you get , but what is cheap when you are bankrupt ? What expenditure is there to divert from if you are committing suicide because you have no food . My guru said ^ Gold at $2000 is a bargain if you have the money and gold at $ 2 is a waste of time if you are bankrupt ^ . Financialisation of oil has distorted the price . At $ 65 oil is unaffordable,so to cover our butt we go into debt .Keep it simple ,like Denise said .
P.S : There are no volunteers for starvation .So how many horsepower a gallon of diesel deliver is immaterial for someone who is going into his field to mix some pesticide with water and drink it to end his life .
Denise,you are correct that oil consumption is just a small part of the total world’s expenditure . The human heart is 350 gms .How about shutting that off and see what happens to a 80 kg human? What matters is not oil consumption but what wonders oil consumption permits mankind to do . Tongue in cheek ,5mg of Viagra does wonders.So to that extent you are incorrect . What matters besides other things is criticality .Oil is critical for the modern civilisation to run . Put a drop of oil less on a wheel bearing and the wheel stops turning,and so does your $70000 Tesla .
As to expanding debt/credit take your choice , the GFC of 2008 put the world in a coma . It took $ 16 trillion in printed money to get it out of the ICU . It has been muddling and wobbling from then (I talk about the real economy and not wall street)and continues to do so .The financial world is again in trouble as is evidenced by the repo crisis only this time it double the last crisis . So now another dose of money printing .Yes some money from the QE trickled down to mainstreet but 99% went to the 1%.
As to bringing govt expenditure down and raising taxes , that is a pipe dream.Try winning an election with that as your theme . I challenge any politician in the world.
No, what will happen is that they will continue printing money until they print(by the way printing money is debt and not wealth) so much that the financial
itself breaks under it^s weight . Then TSHTF .
For me QE is not a moral issue because the other alternative was to crash the system in 2008 . With QE we bought society another 12 years of survival . I was 60 when GFC 2008 happened and am 72 today . I pray they can keep kicking the can down the road because when the road runs out society will face an abyss .I understand that QE is unfair to society as leads to inequality , but this is a TINA issue .
Holeinhead,
World economy did fine from 2011 to 2014 when Brent oil price averaged about $110/b0 in 2018 US$.
There are lots of politicians that run on fiscal responsibility, and others that run on more equitable income distribution. If they get together and figure out a compromise taxes can be raised on the wealthy to get a more equitable income distribution, things went downhill in the US with Reagan tax cuts and it has continued to get worse, go back to 1965 US tax brackets (adjusted for inflation) and put inflation adjustment for the brackets into the tax law. In addition remove all tax loopholes and no special treatment for capital gains or dividends (treated the same as interest and wages), the double taxation argument could be eliminated by eliminating corporate taxes (might get some conservatives on board).
Denise,just the reply I anticipated . Yesterday is not today and today is not tomorrow . You are living in the past . Oil at $110 .BO was ok in 2011 when China was growing at 11% and India at 9% + a lot of cement was being poured all over the Gulf and KSA . Germany was going gung ho shipping 10 million cars to PRC . Australia was shipping iron ore and coal and things were pretty honky dory . We are now entering 2020 . This is a new world ,
China officially says it^s growth rate is 6%. India says it is 4.5% while their own chief economic adviser says it is 2.5% . All business in India is at a shutdown stage due to protests since 12th Dec . So this quarter it will be zero percent . 1243 corporate surrendered their certificate of incorporation in this quarter because they were tired of loosing money . Rate of interest on business loans is 10.5% and net earnings after paying taxes are 6.15% . All dead beats . This is not where the story ends . Boeing is now officially a zombie company . The trade war between South Korea and Japan has hit both economies . Japan is trying QE for the 10x infinity time. KSA has to raise money from the market to cover its deficit . Pouring of cement in the Gulf region (except Doha because of the world cup 2022) is over .Europe and UK are suffering from brexit sclerosis . The US is doing a NOT QE ( what the hell is that) and is going to run a $1 TRILLION deficit per year as far as the eye can see . By 2024 all tax revenues will be taken away by Medicaid and Medicare (HT Karl Denniger, who we know is a PO denier ).
As to the solutions you have suggested , my advice is please stop living in la la land . What you have suggested will never happen ,so get real . We are in for a real tough time .
Now that I have made my point I like to appreciate the hard work you and Ron are doing to keep this forum running . Both be well .
P.S : I forecast that by June 2020 India will be Zimbabwe . Food inflation is now 10.7% and CPI 7.5% . Onions retail for $2.75 kg,milk at $ 1.00 per litre . Unemployment is at a 45 year high ,and youth unemployment is frightening 55%.
World real GDP growth has certainly slowed, from 3% per year from 1980 to 2008 to 2.73% from 2010 to 2018, over the 1980 to 2018 period the average growth rate in real GDP was 2.92% per year. Perhaps the rate of growth will slow further, the future is not known, we can only speculate. IMF predicts about 2.7% growth from 2018 to 2024, but they are often wrong.
I agree my solutions are unlikely to be enacted. There are places with far greater equity than the US due in part to governmental policy. So the point is that there are different approaches. I am not under the illusion we live in a perfect world, only that there are often solutions to problems and all that is needed to enact those solutions is political will.
Things sometimes move in a positive direction, other times they do not and the future direction is not possible to predict, perhaps your vision of the future is correct or perhaps mine is, the most likely outcome is that neither of us will be correct in my opinion.
Denise ,experience shows that if their are two rumors in the office grapevine , one being that all workers are going to get a 10 % bonus and the second being that 10% of the workforce is going to get fired then take it from me that rumor number two has a higher probability of occurring . You can stick to your line of optimism and are welcome to it but I stick around with the real world . By the way I am not a pessimist , just a ^ disappointed optimist ^ .;-). We all love John Lennon and his greatest hit ^Imagine^ . Well that is what it turns out to be just imagination ,far away from reality .
holeinhead,
In my experience, reality typically falls between the expectations of optimists and pessimists.
In every best guess scenario that I have ever produced, reality proved to be lower output than what I had expected.
So despite your view that I am always too optimistic (where we will say higher output is the optimistic view, though from the perspective of environmental degradation it would be pessimistic), historically the reverse is true.
I will agree that we do not agree.
Interesting that your experience is the worst case scenario has always proven correct, my experience is different, typically a random mix of good stuff and bad stuff. Perhaps you focus on the negative and that affects your World view, no idea, different perspectives makes things interesting from where I sit.
Is there any update on saudi stock levels out yet? I would find it interesting to see if there are any evidence on draw downs in stock after the attack.
Chevron Vs. Occidental: A Tale Of Two Shale Frackers
Mr. Wirth said Chevron must be selective about its investments moving forward, focusing on oil-rich regions like the Permian Basin in West Texas and New Mexico. – WSJ
“Most of the current production is located in areas where the formation thickness is greater than 50 feet.” – EIA
Well, that just makes sense! But, as you look at the map of the Marcellus, one thing that strikes you is… those areas are concentrated in just a few areas, that some call the “Sweet Spots,” of the play.
The Marcellus exhibits several different pressure regimes across the Appalachian basin. Generally, the Marcellus is under-pressured to the southwest and normal-pressured to potentially over-pressured to the northeast, with a transitional area in between. Likely, the highest ultimate recoveries will be from the normal to over-pressured areas. The presence of these distinct pressure regimes and variations in lithology requires different approaches to well stimulation and completion (Zagorski et al., 2012). – EIA
CVX got sold a pig in a poke. It got “city-slickered.” Its position in the Marcellus consists of:
Gas-prone reservoirs at a time when gas prices are very low.
Low pressure regimes that add to the costs of production.
Poor thickness of reservoir rock.
Thermal maturities that yield mostly gas vis a vis oil, or is not productive at all.
One of things that having such huge vertical pay does is enable optimization of well construction to ensure higher reservoir drainage
because of the incredible position it has built in the Permian through the Anadarko acquisition.
The future of shale belongs largely to the Super Majors in my opinion, and I include OXY in that category now. The chart below shows that it picked some of the best rock available in the Anadarko purchase.
https://seekingalpha.com/article/4312655-chevron-vs-occidental-tale-of-two-shale-frackers
Thanks for this very interesting article, I believed the main challange for US shale was change in rock quality as resukt in Thiere 1 -6 wells, but suddenly I learn there is more …. ” the “thermally over-mature” area. What this will all boil down to is that the acreage will not be productive.”. You might drill in an Area that supoosed to be oil but what you get is mostely gaz you need to pay to get rid off. I highly respect Engineers, oil pioneers , investors that decades after decades try to find ways to get up this values in the ground , most pepole would give up a long time ago as they refuse to lost more money…
Another perspective on non-OPEC nations with declining C+C output from Jan 2005 to August 2019 (49 nations). Generally terminal decline is modeled as exponential decline at some constant rate after an initial hyperbolic decline over the early history of a well’s production profile. With that in mind, if we take the natural log of the combined C+C output of the 49 nations with declining C+C output we can find the average exponential decline rate over the Jan 2004 to Aug 2019 period. It is 4%. This seems to be a better way to estimate than assuming linear decline. If we talked to oil producers, they might agree that assuming exponential decline might be a better estimate than linear decline. Maybe petroleum engineers or others in the industry could comment.
This is a good example of subdivide (in this case by country) to find a stable pattern and then project.
Dennis
That looks really good and possibly makes some physical sense. It is great to see that it gives the same number as in the original post above.
“Using a midpoint output level of 14,500 kb/d/yr in October 2016 as a reference point, and the higher decline rate, the yearly decline for these Non-OPEC countries is 4%.”
What is surprising is that it is confirming the higher decline rate. Remember that according to the article I referenced, we need to add 2% to 3% to this managed decline rate to get the natural decline rate.
Ovi,
Agreed. Great post!
Dennis,
This maybe a silly question, but has anyone tried to model oil production using ARMA?
Iron Mike,
I have not seen it, but that does not mean it is not out there somewhere.
!Crystal Ball Time! “The 10 Most Important Oil Market Trends For 2020”
https://www.zerohedge.com/energy/10-most-important-oil-market-trends-2020
New US tight oil estimates are out. For past 35 months the average annual increase has been about 1387 kb/d for US tight oil output (using slope of linear trend line.)
Data at https://www.eia.gov/energyexplained/oil-and-petroleum-products/data/US-tight-oil-production.xlsx
For US tight oil the rate of increase in output changed from year to year over the Jan 2017 to Nov 2019 period. Fitting a linear trend line to tight oil output data for each of these years we find the following annual rates of increase (2019 is based on 11 months):
2017, 1349 kb/d
2018, 1848 kb/d
2019, 1124 kb/d
Average oil price for these years (WTI) with 2019 only through the end of November was
2017, $50.83/bo
2018, $65.02/bo
2019, $56.67/bo
The rising prices in 2018 vs 2017 led to a rapid rise in completion rates and a faster increase in output compared to 2017, the drop in oil prices in 2019 vs 2018 led a slow down in the rate of increase in completion rates so the rate of increase in output fell relative to 2018.
In 2018 the average completion rate in the tight oil plays increased by 25% over the average 2017 tight oil well completion rate, in November 2019 the average tight oil well completion rate for the previous 12 months increased by only 8.2% over the average completion rate of the previous 12 months. Comparing Nov 2019 to Nov 2018, the average completion rate had increased by 88 wells in Nov 2019 vs 230 wells in Nov 2018. This slow down in the rate of increase in completion rate in 2019 compared to 2018 is the reason tight oil output has grown more slowly, the slower rate of increase is likely influenced by the lower level of oil prices in 2019 compared to 2018.
Brazil has just announce that their crude output finally exceeded 3 Mb/d, actually 3.09 Mb/d in November. New data points are in Red.
http://www.xinhuanet.com/english/2019-12/24/c_138654305.htm
Seasons Greetings to everyone.
Ovi,
You had mentioned different estimates for Canadian output from NRC and EIA. I believe Canada counts pentanes plus from NGL plants as a part of C+C, in the US only “lease condensate” is counted as a part of C+C. Note that the Canadian way of counting makes more physical sense as there is chemically no difference between condensate produced in an NGL plant and that occurring in the oil field as liquids condense from natural gas produced as it cools after coming to the surface. This is just the way the United States has always done its statistics and it probably will not change. US production of pentanes plus from NGPL (natural gas plant liquids) in 2018 was about 500 kb/d, this output is not included in the C+C output figures in the US, but I believe in Canada it would be counted as a part of C+C output.
Dennis
I think the gap between the EIA and CER is too big to be accounted for by pentanes alone. The gap is typically between 300 kb/d and 400 kb/d. Here is a quote from the URL below.
In August 2018, production of condensate and pentanes plus in western Canada reached an all-time high of 414 thousand barrels per day (Mb/d); 35 per cent higher than August of the previous year.
“Production in September fell to 401 Mb/d, 1.5 per cent below August (Figure 1). Condensate and pentanes plus production averaged 379 Mb/d during the first 9 months of 2018”
You probably are right that Canada includes pentane in their C+C, but it does not appear to be a enough to account for the gap.
https://energi.media/canada/western-canadian-condensate-pentanes-plus-output-hits-all-time-high/
I have another theory that I have not tried to substantiate. I think it has to do with the energy content of Bitumen vs Crude oil. Attached are two pictures that explain my thinking.
The first one is taken from the reports I sent you on the company COS. Notice the last line where it compares volumes of bitumen with the final product SCO. The volume reduction from Bitumen to SCO is 17.5%. The second picture shows the volume of Bitumen produced at the end of 2017. Looking at the chart, it appears to be close to 1,750 kb/d. 17.5% of that bitumen volume is slightly over 300 kb/d, which is in the range of the gap. Not sure how much bitumen production has increased from the end 2017 to mid 2019. The chart data shown is for 2019.
I think that the EIA gets separate data from the CER for the bitumen and crude and reduces the bitumen volume say some agreed percentage.
Bitumen production
Ovi,
I wonder how the bitumen gets reported, it usually is combined with naptha so it will flow in pipelines, perhaps the difference is removing this component.
I compared CAPP data (June 2019) with EIA annual data for C+C from 2010 to 2018 and the difference in the estimates is shown in the chart below.
Dennis
I take back my above theory. I am forwarding you the spreadsheet from CER. The top is light crude production. The next part is upgraded Bitumen, so my 17.5% has been removed. Next is C5 + Condensate. These two combined are deemed to be light crude.
We need to look at this off line and get back to our viewers if we figure it out.
Dennis and I now think that that EIA only takes a fraction of the Cdn Condensate output because Canada includes some components of NGPLs in Cdn condensate. We will continue to track the gap to asses the consistency.
Yes Ovi and I reached very similar conclusions independently, though Ovi did most of the work and did a better analysis, so the credit goes to him.
Really was a team effort.
Merry Christmas
Thanks Ron, Dennis, Ovi, and the rest for such a wonderfully informative and enjoyable website/blog.
Survivalist,
Thanks. Happy Holidays to everyone.
Survivalist
Thanks
Interesting article from Rigzone
https://www.rigzone.com/news/is_the_us_shale_boom_really_about_to_end-26-dec-2019-160635-article/?pgNum=0
My Guess for 2020 is investors/owners of the Majours like Exxon, Chevron will require increased return on their investments from thoose Companies and so far we know from their ballance sheet the return from a increasing investment in US shale have been low, very low. This is similar exsperiance as Equinor had in EF, actualy I doubt they earned 1 dollar considdered the write down of EF assets and price they obtain to get rid of it. Oil price will be very important for the outcome of the majours shale investments, if remain WTI 55-65 , combined with low gaz prizes they need to see huge losses shale investment need to be cover up with profit from global oil and gaz buisiness like Guyana and they might need to borrow to pay dividend. This will not be actions that increase value of the owners and resistant will increase, stocks will be sold and invested in other Companies…
Re: Libya
I’ve read headlines that Turkey’s Erdogan is close to deploying troops to Libya to fight rebels/Haftar, who are themselves supported by Egypt. Turkey vs Egypt could be hotting things up soon.
Things are interesting in this former richest country in Africa.
feedback loops—–
Survivalist,
I’d just read up a bit on this.
Egypt and the UAE have been supporting Haftar right along. Russian snipers are now part of what are being called mercenaries and are being effective near Tripoli.
Erdogan did announce that Turkey has just been asked to provide land and aerial support to the government in Tripoli (the government recognized internationally) and Turkey will do so. Erdogan says legislation will be introduced for the purpose in January.
Turkey and Libya have signed agreements on boundaries in the Eastern Mediterranean that would pretty much give Turkey control over the sea between the two countries. This is consistent with Erdogan’s effort to control access to natural gas around Cyprus, which has brought objection from Cyprus, Greece, the EU and maybe soon Syria and Lebanon and Israel.
They don’t call him The Sultan for nothing.
Some folks have alleged that Egypt and Turkey would unite behind KSA to fight Iran, because they’re all Sunni or something. I’m afraid Political Islam is a bit more complicated than that. The Sunni’s are not exactly a homogeneous organization. Libya is a great example of why.
Survivalist,
Turkey and Iran have got along well for quite a while. They have some strong commercial links.
For example the link forged by the Mughal Empire, basically Turks who preferred to speak Persian, who conquered India in the 16th century.
Another thing is that Turks are Turks, and Iranians are Persians, both being basically Central Asians, and neither one being Arabs. It may seem like all the same folks from a distance, but that’s not the way the locals see it at all.
Anyone else notice franc spreads absolutely plummet to 290 (-30), surely this is set to play out in upcoming production. Right at the time when legacy decline is coming into full force we have drilling, completions and frac spreads falling. Perfect storm heading into 2020
https://twitter.com/primaryvision?lang=en
Yep. Frac spreads down 30 to 290. We should see declining lower 48 production pretty soon as there is a 2-3 month lag from spread to production, and we crossed 400 in August. There may be some seasonal effect in this weeks drop, although last year the final report was a decline of 8 spreads.
If the spread count stays at 290 for awhile we will see production plummet.
has anyone done research on how many wells on average each frac spread completes each month – from here an estimate can be made as to average well production of each well frac’d – as we are down ~175 frac spreads since July – assuming they complete one well a month and average production is 500 bopd thats 87,500bopd/month of growth which is no longer coming on line ……
Any research done on how many spreads need to be active to simply retain production at the current level ….
Jack.
I do not have access to the frac data it is proprietary. Completion data is available from EIA, looks like for Nov 2019 the completions per frac spread was about 3.5.
Most of us focus on tight oil (or at least I do), the frac spread count is for all frac spreads nationwide, both those that are used for shale gas as well as those used for tight oil wells. The proprietary data probably breaks it out.
Potentially the drop in frac spreads was those employed in the shale gas sector, we do not have enough information to make a judgement.
dclonghorn,
Do you know the split between frac spreads employed in completing tight oil wells vs those employed in shale gas well completions? Seems without that information we do not know what is really going on.
Seems number of shale gas completions has decreased, my understanding is that the average lateral length tens to be longer for shale gas wells so they may require more time per frac spread to complete, I am not sure as I am not an industry insider.
Following chart uses completion data from
https://www.eia.gov/petroleum/drilling/xls/duc-data.xlsx
At following page
https://www.eia.gov/petroleum/drilling/
Dennis, Sorry I don’t have any info on the breakout of frac spreads by gas or oil. They probably provide that past the paywall. Baker Hughes shows over 84% of rigs are drilling for oil, so I suspect a similar percent of spreads are oil focused.
With overall spreads down almost 40% over the last year, I doubt the skew in the reduction was much higher for gas than oil.
Dclonghorn,
Completion rate for natural gas wells decreased by 33% from recent peak. Tight oil completions have decreased by 8% from recent peak. It is possible more of the decrease in frac spreads is in the natural gas sector, but without data this is speculation.
Dennis, according to frac focus, the overall US frac spread count is 290 now and was at a high of 482 on 4/5/19. That’s right at a 40% decline peak to current. I do not know where you are getting your completion data, but if you say current tight oil completions are only down 8%, then either your data or frac focus is obviously bogus. There simply are not enough gas wells to make more than a small difference in oil completions. Would you care to disclose the source of your allegation that tight oil completions are only down 8%.
dclonghorn,
See
https://www.eia.gov/petroleum/drilling/xls/duc-data.xlsx
I take my completion data from the DUC spreadsheet linked above.
I assume most of the frac spreads are used either in tight oil or shale gas plays. The shale gas completions are based on Appalachia and Haynesville completions and tight oil completions are based on completions in Permian, Bakken, Eagle Ford, Niobrara, and Anadarko basins. For shale gas the completions were 203 in April 2019 and 147 in Nov 2019, for tight oil peak completions were in August 2019 at 1239 and the completions had fallen to 1158 in Nov 2019. 1239/11158=1.07, so it is about a 7% decrease in tight oil completions. November completions would correspond to the August frac spread count. You have to click the links to get the data.
The data in the chart above comes directly from the DUC spreadsheet (which includes completion data). The average frac spread count in August was 411. The December frac spread count will be reflected in completion data in March. The completion data does not line up very well with the frac spread count, perhaps there were excess frac spreads at the peak that were not operating very efficiently and the less productive equipment has been stacked or scrapped. Without better data we can only speculate.
If we assume a three month lag between frac spread count and completions, then the June to November completion to frac spread ratio stayed the same at 2.92 completions per frac spread. The average frac spread in Dec fell to 319.5 (4 week average), about 22% lower than August 2019. It will be interesting to see if we see a sharp drop in completions in February or March 2020.
Another big fall in frac spreads
The Primary Vision Frac Spread Count is 290 for the week ending December 27th, 2019.
@PrimaryVision
Hasn’t been this low since mid 2017 – certainly don’t hear the implications in the MSM – anyone worked out on average how many BOPD reducing the franc spread ~170 odd would impact assuming the spreads were all in use. I trust if spreads remain or fall from this level the drop off in production will be rapid and not seen before, not only is the legacy decline substantially higher than mid 2017 but also the pace of decline in franc spreads so quickly has not been seen before i.e. loss of 170 spreads in less than 6 months
Maybe US oil production peaked last month
Alternative scenario for Jan 2019 to Dec 2020 and STEO from Jan 2019 and Dec 2019 shown for comparison. Increase in average annual output from 2019 (12.21 Mb/d) to 2020 (13.05 Mb/d) is 839 kb/d for the “DC forecast” and the Dec 2019 to Dec 2020 increase is 280 kb/d. The forecast is simply straight line from Dec 2019 to Dec 2020 using tight oil estimates for change in output from Sept to Nov, a guess for Dec 2019 and then the Dec 2020 estimate from the STEO published Dec 2019 with straight line from Dec 19 to Dec 20. A naive forecast to be sure, but likely better than the most recent STEO which estimates output that is likely much too high for Oct to Dec 2019, in my opinion. The DC forecast also has a high probability (close to 100%) of being incorrect.
Dennis
Here are the US production numbers from the December MER.
———-L48. Alaska Total
Sept. 12,014 449 12,463
Oct.. 12,123 477 12,600
Nov.. 12,361 486 12,847
That November jump is quite large. 74 kb/d of the Oct increase, slightly more than half, is from North Dakota.
Ovi,
The EIA MER Nov crude oil production of 12.847 mbd is similar to EIA Weekly supply estimates of about 12.85 mbd. Using EIA DPR production Dec increase of 0.05 mbd gives 12.90 mbd total for Dec 2019. I guess that Dec 2019 US crude oil production will be about the same as Nov 2019.
Tony,
The October estimate from the MER looks reasonable, the November estimate does not, probably November is about 90 to 100 kb/d more than October, and December perhaps your 50 kb/d estimate is a good one.
That would put Dec 2019 production at 12.75 Mb/d roughly. I would say a continued slow increase in US output of 500 kb/d from Dec 2019 to Dec 2020 is the minimum we will see which would put output at 13.25 Mb/d in Dec 2020 fairly close to the ending number from the most recent STEO. I expect the STEO may be underestimating from June 2020 to Dec 2020 in part because they have an incorrect oil price assumption in their model. Oil prices are likely to be higher than the EIA has assumed in my opinion.
Ovi,
The MER estimates for the most recent month are simply based on weekly estimates, the estimate for October looks pretty good, they may have early access to the 914 survey data. Generally the most recent month is far from the mark because the weekly estimates are terrible, often they are high or low by 200 kb/d sometimes more than that, I simply ignore them. The month previous to the most recent month may be somewhat useful. YMMV.
I took the September numbers from EIA monthly then used the tight oil production estimates by play through November to estimate increases in output through NOV and also assumed the Nov estimate would be revised 20 kb/d lower (I think the Nov 2019 tight oil estimate is likely too high), for December I simply assumed a 70 kb/d increase, as I suggested I did a very simple straight line estimate from my Dec 2019 estimate to the Dec 2019 release of the STEO estimate for Dec 2020. I also mentioned that the probability that my estimate (or any estimate) of future US C+C output will be correct is about 0%. I would say the odds that my estimate are better than the Dec 2019 STEO are about 75% (if we did a sum of squares on the difference between actual output and the two estimates in March 2021.
I have revised the DC estimate to increase a bit from June 2020 to Dec 2020 (at 60 kb/d each month vs the original 40 kb/d each month). Revised estimate below:
Date, DC estimate, Dec 2019 STEO
Oct-19, 12.63, 12.75
Nov-19, 12.70, 12.88
Dec-19, 12.77, 12.99
Jan-20, 12.81, 13.05
Feb-20, 12.86, 13.12
Mar-20, 12.90, 13.18
Apr-20, 12.94, 13.22
May-20, 12.98, 13.25
Jun-20, 13.04, 13.19
Jul-20, 13.10, 13.13
Aug-20, 13.16, 13.11
Sep-20, 13.22, 13.18
Oct-20, 13.28, 13.13
Nov-20, 13.34, 13.30
Dec-20, 13.40, 13.28
Dennis/Tony
Your projections and the STEO agree for H2-20. I wonder if the STEO drop is strictly related to primarily GOM and Alaska summer maintenance and late summer hurricanes for the GOM. The LTO report showing Permian production up by 100 kb/d/mth for Sept, Oct and Nov is pretty amazing if true.
Looking at Enno’s August Permian number and his September post for August Permian shows a large increase
August Permian 3,534,331 from August
August Permian 3,693,082 from September
Almost 159 kb for one month.
Clearly there is something that I don’t comprehend. Falling rig counts, plummeting frac spreads and Permian up by 159 kb in one month. We need to try to get to the bottom of this.
Ovi,
Link below to a recently updated US tight oil model.
If you do not trust google docs I can email it to you directly.
By changing completion rate in row 4 (permian basin only) you can try different scenarios.
https://drive.google.com/file/d/1h3Gewc6HBhmrKJAYLwXtoxVg1QUCIOWL/view?usp=sharing
Also check out the completion rate at the EIA duc spreadsheet (it includes both DUCs and completions) at link below, to get an idea of recent completion rates and how they have changed since 2014.
https://www.eia.gov/petroleum/drilling/xls/duc-data.xlsx
The average completion rate for the past 6 months in the Permian basin has been 532 completions per month. If we assume they will drop by 10%, that would be about 480 completions per month
Chart below has a US tight oil where 479 new wells per month are completed in the Permian basin from Dec 2019 to May 2030. This scenario is not my best guess, I expect the completion rate in the Permian basin will rise from June 2020 to at least June 2028, probably to 700 to 800 completions per month at peak (which I expect around 2027). So this is a lower bound on my expectation for US tight oil output. Produced using the spreadsheet I linked above with 479 replacing 488 in cell F4 of speadsheet.
Alternative scenario similar to my best guess.
Ovi,
As I am sure you are aware (others might not be) the increase in the shaleprofile estimate from the August to Sept Permian report for August is due to the incomplete data from state agencies, as time goes by the data becomes more complete. The best estimates for recent months are the tight oil estimates by play.
Also keep in mind that shaleprofile does not include tight oil output from vertical wells, it is horizontal well output only. For the Permian basin it also excludes output from older wells that started producing before 2008/2009. This explains part of the difference between the EIA and shaleprofile estimates for the Permian basin.
Dennis
I was just surprised by the size of the one month jump from the Permian. I was expecting something around 100 kb/d, not 159 kb/d.
Tony,
Did IHS respond to your email?
Dennis
No reply yet from IHS but I’ll resend Email on Jan 6.
The aggregate employment index posted a third consecutive negative reading, dipping from -8.0 to -10.0. Also, the aggregate employee hours worked index fell from -2.4 to -7.7, signaling a further drop in employee hours. The index for aggregate wages and benefits edged up from 6.2 to 8.2.
Dallas Fed Energy Survey
https://www.dallasfed.org/research/surveys/des/2019/1904
Chart from dallas fed on oil and gas activity, the index increased last quarter from -7.4 to -4.2.
US dropped 8 oil rigs, guess there are still some DUCs left…
https://www.rigzone.com/news/us_drops_eight_oil_rigs-27-dec-2019-160671-article/
For Permian basin, the horizontal Oil rig count in chart below. 5 week centered average down about 10% from the May 2019 level (from 416 to 374, 374/416=0.899.)
Data from
https://rigcount.bakerhughes.com/na-rig-count
My question is about what Ron and Dennis have said on this blog on numerous occasions.
Ron and many others say that the decline after its begun will be fast and steep.
Dennis uses American oil production to counter that and assumes an average decline rate of 1.5% to 2 % at most.
My point is that the American oil peaked in 1973 when Enhanced Oil Recovery techniques were not yet fully matured so the decline followed a rather natural rate of 1.5- 1.8 % in absence of any attempts to reverse decline. (Of course America went into a drilling frenzy but that is not EOR)
Today EOR technology is much more mature and production will be maintained by any means necessary.
(Also oil is being extracted more and more from offshore wells which declines faster than onshore)
So does the American example hold true even today under such different scenarios?
Ravi,
I also use a model where I use a discovery model fit to historical discovery data that is projected into the future to guess at future dicoveries (anything from the future could of course be incorrect), I also use historical C+C output to see how quickly resources have been developed historically and make the simple assumption that the future will be similar to the past, I find past extraction rates of producing reserves (an output of the model based on the historical data plus assumptions) and generally assume future extraction rates will be similar to the recent extraction rates (again this assumption could be incorrect and extraction rates might be higher or lower). This model focuses on conventional oil, I use separate models for both extra heavy oil (from Canada and Venezuela) and for tight oil. Part of the basis for the extra heavy model is CAPP forecasts (updated every June) and the resource estimates by Jean Laherrere (most recently he estimated a total extra heavy URR of 210 Gb, a drop of about 290 Gb from previous estimates he had made). This mostly affects the tail after the peak as the extra heavy oil takes a while to ramp up production. The ramp up in extra heavy oil output from 2025 to 2040 in part mitigates the decline rate associated with tight oil which will be fairly rapid from 2030 to 2040. If my estimate of roughly 3000 to 3100 Gb for all types of C+C resource (conventional plus unconventional) is correct, we reach the half way point (1550 Gb) in cumulative output in 2024. Chart below has annual decline rate in World C+C output for my best guess scenario. The spike in 2041 is due to peaking of extra heavy oil at a time when tight oil decline accelerates, it is possible that by 2041 this might be less of a problem because demand for oil from land transport may have fallen, in addition World population growth might slow further by 2040 so demand growth for energy in general might have slowed.
Clearly speculation about what might occur in 2020 is likely inaccurate, speculation about 2040 is probably far from the mark.
Ron thinks the C+C resource is far smaller than my estimate so decline rates would be much higher.
Dennis,
Thanks for replying.
Does this also apply for natural gas as decline rates from gas fields can be much higher than that of oil fields? Also can EOR techniques be deployed in gas fields as well?
Ravi,
The model is for C+C only, it does not include natural gas or NGL.
Also, this is not field decline, it is World output decline rates after the peak, new wells get drilled as older wells decline, new fields get devoloped as older fields deplete, etc.
Heads up, search sucks here.
A fix.
https://www.wpbeginner.com/showcase/12-wordpress-search-plugins-to-improve-your-site-search/
Watcher,
I agree. You are the main person who has asked for this, of the different options given do you have a preference? Typically a single choice is best and I will not pay for a service so only a free option will be chosen, but if you have a preferred choice let me know.
A simple change by replacing the [NEW] with an alphabetic character or string would help. Apparently it is some sort of non-copyable graphic and so can not be searched for with the ctrl-f command.
That means I must scroll through the comments for the latest ones rather than finding them.
The issue is weeks or months or years ago. One remembers . . . perhaps, Jeffrey Brown posted a picture of typical diesel/kerosene density as a function of API and one wants to find it, and one can’t now. It was years ago. Gone.
And should not be.
Free is the priority. Any improvement bought for free is a good thing.
Needs to include comments. Probably not worth doing at all if comments are not searchable. I did not look at all the options so I don’t know what’s possible. There are options beyond that list, but a skim of another article said large amounts of memory are required for searching comments, at least for that particular search plugin. That might not be free and thus thumbs down.
I would think the Google option should maybe be the first examined because they likely use their own memory for whatever is going on. Don’t know. We may have experts here.
Ok will try Google.
If any experts would like to weigh in, I would appreciate the input, my programming/internet skills are rather limited.
As I see it you might do programming and search, use artifisial memory that will recognice certain elements you might lookibg for , but what is important is the main factor for Word oil production have significant changed trough 2019 , US shale have been transfered from a depth driven industry to a free cash driven Industry. Beside that the impact of US president for world demand, oil price is different from earlier presidents. All this might do historical data wurthless as so many important factors have changed. Also the growth off EV cars, Wind and Solar energy. But still there are some huge factors remain even what ever chabge in politics, tradewar, wars ,oil price we hace abd that is the huge challanges related to shale rock quality Tiere 1-6 abd the fact as lobg as low oil price remain very few barrels of oroduced oil will be replaced compared to the situation before 2014.
In additional there is a change where huge fundings from investors are green washed, some of this was before invested in oil and gaz.
Interesting article on the coming 2020 IMO rules regarding use of ULSD in shipping. While the headline sounds bad for the oilsands, the text paints a different picture. Industry needs heavy oil to produce diesel.
Quote from article: “Companies that own refineries or oilsands upgraders are expected to benefit as the new standards will increase demand for refined low-sulphur fuels.” Synthetic crude produced from oilsands has higher quality than WTI and is ideal for producing ULSD.
The other interesting quote is: “The impact of the new pollution rules is being softened by disruptions in the flow of competing heavy oil from Venezuela and Mexico into the U.S., as well as new petrochemical projects in Asia that need heavy oil as feedstock, he said.”
With demand increasing for heavy oil also in Asia, what will be the impact on demand and pricing for LTO.
https://globalnews.ca/news/6343041/marine-fuel-imo-2020-oilsands-canada/
For the 4 major tight oil basins (Permian, Eagle Ford, Williston, and Niobrara) the horizontal oil rig count has decreased by about 11% since May ( from 566 to 502). Data from same source as Permian chart (Baker-Hughes).
If we assume a 6 month lag from rig count changes to production changes, May 2019 should correspond with November 2019 output (which was still increasing). A four month lag would correspond with Sept 2019 output. I have heard estimates of a 4 to 6 month lag between rig count changes and output changes. I have also heard drilling has become faster so perhaps the 4 month estimate is more appropriate in 2019. If so, the current rig count would affect output in April 2019.
Actualy I dont think the Rig count have a significant impact on oil.production before the DUCs are down to a critical level, at least reduction in DUCs that is compleated vecsuse it is cheaper add a significant number of barrels to the graph. As I have understood the number of DUCS have significant higher decline rate in 2019 than the year before. Some mention the DUCs stocks exspect to reach a critical level by end of February 2020. Very interesting new year with respect to US shale production. Allso it is well known lots off ballons of liability have dead line in 2020 related to US shale Companies
Another pipeline issue – Mariner East 2. Is this for increased domestic use or export?
https://theintercept.com/2019/12/08/energy-transfer-tigerswan-bribery-conspiracy-charges/
Compared to natural gas in terms of “not in my backyard” issues, renewable energy is starting to sound like a lot lower of an impact. There’s a part in the article where a guy is told by armed security that literally can’t sit on his neighbor’s front lawn, even though his neighbor granted permission and it wasn’t part of an easement.
The Wall Street Journal:
As Shale Wells Age, Gap Between Forecasts and Performance Grows
The early promises of blockbuster shale wells that many fracking companies made to investors are looking even more suspect as the wells age.
For years, frackers touted estimates of how much oil and gas their wells would produce as they sought to raise capital and entice shareholders. Many of those estimates are falling short.
Behind a paywall and that’s all I could read without a subscription.
By Rebecca Elliott and Christopher M. Matthews | Graphics by Ellie Zhu and Luis Santiago
The early promises of blockbuster shale wells that many fracking companies made to investors are looking even more suspect as the wells age.
For years, frackers touted estimates of how much oil and gas their wells would produce as they sought to raise capital and entice shareholders. Many of those estimates are falling short.
Whiting Petroleum Corp. is among the companies that made what now appear to have been overly optimistic forecasts.
In February 2015, Whiting told investors that it expected the wells it drilled that year in North Dakota to produce 700,000 barrels of oil and gas apiece over their lifetimes. In 2018, Rystad estimated those wells were on track to produce only about 590,000 barrels. Rystad has since revised that forecast to about 540,000 barrels, or roughly 23% less oil and gas than Whiting projected.
Whiting declined to comment, but Chief Executive Bradley Holly said in 2018 that the company was de-emphasizing production forecasts.
In October 2016, Encana Corp. estimated that its wells in the Eagle Ford shale of South Texas ultimately would produce about 580,000 barrels of oil and gas each. Rystad’s initial estimate showed Encana’s Eagle Ford wells from that year on track to generate less than 360,000 barrels. Rystad’s forecast has since dropped to about 345,000 barrels of oil and gas, roughly 41% less than Encana told investors.
Encana declined to comment.
Some companies have said their methodology differs from Rystad’s, making the forecasts incomparable. For example, some producers include oil and gas byproducts, such as ethane, when calculating their forecasts. Rystad doesn’t include those hydrocarbons in its analysis because they aren’t accurately captured in available public data.
Fracking’s widening projection gap means companies likely will have to spend more and pump faster to maintain output. It also calls into question whether the pricey drilling leases many companies acquired earlier this decade at the height of the shale boom will ever pay off.
Even some of fracking’s pioneers are beginning to have doubts. Mark Papa turned EOG Resources Inc. into one of the largest shale companies in the U.S. Now the CEO of a smaller shale company, Centennial Resource Development Inc., Mr. Papa believes shale production, which turned the U.S. into the world’s top oil producer, may soon peak and then decline.
“The industry shot itself in the foot by predicting that growth in the U.S. was going to be like Jack and the Beanstalk, was going to grow to the moon,” said Mr. Papa. He believes the industry has already drilled most of its best wells.
Companies have struggled to pump as much as they predicted in part because many of them drilled wells too close together, hurting output. New wells, or child wells, drilled in proximity to older wells, or parents, also often generate far less. That is a problem because most planned new wells will be drilled close to already producing wells.
The growing evidence that shale wells are pumping less than forecast suggests it will be hard for companies to continue their breakneck growth as they head into 2020 and beyond.
Shale wells generate a lot of oil and gas early on, but trail off quickly. Were it not for new wells that began producing in 2019, output in the Permian Basin of Texas and New Mexico would have declined by about 40% this year, according to energy analytics firm IHS Markit.
Wall Street is backing away from the industry over poor financial performance. That is forcing companies to slow down and pushing some smaller operators into bankruptcy.
Already, U.S. oil-production growth is moderating, and the economies of oil-producing regions softening. By 2021, IHS expects domestic oil output to level off.
–Bradley Olson contributed to this article.
Thanks, Greenbub, this is the most interesting article I have read on the shale oil patch in months. It looks like almost every shale prediction by the EIA, IEA, and one particular contributor to this blog, are way overly optimistic. 😉
Hi Ron,
You might be referring to me. My well profiles are based on the output data from shaleprofile.com, not the overly optimistic well profiles found in investor presentations. The R squared between my Permian tight oil model and the EIA’s Permian tight oil data is about 0.999. See chart below. The only question is future completion rates. Those are difficult to predict.
A very low completion rate scenario for US tight oil, this would be the minimum output I would expect, about a 95% probability output will be higher than this scenario.
Oh my God! Permian production is going through the roof. Where do I go to invest in this skyrocketing production of the Permin? Why is everyone dumping Permian stock and banks refusing to loan? Gracious, with a profile like that everyone should be trying to get in on this boom.
Seriously Dennis, there is something drastically wrong with this picture. Why the reports like the one posted in the Wall Street Journal above? If your profile posted above is correct, someone has a very serious communication problem.
What is going on? Why the great divergence between the profile you posted and all the reports coming out of the shale oil patch? As the crook told Dirty Harry in the movie when he was wondering if he had fired six shots or five from his revolver, “Hey, I gots to know”.
Whatever happens, we’ll be able to explain it. What Dennis is typically showing is how straightforward it is to estimate total production from the number of plays and an average production profile. We were showing this back in 2013 over at TOD and elsewhere
http://theoildrum.com/node/10221
The big unknown is always the total to draw from and that’s why Dennis is providing “what if?” projections.
Dennis, what the hell is an “R squared plot”? How does that differ from a “monthly production” chart? I smell something fishy here. Why would you post an R squared plot when a monthly production chart would give a far clearer picture?
Hi Ron,
R^2 plot is when you compare a modeled projection plot to the actual data plot to see how well your model fits. Usually the higher the percentage of the R^2 value, the better the model. Dennis is basically saying his Permian tight oil model accounts for over 99% of the actual EIAs Permian tight oil production data. In other words his model is more or less spot on.
Thanks, Mike. I just plotted the Permian from the DPR data and it pretty much resembles Dennis’s data. So what is going on? Should we expect this trend to continue? Does this chart tell us anything about the future? Or should we believe all the pundits who are predicting a dramatic slowdown in Permian production? Who is correct, Dennis and the EIA or all the economists, geologists and others are predicting rough times ahead for the Permian?
I would put it this way — the model is more-or-less spot on in being able to track the data given that one knows the number of plays and the typical depletion profile per play.
This is essentially getting the accounting arithmetic of fracked oil production correct, but it says less about what the future holds.
Yet, doing the accounting is nothing to sneeze at because I doubt any person off the street would know how to do it and I don’t think the analysis is taught widely.
https://scholar.google.com/scholar?hl=en&as_sdt=0%2C24&q=+convolution+%22oil+depletion%22+hyperbolic
So the impasse in predictability power is essentially in being able to guess how much remains underground based on subtle trends and which way the economics will turn to favor further extraction.
Ron, from the little I know, the R^2 plot would not tell us anything pertinent about the future, one can extrapolate the model which i believe Dennis has done to see what happens.
To model what could possibly happen in the future for time series data such as oil production, you can use for e.g. autoregressive-moving average (arma) after you stationarize the data. Make simulation of possible paths and get the average to get an idea within a confidence interval which path the data would most likely follow. Even then you’d need to account for factors such as geology, economics, finance, even politics, which will make the modeling near impossible, if you are going long term. But it’s doable for short term BAU environments i suppose.
I honestly have no idea who is right. If i had to guess, institutions such as the EIA would do substantial modeling and projections. So if the information is not hard (quantifiable) and or verifiable by whoever they deem trustable etc. Then they would most likely ignore it.
As per usual time will tell.
Iron Mike,
I assume future wells will gradually become less productive, assume real well cost, operating costs, taxes rates and royalty rates remain what they are today (using constant 2018$). An oil price scenario is created and assumed future completion rates. Different oil price scenarios and completion rate scenarios are tried to give a range of possible outcomes, the best guess scenario is simply my estimate of the scenario with about a 50/50 chance that output will be higher or lower (an F50 scenario). The rate of decrease in new well EUR is based on the USGS mean TRR estimate and the USGS estimate for acres of prospective area in the play and estimated acres per well.
See
https://drive.google.com/file/d/1h3Gewc6HBhmrKJAYLwXtoxVg1QUCIOWL/view?usp=sharing
For a simple spreadsheet with Permian model and a fixed model (not adjustable for other plays besides the Permian).
This model is simplified and does not include the economics, a more complex spreadsheet (large 25 MB) including economics for permian at link below.
https://drive.google.com/file/d/12-pUIPJeIeUMkqNCRtiPOp1gZImzolLy/view?usp=sharing
Note that because this file is so large it does not work well in google sheets (and patience is required), for impatient people (like me) simply click on the download link at upper right part of page and use any spreadsheet program that can read excel files, this is fairly quick on a broadband connection (the download of the 25 megabyte file).
If anyone has difficulty downloading the spreadsheet contact me at [email protected]
click on chart below for larger view
Ron,
Perhaps the chart below is clearer. From Jan 2017 to Oct 2019, Permian tight oil increased at an average annual rate of 924 kb/d each year on average. For the scenario below from Jan 2020 to Dec 2025, Permian basin tight oil output increases at an average annual rate of 227 kb/d or roughly one fourth the recent rate of increase. I expect there will be a slow down in the rate of increase in 2020 and perhaps 2021. After that higher oil prices are likely to lead to faster completion rate increases than the scenario presented here (which there is perhaps a 95% probability that actual output will be higher than this scenario).
The scale of the previous chart may have made it seem that output was increasing quickly after 2020, compared to past rates of increase the rate of increase is quite moderate.
A larger chart by clicking on chart.
Dennis
So you believe that not only is today’s output sustainable for ten years but you expect a further two million barrels per day increase….that is a very big ask.
Lightsout
The scenario has very slowly rising completion rate.
It is only a big ask if oil prices do not rise in the future.
Keep in mind that is Permian basin only.
Us tight oil may peak in 2025 or 2026. At roughly 10Mbpd.
That scenario seems unlikely from my perspective.
Ron,
The scenario predicts rough times ahead for Permian with rate of increase that is 4 times lower than past 3 years.
What is your expectation for the price of oil in 2025?
What is your expectation for the price of oil in 2025?
Are you shitting me? I do not expect to be alive in 2025.
LOL
Ron,
How about Dec 2020? Are you not well? Lots of people live to 90 or even 95, especially if they have already made it to 80.
The question is, if 2018 is the final peak in C+C output as you believe, I would think you would expect oil prices to rise. There are many who believe the oil price level will be flat or down in the near future.
If one expects future oil prices for Brent to be $40/bo in 2018 US$, then an expectation that Permian oil production would fall would be sensible.
My reading of most of the press on the Permian is that future output growth will be lower than the past, my scenarios are consistent with that view.
I am quite well right now but my friends and family are dropping like flies. When a person gets my age they begin to realize that they don’t have a lot of time left.
But I am fine with that. I feel for my children and grandchildren who will likely still be alive when the shit hits the fan.
I don’t expect a huge spike in oil. I expect a bumpy plateau until 2024, then a gradually increasing decline.
Russia has already announced they will be flat at around 11.2 million barrels per day for the next four years. I will post the link and comments about that on Ovi’s next post, which I hope is today. Anyway if that is true that means Russia is at peak right now. The peak month, so far, was December 2018 at 11,408,000 bpd. Production for December 2019 was 11,262,000 bpd. I believe there is no doubt that Russia is producing flat out. They have no intention of joining Saudi Arabia with voluntary cuts.
Russian Energy Minister Alexander Novak expects Russian oil and condensate production of between 555 million tonnes and 565 million tonnes in 2020, or 11.12-11.32 million bpd using a conversion rate of 7.33 barrels per tonne of oil.
However, I do expect less oil will produce higher prices but not massively higher.
Ron
Glad you are doing well.
Ron,
The chart is EIA data and the permian model, R squared is a statistical measure which compares model and data, if they match perfectly R squared is equal to one. Essentially I find the correlation coefficient and then square it to get R squared, this is not strictly correct. The correlation coefficient (r) is 0.99966 for the model compared to EIA data from Jan 2010 to October 2019,
I assume r^2=0.99966*0.99966=0.9993. Chart below has US tight oil model and EIA data.
Notice that the model generally underestimates relative to the EIA data from 2017 to 2019.
Driller: Lend me some money for an oil well.
Banker: How much oil do you think will come out of it?
Driller: Oh, we are “de-emphasizing production forecasts”.
Banker: Sounds great! I’ve got a call on the other line, let me get back to you later about that loan.
A Problem In The Permian
1. Permian getting gassier
– As drilling slows down, Permian wells are becoming gassier. “The oil ratio is no longer sufficient to offset gas in older wells, so we’re seeing some increase in basin-wide” gas-to-oil ratios,” said Artem Abramov, head of shale research at Rystad Energy.
– In the Permian, the average well produces 2,000 cubic feet of gas for every barrel of oil. Gas is much less lucrative than oil. Later on in the lifetime of that well, the gas-to-oil ratio can climb to 5,000 cubic feet.
– The ratio grows worse when wells are drilled too close together. But the ratio is also higher in the Delaware sub-basin of the Permian, where recent drilling has been concentrated.
– The higher-than-expected gas-to-oil ratio has undercut the finances of some drillers, while also contributing to the region’s worsening flaring problem.
2. Shale equity sales plunge
– The amount of equity issued in 2019 from the shale industry fell to its lowest level in 13 years.
– “It seems to be fairly unloved as a sector,” Andy Brogan, Global Oil & Gas Sector Leader for Ernst & Young LLP, told Bloomberg.
– The value of shares issued in 2019 fell to $1.3 billion, the lowest level since 2006. In 2016, the industry issued $34 billion in shares.
– Debt issuance was flat at $44.5 billion in 2019, still at elevated levels compared to earlier this decade.
Seems the Banks, Investors dont believe much what is predicting from the shale Companies as they have bad exsperiance. The question is how much of the Shale Plays can deliver enough cash to fund new drilling to keep up production + decline. Or will the mayors still pay the bills in 2020 to prevent US shale production to decline from 2019 level.?
https://m.marketscreener.com/S-AMP-P-500-4985/news/U-S-energy-shareholders-seek-to-leave-behind-a-lost-decade-29774044/?countview=0
With 2/3 of LTO production from independents I cannot see the majors stepping up to fill the drop in activity from the independents. The majors are looking at LTO in a completely different frame than independents, gone are the days of growth at all costs – will be very interesting to see if the rebound in drilling activity with refreshed budgets is as expected – I think the majority of companies will sit on their hands in early 2020 and production revisions will go down in a big way ….
For those interested
Art Berman
Macro voices
Crude oil special
https://youtu.be/sUPat4tvyP0
The world’s most promising oilfield is in a slump. In the Permian Basin in the United States, jobs are disappearing, home prices are falling and there are fewer drilling rigs dotting the desert plains. An edict from Wall Street telling oil companies to cut spending and to increase their profits has taken its toll. Drilling and fracking is on the wane. Production continues to grow, but at a slower pace.
“The long-term prospects of the Permian remain robust,” Rene Santos, an analyst at S&P Global Platts, a consultancy, said. “Operators just need to stay away from past practices of production growth at any cost, without close consideration of shareholder returns.” Oil companies, he said, needed to return cash to shareholders and to push up their…
Rest behind paywall
https://www.thetimes.co.uk/article/era-of-making-a-quick-buck-from-the-permian-basin-is-at-a-close-wv8g2l96r
Found the rest of the article here
https://www.theaustralian.com.au/world/the-times/is-the-golden-age-of-american-shale-over/news-story/bfea8f090746545ee2a7cb9838d1840a
Oil companies, he said, needed to return cash to shareholders and to push up their share prices before growth can return to its previous highs.
The Permian Basin, an oil and gas field that straddles Texas and New Mexico, was thought to have run dry until hydraulic fracturing, or fracking, became a viable means of extraction. There are now an estimated 75 billion barrels of recoverable shale oil in the region, but fewer than five billion had been produced by the end of 2018. The Permian is forecast to produce more oil by 2023 than any member of Opec, the Organisation of Petroleum Exporting Countries, Saudi Arabia excepted.
Artem Abramov, head of shale research at Rystad Energy, a consultancy, said that the basin remained an “infinite low-cost source of supply” that would continue to grow, although “the age of easy productivity gains is over” and the pace of production growth “will gradually decelerate in 2020 and 2021”.
Mr Abramov said that a “significant boost” in investment by oil companies was needed to prevent the region’s rapid growth stalling further, but added that this was unlikely to emerge. “The current market sentiment and overall new shale business model – disciplined spending and free cashflow generation – are two factors preventing increase in spend,” he said.
Dan Brouillette, the US energy secretary, said that the Permian slowdown was likely to be temporary and that the golden age of American shale was far from over. Yet he warned that some producers could fail as the market decelerates.
“Maybe there are some folks who, for whatever reason, thought they could make some quick money in this and they are learning that production is not as easy as you might think,” he said in an interview with Bloomberg. “You may see some of them go by the wayside.”
Drilling and fracking are expensive processes that quickly suck away capital. Oil companies have been forced to rein in these operations because shareholders want to see more profits from increased production.
The number of fracking crews working in the Permian fell from about 250 at the start of the year to 200 at the beginning of December, figures from Primary Vision, a consultancy, suggest. Drilling activity has been on a downward trend all year: there were 408 active rigs last month, down by ten from October and 82 from November last year, a government tally shows.
The decline in drilling and fracking has had a direct impact on the Permian’s employment and housing markets. In the first ten months of 2018, employment in the region jumped by 16,700 jobs. In the same period this year, it fell by 400, figures from the Bureau of Labor Statistics show. Meanwhile, the median home price in the Permian fell to $US301,045 in October this year from a peak of $US309,094 in August, figures from the Dallas Federal Reserve show.
Permian oil production is expected to grow in January but at its slowest rate since July this year, according to a forecast by the US Energy Information Administration. It estimated that production in the region would climb by 48,000 barrels of oil equivalent per day from December, to 4.74 million boe/d.
The Greater Houston Partnership, a civic group, predicts that 4000 oilfield jobs will be lost in the city by the end of next year. It said that the situation facing Houston, the corporate and financial capital of Texan oil, was “eerily similar” to the bust of the 1980s.
Israel Campos, co-owner of Pody’s BBQ, a restaurant in the heart of the Permian, said that business had been “tight” towards the end of the year, but he was “looking for a brighter 2020”.
Exxon has bought exploration rights of 1.7 million acres offshore Egypt.
Operations, including seismic data acq, starts 2020.
Watcher,
That’ll be for natural gas though I guess they wouldn’t turn the corporate nose up if lots of oil were found. The eastern Mediterranean is a current hot spot for NG finds.
Exxon has been in Egypt for a long time. They and Chevron just put in bids on the first tracts offered for exploration in the Red Sea, and I didn’t know anyone was thinking of that on the Egyptian side.
Condensate.
Interesting article about Kuwait
https://www.theoilandgasyear.com/articles/capacity-for-growth-in-kuwait/amp/?__twitter_impression=true
EIA monthly trough 19 Oct.
https://www.eia.gov/petroleum/production/
Seems there is a slow down in 2019…
Dennis, Ovi, Ron, Freddy and others,
I finally received a reply from Raoul LeBlanc from IHSMarkit about IHS press release on Dec 12.
[email protected]
https://news.ihsmarkit.com/prviewer/release_only/slug/energy-base-decline-rate-oil-and-gas-output-permian-basin-has-increased-dramatically-b
In your article you say that “total US production growth to be 440 kbd (0.44 mbd) in 2020”. EIA STEO estimates that total US average crude oil production is 12.25 mbd in 2019. Can I assume that you are expecting total US average crude oil production to be 12.69 mbd in 2020?
Raoul: I always quote entry to exit numbers, as annual averages are misleading. We entered the year at roughly 12.0 and should exit at about 12.7. the 440 puts the exit next year at about 13.1.
You also say in your article that “modest growth is expected to resume in 2022.” Can you quantify that growth? Is it 100 kbd or more? Does the growth start at the beginning of 2022 or end of 2022?
Raoul: About 200-500 kbd per year.
I am guessing that total US crude oil production has peaked on Nov 2019 at 12.85 mbd. I’m not saying that this could be an all time peak but given the high shale base decline rates, this Nov 2019 peak might be the last peak. This Nov 2019 peak is shown in the attached chart.
Raoul: The slowdown is based on money flows, not asset exhaustion. All this could return to growth with the right price.
I also don’t see how US oil can have modest growth in 2022, given the annual 7 mbd base decline rate for shale oil from the EIA DPR.
Raoul: You have to model base decline dynamically. Slow or no growth leads to shallower base decline.
We do not use the EIA methodology, so cannot comment.
I’m guessing that US crude oil production may not reach 13 mbd and may have already peaked in Nov or Dec 2019.
Thanks Tony,
My guess was correct in this case, happens every once in a while.
Raoul LeBlanc, Vice President of Unconventionals, IHS Markit
North American Shale Hits an Inflection Point in 2020
Posted on Youtube, Dec 20, 2019
https://www.youtube.com/watch?v=eQ9ABy2jMFI
Dec 31 (Reuters) – U.S. crude oil stocks fell in the most recent week while gasoline inventories declined and distillate stocks rose, data from industry group the American Petroleum Institute showed on Tuesday.
Crude inventories fell by 7.8 million barrels in the week to Dec. 27, to 436 million barrels, compared with analysts’ expectations for a draw of 3.2 million barrels.
https://www.reuters.com/article/usa-oil-api-idUSL1N295183
WTI for the year $48 to $61.
Brent for the year $55 to $66.
Come June we will know something of consumption.
Interesting article about Shale oil depth
https://www.wsj.com/articles/energy-producers-new-years-resolution-pay-the-tab-for-the-shale-drilling-bonanza-11577880001?mod=mhp
Next 4 years shall 400 billions in loans be payed back to the lenders, the ballons for 2020 is 40 billions.. How will this impact new wells after the ducs are used and US production next 4 years ?
Freddy,
Many shale oil companies have gone bankrupt and there will be more if refinancing of debt doesn’t happen.
“These numbers indicate a lack of financing to deal with the burden of the obligations. Given the low levels of external capital additions during the past 10 months, the probability of debt refinancing in the coming quarters seems relatively slim,” Lukash noted.
https://www.marinelink.com/news/us-shale-not-doomed-says-rystad-energy-471103
The Rystad chart below shows debt and interest profile for 40 shale oil producers. As these 40 produce about half US shale oil then the bars in the chart below could be doubled for all US shale oil producers. We should expect more shale oil bankruptcies soon.
Here’s an inquiry into a comment made by Chris Martenson in a recent Petroleum thread hereon (with my last comment ‘awaiting moderation’ thereon):
Further…
— — — —
New Open thread and US oil production update post is up.
http://peakoilbarrel.com/u-s-oil-production-is-competing-against-decline/
http://peakoilbarrel.com/open-thread-non-petroleum-5/