All OPEC data below was taken from the April issue of The OPEC Monthly Oil Market Report. The data is through March 2018 and is thousands of barrels per day.

OPEC crude oil production dropped just over 200,000 barrels per day in March. They are now just over one million barrels per day below their fourth-quarter 2016 average.
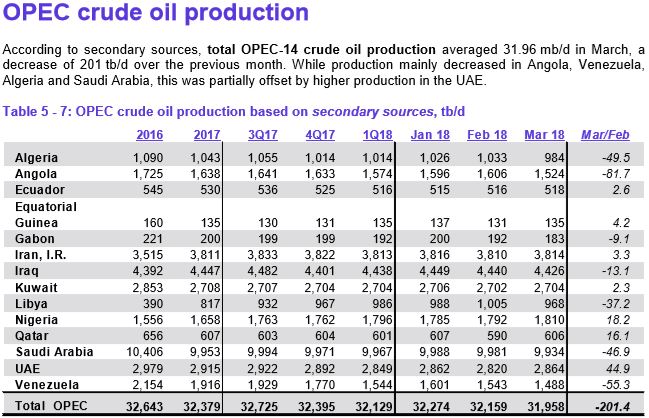
Only the UAE showed any significant gain among OPEC members.
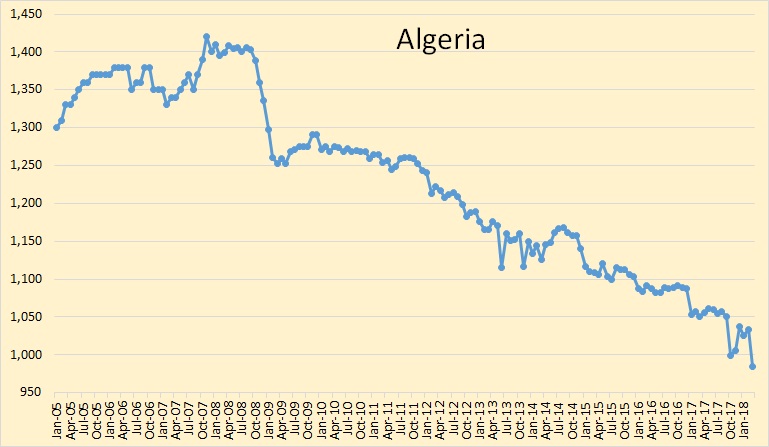
Algeria took a hit in March, down almost 50,000 barrels per day. They reached a new low of under 1,000,000 barrels per day.
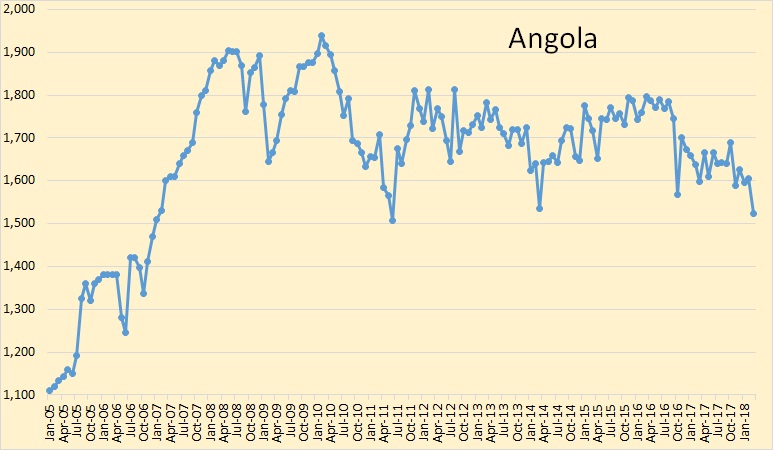
Angola took the biggest his of all OPEC nations in March. They dropped 82,000 barrels per day to reach their lowest level in almost 7 years.
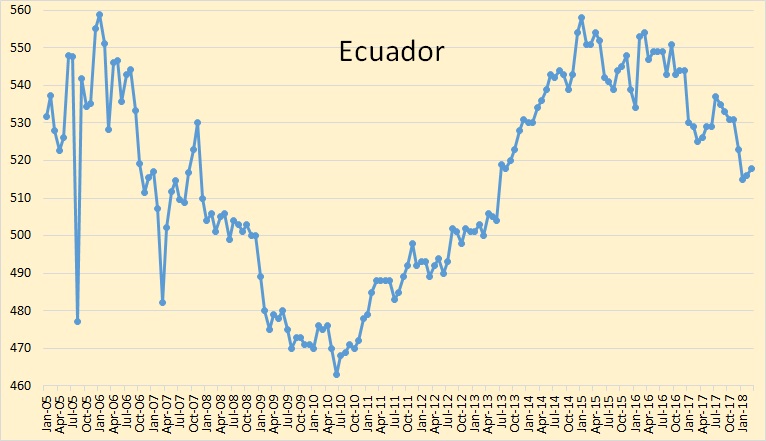
Ecuador has slowed their decline during the last two months.
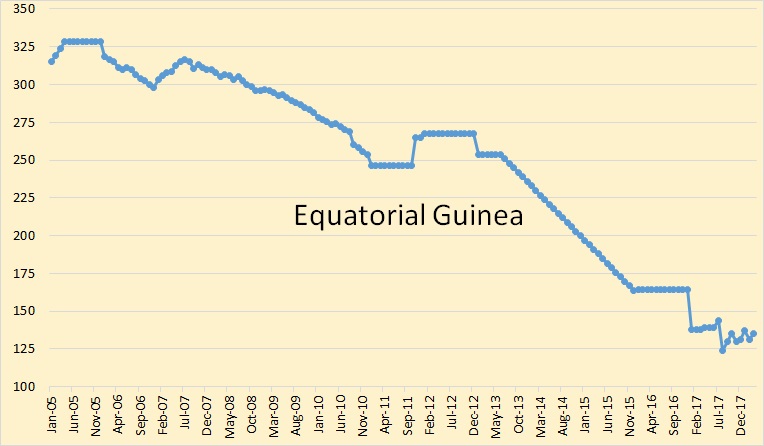
Equatorial Guinea is holding on.
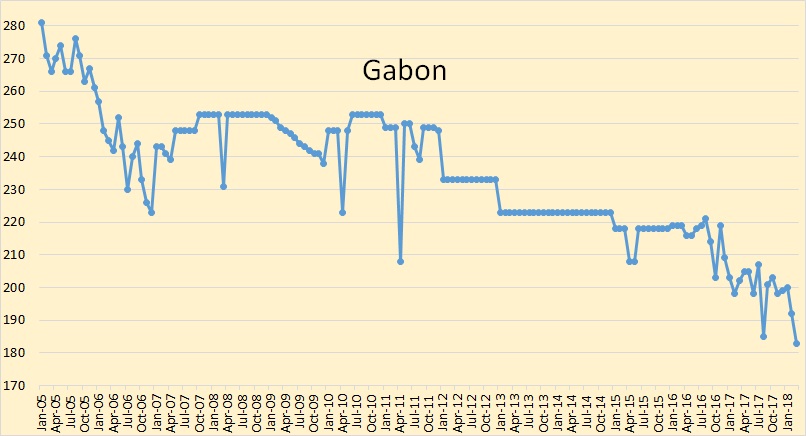
Gabon reached a new low in March.
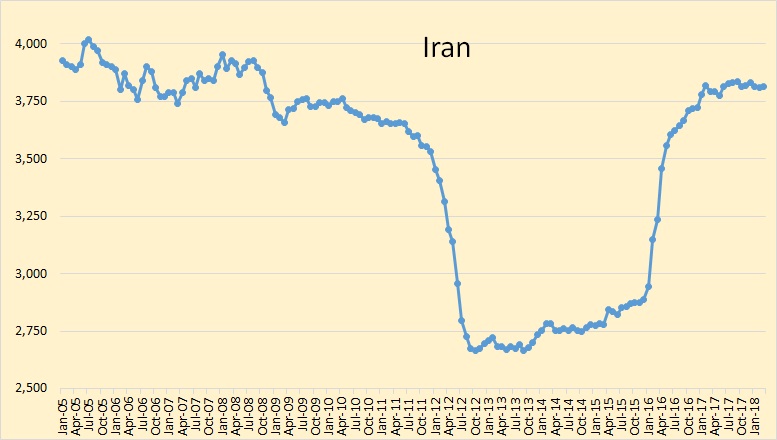
Iraq has fully recovered from sanctions and is now producing flat out.
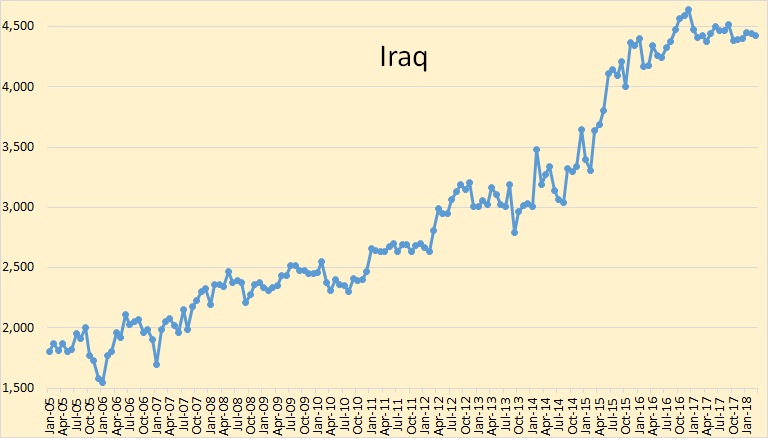
Iraq is also producing flat out and their production is holding steady.
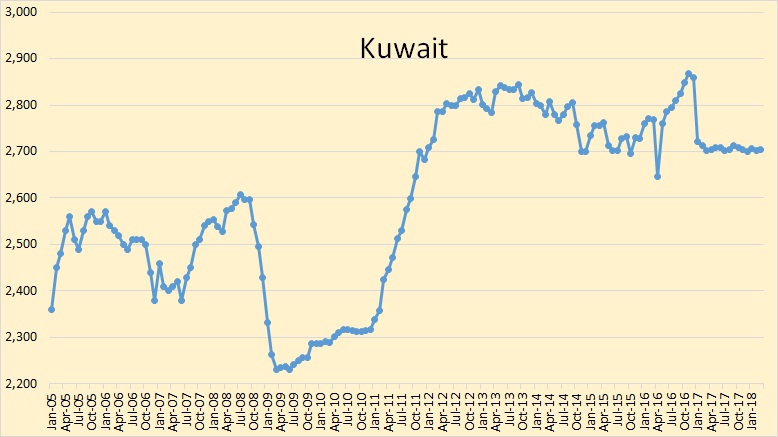
Kuwaiti product has held remarkably steady for the last 15 months.
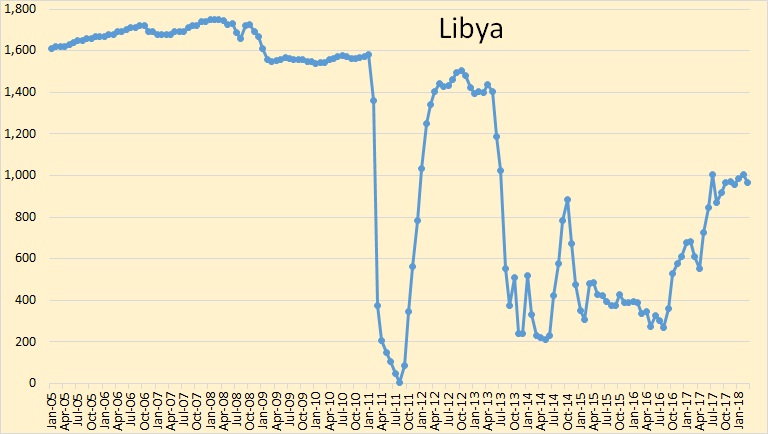
Libya is holding steady at just under 1,000,000 barrels per day. They could likely produce another 200,000 to 400,000 barrels per day if peace ever broke out in that country. But that is unlikely, in the near future anyway.
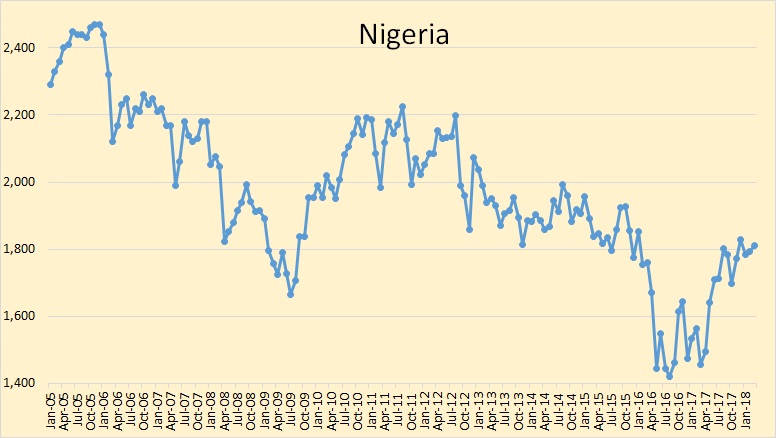
Nigeria is a big question mark. I have no idea how much political strife is hurting production there. Some no doubt but I don’t think they could greatly increase production even if all the rebels laid down their arms, something that is very unlikely to happen any time soon.
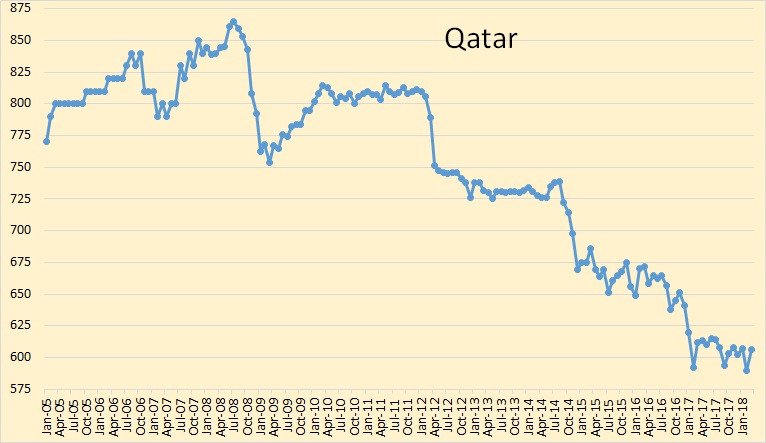
Qatar, after declining for almost a decade has held steady for one year now. But their decline will no doubt begin again soon.
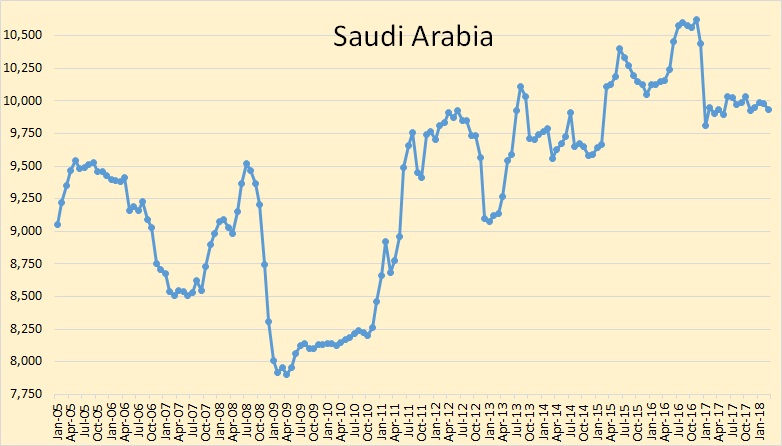
Saudi Arabia, the OPEC giant, has held output steady for 15 months. How much more could they produce? Perhaps half a million barrels per day but likely slightly less than that.
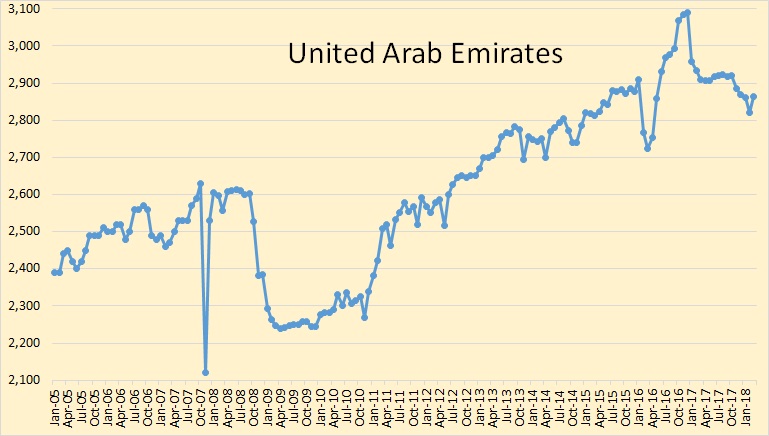
The UAE recovered its losses from last month. However, I still think they are producing flat out.
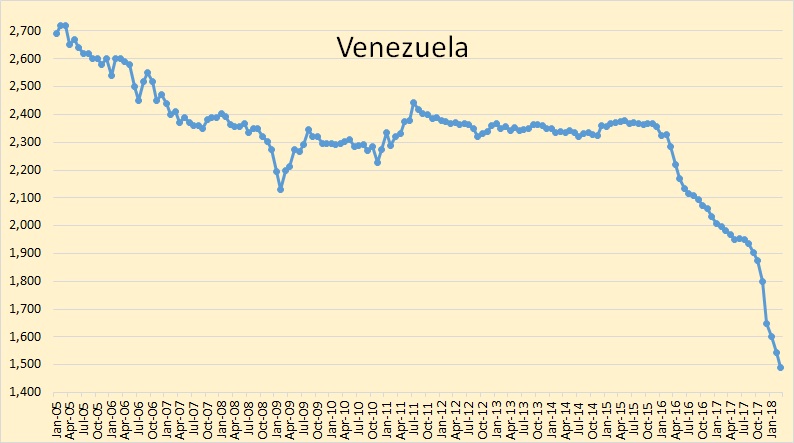
In the last six months, Venezuelan production has dropped 414,000 barrels per day, almost 70,000 barrels per month. They are well on their way to becoming a failed state and the declining income from oil is hastening that process.
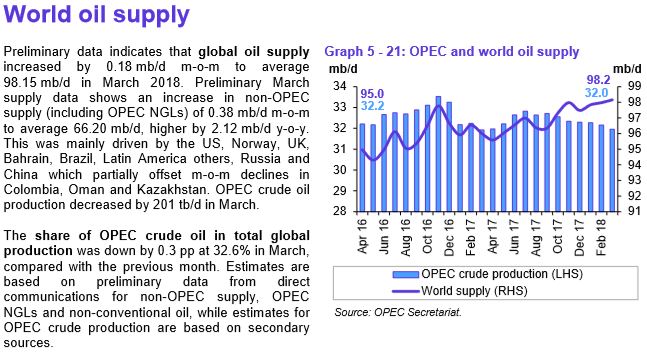
OPEC says world oil supply increased by 180,000 barrels per day in March. Since they dropped 201,000 barrels per day, that would mean Non-OPEC would have to have had an increase of 381,000 barrels per day in March. I think that is a bit too high.
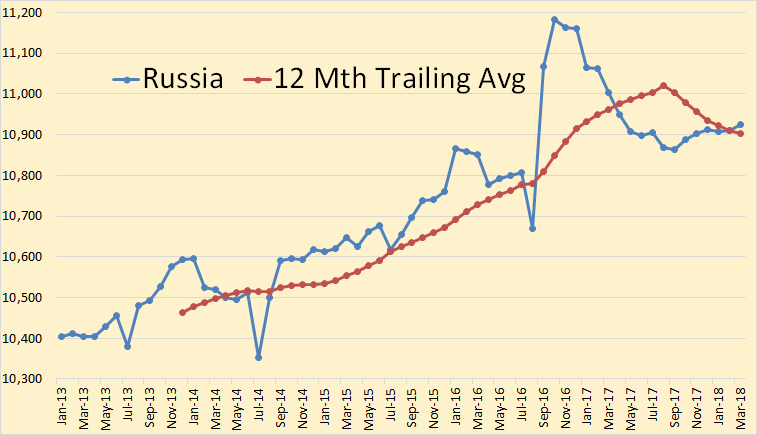
Russia, also through March 2018.
The data for all charts below are from the EIA and is through December 2017.
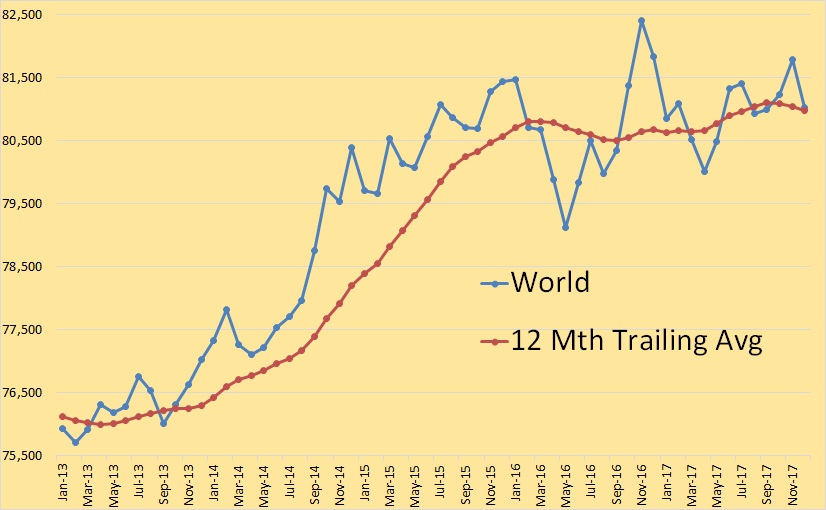
World oil production, so far, peaked in November 2016 with the 12-month average peaking in September 2017.
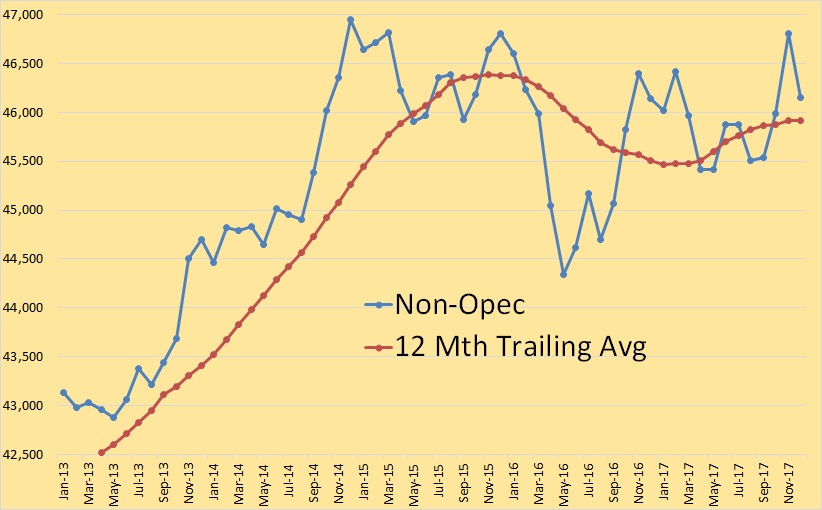
Non-OPEC peaked, so far, in December of 2014 with the 12-month average peaking in November of 2015
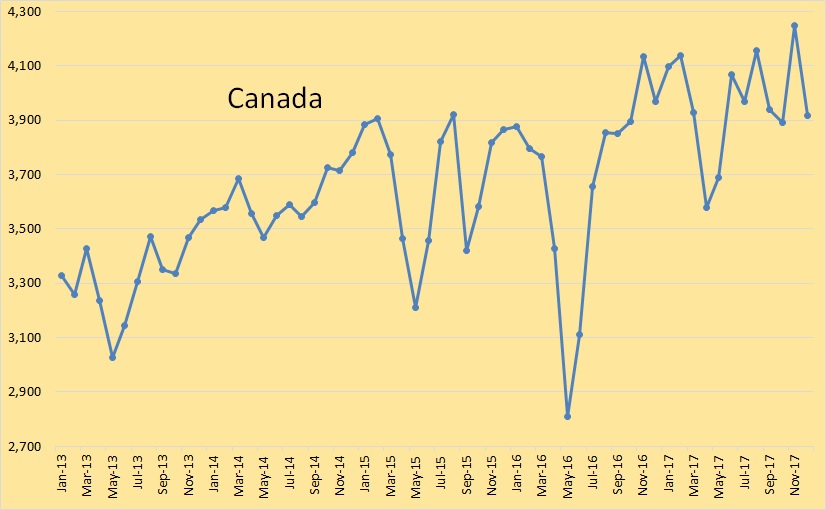
Canada seems to be holding steady.
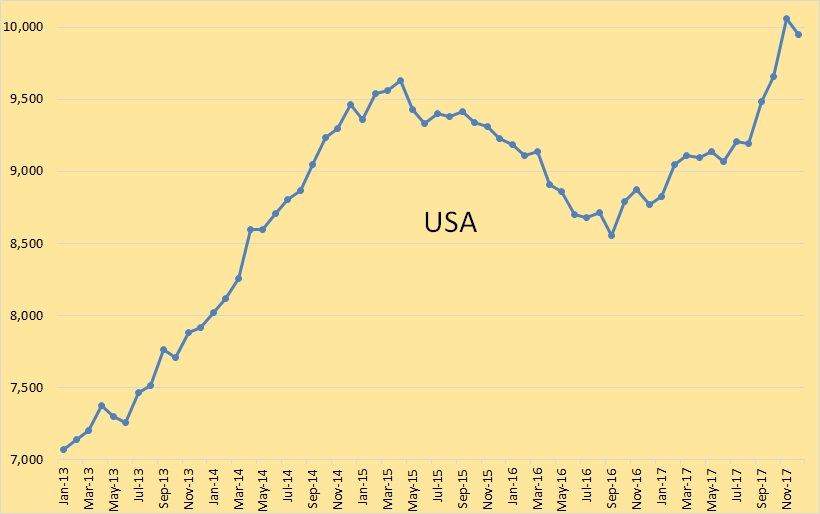
The USA reached a new all-time high in November but slipped a little in December.
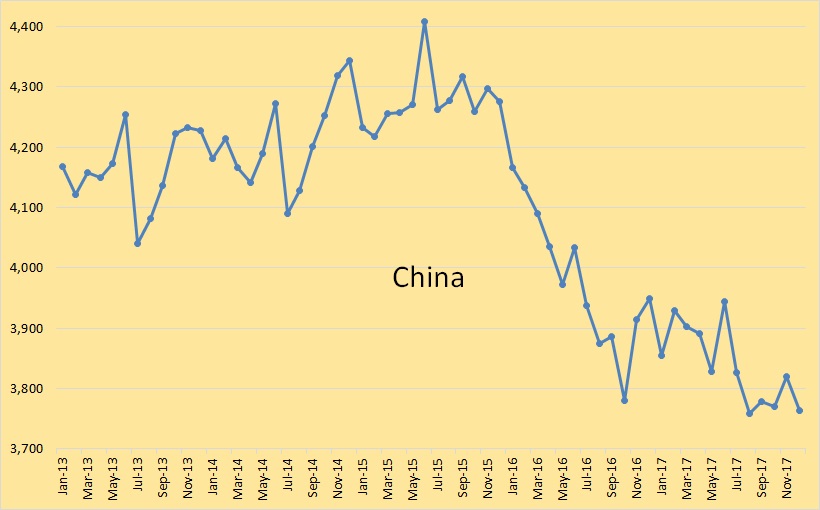
For China, it’s all downhill from here on out. They are consuming more and producing less. This is the Import Land Model as predicted by Jeffrey Brown a few years ago.
257 responses to “OPEC March Crude Oil Production Data”
Thanks for the update!
Is it safe to say that oil production from this planet Earth, the world as we know it . . . has peaked?
Well, no, it would not be safe to say that. We can guess. And that’s about all we can do.
Thanks for the great presentation Ron. I find the colored background on the graphs makes them much easier to read.
As it looks, there will be a peak only after US shale has peaked. They try to empty their fields at record pace, like in old oil rushs at spindletop where they got the oil price to a few cents / barrel.
Only when Tier 1 claims are empty and the best Tier 2 tapped, things will get a bit more calm.
Eulenspiegel,
There is a possibility that the lack of investment from 2014 to 2017 may lead to a decline in output from oil producers outside of the US and Canada, potentially this could hit about the time that pipeline constraints are overcome in 2019 or 2020 and could lead to an increase in US and Canadian output that barely offsets declining output in the rest of the world. That could set up a plateau scenario at around 81-82 Mb/d of world C+C output from 2018-2023. After that US LTO output will start to decline and I doubt Canadian increases in C+C will be enough to offset the US LTO decline which will be relatively rapid (4% annual decline or more) by 2025.
Possibly high oil prices and more investment (OPEC and ultra deep water) from 2019 to 2025 might help mitigate rapid World decline in oil output, perhaps keeping decline rates at 1% to 2% per year. Eventually the high oil price from 2019 to 2030 (probably an average of $175/b in 2018$ over that period with highly volatile prices) may lead to less oil demand as EVs ramp up (and electric rail for long haul freight and travel.) Eventually that would lead to lower oil prices and more rapid decline in oil output due to lack of profits at lower oil prices.
In this scenario oil use for energy falls to zero by 2056.
Energy reps each claim there’s a future for their resources.
https://www.bloomberg.com/news/articles/2018-04-10/coal-dead-peak-oil-demand-five-takes-on-fossil-fuels-future
some of you here have already made the point in the article. better to be first than last?
https://oilprice.com/Energy/Energy-General/Are-Oil-Markets-Tightening-Too-Fast.html
Per this post, OPEC sees inventories dropping by 1.5 million a day the second half. And they of the many who still sees US production up to an impossible figure, along with EIA, and IEA. Free fall, the second half and into 2019.
https://oilprice.com/Energy/Energy-General/Are-Oil-Markets-Tightening-Too-Fast.html
Sorry TT, posted the same time.
Pretty sure this has been posted before
https://oilprice.com/Energy/Crude-Oil/Permian-Bottleneck-Could-Impact-Global-Oil-Markets.html
Nick Cunningham writes some good posts imo. Some excerpts from the post linked above.
But according to Genscape, and reported on by Reuters, pipeline utilization in the Permian has jumped to 96 percent over the past month. Genscape says the Permian has 3.175 mb/d of pipeline, rail and local refining capacity combined. That’s a problem given that the EIA sees production jumping to 3.156 mb/d in April.
…
But there are broader ramifications for the global oil market. The assumption that the oil market would be well-supplied not only this year, but for years to come, is largely predicated on aggressive growth from U.S. shale generally, but also the Permian in particular. If Permian growth comes to a standstill this year, that will completely upend conventional wisdom about adequate supply.
The first quote suggests my 3.5 Mb/d Permian estimate is too high by over 300 kb/d. My US C+C estimate would drop from an 800 kb/d increase in 2018 to a 600 kb/d increase in 2018. That’s less than half the US C+C increase predicted by the IEA and EIA, adequate oil supply will not be forthcoming.
Canada also having pipeline problems, with Western Canadian select crude futures trading at about $18/b less than WTI on April 12.
http://economicdashboard.alberta.ca/OilPrice
https://oilprice.com/Latest-Energy-News/World-News/Kinder-Morgan-Threatens-To-Suspend-Trans-Mountain-Project.html
https://www.reuters.com/article/us-kindermorgan-cn-pipeline/canada-explores-options-as-kinder-morgan-halts-pipeline-work-idUSKBN1HG21G
It’s not clear if prices will be high enough to spur much growth in Canadian output.
https://www.platts.com/podcasts-detail/spotlight/2018/april/commodities-spotlight-permian-041018
Posting this one because people actually believe a lot of the “news” in this. Platts keeps getting to be a more doubtful source of news for me. As of two days ago, they firmly believe Permian will grow 1.2 million for 2018. Ok, it’s a guess, anyone can guess. Seems rail is an option, because there are 18k of oil on rail in Padd 3. So, 18 railcars will offer a huge solution. They can still ship by truck, as it is only about $24 a barrel. They fail to mention how many 200 barrel trucks that would take. Certainly more than the 18 railcars. They maintain producers will get it out some way, otherwise their 1.2 million estimate will never work. Ok, everyone can guess, it free to everyone. It could happen. Costs go up 15 to 20%, discounts up to $20. Yep, gonna be another killer year for upstream profits, again.
Rowboats! 😉
LOL! And life is but a dream 😉
Guym,
In the podcast they claim rail cost is about $7/b for transport so if the midland Houston spread remains above that level then some of the crude may be moved by rail. Rail capacity is only about 350 kb/d, about the same as local refinery capacity. When pipeline, rail and local refinery capacity are added together the total is about 3.5 Mb/d. That may be the cap on Permian Basin production.
The EIA’s Drilling Productivity Report (DPR) projects Permian output at 3150 kb/d in April, with a 285 kb/d increase in the last 4 months (850 kb/d annual rate, if the increase for the year is linear at the growth of the past 4 months.) If takeaway and local refinery capacity does not increase and the DPR estimates and trend projection proves correct, then capacity limits are reached in September and the Permian basin increase for 2018 would be capped at 630 kb/d.
If we also assumed this was about 60% of the US C+C output increase for the year (% from 2017 for Permian share of US C+C increase in 2017) then US output might increase by about 1000 kb/d in 2018.
Note that I believe this is a high side estimate because the DPR model tends to be optimistic, my guess is that US output may increase in 2018 by 800+/-200 kb/d due to the Permian basin takeaway capacity constraints on both oil and natural gas as well as rising costs and widening Midland/Houston oil price spreads.
Edit:
See comment above, there are different estimates for Permian takeaway capacity, a more recent estimate of local refinery, rail and pipeline capacity in the Permian is 3175 kb/d.
US C+C output increase might be more like 600+/-200 kb/d in 2018 vs IEA/EIA estimate of 1.3-1.4 Mb/d.
Well, not really 3.175. He was quoting Genscape, and incorrectly. The Genscape chart showed pipe plus local refining at 3.175. A separate dotted line above that was for rail, which may be 3.4. I think rail is the real question mark. I believe each tanker is approximately 1k bbls. I am not sure if the rail cars are loaded by truck, which only has a 200 bbl capacity. As demand for railcar goes up, so does the cost.
Guym,
Thanks.
I found another reference to 3.6 Mb/d of capacity, but the picture is rather muddy
https://www.genscape.com/blog/genscape-regulatory-data-provides-full-permian-view-midland-sealy-addition-coming-soon
Towards the end of the piece they mention 3.6 Mb/d of regional capacity.
Not sure exactly what they mean.
Below shows proved developed and undeveloped reserves for the biggest non-NOC E&P companies. Proved (1P) numbers are not as meaningful as proved and probable (2P), which better represent expected actual final production, and for the past couple of years it appears that mostly production is getting replaced by reclassification of probable to proved. However this year ExxonMobil and Chevron added some oil discoveries and BP added some from purchases.
The sell off and write down of oil sand reserves continued, but I think has probably bottomed out. Natural gas declined slightly in total, and for most of the companies.
Without significant new discoveries or acquisitions Marathon, Anadarko and ConocoPhilips are going to be running out of production sometime before 2025. It’s also noticeable that Shell don’t have much in the way of undeveloped proved remaining, and the Appomatox and Prelude FLNG projects are a large chunk of those.
This shows the totals for the companies combined (C&C should be C&C and NGL).
Thanks George.
It is too bad that the 2p data is not required by the SEC.
IHS would fight such rules as they make a lot of money from their propriety 2P reserve data.
Probably need Suncor and CNRL if you are producing a chart on reserves. 4.8 Billion proved and 7.2 Billion P+P for Suncor.
Good info. Would be interesting to see similar info on the next smaller tier of companies.
2025 is about the right time to run out of production. Exploring for oil with a payback period longer than is idiotic; the market will have cratered. Think about the effects of a 25% drop in gasoline demand and a larger drop in diesel demand, which are pretty much guaranteed by then thanks to BEV adoption worldwide.
Has anybody here got an opinion as to if nano surfactant will do what is being claimed. It appears to have been around for quite some time so I suspect it is just another scam.
There is a company currently re opening wells in the texas chalk that have been abandoned for 25 years but they claim will be economic using ERA-3.
nano surfactant!!! now that is creative marketing. All surfactants work in the molecular (nano) level.
Now if they have found a better surfactant, this to be proven. But kudos for creative marketing…. like N2 for tires.
Thanks for the chuckle…
IEA OMR: https://www.iea.org/oilmarketreport/omrpublic/
The projected supply/demand deficit is increasing, again (deficit is widening by each new edition). They still assume US production in 2018 will grow by 1.3mb/d but note that takeaway capacity is becoming a problem.
“OECD commercial stocks declined by 26 mb to 2 841 mb and were just 30 mb above the five-year average at end February. The average could be reached by May, on the assumption of tight balances in 2Q18. Product stocks are already in deficit.”
“Our balances show that if OPEC production were constant this year, and if our outlooks for non-OPEC production and oil demand remain unchanged, in 2Q18-4Q18 global stocks could draw by about 0.6 mb/d. With markets expected to tighten, it is possible that when we publish OECD stocks data in the next month or two they will have reached or even fallen below the five-year average target.”
…if OPEC production were constant this year … – the big question, for 2018 and probably the forthcoming decades. SA +300, Nigeria +200 and Angola +140 new nameplate: is that enough to overcome the declines, which could easily accelerate now as some projects started from 2005 to 2013 will be reaching end of plateau, and unplanned outages seem to be growing across the industry, plus total loss of Venezuela must be on the cards.
And apart from that I still don’t see how non-OPEC conventional supply is not going to decline quite significantly in 2019.
George,
How do you define “conventional” oil? Just asking because there are several different ways that people use that term. Is ultra deepwater offshore (>1500 m) considered conventional? LTO?
Hi George.
The early production project for the fractured basement West of Shetland is coming along.
http://www.hurricaneenergy.com/operations/early-production-system/gallery
Looks like 17 kbpd for 6 years, maybe extendable to 10 if the results look good.
On the other hand it looks like Dana have downgraded the Barra production limit on WIDP from 18 kbpd to 5. They’ve upgraded the Harris production allowance to give a total of 40 still (the facility namplate), but if this reflects a downgrade on the Barra reserves, or even just a major problem with the subsea kit, they are going to lose even more money on the project, unless they can find some good tie back options, and fast.
“And apart from that I still don’t see how non-OPEC conventional supply is not going to decline quite significantly in 2019.”
Agree. Their forecast is unlikely to make it through this summer. 2019 is a different game when reality knocks down the door.
Jeff,
George said “quite significant decline in non-OPEC conventional”.
You seem to agree. Can you explain your understanding of George’s comment?
I don’t know what he defines as “conventional oil”, does it include LTO?
If so, I would not agree that non-OPEC conventional (excluding extra heavy oil with API Gravity>10) will see significant decline in 2019.
I define “significant decline” as more than 2% per year.
What decline rate would you consider “significant”?
Which producers outside OPEC do you expect to increase their output in coming years and by how much? Growth outside OPEC is mainly Canada (heavy), US (LTO), Brazil (deep offshore/pre-salt), Russia (cuts or something). Not even IEA’s Oil 2018: Analysis and forecast to 2023 thinks that this group will increase their output.
I know you like to speculate about oil production and price. Often providing probability estimates too. I’m a bit more hesitant and humble of my ignorance. I just know that about ten years ago the supply was stagnating and speculation got the price all the way to $148/brl. There seems to be a fairly substantial deficit this year, perhaps by as much as 1 mbd. I see an oil price roller coaster ahead.
Yes,
I am very much on your page. I read the Matt Simmons views on SA, and took in the “end of cheap oil” sentiment portraited by the ever so tabloid Economist at the time when oil prices were high. So, I turned out to not acknowledge the wast resources to be exploited nearly 2km beneath the earth surface. The power of horisontal drilling, resovoir mapping of oil left behind and the industrialisation of shale oil that followed. My guess is that the low investment in recent years will lead to lower production and that the price rise will lead to another peak (higher or lower than past peak I dont know), and after that oil production will for certain head down (from 2025). In what way that will influence global economics is also uncertain, other that to ignore a major crisis would most likely be wishful thinking.
So I think the 2025 peak that Dennis C. is talking about makes sense. If that is really above the peak experienced now or if a recession would come before that (well I dare to say 97% likely :)), can just be speculated on right now but will be more clear after a while.
Thanks guys.
I make lots of estimates (aka guesses), but realize they will be wrong about 100% of the time, anything close to correct is probably just a lucky guess.
Note that World C+C is very near a peak right now, been roughly a plateau for about 18 months with small moves above and below 81.5 Mb/d for World C+C output.
Output increases will be from US, Canada, and Brazil mostly and eventually we might see a bit of increase from OPEC and Russia, whether declines elsewhere will be larger than the increases is hard to guess.
Much will depend on oil prices and how increasing oil prices might accelerate the transition to EVs and other types of transport.
I think we will either see an undulating plateau around 82-83 Mb/d or possibly a slow increase to 84-86 Mb/d by 2025. If we see the increase to as much as 86 Mb/d, decline on the backside will be steeper. A plateau scenario might be extended to 2028, but the longer it is extended, the steeper decline will be once it begins.
A severe recession clearly will lead to steeper decline, I am still guessing this happens between 2030 and 2034 (for the start of Great Depression 2), don’t know how long it lasts, depends if policy makers have read Keynes.
If yes, shorter depression (3-5 years), if no, 7-10 years.
What a difference between two months ago. Two months ago, US production increase may create a new glut. Now, it’s come on OPEC, mission is accomplished. Get pumping. We are not ready to admit yet, that our projection of 1.8 million is pure fancy, but we are noticing this slight crack in the dam. Next month it will be, we told you the dam wouldn’t hold. This is April, pretty early in the year, yet.
Add to this, the almost certainty that there will be additional sanctions against Venezuela and Iran. Bound to be a problem for Venezuela, not sure about Iran, but I am sure it will not help them increase output. However, Iran will restart their nuclear projects, and Sauds will be right behind them, though with more resources. Geopolitical risk, who cares, inventories will drop like a rock, anyway.
Guym,
Pipeline issues in both the Permian basin (both oil and natural gas) and Canada (Alberta oil sands) suggest that it might be a struggle to increase World output by 1 million barrels per day as there are likely to be declines from mature fields that will be difficult to offset. I agree the IEA estimate looks quite optimistic, especially if it is assumed there is not a lot of increase from OPEC and Russia.
It will be interesting to see what oil prices look like in Sept and October of 2018, based on current information my guess would be $80-$100/b for the peak monthly price for Brent in 2018.
Yes, the narative is changing fast.
Gone fishing,
You posted a nice chart previously.
http://peakoilbarrel.com/eias-electric-power-monthly-march-2018-edition-with-data-for-january-2018/#comment-636355
Considering only BP data from 1965-2016 for fossil fuels (consumption after 1989 and production earlier where some of the consumption data does not extend back to 1965) in million tonnes of oil equivalent (Mtoe). I took the natural log to look at growth rates and apply trend lines for 1965-1979, 1984-2011, and 2012-2016, slopes are 4%, 2%, and 0.8% respectively, I expect the growth rate will continue to slow to zero by 2025-2030 and then become negative. Coal resource estimates have decreased over time, oil resource estimates may be overstated, natural gas will depend on prices, methane hydrates etc are a little like the kerogen resource and are unlikely to be economically viable on a large scale.
Global biofuel production has been rising fast this decade, putting a dent in demand for oil. Somewhere on the order of 5 million barrels/day lately. Total liquid 0il plus bio demand is getting near 99 million barrels/day.
http://www.mdpi.com/2077-0472/7/4/32/pdf
So basically fossil energy use has increased by 1.7 times since 1984. The slowdown in the last few years is similar to or less than slow downs in previous time periods, so it may or may not be indicative of a coming peak. We will know within a decade how the increasing population/lifestyle/predicament energy problem is being slowed down by new efficiency and alternative energy increases.
Absolutely correct that this may simply be a slow growth period which might be followed by faster growth. Biofuels were removed from the consumption numbers and I use tonnes of oil to account for the lower energy per unit volume of NGL, on a mass basis the energy content is more similar so I prefer mass vs volume. Typically NGL on average has about 70% of the energy content of the average barrel of crude, so barrels are not a great measurement for all liquids unless the barrels of NGL are multiplied by o.7 to adjust.
I prefer to focus on crude plus condensate as that’s what most of the transportation fuel is made from.
Not sure what you are talking about, my original graph was in TWh. The biodiesel (which replaces oil products) can be converted to energy. Not sure why you are talking about NGL’s
Hi Gonefishing,
TWh is a unit of energy, same as Mtoe, or exajoules.
The source of the data in your chart says BP Statistical Review, which has data from 1965 to 2016. I was simply clarifying that I didn’t include biofuels as I was focusing on fossil fuel energy. In your comment you cited liquids output in barrels, my point is simply that barrels of oil equivalent (same energy per barrel) gives a different result from “barrels”.
For example in 2016, BP reports oil consumption in barrels at 96.6 Mb/d, and 4418 Mtoe/year. When the estimate in tonnes is converted to barrels of oil equivalent at 7.33 b/tonne, we get 88.5 Mboe/d.
In 2016, biofuels production was about 1.5 Mboe/d according to BP.
The estimate without biofuels would be about 87 Mboe/d (31.7 Gboe).
The conversion is 1 TWhr=85.98 Mtoe as I am sure you know.
The point was that 99 Mb/d is a volume of liquids (about 36 billion barrels per year) rather than a unit of energy. This is a problem with the way OPEC and the IEA report “oil” output, they don’t use units of energy.
And it gets even more complicated when one considers useful or net energy from a product, since they are often used across a wide variety of systems.
Net or useful energy would be more comparable. That is what is needed to provide the functional work. A lot of energy goes to obtain the fuel, refine the fuel, transport and deliver the fuel to the customer and maintain those systems.
Agreed.
Exergy would be a better measure, pilling together the necessary data is a challenge.
Oil exploration will not be financially viable in 2025, maybe as early as 2023. This isn’t hard to figure out if you understand the substitution effect. In order to get substitution back to oil, the price would have to fall below $20/bbl; no new wells can produce that cheap.
According to EM outlook for energy (2018). Without any further exploration and development, through natural decline, the global liquids production will drop by 78 MBDOE or about 80% of 2016 production. Unless we can replace 78 MBDOE of liquids, or destroy demand for about 80% of 2016 liquids demand some investment will be needed and is going to be economical.
Because anything brought on between now and 2040 would also decline, in fact most new projects, though still not yet most new capacity, recently are short cycle which will be exhausted and decommissioned in 5 to 15 years, there really would need to be about 175 mmbpd added to leave that amount online in 2040. Assuming typical large conventional sized projects it would need about 1.2 to 1.4 trillion barrels of reserves to support that amount of average production (more for XH, maybe a bit less for LTO and small tie backs, but not by much as they deplete so fast and ultimately take more resources and cost more). There isn’t that much undeveloped reserve around (by a long way) and to discover it at current rates would take 300 to 400 years. To develop it at current prices would cost about $12 trillion, plus exploration and operating costs might be the same again, but actually it would be much higher as the developments are getting more difficult and expensive (smaller, heavier, deeper, remoter), and discoveries more difficult. About the same again would be needed for gas, and, assuming Exxon doesn’t think every fossil fuel user suddenly switches to renewables in 2040, the rate of spend would still be going up exponentially, and at quite a high rate, then.
(interesting ExxonMobil haven’t updated that figure since 2016)
From the OPEC report.
Non-OPEC supply in 2018 is forecast to increase by 1.71 mb/d compared with growth of 0.90 mb/d in 2017. Non-OPEC supply for 2018 was revised up by 0.08 mb/d in absolute terms, compared with last month’s assessment, to average 59.61 mb/d, and is now expected to grow at a faster pace.
The key drivers for growth in 2018 are the US (1.50 mb/d), Canada (0.29 mb/d), Brazil (0.21 mb/d), the UK (0.10 mb/d), Kazakhstan (0.08 mb/d) Ghana (0.05 mb/d) and Congo (0.04 mb/d). Production is forecast to decline in Russia (0.15 mb/d), Mexico (0.11 mb/d), China (0.11 mb/d), Norway (0.05 mb/d) and Colombia (0.05 mb/d).
Increases in Brazil, UK, Kazakhstan, Ghana, and Congo are more than offset by declining output in Russia, Mexico, China, Norway, and Colombia. Essentially, the 1.71 Mb/d increase in 2018 for non-OPEC liquids output forecast by OPEC is from the US (1.5 Mb/d) and Canada (0.29 Mb/d).
There have been several stories posted suggesting that both Canada and the US may see output curtailed in 2018 due to lack of pipeline capacity to get the produced oil to market.
My expectation is that US output will fall short of the OPEC estimate by 800 to 1000 kb/d and Canadian output by perhaps 150 kb/d, leaving the non-OPEC increase in liquids output at only 700 kb/d for 2018.
The OPEC forecast for World oil demand in 2018 is for an increase of 1.65 Mb/d, if that estimate is correct, this suggests a stock draw in 2018 of 950 kb/d or about 347 Mb in 2018.
OECD stocks in Jan 2018 were at 2871 Mb, so a 347 Mb draw would take the level to 2524 Mb, this is below the lowest range seen from 2013 to 2017 (about 2570 Mb). Unfortunately we don’t have great data for the non-OECD stock levels.
I wonder what will happen to oil prices.
I predict they will be “volatile”. Isn’t that the term IEA uses?
Hello Dennis,
The price of WTI is at a high since about 12/2014 and on a steady rise going back to 1/2016 with a little pull back in early 2017. Inventories have been declining since 2016 and we are headed into the summer driving season. In the states, refineries will be running at 97% of capacity in a few weeks heading into record world demand.
I’m going to predict we are going to continued an increase in price until sometime into July to September. Reaching a peak between $80 to $85 for WTI. Then a collapse of about $15 to $20 about a month or two before the election. With a final price for the end of the year at about were it is today or a little lower. I also think refineries will not be able to keep up with demand going into the summer with excellent margins and profits. With VLO reaching $120, PBF reaching $45, ANDV reaching $125, XOM reaching $90, CRC reaching $35, OXY reaching $90
https://oilprice.com/commodity-price-charts?1=&page=chart&sym=CL%2A1&name=Crude+Oil+WTI&domain=advancedmedia&sg=true&display_ice=1&enabled_ice_exchanges=&stu
See you in September
Hillary,
I agree with the rise to $85/b maybe by October, perhaps there will be a pull back by $15/b, hard to know how supply and demand will react to $85/b, OECD stocks may be pretty thin by November, but pipeline constraints may ease by early 2019 and that might bring prices down, if stocks start to rise. Remember that an increase of output of 1.4 Mb/d is needed to balance supply and demand, it is far from clear that by November 2018 that supply and demand will be in balance (zero change in oil plus product stocks).
I have been debating for a long time whether there will be one more oil price peak or not. Seems like it’s leaning towards “there will”. This is the last one. I’m not sure when the pirce crash happens after that; it might take until 2019 or even 2020.
Hi Ron or some else
How are you?
When will peak oil of Brazil?
Thank you
Oi Cecília, talvez devêssemos perguntar ao novo Ministro de Minas e Energia do Brasil, o illustre Sr. Wellington Moreira Franco… 😉
I won’t dare presume to speak for Ron, but I’m pretty sure I know what he will say.
George Kaplan had a post on production by: Colombia, Mexico and Brazil not that long ago.
http://peakoilbarrel.com/recent-production-colombia-mexico-and-brazil/
Abç
North Dakota Director’s Cut released. February output about the same as January (1,175,000 bbld).
The 51 completions a very low number.
The February output is about 50 thousand barrels a day less than the all time record.
A new record should be set before summertime.
A new record should be set before summertime.
I’m a novice, so you are probably right——
But—— we shall see
Coffeeguyzz,
If oil prices continue to rise you will be correct, if not due to a large increase in US LTO output (which I am guessing is your expectation), then the Bakken may continue it’s recent plateau in output and may not rise above 1200 kb/d before December 2018 (a new record, but barely so).
Attached is chart of ND Bakken oil production from Jan-12 to Feb-18. Also the number of associated wells is shown, (divided by 10), so that they fit on the same chart. Note the change in slope for well additions that occurs after July-15. There are definitely two distinct slopes and possibly a hint of a lower third one starting in Sept-17. The average well additions are as follows over the following three time frames:
Jan 12 to July-15 158 wells/mth
July -15 to Sept-17 61 wells/mth
Sept-17 to Feb-18 43 wells/mth
It is not clear whether there is a new lower rate of well additions after Sept-15. It will take a few more months to see if the well addition rate has slowed again.
Hi Ovi,
A chart of the natural log of output with trendlines over those three periods would show more clearly how the rate of growth has changed over time.
Hi Dennis
My focus was on well additions and the chart does show how the rate of well additions was virtually linear from Jan-12 till July-15 and then sharply dropped by 61% thereafter. I had also looked at Enno’s Bakken well data and he shows the following increases: Oct-17 105, Nov-17 81 and Dec-17 107. These numbers are more than double the numbers reported for those months and indicated on the chart. I assume that the majority of those new wells were in ND.
We all know that the production decline rate for all of the Bakken increases with time. The wells chart, combined with Enno’s well data, indicates that the number of old wells coming off line is beginning to significantly offset the new well additions in ND. I wonder if Enno’s well data can confirm this. For me, this was a surprise.
Hi Ovi,
When the average number of new wells falls below some level, about 60 to 80 new wells per month, then output will decline. This depends in part on the number of new wells added recently (if this number is higher more new wells are needed and vice versa when fewer new wells have been added in the recent past).
From the shale profile data about 81 new wells per month were added on average from Dec 2016 to Jan 2018 as output increased from 913 kb/d to 1140 kb/d. About 62 wells per month were added on average from Nov 2015 to Dec 2016 as output fell from 1146 kb/d to 913 kb/d.
A higher rate of new wells added (say 80-100 new wells per month) is likely to result in increased ND Bakken/Three Forks output.
Oh the legacy decline rate does not necessarily increase over time, as the rate that new wells are added rises, then the legacy decline increases, the reverse is true as the rate that new wells are added decreases.
https://www.epmag.com/analysts-survey-shows-rise-us-onshore-upstream-budgets-2018-1695476
Reports of capex increases from 9 to 11% doesn’t jive with all the hoopla. Doesn’t seem huge when I think of where last year’s well decline rates are. It may be more active in the Permian, but where one increases another decreases. And note the comment on bottlenecks may decrease that. Those are pretty large samples of E&Ps. I guess they didn’t get the memo that they are suposed to supply the world.
Another article states 9%.
https://www.ogj.com/articles/print/volume-116/issue-3/special-report-capital-spending-update/us-oil-gas-industry-capital-spending-to-increase-in-2018.html
A 9% increase is far from the 40% increase they had in 2017. With this level of budgets for capex, there was no way production increase could be equivalent to last year’s rise to begin with. Shale wells have FAR more than a 9% decine rate.
Most here understand the theory, although I have never seen it work out even close. The theory goes, if your going to drill exactly the same amount of wells in exactly the same producing area, you would get about 35 to 40% more production. That’s because the well you are completing in January 2018 is partially covering the drop in production from that well you completed in January 2017. 60 to 65% of the new production is simply replacing the decline in the first well. So, if you increase capex by 9%, then production may increase by 50% over last year. That varies wildly, though. Not a very good predictor. More unpredictable if costs are increasing.
There was a 40% increase in 2017, but most of that was newly concentrated in the Permian. Hence, the big increase in 2017. But the same, or mostly the same, players increase 9% in the same area, then some of the theory may apply.
RE: Canadian production- pretty sure I remember hearing some oil sands producers holding back production while the pipeline/rail issues persisted.
Yes, although I think they’re still producing around record high levels
2018-03-01 CALGARY — Oilsands giant Canadian Natural Resources Ltd. says it is moving up planned maintenance shutdowns at its heavy oil projects in northern Alberta and will slow down production from new wells to avoid selling the product at current poor prices.
http://calgaryherald.com/pmn/business-pmn/canadian-naturals-fourth-quarter-adjusted-earnings-rise-but-net-profit-down/wcm/03b04c0b-d298-476e-be07-35e2813cc4af
Cenovus
Lots of news from China
2018-04-13 China, record Q1 crude oil imports, also record fuel exports. And the start of refinery maintenance of around 1 million b/day. Those new large refineries will be tough competition for the smaller independent refineries (Teapots). Also a new fuel consumption tax regulation. And next it will be the start of tarrifs?
Reuters imp/exp figs https://www.reuters.com/article/us-china-economy-trade-oil/china-march-crude-oil-imports-second-highest-on-record-fuel-exports-hit-new-high-idUSKBN1HK06X
Natural gas rig count for, Appalachia, US Gulf of Mexico, Canada and Mexico
Production growth is coming from shale areas, such as the Appalachia & Haynesville. But as George mentioned the natural gas rig count in the US GoM is down to zero
Appalachia: https://pbs.twimg.com/media/DavmC_JXkAAHcIV.jpg
US Gulf of Mexico: https://pbs.twimg.com/media/DavmK4AWAAY4-HP.jpg
Canada: https://pbs.twimg.com/media/DavmGUzWAAE-P98.jpg
Mexico: https://pbs.twimg.com/media/Davm4F9X0AA1134.jpg
Pennsylvania just released the most recent – February – production numbers.
Whereas just a few years ago, if a well had an initial 24 hour production rate of 20 to 30 million cubic feet, it was highly touted as hugely productive.
Now, there are dozens and dozens of wells routinely flowing 20 to 30 million cubic feet a day for several months. (Chesapeake’s McGavin 6 has averaged 37.6 MMcfd for 7 months, producing just over 8 Bcf in that time. Every 6 billion cubic feet of gas contains more heat energy than a million barrels of oil).
The length of the laterals is starting to increase dramatically with hundreds of 17,000 footers planned in 2018 alone.
Thanks Coffee,
not sure many here have recognized just how much improvement in drilling and frac control the industry has accomplished in that last 2 years. Likewise Coffee, in Scoop 10,000′ laterals are becoming normal and CLR has drilled one 15,000′ lateral in our local area. The increase in production continues to be to impressive (to me) compared to our earlier wells. 100% increase in comparative time intervals near normal. (~200,000BO in one year) Cost continue to be DOWN 25% per well. If Dennis is right about his $80 oil forecast the wells we are drilling will payout in~6-8 months.
With regard to EUR there is room for doubt as the new completion methods have become standard only in the last year or two but as any engineer will tell you after 2 to 3 years of production you can plot a curve that would be no different than what the industry has done for decades for tight oil and gas wells. take it or leave it as you will.
Best
Hi Coffeguyzz,
Let’s say lateral length increases from 8500 to 17,000 feet. In that case for a given area that is prospective the number of new wells is reduced by a factor of 2. Only if the increase in lateral length results in output that is more than 2 times higher than the shorter laterals is there any increase in output from the field.
Also note that the increased sand and other proppants, surfactants, and water as well as the increased number of frack stages per foot all increase well cost per barrel produced, which will tend to increase time to payout.
What is the total capital cost (including land and all development costs such as storage facilities, water handling, etc) for these 17,000 foot wells and what is the average output of these wells (rather than just the most prolific few) over the first 36 months of output?
It is the payout of the average well that matters as the “best” wells have to pay for the below average performers in order for a company to be profitable.
Sometimes you seem to think profits do not matter, investors (or the smart ones) have a different opinion.
Edit:
Looking more closely at median 36 month cumulative output for Marcellus and Utica and assuming $1.50 per MCF, it looks like the median well easily pays out. The 36 month cumulative is 1800 BCF (billion cubic feet) for the median Marcellus/Utica well. I would need an oil man to see what the payout would be as I do not know the OPEX, etc for a shale natural gas well.
A mistake above (under edit).
The average Marcellus/Utica well in Ohio, Pennsylvania, and W. Virginia which started producing in 2014 (37 months of data) produced about 3.2 BCF of natural gas over the first 37 months of production, using 5800 CF per boe, this is about a 550 kboe EUR. Let’s assume a natural gas price of $3/MCF or about $17/boe and a well cost of $9 million. If we take 17*0.55=$9.35 million over 36 months and the well might payout.
The reality is that natural gas prices in the Appalachia area are much lower than $3/MCF, more like about $1.50/MCF or $8.70/boe, also note that lateral lengths have been increasing in the Appalachian basin, so let’s assume in 36 months cumulative output has doubled to 1000 kboe over 36 months, but that average well cost has increased by 67% to $15 million. So at 1 Mboe cumulative output over 36 months gross revenue is about $8.7 million and the well does not pay out over 36 months (where it is assumed gross revenue should pay for the capital cost of the well for an adequate ROI over the life of the well).
Link below has natural gas price data for Appalachia.
https://www.eia.gov/todayinenergy/detail.php?id=24712
Link below has production data for Appalachia
https://shaleprofile.com/index.php/2018/03/26/marcellus-utica-update-through-december-2017/
Well costs in presentation at link below (slide 36)
https://www.swn.com/investors/lip/latestinvestorpresentation.pdf
Well cost (lean well SW Appalachia) about $7 million, so at $1.50/MCF ($8.70/boe) about 800 kboe cumulative output over 36 months would be needed (or 4.64 BCF cumulative for first 36 months of production).
It looks like 2017 wells will be about 1.2 BCF more than 2015 wells at 36 months, so about 4.5 BCF, not quite enough for payout at low Appalachia natural gas prices, hedging might help and more natural gas pipelines might also reduce the Henry Hub to Appalachia price spread.
I know one of the darling pubco company in the Marcellus sold its gas for $.25/ mcf between 2014-2017.
If there is one company in that position there is likely more.
Did Kinder Morgan Just Kill The Oil Sands Story?
Canada’s Trans Mountain Pipeline project has been delayed due to political infighting between the government of British Columbia and the Canadian national and Albertan governments.
Kinder Morgan has announced that if this political squabbling is not resolved by the end of May, then it will cancel the project.
This is a good move for shareholders on its part despite the fact that Kinder Morgan will sacrifice approximately $873 million a year in adjusted EBITDA.
Producers in the oil sands need the capacity of this pipeline in order to execute on their own forward growth ambition.
Suncor Energy could be especially hard hit as nearly all of its forward growth depends on the oil sands.
On Monday, April 9, 2018, pipeline giant Kinder Morgan, Inc. (KMI) stated that it would cancel work on the Tran Mountain Pipeline Expansion Project if legal issues surrounding it are not resolved by May 31. This could have a deleterious effect on the Canadian oil sands growth story as the pipeline expansion would significantly increase the amount of Albertan oil reaching the west coast of Canada for export. The cancellation of this project could therefore have adverse consequences for the growth ambitions of numerous companies, including Kinder Morgan. This also serves as an example of the potentially major impact that government actions can have on numerous companies in an industry.
Hi Ron
The announcement by KMI has certainly caused a major reaction here in Canada by all interested parties and potentially a constitutional crisis. Our Prime Minister is meeting with the Premiers of BC and Alberta this weekend. The speculation is that the Cdn government and the Alberta govt. will buy into the project and cover costs associated with delays. There are challenges in front of the Federal court regarding the validity of the approvals process. The Cdn. Govt. thinks it will win. Even if it does, BC will then refer it to the Supreme Court and cause more delays.
The biggest impact on the oil sands will be primarily on the smaller players who were planning on increasing their production. The bigger oil companies, XOM, SU, and CNQ have bought space on the current pipeline system as part of their expansion plans.
As for, Suncor, below is a shortened version of an article that appeared in the Financial Post, Jan 29 2018. Note the SU statement at the end of the article.
“Fort Hills is expected to be the last major oilsands mine to be built in Canada for some time given the enormous capital costs. Companies continue to pursue smaller, steam-based oilsands projects to grow their production.
The new production from Fort Hills will be part of the 280,000 bpd of new Canadian oil capacity expected to come on stream this year, according to the International Energy Agency, exacerbating a glut of oil production that currently outstrips total export pipeline capacity. The IEA expects Canadian production to hit a record 5.07 million bpd this year.
“Western Canadian heavy crude production is growing ahead of pipeline capacity,” according to a new report by Morningstar Commodities Research on Monday that showed Canadian oil-by-rail shipments were up 59 per cent in 2017 over the previous year.
Pipeline operators have been rationing space on their export pipelines and TransCanada Corp.’s Keystone system continues to operate at 80 per cent of its stated 590,000 bpd capacity following a spill last year, which is putting further pressure on Canadian oil producers to secure railway cars to move their crude out of Western Canada.
However, Suncor says it has arrangements in place to ensure its barrels reach the market.
“We do have adequate market access for all of our production, including Fort Hills, and it’s mainly by existing pipelines,” Suncor spokesperson Sneh Seetal said. “We do anticipate a very small portion of our production would be moved on rails but that would be on an opportunistic basis.”
BC is looking out for itself—-
Do you want massive oil tankers negotiating tricky waters so a few rich people can extract profit?
Unfortunately for petro interests, Vancouver has a well educated and active populace.
Let the politically conservative populace of Alberta find another route.
They are devastating their ecosystems– let the “challenged” do it to themselves, rather than export it to others.
Yeah, Alberta and Texas are rather challenged on the economic benefits of limited resources. Though I argued with Mike over it, he is probably right. Why should we waste resources that are valuable down the road. Why export it? It doesn’t make sense. In five years, we’ll be smacking our foreheads over being so short sighted. Texas already has the logistical resources of plenty of refineries. Alberta just needs to put some money towards that. Become the Gulf Coast of Canada. If oil or oil products leak out of it, it needs to be paid with excise taxes, or Vat taxes to reimburse Alberta for their loss. In five years, you couldn’t imagine the amount of new business that could attract towards the region. Quit fighting BC, and make a silk purse out of sows’ ears.
BC is rich, and intact.
Why bring the Alberta “rape and scrape” out West?
This is some of the dirtiest oil that exists.
No it’s not. California heavy dirtier. Stop spreading your false information on environment. Trans mtn has been operating safely for 50 years.
Alberta’s Premier in one comment even said that Alberta could buy the whole project and push it through but it wasn’t clear whether that meant the doubling of capacity part or the whole pipeline. I expect it was just the current project of doubling the capacity.
Interesting results of polling on the pipeline issue in BC.
Looks like people have mixed feelings.
The poll questions were well designed to explore to the issue. Better than most.
https://globalnews.ca/news/4091648/b-c-trans-mountain-pipeline-expansion-poll/
Hi,
Here are the Bakken updates. First the production graph. Not so much to say about it except that the decline rates were very low compared to January. 2007 to 2016 together decreased production by only 4300 bopd. Production from new wells were on the other hand also very low, only 164 bopd for the non confidential ones. It was for example 400 bopd in December and 254 bopd in January. Average number of production days for those wells were around 14 days, which is normal as the average well starts production in the middle of the month. So not sure why the number was that low. I should add though that first month production is less reliable in predicting future production. Second month is better to use for that (Also note that I divide monthly production by days in month to get production per day. So twice that number gives a more accurate value for average production for the first month). Average number of production days for legacy wells did not change much compared to January. So the weather did not seem to cause much problems. Number of new wells (all ND) were 70 compared to 61 in January.
Here is the GOR graph. Most years saw an increase compared to previous month.
This graph shows flared gas rates. A bit hard to see but flared gas decreased quite a bit in Mountrail, McKenzie and Williams. Produced gas increased so maybe extra gas capture capacity was added.
And here is the graph.
Thanks!
Correction. The first month average production for non confidential Bakken wells should be 193 bopd for February, 306 bopd for January and 402 bopd for December. The first numbers I wrote includes conventional wells or possibly wells that have not yet been registered as Bakken wells.
Anyway, still very low number. The low producing wells appears to come from McKenzie and Williams. In McKenzie there were 12 non confidential wells with an average production of 180 bopd. It has not been that low since January 2013 if you exclude months where it was because of low number of production days. Williams had 9 non confidential wells and the average production was only 49 bopd! Water cut was very high too at 86%. So doesn´t look like the low production was because they restricted the flow. If I get time maybe I will look into where those bad wells were drilled.
Look at who the operators of the wells are too.
Almost all of the Tier II acreage was divested by the public firms to privately held firms.
With oil prices rising, it appears some of these smaller firms are drilling/completing wells again.
Here are the wells with very low inital production (with operator, shallow sand):
Area: ELLISVILLE, WIL
Operator: CRESCENT POINT ENERGY U.S. CORP.
Wells:
31471
31472
31669
32898
32901
Area: EAST FORK, WIL
Operator: WHITING OIL AND GAS CORPORATION
Wells:
33355
33356
33357
33367
Area: ELIDAH, MCK
Operator: BURLINGTON RESOURCES OIL & GAS COMPANY LP
Wells:
31610
31611
31612
31613
Area: SAND CREEK, MCK
Operator: BURLINGTON RESOURCES OIL & GAS COMPANY LP
Wells:
33553
33554
33555
All above wells are outside the sweetspot areas. EAST FORK is propably the best of the above areas. But it covers a big area and the above wells are in a not so good part of it. The above areas are however not so bad that they can explain the very low initial production numbers. I have however seen cases in the data of very low initial production which after a couple of months suddenly increases a lot. So a bit early to come to any conclusions.
India’s consumption growth of oil products without LPG
March 2018: +6.5% compared to March 2017
Q1 2018: +8.6% compared to Q1 2017
March 2018: approx +278 kb/day (using an overall 8 barrels per ton conversion) compared to March 2017
India – Fuel prices continue to climb aided by strong global demand. Diesel registered record high levels of Rs. 64.96 per litre in Delhi and Rs. 69.17 per litre in Mumbai.
Chart by Edelweiss on Twitter, yearly data from Bloomberg plus the latest daily price for 2018: https://pbs.twimg.com/media/Daz64YbW0AAWLOv.jpg
Edelweiss Investment Research: https://twitter.com/Edelweissonline
Port of Vancouver largest coal exporter in the world, very enlightened, yes those people of Vancouver are.
They are are not just the largest exporter of coal in North America, BC mines that coal.
http://nationalpost.com/news/politics/yes-anti-pipeline-vancouver-really-is-north-americas-largest-exporter-of-coal/amp
And, gasp from tree huggers, timber!
BC does export a large amount of timber.
Wasn’t aware of the coal — thanks for the update.
I fly fish Northern BC for steelhead (Skeena).
But strange– I’ve never seen this in BC:
https://amp.businessinsider.com/images/4fb5280a6bb3f7fe7e00000c-750-563.jpg
https://biv.com/sites/default/files/styles/media_image/public/2017-12/echo_hill_coal_mine.png?itok=1hnheDNV
Yup
That’s coal, and from the image, minor.
You can actually see the vehicle.
If you look closely, the vehicle is going into a cave. So, I guess that is better, unless you have to work in the cave.
Copper mine, not so small
http://img690.imageshack.us/img690/9827/highlandvalleycopper200.jpg
Vancouver is quite proud of the mines:
http://www.mining.com/top-10-british-columbias-biggest-mines-87979/
Strip coal mine, not so minor
http://1qb1ow3qfudf14kwjzalxq61.wpengine.netdna-cdn.com/wp-content/uploads/2015/09/lenz-6743.jpg
But these pictures are prettier than the one you showed, so I can see why they wouldn’t want a pipeline messing up the landscape. Could clog up logging routes too.
http://www.mining.com/worlds-mining-capital/
But, anything is better than an oil spill.
https://amp.theguardian.com/environment/2014/aug/13/mount-polley-mine-spill-british-columbia-canada
The final paragraph exhibits classic altruism.
Nice poost
Guym,
What is your source for “largest coal exporter in North America”?
http://www.nrcan.gc.ca/energy/facts/coal/20071
According to the above link Canada produced 61 million tonnes of coal in 2016 and exported about half.
US coal production was about 660 million metric tonnes. about 55 million metric tonnes of coal was exported in 2016, almost double Canadian exports.
Data from EIA (imports and exports) at link below.
https://www.eia.gov/coal/data.php#imports
Exactly. Also public opinion is for the pipeline or neutral. You are hearing a vocal minority. Paid protestors. Also American oil industry funding protests etc as it’s beneficial to them to keep Canadian oil at a discount
Paid protesters – sure thing buddy.
It is well documented that ads on Craigslist seeking DAPL protesters offerred roundtrip airfare from continental US to Bismarck, $1,500 sign on fee, and $19/hour were online for several weeks that spring.
One of the bigger motivations for the harsh sentencing for arrested trespassers/vandals was to be able to induce plea bargaining so as to ascertain sources of funding.
This is one reason the RICO parameters were invoked by the pipeline builder in their ongoing lawsuit to target the criminal funding of this operation.
Of course, the hundreds of thousands of dollars ‘donated’ to the Standing Rock tribe by wind power companies at the time of the protests (all public knowledge and viewable from online sources) are another matter entirely.
You, Mr. Hren, may be surprised, at the backers of many of these obstructionist movements as they not only include hydrocarbon producing countries (Gasland was partially financed by Qatar, as the early version credits showed), competing industries, and intra-industry factions wanting someone else’s ass gored to protect their own operations.
Should you expand your thinking, read data put forth from an array of sources, be honest in your own as well as the broader body politic’s motivations, you may find a shocking degree of jockeying, manipulation, and self serving that is not limited to any one faction … most especially one’s own, whatever that may be.
Good start is both discovering and sharing the funding sources for the Sea Change organization.
Love to hear your anticipated results.
This comment by “coffeeguyzz” is about the funniest thing I’ve ever read.
… and when one of the self acclaimed high IQ posters responds in thus fashion, what possible hope can be held out that reputable discourse is achieveable in these affairs.
A few minutes (hours?) of googling can verify all that I have posted … and much, much more.
“People believe what they wish to believe” was the quote noted by Mr. Patterson long ago that sparked my active interaction with this site.
Actually, Sir Frankie Porkchops’ quote is but one of several over the ages that highlight how limiting other-than-rational/computational components of humans actually are in real life situations.
Again, we all are immersed in a 24/7, intense information war that is ill served by ideological blinders confirming our most grotesque inaccuracies.
“self acclaimed high IQ posters”
Keep punching down. That’s what you guyzz do.
Ah, from someone never there—
You actually need to have been gassed and clubbed several times, then the delusions start to disappear.
“Paid protesters”. Hah! Keep drinking that Fox Kool-aid.
In the case of British Columbia, a large majority of the citizens do not want to the risk of having a large additional oil transport scheme going through the coastal environment that they cherish. This isn’t some radical notion, just ordinary people.
That’s what I thought. They are ordinary folks and he is projecting as if they are some powerful cabal. Trying to make it look like he is punching up instead of punching down. That’s the typical ploy.
I’ve been tear and cs gassed on three Continents.
Never got paid a dime– what did I do wrong?
It’s not a large majority, your wrong.
What you’re claiming is “well documented” is in fact… outright false, made up from the whole cloth by lying propagandists.
You might want to spend more time doing your homework and looking into the outlandish claims you read on the Internet or hear on Fox News. You’re being lied to. Don’t fall for it.
I live along a route many DAPL protestors took to get to the protest camps and such. I doubt many of these folks were being paid. Most didn’t seem to be the types motivated purely by money. For the most part, they seemed to be radical leftists (a.k.a environmentalists) accustomed to being on the fringes of society but desperate to rally behind a cause and in need of attention/fitting into a group.
I likewise knew and have reputable first-hand accounts of the protests like the Dakota pipeline, how the protesters were sprayed with water hoses when the temperature was well below freezing, living in the snow in tents with no heat. Since most Americans won’t pick produce, clean hotel rooms or any of the other various manual labor jobs for which we require immigrants, I find it difficult to believe that anyone would be paid to put up with such conditions.
I’m willing to believe there is dirty money in such things as documentaries like Gasland, I’ll check that out. But how much money would you have to be paid to be sprayed by a water hose in sub-freezing weather, and then go try to dry off in a tent covered in snow, Mr Guyzz? I’m guessing it would be a damn lot of money. You are impugning the motives of brave men and women who risked death to protest against something they believe in with the core of their being. Consider how insulting that might be.
Well said Stephen.
Mike,
Some of the replies point out that coal that’s shipped out of the port near Vancouver is mined in BC, but that port is also exporting coal from the Powder River Basin in Wyoming. That coal is carried by rail all the way to the Columbia River along the southern border of Washington, barged downriver to near Longview, and then put back on rail to go north across the whole state (Washington) to cross the border into BC. Those are unit trains, and very long. They go right under downtown Seattle through the train tunnel. The coal cars are uncovered, one reason for protests along the route.
Mike,
See
https://www.sourcewatch.org/index.php/Coal_terminals
Biggest existing export terminal for coal is in Australia at 120 million tonnes per year, the BC export terminal may be the largest on the west coast of North America that currently exists and is expanding to 29 million tonnes per year, there are a couple of east coast export terminals in Alabama and Virginia that are larger (68 and 48 million tonnes per year capacity).
Ok Dennis, thanks for the correction. Just trying to point out the hypocricy of some of those living on the lower mainland and the island.
It’s an interesting point. BC does have a lot of resource extraction industries, which makes you wonder. After reading about it, here are a couple of thoughts:
1st, the people who are happy with BC coal are probably not the same people as those objecting to the oil pipeline. I’d bet that if you asked the pipeline protestors, they’d tell you that they’re also not so excited about coal exports.
2nd, even if they were, they might not be hypocritical: part of the objection to the pipeline is that the benefits go to producers in Alberta and consumers outside Canada, while the risks go to BC. That’s not true of the coal, which is mostly mined in BC (and I think there are indeed people protesting the coal which is just passing through BC, which would be a consistent application of the idea that risks and benefits should accrue to the same people – certainly as noted above there are people living next to US coal delivery routes who are objecting to coal passing through).
We always debate the global peak. But there are many other peaks which impact on geopolitics:
14/9/2015
Syria peak oil weakened government’s finances ahead of Arab Spring in 2011
http://crudeoilpeak.info/syria-peak-oil-weakened-governments-finances-ahead-of-arab-spring-in-2011
Its the 2nd shale revolution!
https://www.mrt.com/business/oil/article/Second-shale-revolution-is-on-the-horizon-12832892.php
Or is it the 3rd?
Im so confused.
I have a little experience with EOR. None of these dreamers have any idea of the complexity, cost, and operational issues associated with a successful and economic CO2 flood beginning with the effort to negotiate and implement field wide unitization.
How can a large scale Tertiary LTO project be implemented in Texas without a field wide unitization?
Does that skill set even exist in Texas or anywhere else in the industry today?
With the decline rates of LTO, there simply can’t be enough time to execute a field wide unitization.
They are not as close as advertised, I don’t believe. EOG has it working (not CO2 but gas) in the Eagle Ford. It works, because the shale has some hard boundaries. It doesn’t equate yet to the Bakken, because there are no firm boundries. Permian is much worse for boundries. You can blow gas and it will wind up in the next County. I’m talking about the two large plays with multiple levels, but it could have .a possibility on some of the upper levels
GuyM,
I was told by one the Permian’s tertiary experts that EOG used ethane in its Eagleford Tertiary project because the had so much of it they couldn’t get rid of it otherwise.
I have a lot of respect for EOG because it is,in my opinion, extremely well managed. I have long considered it the Walmart of drilling. Most of the time EOG can drill wells, cheaper, faster, and better than any other operator I am aware of.
But, to my way of thinking a “pilot EOR project” is not the same as a scalable project that delivers a return on investment.
In the Permian, a successful EOR project is preceded by a successful waterflood project. The water flood project is operated on the basis of a previous field wide unitization agreement and operations agreement that is negotiated between many operators and sometimes hundreds of royalty owners. Most of these were negotiated in the 40’s, 50’s and early 60’s when royalty owners where much less litigious and trusting. I don’t think it could be done today without force pooling or “forced leasing” as I view it.
Then, CO2 has unique properties to combine with oil and water and change from a gas to become a miscible fluid that can sweep through a formation. When the miscible fluid of oil water and CO2 is produced then it is separated into its components and the oil is sold, the water is disposed of and the CO2 is re-injected. All of this requires a tremendous investment in wells, gathering systems and procesing plants. And those skills don’t grow on trees.
I haven’t heard or read anything about ethane’s properties to replicate CO2’s performance in a reservoir. If anyone knows anyhing about the ethanes properties, I would like to hear about it.
Generally speaking, it’s takes about 8 years for a “conventional”EOR project to respond to a CO2 flood. The projects are long term, capital intensive and have generally lower rates of return and longer payout terms than conventional wells or waterfloods. I recognize that these factors are attributes shared by all unconventional LTO projects.
However there is one really significant difference between LTO and EOR ….and that is a EOR project is a huge cash flow generator once it responds to a flood and achieves payout. And, the cash flow lasts for years and years.
Ok, that one is way more than anything I have heard of. Waterflood shale? How much water would that take in this size of field(s)? This area does not have much water to speak of. I suppose if you could, that would supply the barrier. Pretty complicated. How much additional percentage are we talking about?
If it takes eight years, then much of the area would no longer be held by production? And if they decide to go unleased, the attorneys will be drooling over that one. In Texas, there is no extra penalty that can be deducted by the operator, only the percentage cost of the well, and no overhead. Pretreating expenses, especially non-authorized, have not gone to court, as far as I know.
GuyM,
Under a field wide unit agreement, operations anywhere in the unit hold acreage.
I’m not suggesting a shale “water flood” as a precursor to a shale EOR. But as far as I know all successful CO2 floods were preceded by a successful water flood. I have no idea what it would take to have successful LTO EOR project on the scale of even an average economic CO2 project.
At least we have many comparable analog projects with CO2 EUR which we can compare EUR projects . LTO EUR? I don’t know.
Are they even comparable on anything except capex requirements?
Typically, a starting CO2 flood has a 98% or so water cut. I’ve also been told that you have to have around 80 mm BO/ left in place to justify a CO2 project. So you can do the math to see how original oil in place existed with primary production. And that is with a God given “real” reservoir.
I suspose time will tell on all of this. “It’s not bragging if you do it” is an oft attributed football quote (was that Don Meridith?)
“ Except I shall see in His hand the print of the nails and put my finger in His side, I will not believe.” Which well characterizes my opinion on LTO EOR.
If only I could be a true believer in LTO; “blessed are they that have not seen and have believed.” John 20. 19-34
Perhaps if EOG or any other LTOcompany-presents presents a project at the next CO2 conference (www. CO2conference .net) for peer review or bragging rights, then we will know. Until then…..
Field wide unit agreement is not a Texas legal term. Are you talking about forced pooling and field unitization? In Texas, they can drill with a certain percentage, but can’t force a lease. If under that, they don’t drill on your property, you have lost out. If they drill on your property, your still unleased.
Crescent Pointe has been pushing a water flood type approach in their Canadian operations for years.
They anticipated adapting this to their North Dakota wells, but said a number of regulatory hurdles would need to be addressed.
They were implementing closeable sleeves in their completion hardware for better pressure/water control.
The folks at the EERC in North Dakota continue to do a great deal of research on LTO EOR with the somewhat surprising finding of the effectiveness of ethane as an injecting medium.
Core Labs had recently been involved in an experimental pilot test in the Bakken using an undisclosed, proprietary gas mix for a huff and puff attempt, but I’ve not read of any results.
90%+ of remaining LTO oil will most definitely not be left behind.
Coffeeguyzz,
And how do you know 90% of OOIP will not be left behind?
If it costs $1000/b (in 2018 $) to produce in 2025, it will be left behind, you can take that to the bank.
Basically the USGS median TRR estimate for the Bakken/Three Forks is about 13 Gb and the median OOIP estimate (Leigh Price) is about 413 Gb.
So recovery is expected to be about 3.4% of the mean OOIP estimate, implying that 96.6% of the oil will indeed be left behind.
Range of OOIP estimates is 271 to 503 Gb and for Bakken TRR 8.5 to 18 Gb (USGS 95% confidence interval) so the recovery factor range (95% confidence interval) is 8.5/503=1.7% to 18/271=6.6%, with a mean of 3.4%.
And “field” gets pretty complicated, here. EOG has its efforts in EOR pretty guarded. They are not exactly the “sharing” type. What they have said about it, is that it works well when there are multiple wells fairly close. Most people assume it’s a huff and puff, but EOG says nothing. For all I know, they may go out in the middle of the night to work on it with their ninja suits.
Field wide unit agreements are most certainly legal recognized legal terms and documents.
I said that new field wide unit agreements would not be possible w/o force pooling which I equate to “forced leasing”. And if you don’t think industry is trying to accomplish this in Texas then you are very uniformed.
I refer you to the dollar hide unit agreement, the Yates field agreement, the Mi vida field unit agreement, the east Texas field unit agreement and many many other.
I don’t know what you are using for a reference agreement but I assure you these agreements have and are commonly used to day because they are still producing. Any company Landman, engineer and geologist should be able to tell you about field wide unit agreements. Likewise any joint interest accountant should be very familiar with these agreements and be able to steal his annual salary via a unit JIB COPAS procedure. Not picking on accountants. Any pumper should be able to steal his salary as well.
Poor choice of words, sorry. And I had to steal back my income with a good attorney from the landman, so I know how that goes. From that point on, any dealings with the oil companies would only be done with an attorney. Trust in the oil business is for those that want to wind up poor.
John
Over the past several years, the Williston Basin Petroleum Conference has several technical papers on LTO EOR.
Steven Hawthorne, from North Dakota’s EERC, has several brief, graphic rich presentations touting their work involving ethane.
I am not a technical person. So maybe someone can explain how water or CO2 would move through solid shale from the injection well to the producing well.
Further, as for water flooding, keep in mind that this makes operations much more expensive.
For example, old (5+ years) Bakken wells tend to produce 10-40 BOPD and a similar amount of water. These wells are rod pumped, and do not pump full time. This makes operations somewhat manageable. Not as much rod wear, not as much stress on the down hole pump, less electricity and down hole chemicals.
OTOH, if water flooding would work, there would need to be a large source of “make up” water. Large injection pumps would be utilized to pump the water down the injection wells into the producing zone. I assume this would need to be at very high PSI given the depths and that the formation is not so pourous shale. The producing wells would pump full time, more strokes per minute as they would now be producing more water. More wear and tear.
Of course, economics would depend on oil recovery rates. I assume those rates would need to be high, given all the infrastructure needed, as well as the increased operating expenses.
I have no experience with CO2 flood, other than I do know the infrastructure, CO2 and operating costs are generally higher than waterflood.
What are some examples of deep onshore CO2 and/or water floods? Thinking deeper than 7,000’ TVD?
SS
The February 2016 AOGR has a brief description of the historical EOR in the Bakken with a highlight on the differences between conventional and LTO.
Crescent Point has a brief description on their waterflooding on page #28 on their recent presentation.
Granite Oil describes their ongoing EOR in the Viewfield Bakken using re-injected field gas.
Best descriptions are Hawthorne’spresentations clearly describing miscibility issues versus flooding through pre-existing fractures by using ethane.
A year or so from now, we may learn whatt Bakken operators are doing with 2017/2018 wells as 2 things are clear …
Initial output now regularly exceeds 50/60 thousand barrels first full month, with high production running 4 to 6 months out.
Second, the produced water over first several months approaches or exceeds 200,000 barrels. This is about 10 times the historical norm which would indicate that operators are maintaining elevated formation pressure via the injected water and are slowly ‘producing’ it along with much higher hydrocarbon recovery.
There has been no detailed discussion on the specifics in this matter.
Coffeeguyzz,
If we consider actual data from shaleprofile.
In 2017 the average North Dakota Bakken/TF well produced about 18,000 barrels in its first full month of production, about 3 times lower than you claim.
First 6 months for average 2017 Bakken new well was 97,000 barrels or about 16,000 barrels per month, by month 11, output of the average 2017 well (6440 b/m)had fallen below the average 2016 well (6930 barrels/month.) By month 20 the level of output of the average 2016 well falls to the 2015 well level, and by month 30 the level of output of the average 2015 well has fallen to the level of the average 2014 well.
From 2014 to 2017 there might have been an increase in EUR of up to 70,000 barrels, though it is possible that after month 20 the newer wells may fall below the output of the older wells in the “tail” months, as was the case for the 2014 wells compared to the 2010 wells after about month 36.
Newer wells may have higher initial production and lower output later.
Dennis
I do not have the time to clarify, not to refute, the points you have made … but your reliance upon averaging via Enno’s fine site can grossly distort specific developments in both North Dakota and the Appalachian Basin.
Not only is there great heterogeneity in geology, different companies employ widely varying operational procedures for a whole host of reasons.
To use averaging can be an accurate, yet wildly misleading metric when one includes short, shallow wells in northwest Pennsylvania by Hilcorp, the shrinking oil window in Ohio, with the prodigious monster wells in Susquehannah, Bradford, and Washington counties.
Likewise, the numbers I quoted above are verifiable from the monthly ND production reports if one chooses to slog through the near 300 page reports.
It is a fact that Oasis, Continental, and Marathon – at least – are now producing wells in excess of 50,000 bbl first full month using 60 to 80 stages and accompanied by a shit ton of produced water.
Again, go to Enno’s site and see what is happening in Susquehannah county, in Greene (with its high NGL content).
Now, glance at recent developments in Armstrong, Westmorland and Allegheny counties.
When one lumps all these numbers to get an average, the disparities – and consequent distortions – should be readily apparent absent a more granular perspective.
Averaging things for analytical and presentation purposes can be very instructive, but interpretingg this view as reality will lead to erroneous conclusions.
what a feakin great reply, Coffee. I think Dennis and others try but they just do not understand why you are so correct. They are always a year or two behind the curve and not KNOWING what is going on “at the front line” so to speak. From my very first post here I tired to understand just why so many people could not or would not grasp the actual facts that are so apparent to those of us who do the detailed work vs relying on as you say “averages” of old data and then trying to make projections in the future based on that. Thanks again for the terrific post.
Coffee,
I think I get your point about “averaging “ outcomes for analylictical and presentation purposes. I think I understand that certain outcomes are indisputable facts. But I have no idea what you mean by a “granular perspective”
Do outcomes/facts have any relationship to probability?
John
Over on that now-discontinued site, Oilpro, an industry professional took a single cohort from Enno’s site (I think it was a 2013 start, 3rd quarter Bakken), and then projected EURs of something like 132,000 bo per well for all unconventional production.
He asked anyone if this could possibly be accurate.
I attempted to respond by saying the wells started in 2013 in the Bakken still contained HBP efforts in – at that late stage of the land grab – more marginal acreage and also did not represent the more productive sections of the Bakken.
The individual did not seem particularly receptive to that information.
Likewise, with the Appalachian Basin, (an area to which I have applied considerable time in recent years).
It is huge, with figures thrown about ranging from 70,000 to over 100,000 square miles (the lower range the size of North Dakota, for comparison).
Enno’s general presentation does not differentiate from shallow Utica (primarily NW, Deep Utica, the several formations comprising the Upper Devonian (including the Genesee, Geneseo, Burket, Middlesex, Rhinestreet, amongst others), and the various areas of the Marcellus that show enormous differences in production profiles.
For these and other reasons, (jockeying pipeline access/pressure being only one), it can be challenging to figure out exactly what is going on there … and my previous description only applies to Pennsylvania, not Ohio (mostly, but not entirely Utica), and West Virginia.
WV has enormous potential but their pooling/leasing framework has been cumbersome.
All in all, the vast spread of dynamics can make a homogenized presentation, averaging, in this instance, highly problematic.
Geez guys.
Our 3 BOPD well that produces one 60 barrel tank of water per month is still going strong. If we do not have to pull it this year it will have Saudi like LOE of around $3 per BO.
OTOH our 6 well lease that just makes 2 BOPD and about 500 BWPD still costs almost $50 per BO in LOE, haven’t found a way to get that lower and it was a loser 2015-2017. Maybe will be net positive this year with higher oil prices.
Yes, there are very strong wells in the shale fields, and of course there are duds.
Enno Peters has given us all a wealth of information for free. No need to do anything other than just look at his site.
I find I look at it less than I used to, for the mere reason of selfishness. My quest was out of fear shale was feasible below our LOE per BO. 2015-2017 proved to me it isnt. Not seeing anything yet that makes me think US LTO can thrive below $40 WTI. The shale guys can blow all they want, but $40 WTI would still put the hurt to them, just like it did recently. $60s WTI has given me peace. Hope nothing screws it up.
Hopefully now that oil prices are decent, these shale guys can start paying down some debt. Lol.
Coffeguyzz and Texas tea,
I am using the average of the 2015, 2016, and 2017 well data. The producers will focus on the best areas and cherry picking the best 1% or 5% of wells drilled does not give an accurate picture.
There will always be a distribution of well productivity, using the average well gives a much more realistic view.
Shale profile includes all the horizontal wells drilled in North Dakota (about 98% of the wells completed in 2017 were in the Bakken/Three Forks play).
Texas Tea has suggested using 3 years of data to get a decent hyperbolic well profile, which would suggest wells completed before Jan 2015 (the 2014 wells in Enno Peters data set).
Also note that by the look of the well profiles it appears that the higher output in the first 36 months for 2015, 2016, and 2017 months will lead to lower output from month 36 to month 180 relative to earlier well profiles (such as 2010).
Chart below from
https://shaleprofile.com/index.php/2018/03/22/north-dakota-update-through-january-2018/
click on chart for larger view
Coffeguyzz,
From 2008 to 2013 the average North Dak0ta Bakken/Three Forks well has had an EUR of about 325 kb+/-25 kb (some variation year to year). Recently (2015-2017) there has been some increase in early output over the first 24 months of output relative to earlier wells, but the average output seems to fall below the average 2008-2013 well) after about month 24 so any increase in overall EUR is likely to be small (maybe 10% or so) though we can only guess about the future output of these newer wells from 2015 to 2017. Some reservoir engineers have suggested the high early output may be balanced by lower output in the tail with little change in overall EUR. (These folks have commented over at shaleprofile.)
Mike Shellman and Fernando Leanme (both of these guys may have forgotten more about the oil industry than most of us will ever know), have also implied this might be the case. Though it’s possible I may have misinterpreted their hints.
Dennis
I would need to go back and re-read much of the early history (2005-2012) of the Bakken lest I misspeak. E.g., the hundreds of 17,000 foot AB laterals in 2018 are actually closer to 30 or 40).
The book ‘The Frackers’ contains a lot of this info.
The 2008-2010 Bakken wells were generally drilled in the very best rock in the state by the likes of Hess, EOG (Parshall) and a few others.
While being in the very best areas, they were completed with standards considered primitive compared to today’s completions.
During the land grab phase leading up to 2013, the mad rush to drill over thousands of square miles in the 36 month window of the leasing agreements led to many consequences, including – but not limited to – enormous debt, far flung development in somewhat marginal areas, improving – yet still sub optimal – completions and drilling (targeting) .
To look at the production history of these wells and extrapolate 25 years down the road may be a somewhat inappropriate take on the situation due the the highly dynamic nature of evolving technologies.
I get a kick out of comments deriding technological advances from folks who do not have a clue about what diverters are, their use/effectiveness, as well as ongoing improvements.
And diverters are only one of several components that are being used now but not back in 2012.
Some of the published techniques on re-frac’ing are intriguing, but show mixed results.
It was a short time back when ATW in ND was in the teens, and expansive innovation was not a priority.
Should you look at data from Enno’s site 5 years out, in, say, 2023, I would not be surprised to see vastly different profiles for many of the wells, including the earlier ones that will have been re-worked.
90% PLUS of those remaining hydrocarbons will NOT be left behind.
… and you can take that to da bank.
Coffeeguyzz,
So what’s your expectation for Bakken URR?
Let’s take the median estimate for OOIP for the Bakken/Three Forks of 400 Gb.
You expect a recovery factor of more than 10%? So more than 40 Gb of URR and the USGS estimate is too low by a factor of 3?
Do I have that right?
We will check back in a few years and see if my estimate for the North Dakota Bakken Three Forks (URR=10+/-2 Gb) or your estimate (let’s call it URR=40+/-8 Gb) is closer to the truth.
Shallow, I’m not aware of any deep CO2 floods. Think 7000, feet is about the limit but I can’t tell you why.
John. Thanks.
I guess it would be helpful if we knew what wells in the shale basins are under secondary or tertiary recovery.
With shaleprofile.com, we could just look them up.
I assume we will be advised by company press release if there is a verifiable EOR breakthrough in the shale field(s).
Coffeeguyzz
Thank you. I might go look for that stuff but I’m not really interested in the Bakken. If EOG or someone else tries a LTO EUR project in the Permian then I will try to follow it. Other than that I plan to follow the EUR experts I know I in the Permian Basin.
Any estimate of how much EOR LTO oil has been produced?
Pretty sure production to date has been negligible.
Probably not economically viable at less than $200/b in 2018$.
Yes, and the shale companies are still going BK http://www.haynesboone.com/publications/energy-bankruptcy-monitors-and-surveys:
Getting closer to the time we see how Feb matches up for US production. The end of Jan showed monthlies at 9964. Weekly as of March 30th showed 10.460. That’s 496k in two months. Just a tad unbelievable, but we will see soon.
GuyM
I’m sorry to hear about that. Most company Landmen will say anything to make a deal and then throw the lease in a file and never look at it again. There are a lot of bad apples out there. I’m fortunate, my clients/partners and I have operated on a handshake for the last 20 or so years. They would rather die than go back on their word. I believe likewise and try to live exactly the same way.
My world is pretty small these days but I couldn’t be in better company.
EOG: Another perfect example of what’s horribly wrong with Shale Energy Production.
EOG net Free Cash Flow 2009-2017 = -$8.7 billion
EOG Long-Term Debt 2009-2017 = +$3.3 billion
EOG Asset Sales 2009-2017 = +$3.6 billion
EOG net Issuance of Stock 2009-2017 = +$900 million
The reason EOG has been able to produce sub-par, low-quality and unprofitable shale oil and gas is due to management’s ability to increase debt, asset sales, and the issuance of stock.
Now, some may think Pioneer Resources (PXD), is doing an even better job financially because they are the number producer in the Permian. NOT SO… Pioneer is another disaster in the making.
PXD net Free Cash Flow 2009-2017 = -$6.2 billion
PXD Long-Term Debt 2009-2017 = -$500 million
PXD net Asset Sales 2009-2017 = +$1.3 billion
PXD net Issuance of Stock 2009-2017 = +$5.2 billion
——————-
What we have here is that these two energy companies utilized different means to produce unprofitable, low-quality and subpar oil and gas. While EOG focused mainly on increasing its Long-term debt and asset sales to offset its negative free cash flow, PXD took advantage of its high stock price and swindled $5.2 billion by issuing more shares to poor slob investors who can’t read financial statements.
I imagine the U.S. Shale Oil & Gas Ponzi Scheme will continue for a while until the next ENRON event occurs and investors run for the exits.
steve
You do know what the “E” in EOG stands for?
It appears that EOG originally was Enron Oil & Gas Company, spun-off in 1999
http://www.eogresources.com/about/company_history.html
Enron Corporation spun off Enron Oil & Gas which went on to become the publicly-traded EOG Resources. The company was completely and undeniably separate from the parent at the time of the parent’s bankruptcy. EOG was actually one of the earliest developers of the Bakken, and in more recent times has been using knowledge gained in the Bakken elsewhere, such as the Niobrara of Wyoming and Colorado. EOG is very highly regarded in the industry, both as an innovator and workplace.
(In the interest of full transparency, I have owned EOG shares for several years.)
Oh dear.
Well, you’ll lose all the money you have in those shares, unless you sell them quickly enough. I don’t know whether you’re a decent person or not, so I don’t know whether I want you to lose your money or not, but you will lose it either way.
Trying to put numbers on the Permian pipeline capacity constraints
Citi bank expects as much as 200 kb/day of Permian volumes restricted in 4Q. Rail and truck takeaway capacity constraints continue, pipes below nameplate capacity. Could potentially put ceiling on S-T Midland output – Bloomberg reporter
Rail cost is $6-8/barrel. Trucking cost is three times the rail cost according to Marty Hogan of Platts.
Enterprise Products Partners L.P. (EPD) today announced that its 416-mile Midland-to-Sealy pipeline is now in full service with an expanded capacity of 540,000 barrels per day (“BPD”) and capable of transporting batched grades of crude oil and condensate. With the completion of incremental tankage, as well as infrastructure and operating enhancements, the pipeline has an expected capacity of 575,000 BPD which is expected to come online in May and is fully subscribed under long-term contracts.
https://finance.yahoo.com/news/enterprise-begins-full-midland-sealy-120000623.html
That’s already on most charts, initial started first of 2018. But it’s still darn confusing. The discount decreased, so it is obviously helping.
Actually, that’s a good article, it’s a bigger deal than I first read about.
https://mobile.reuters.com/article/amp/idUSKBN1FK2KO
The first read was from Genscape, when they said it would be increased from 330k to 450k by June. The article above indicates it could be expanded over 500k.
This article indicates it is already accomplished. Adding over 200k to capacity.
https://www.oilandgasinvestor.com/enterprise-begins-full-service-midland-sealy-pipeline-1695811
So, now, the pipeline and local refinery capacity has to be a little over 3.4 million, not including rail.
So, now, just considering oil, they could hit your 800k level, Dennis. That is, if they could load and ship 400 tank cars a day. Hate to be stuck at that railroad crossing. Now it’s just getting around the gas problem.
Guym,
Without any pipeline constraints (oil or NG) I expected initially about a 600+/-120 kb/d increase in Permian basin output, basically this is about 60% of my US estimate for C+C output increase in 2018 of 1000+/-200 kb/d.
Much depend on oil prices, the estimate above assumes Brent oil prices reach $80/b (one month average) in 2018$ some time before Jan 2019.
Higher prices are likely to lead to the higher US C+C output estimate (1200 kb/d increase in 2018) and lower oil prices a lower US C+C output increase of 800 kb/d.
Maybe the natural gas will be flared if pipelines are full, I don’t know the Texas RRC rules on NG flaring.
At the end of 2017 the DPR has Permian output at 2.9 Mb/d, my assumed 600 kb/d increase in 2018 would bring this to 3.5 Mb/d, for May 2018 the DPR estimates about 3.2 Mb/d of Permian basin output (they usually are a bit on the high side).
With about 3.4 Mb/d of current pipeline and local refinery capacity only 100 kb/d needs to go by rail.
For May 2018 the DPR estimate for Permian basin natural gas is 10 BCF/d, I am not sure what current natural gas pipeline capacity exists in the Permian basin.
The piece below seems to project a natural gas pipeline shortage near the end of 2018.
http://www.ogfj.com/articles/print/volume-14/issue-9/features/permian-gas.html
That’s 9/2017.
Guym,
It’s the most recent I could find for natural gas pipelines in the Permian.
Do you have more recent data for natural gas pipelines in the Permian basin?
Nothing in detail, just projections that sales will be zero to negative at times by summer. That’s tight.
Citi bank and Bloomberg give the same quality of news as tabloids. Genscape would be the best source, as they get paid by companies to track these issues. Unfortunately, they require a paid subscription for their services.
I’m guessing from what I have read of two previous articles that they are against the wall on 3.175 of pipeline and local refinery capacity. Rails and trucks are probably being used now, but the capacity there is limited. 120k to 150k additional capacity is due online sometime in June. After that, it’s second quarter 2019 at the earliest. The 3.6 million in Regional capacity won’t get it to market, as it includes tie ins from different areas. E&Ps won’t report these problems, as it’s bad news for stock prices.
In short, production is probably half of what EIA is reporting in their weeklies. My guess.
Guym,
If the DPR estimate is correct (it might be 100 kb/d too high) and your estimate for pipeline, rail and local refinery capacity is correct (I think about 3.4 Mb/d). Then the Permian may hit capacity constraints by mid year (July probably.) The picture remains a bit fuzzy as I don’t have access to the Genscape data.
Genscape “Permian has 3,175 kb/day of pipeline and local refinery capacity”
The EIA’s DPR estimates Permian oil production at around that level in April
Permian chart https://pbs.twimg.com/media/Da6FrOFX0AAS8P6.jpg
DPR will be updated today https://www.eia.gov/petroleum/drilling/#tabs-summary-2
The EIA has decreased its estimate for February’s US production number by 180 kb/day
STEO (April report) 10,120
STEO (March report) 10,300
Weeklies, average for February: 10,290
Genscape Permian Production February, over 3 million b/day
Chart: https://pbs.twimg.com/media/DWlaFpfVwAAAZz3.jpg
Genscape Twitter Account: https://twitter.com/genscape
That would probably put my estimate of half of weeklies close. It looks like part of EIA has gotten the memo.
2018-03-28 (IEA) Ultimately, Permian and Eagle Ford takeaway capacity is likely to become insufficient by mid-year, with a deficit possibly reaching as much as 290,000 barrels a day during the first half of 2019.
http://www.iea.org/newsroom/news/2018/march/commentary-infrastructure-investments-key-to-unlocking-more-us-oil-supply.html
2018-04-16 EIA Drilling Productivity Report
Permian forecast
April: 3,110 kb/day (revised down from 3,156)
May: 3,183 kb/day
https://www.eia.gov/petroleum/drilling/#tabs-summary-2
Don’t know why they even bothered with this chart. They show both the Eagle Ford and Permian pipelines, and the just show Permian production.
Guym,
Note that the chart above says “LTO output”, the DPR gives “Permian region” output which includes about 560 kb/d of conventional output, though for Dec 2017 the EIA tight oil estimate is about 3400 kb/d for Eagle Ford + Permian basin, so the IEA LTO estimate fro Permian and Eagle Ford is about 400 kb/d too low for the start of 2018.
Who’dve thought the IEA would underestimate?
Scotiabank Commodities Outlook (Q2 2018)
http://www.gbm.scotiabank.com/scpt/gbm/scotiaeconomics63/commodities_outlook_2Q2018.pdf
From above: “The oil outlook has firmed and WTI crude prices are now expected to average $65/bbl in 2018 before rising to average $68/bbl in 2019, a roughly 15% increase relative to our January outlook”
They don’t mention how much oil is still without pipeline capacity?
2018-04-16 (Platts) Enterprise Products will add an additional 35,000 b/d of new capacity to its Midland to Sealy, Texas, crude pipeline in May, taking its total throughput to 575,000 b/d, the company said Monday.
Pipeline capacity is currently constrained out of the Permian, reflected in wide price discounts for Midland WTI crude. Midland WTI is averaging at a $4.33/b discount to Cushing WTI so far in April, compared to a 93 cents/b premium in January, S&P Global Platts data shows.
WTI Midland moved higher on the news of additional takeaway capacity Monday. WTI Midland was assessed at a $3.70/b discount to Cushing WTI, up 35 cents/b on the day.
https://www.platts.com/latest-news/oil/houston/enterprise-adds-new-capacity-on-midland-to-sealy-10364245
Using old Genscape reports as a basis, that adds a little over 200k a day to capacity. Read my comments and references above. Pipeline plus local refinery is now probabably a little over 3.4, if this pipeline pans out. Relief for awhile. Nothing reported in the works until third quarter 2019, but I am sure they will speed that up. This one was not supposed to come online until June, but already going with increased capacity.
Venezuela looks to be entering the end game.
https://uk.reuters.com/article/uk-venezuela-oil-workers-insight/under-military-rule-venezuela-oil-workers-quit-in-a-stampede-idUKKBN1HO0HW?feedType=RSS&feedName=topNews
Thanks Lightsout,
Good piece. I hope things work out better for the people of Venezuela.
On the political front.
http://www.bbc.com/news/world-latin-america-43241884
and
https://www.nytimes.com/2018/04/14/world/americas/nicholas-maduro-mike-pence-venezuela-summit-of-the-americas.html
Maybe a military coup and a re-establishment of Democratic institutions is the only answer.
It is doubtful that the May 20 election will be free and fair, basically Maduro just throws anyone who is a threat in jail, it’s amazing the military stands by as the National Assembly is replaced with a rubberstamp legislature which just does Maduro’s bidding.
Dictators of Maduro’s stripe, and that’s what he is, a dictator, make their number one priority the control of anybody and everybody who has a weapon. It goes past control, it also extends to personal loyalty to the leader, based on the practical consideration of self preservation.
It’s always easy to find high ranking corrupt military officers and cops to put in charge, at first a few, then more, and finally all the better ones are purged. Lower ranks are controlled by the fact that their families continue to have food, medicine, electricity, and such freedom as is allowed anybody. They know that if they step out of line, they and their dependents and friends will pay a very high price.
The opposition is generally without weapons, other than moral weapons, with which to fight back, until things get so bad that they are eventually able to start smuggling in some, with help from people from outside the country.
These things don’t come to pass overnight. It’s taken years and years for Maduro to put his henchmen in positions of power, and he DOES have a substantial portion of the people of the country still behind him….. people who know him as being the enemy of the PREVIOUS government that oppressed them for as far back as they can remember. Let’s not forget the government in power DID provide a lot of food, housing, schooling, medical care, etc, to the people of the country……. up until the oil price crashed at least, although even before that corruption was the name of the game.
The remaining supporters of the government are still getting SOMETHING above and beyond what they would get otherwise, in exchange for their support.
If I were there on the ground, with kids to feed, given the choice between seeing them starve or supporting Maduro, I would support him, for lack of any other viable option. This calculus applies just as well to soldiers, cops, civil servants, and everybody else as it does anybody who comes to the attention of the authorities.
Consider the many poorly educated and basically politically ignorant or naive people in this country who think Trump is ON THEIR SIDE. They simply don’t know any better. A similar situation holds in Venezuela, excepting that in Maduro’s case, his government DOES apparently make sure his supporters eat at least a LITTLE better than his enemies.
I’m very surprised, myself, that the anti Maduro people haven’t yet resorted to doing things on the grand scale they COULD do to bring the government do….. but once before, a long while back, I made some remarks about that sort of option…
And Dennis, you pointed out that I shouldn’t post any more comments to that effect, due to such remarks being outside the accepted boundaries of this site. So I haven’t.
But just because we don’t talk about such things here doesn’t mean they aren’t going to be happening, and the time for them to be headlines grows shorter by the day.
Yeah, well I hope we stay the heck away from getting involved with it. We have a miserable history of backing the wrong person.
Reality may be starting to dawn in the investment community.
http://www.morningstar.co.uk/uk/news/166673/oil-price-could-climb-15.aspx
https://en.wikipedia.org/wiki/Russians_in_Venezuela
Interesting history worthy of a Wiki — suggests an ethnicity imperative much like the Crimea.
https://www.reuters.com/article/us-russia-venezuela-rosneft-pdvsa/venezuela-gives-russias-rosneft-gas-field-concessions-rosneft-idUSKBN1EB0JN
This semi slipped by. Offshore natgas field development by Rosneft.
I don’t see how Russia has any incentive to put their oil contracts and loans at risk by allowing a regime change. One would presume a US installed puppet govt would cancel/default.
I wonder what is actually happening.
Obviously, the media being fed to “The West” is skewed.
I guess we shall see—–
Hickory,
Do you consider Al Jazeera the western media?
https://www.aljazeera.com/news/2018/03/venezuela-presidential-election-delayed-180302101032067.html
No I don’t, but I’m not very well informed in regards to that organization. Did you mean to address this question to me, or Hightrekker?
Probably—
I’m very familiar with Al Jazeera.
I like it. But a very “center” viewpoint.
Sorry. Yes It was Hightrekker, not Hickory.
Agree Al Jazeera is a relatively unbiased news source, in my opinion New York Times and Washington Post are fairly unbiased.
I think undemocratic dictators are generally bad whether they are on the right or the left, unchecked political power is generally a recipe for suffering for those at the bottom of the social order.
Since you asked, I will take the opportunity to present the idea of charting news sources for political bias, and opinion vs fact. The site – ‘All Generalizations are False’ has done a very good job attempting to chart this, and it should be of interest to all. Are you brainwashing yourselves? Maybe time to broaden your horizons, and attempt to grow beyond your biases. Seek truth. Examine the chart.
http://www.allgeneralizationsarefalse.com/
note- all those sources in the red box are rated as “Nonsense, damaging to the public discourse”,
and those in the orange box are rated as ‘unfair interpretations of the news”. Is that where you educate yourselves?
Interesting,
most mainstream news sources (NBC, CBS, ABC, and PBS national news) seem to be relatively neutral/unbiased according to that analysis.
Looks like Australia has decided to keep the lights on!
https://in.reuters.com/article/us-australia-gas/australias-northern-territory-government-lifts-fracking-ban-idINKBN1HN360
” COAL IS NOW AN ESSENTIAL COMPONENT OF OUR ZERO CARBON FUTURE ” — Australian Prime M…
Is that part of the “zero people/zero carbon” plan?
Bloomberg: https://www.bloomberg.com/news/articles/2018-04-17/opec-russia-talks-set-to-sustain-oil-cuts-even-as-glut-vanishes
OPEC, let alone OPEC +Russia, have never before been able to stay this disciplined. Someone (usually most members) always cheated. Has anyone read anything in the MSM suggesting that many OPEC members +Russia may not be able to pump what they did in the fourth-quarter 2016?
Jeff,
It’s pretty clear Venezuela will produce less than 2016Q4, Libya and Nigeria may make up the difference, there has no doubt been further field decline since 2016 so my guess is that the 33 Mb/d OPEC output of 2016Q4, I also think Russia would be hard pressed to repeat the output levels of 2016Q4.
Short answer, not likely that OPEC+Russia will match the level of 2016Q4, they might be able to match the 2016 average level.
Higher oil prices for a few years (2019-2021) might change this so that perhaps OPEC could hit 35 Mb/d at some point and Russia might get close to 2016 Q4 levels.
At the World level, LTO output will peak by 2023 and output from Brazil and Canada will not be able to offset the decline in US LTO and the rest of the World, rising OPEC and Russian output might be able to offset decline for a few years keeping World output on a plateau for a couple of years, but by 2026 it will be gradually increasing decline, less than 2% up to 2030 followed by steeper declines and very high oil prices ($200/b in 2018$ until GFC2).
They faced the same problems as independent oil companies. Trade off of profit vs capex. So, as Ron indicates, there is not a lot of spare capacity, right now. Saudis have the most at around half a million. The “cut” has always just been an optical illusion. They, and all the rest of the companies want oil up as high as it can. Reality. I could see a use for further cooperation between the two. Higher prices will stimulate further efforts to increase production. Personally, I don’t see it ever getting close to the danger point of price crashes in the fairly distant future, but if it does they can coordinate to keep the price as high as they can. If the price is high, they have no internal need to increase production, unlike the oil user countries. They know the commodity is scarce, and will probably be less in demand in the far future. So, why waste it. There is, and never has been, any altruistic motive.
https://oilprice.com/Energy/Oil-Prices/100-Oil-Is-Back-On-The-Table.html
If neither Russia nor OPEC has much spare capacity, then what do they spend their time discussing at these talks? They must be attempting to bluff each other as well as the rest of the world. Or perhaps each side is aware of the other side’s true position, and they need to work out how they are eventually going to bring the ‘agreement’ to an end and present it to the world. When the agreement has run it’s course the rest of the world will expect increased production, and that may have to be managed somehow.
They will maintain the illusion by maintaining the “cuts” and will adjust “quotas” to the level that can be produced. Probably correct that output is probably pretty close to capacity at present and there really is no “cut” at all.
Eventually the world will wake up to this around 2022+/-1 year when US LTO can no longer come close to balancing supply and demand even at $100/b or more.
At that point it’s a year or two to $200/b and the transition to other forms of transportation (EVs, fuel cells, etc) accelerates. (Like Ford car sales from 1910 to 1925).
Yes, they will have to rapidly transition. And your not kidding about what the oil price will jump to.
FWIW, I don’t think oil prices will ever stay above $150 for long (they never even reached it in 2008 – prices hit $147 very very briefly, and dropped quickly in part because of demand responses). At that price most commercial consumers will start to implement very short term (many as short as overnight) efficiencies: trucks and container ships will slow down, petrochemical feedstocks will start to switch, road builders will cancel asphalt deliveries, airlines and freight delivery services will optimize their plane & truck utilization by efficiency, route optimization will move to more efficient solutions, etc., etc., etc. Most of these organizations have developed contingency plans for oil price spikes, so they’ll respond a bit faster than in 2007, but even then we saw this kind of response.
Individual consumers respond a little slower, but they’ll move to online shopping, mass transit, use of the most efficient vehicle in the household for commuting, carpooling, etc. Even now carpooling is bigger than mass transit – a switch to just two people in a car reduces consumption by 50%. A few will even optimize their tire pressure!
It’s really not hard for most oil consumers to reduce consumption by 5-10% in the very short term, and rather more in the slightly longer term. If prices hit $5/gallon, you’ll see responses: first from industrial/commercial, but also from residential consumers.
By the time the low hanging fruit are exhausted there will be time for longer-term responses to take effect. SUV sales will crash, just as they did in 2008. Hybrids and plug-ins will jump, and there will indeed be relatively low-cost hybrid and EV conversion kits for existing ICE vehicles: they appeared in 2008, but disappeared again with falling fuel prices.
Industrial/commercial consumption would do the same thing it did in 1979: it would fall fast. Big consumers have been thinking about this for a while now. UPS and Fedex have pilot programs and contingency plans. Oil producers cannot be complacent, even in just the period up to 2030: commodity boom and bust is still a reality, even if the new “supplies” are a little less familiar.
Right now any liquid fuel over $2 a gallon is economically inferior to electric propulsion on a fuel cost basis. Oil based fuels have just crossed this point lately in the US. Fuel at $3 to $4 a gallon will have the techno-greenies dancing in the street as they watch the oil market crash, permanently.
Hi Nick,
In 2008/2009 there was the GFC, that was what brought oil prices down.
They recovered pretty quickly to $100-$120/b for about 3 years and oil output was increasing.
It’s a different scenario when oil output stops increasing.
In short, you are probably wrong, the adjustment will not be as easy as you foresee, all of the things you say, I expect will occur, but will only be enough to keep oil from going to $300/b instead of $200/b.
Time will tell. It will take some time to turn the fleet over to plugin vehicles and hybrids. It won’t happen overnight.
It’s a fascinating question.
I’ve read that Richard Rainwater bailed out of oil just before the peak, based not on a forecast of the GFC but on his observations of the effect of prices on consumption: he felt that prices above, oh, roughly $125 just would not be sustained. Look at the charts for oil prices: the period during which prices were above $125 were very, very short. Of course, the GFC occurred quickly during that price spike so we simply don’t have a good, obvious test of high-price demand elasticity from the superficial information available. OTOH, we don’t have an example of sustained prices above $125, either.
Just exactly where the point is that people decide to make substantial changes is the crucial question. When do people decide to commute to work in the family Honda Accord instead of the Jeep Cherokee? When do they take the Honda Fit back from the teenager in the family, for commuting? When do they decide to find someone at work to carpool with, or try one of the new carpooling apps?
I think that point is below $5 per gallon, for a majority of folks.
It also depends on expectations and perception: is this a short term thing, to get through by adding a little to the credit card balance? Or is this a long-term thing, which requires real changes?
But…more importantly, almost half of oil consumption is by industrial/commercial consumers, and they are much more careful than individual/residential consumers. They have plant managers and fleet manager/operators who have a responsibility to monitor fuel expenses.
When oil prices rose above $80, and bunker fuel started to see historically high prices, some shipping fleets immediately started to slow down their ships. Some trucking operators immediately slowed down. Plants that were dual-fuel between NG and oil switched immediately to oil. Electrical generation started to switch away from oil very quickly – it went from 20% to 2% in just a few years.
Many changes require some work and time. Studying the effect of route changes is a project, and it takes an investment of time. But companies like Fedex and UPS, America Airlines, etc., have been working on this stuff. They have pilot programs in place which can be expanded quickly. They have software options which can be implemented immediately. Airlines will switch to higher efficiency routes and planes. They’ll implement glide protocols which take a couple minutes longer, but which overall save money at certain price points.
Don’t underestimate the complex optimizations which major corporations employ: the really big ones hire Operations Analysis engineers to develop this stuff. The smaller ones make this kind of thing part of the day to day work of the line managers.
But, they will not tolerate $6 per gallon diesel costs: they will find alternatives and substitutes. Freight customers will switch to rail. If rail is overloaded then there may be delays, but they won’t last forever. And, of course, if LTO starts to decline (or pipelines expand to meet demand) that will free up a LOT of rail capacity.
You may object that Europeans pay prices like that. But…they don’t. Not the industrial/commercial customers – they simply don’t pay the taxes that individual consumers pay. And, individual Europeans consume 18% as much fuel as Americans. That’s partly geography, of course, but the taxes and total prices paid are very important: they’ve suppressed demand very effectively.
18%!
Another Permian pipeline capacity article, this time in the WSJ.
All the various estimates suggest that Permian production is either at or already above pipeline capacity.
2018-04-18 (WSJ) Is the U.S. Shale Boom Choking on Growth?
Chart, Permian pipeline capacity (Goldman Sachs): https://pbs.twimg.com/media/DbEilknXcAAS6ld.jpg
Chart, Permian price discount (Argus): https://pbs.twimg.com/media/DbEXr4oUQAAHq8o.jpg
WSJ article: https://www.wsj.com/articles/is-the-u-s-shale-boom-choking-on-growth-1524056400
Dennis as to you note above addressing Coffee and my self. I am granting the jury is still out with regard to ultimate EUR for wells using the longer laterals with “enhanced completions” that began in mid to late 2016 at least in our areas. Prior to that the industry was successful in drilling longer laterals but were having a difficulty “doubling” the production if the lateral was doubled. The industry has largely solved that problem with much better frac control in the extended lateral that is why we now have much higher IP’s ,30 day IP’s and 60 days IP’s and 180IP’s as well higher production rates 1 and 2 years out. I for one don’t spend the money till I get the check, so I continue to watch our area and track and compare production. But without a doubt I can say wells in our area are routinely making 200,000BO in the first year and are on track to make 300,000 by end of year 2. There is nothing to suggest these wells won’t make at least +600,000BO, although like I said I a still watching. I would also note that they will make 1-2 BFCG and 150,000BNGL’s. With respect to your 1% or 5 % guesstimate, I don’t even know where to start other than to say that type of comment shows a great level of ignorance.
TT. So you are saying that US upstream oil and gas producers never tout their best wells in company press releases?
To the contrary, I believe that is common practice. No harm in it either as far as I am concerned. Investors need to do their homework.
Still say shaleprofile is a great place to get data. Haven’t compared recently, but has always matched subscription sites and public state data.
Ss, no I am not saying anything about what “US upstream oil and gas producers” tout or don’t tout. I am just stating the facts as they exist in the areas I work. I make a living doing this so what information I find and use rarely is published on a public web site at least not in a time frame that would be useful to me. I don’t read shaleprofile so I have no opinion on the quality of the data. I am happy that producers like yourself are having a better time of it, I am even more happy that the decisions we made during the downturn look be timely and wise, for the time being?
Since these well’s are double as long as the old ones, they need the double acres of good sweetspot land. So 600kb of oil isn’t a luxury, since the old wells hit 250k in average (all american from Enno), and in these old wells are lots of test wells or tier 2/3 wells from the beginning of fracking.
The real benefit is not out of the area being drilled. It is taking up twice as much area. It’s in the amount of capex. It doesn’t cost double the amount to drill. That’s the “efficiency”. Same in all the shale areas.
IN scoop and stack (Anadarko basin okla)based on public presentations the “sweet spots” cover several counties. I think based on current well density maybe less that 5% has been drilled. Most units only have 1 well, some have none to date and some have experimental density test. Full field development has not started. at $70 just about the entire play is now very very commercial. There are 3 different zones with 12-17 wells per unit expected over large parts of the play. When one zone is oil prone all 3 will be oil prone, likewise of condensate and wet gas areas. Expect a very large increase in oil production coming out of OKLA in the future.
Is there an OOIP estimate for the Anadarko basin?
In 2010 USGS estimated about 400 Mb of oil and 250 Mb of NGL for undiscovered TRR for the Anadarko basin, and about 18 TCF natural gas (3 Gboe), so total oil and natural gas of 3.7 Gboe, with less than 25% as liquids and only about 10% oil.
I was referring to this comment from you up thread.
“The producers will focus on the best areas and cherry picking the best 1% or 5% of wells drilled does not give an accurate picture.”
I have no idea what the OOIP estimate is for the anadarko. I can say that as each 1/4 passes the producers have tested a new formation with promising results. It maybe a few more years before all zones are fully evaluated and their aerial extent is known.
Hi Texas Tea,
Not sure what you mean about 1% or 5% guesstimate.
Are you talking about LTO recovery factor?
This is based on the Bakken OOIP estimate of 300-500 Gb and the USGS estimate of 8 to 16 Gb (F5 to F95). OOIP estimate by Leigh Price and USGS estimate April 2013 for Bakken Three Forks, at the end of 2012 proved reserves and cumulative production in the Bakken/Three forks was about 5 Gb so I add that to the USGS estimate of undiscovered TRR.
Recovery factor would be 8/500=2% to 16/300=5% for Bakken/Three Forks play.
I don’t have good OOIP estimates for other US plays.
My guess is that those that believe recovery factors will be 10%, will be wrong. (Implying 30 Gb to 50 Gb of Bakken/Three Forks URR, and about 130,000 total wells completed for 40 Gb and an average new well EUR of 300 kb).
Time will tell as to who is “ignorant”.
Can you tell us the Cost of those wells, OPEX, royalties, taxes, land cost, water handling cost?
When questions are asked challenging your assertions, I have noticed you resort to name calling instead of facts.
Statistics Canada Production (crude oil, condensates, bitumen) January at 4,384 kb/day, down -164 kb/day from December
Up +183 kb/day from average 2017 production of 4,201 kb/day
Chart: https://pbs.twimg.com/media/DbFd-XDW0AAQK3m.jpg
Inventories fell -4.4 million barrels in January
Chart: https://pbs.twimg.com/media/DbFeL95WsAoloa1.jpg
2018-04-17 (Reuters) – The first contractual liquefied natural gas (LNG) cargo from Dominion Energy Inc’s newly constructed Cove Point LNG export plant in Maryland in the United States left the facility on Monday
Cove Point is the second LNG export plant in the lower 48 U.S. states after Cheniere Energy Inc’s Sabine Pass terminal in Louisiana, which exported its first cargo in February, 2016.
https://www.reuters.com/article/us-dominion-covepoint-lng/u-s-cove-point-lng-terminal-begins-commercial-lng-deliveries-data-idUSKBN1HN1JX
I thought April was usually a slower demand month. 10 million barrel draw doesn’t look slow. This year is going to be an intense reality check for those lower for longer naysayers.
Brent at close to 74, and WTI close to 69. Inventories will PLUMMET!
Speaking of PLUMMET– what happened to those diesel VW’s?
http://www.dailymail.co.uk/news/article-5562609/Shocking-images-VW-cars-dumped-Californian-desert.html#ixzz5D3WT1Ida
Junior’s used cars. call BR549. Rattlers and tarantulas extra.
Yes, scrap all these new cars (it’s no envirimental problem, isn’t it) and buy this instead:
http://www.digitaljournal.com/news/environment/conservatives-purposely-making-pickup-trucks-spew-black-smoke/article/388821
All problems solved…
https://www.cnbc.com/amp/2018/04/18/3-gasoline-is-coming-soon-as-demand-jumps-and-crude-oil-prices-rise.html
Record refinery production anticipated.
I haven’t watched this yet, just ran across it.
But it’s probably pretty decent in terms of illustrating the technology of fracking.
Of course it’s to be expected that it will be a one sided presentation, stressing the positive and glossing over the negative aspects of fracking.
https://www.youtube.com/watch?v=VY34PQUiwOQ
The price of Aluminium (in green on this Reuters chart) has risen vertically in April, I guess due to sanctions on Rusal, from April 6th. The price of nickel spiked higher yesterday too (not on chart)
Prices https://pbs.twimg.com/media/DbIRk39XcAAMRzf.jpg
Norwegian Petroleum Directorate (crude oil & condensates) March at 1,548 kb/day, down -47 month/month
Down -196 kb/day from March 2017
Down -69 kb/day from average 2017 production of 1,618 kb/day
Chart seasonal: https://pbs.twimg.com/media/DbIlLiXWsAABrIt.jpg
It looks pretty certain that we can expect at least -100 kb/day from Norway (C&C) in 2018. Almost all the newer small fields are now at plateau production, and the rest of the fields are mature and experiencing either a rapid or limited production decline. Occational tie ins, more infilling drilling and enhanced recovery projects do not change the picture much.
I think 2 or 3 fields have had unplanned shutdowns – Golliat again, Gjoa and Troll Oil: have to wait for individual field details next month to be sure. It seems to me availability is noticeably declining in the North Sea now, maybe offshore overall.
Yes, we will have to wait for confirmation of surprising shutdowns. Overall capex spending in Norway has not had the same decline as in regions perceived as more risky (thinking offshore only). Still the Johan Sverdrup field has captured a large share of it, exploration drilling has been at an ok high level (given the best refunding tax rules in the world – 78% refund of expenses) and unfortunately confirmed the trend of less success rate for exploration both in the North Sea and the Barents Sea. Less has been spent and budgeted on developed fields. And together with lack of new smaller fields coming online major declines in production can be expected stretching all the way into late 2019 when Johan Sverdrup interupts the trend. The thinking in Norway has been that exploiting the offshore platforms and installations in place is critical, and therefore producing as fast as humanly possible is the policy (probably not very wrong, sunk capital costs in platforms should be exploited until it is not economically possible anymore).
2018-04-19 (Bloomberg) Kazakhstan oil output back above 1.9 million barrels per day after Kashagan work. About 163 kbpd above the OPEC+ deal target level
No doubt, there will be some profit taking soon, but oil prices have raised the ceiling. WTI getting close to $70. Brent close to $75.
Libya’s most powerful military leader might be dead and that could impact oil markets
https://www.cnbc.com/2018/04/18/libyas-most-powerful-military-leader-khalifa-haftar-might-be-dead.html
Comment from article: “Haftar has successfully managed to hold numerous competing factions and tribes together to keep the LNA unified. And he’s effectively presented himself as an answer to radical Islamist groups in the region, thereby gaining strong support from Egypt and the United Arab Emirates (UAE).”
If Haftar is dead or has had a severe stroke don’t expect Libya to grow or keep oil production where it is.
It’s a long read but there are lots of interesting bits…
April 17, 2018 (World Oil) Shaletech: Permian Basin
Owing in part to logistical improvements, Occidental has set a lower all-in target of $8.9 million this year for a representative 10,000-ft lateral, three-string well targeting the second bench of the Bone Spring and completed with proppant loading of 2,000 lb/lateral ft. Total costs for a similarly designed New Mexico well were $9.9 million in the fourth quarter.
http://www.worldoil.com/magazine/2018/april-2018/features/shaletech-permian-basin
10,000’ lateral Wolfcamp wells $11-13 million.
Some really good information in that article, Energy News!
Looks like the shale guys are going to try their hardest to screw up the enormous gift OPEC and Russia is trying to give to oil producers across the world.
$60s WTI sure does help payout of wells. Would think maybe some would want to heal balance sheets first.
I really like the 4 pad 33 well Christmas tree of Encana. I just know each and every one of those wells are performing perfectly. EOG stated they think they want to develop it a little more conservatively when confronted with the technique. It’s really not all that unique, I think I’ve seen some of those like that in the Eagle Ford by Cheatapeake. Pads close together, four wells on each side. However, I doubt they were anywhere as close as those in the picture.
https://www.eia.gov/todayinenergy/detail.php?id=35732
George ought to have fun with this one. It is the first time in awhile I don’t see the 300k increase projection. Only 100k. I think George said -50k. I can’t quite figure out the shadow areas marked hurricane. Is this the projected oil output if we never had hurricanes, or what?
No they are predicting the same rise as before – it’s based on STEO numbers exactly. They are trying to do a bottom up justification for the rise, but almost everything they say is wrong in that table of new fields, and an equal amount omitted. I commented on the previous post concerning UK production (there’s a way of linking to comments but if I ever knew how it’s forgotten now):
EIA have their latest predictions for GoM out. They indicate about 450 kbpd oil coming on line in 2018 and 2019, from the fields below. Most of this is wrong. Amethyst, Otis and Tomcat are gas fields with little condensate, and they have all been started already. Amethyst was a mess and the licence has been rescinded. The Phobos licence, too, has been rescinded and will not be developed by Anadarko – though EIA show it against LLOG so maybe they picked it up, but the only tie-back option in the area is Lucius, which is Anadarko operated and with some other brownfield work already scheduled this year. Rydberg can only be developed after Appomatox has production capacity probably in the early 2020s (it’s not yet commissioned even). Gotcha is operating as part of Great White. I’ve heard nothing on Bushwood, but its lease number has been produced since 2014 as part of the Geauxpher field (the BOEM name, it is pretty much dry gas and in decline). Stampede is really a single field. It has started and Kaikias will start (but I think in 2019), together they’ll add about 70 to 80 kbpd yearly average (probably less in their first years).
On the other hand EIA have missed Constellation, Hadrian North, Big Foot, Red Zinger, Crown & Anchor, Blue Wing Olive and Claiborne. Except for Big Foot these are small tie-backs. They don’t total more than another 80 kbpd, but more than that they can’t add to total production because they are going to existing platforms that have to decline first to make production room (Kaikias may be in the same category). Big Foot will add 75 kbpd through 2019, but it might be 2020 before it’s at full capacity. Buckskin is a bigger tieback, also missed (maybe this is what Phobos was supposed to be as it is LLOG operated), due in 2019 which might have a net increase on Lucius.
EIA also seem to have very little decline in any of the existing mature fields through 2018 and 2019.
You have memory problems? After you reposted it, I remembered reading it from your original. Sorry.
I think I do. Not entirely sure though.
What were we talking about 🙂
to link to a comment click on the date/time to bring comment up in new window, then copy and paste from your browser’s address bar.
http://peakoilbarrel.com/opec-march-crude-oil-production-data/#comment-637207
link above is to George’s 4/20/18 10:46 AM comment
Or those that prefer relaxing with a good fantasy read, may prefer this one:
https://www.eia.gov/todayinenergy/detail.php?id=35692
http://www.oil-marketing.com/index.php/news/199-us-shale-boom-poses-great-threat-to-nigeria-deutsche-bank
Bonnie light has been at a premium since January at over $70. LTO and Bonnie light have a lot of similarities, apparently. Their heavier brand is not selling.
Trump is “fixing” the oil-price via twitter
https://twitter.com/realDonaldTrump/status/987284041304100864
Wow – there’s oil in “ships at sea” who knew, and not only that but they are “fully loaded” and take the oil “all over the place”; no wonder the price is high. And apparently OPEC simply decide on the oil price and that’s what we all pay, why the hell did they all choose to start running deficits a few years back, obviously they must be unable to see things quite as clearly as the golden golem.
We elected a reality tv star (not even a good one), who wants to star in a one man episode that will forever eradicate the law of supply and demand. I’d say tune in next week, but unfortunately it’s a daily show now.
There have been, in the past, some not exceptionally intelligent presidents. Unable to think quickly and informed enough to speak extemperanously, they did get by with reading presentations with the assistance of others. The Republicans should quickly pass a law against Presidents tweeting, or they won’t win another election, anywhere. I remember saying that anyone would be better than Hillary. Be careful what you wish for.
Guym,
Were you wrong? 🙂
By comparison, Harpo Marx may appear more presidential. At least, he just tweeted his horn. By other appearances, there is some distinct simularities. SNL could have a good time with that comparison. But, as an answer, no. Better with the comedy. But what real difference would it make? Clowns to the right of me, Jokers to the left of me, and here I am, stuck in the middle with you.
I read some articles about this. The assumption seems to be that in anticaption of higher oil prices, Trump is going set the narrative that OPEC is responsible, not declining supplies.
Oh, I remember posting that OPEC has set themselves up to be the bad guys for taking all the credit on supply drops. Did your articles explain the motives for Trump’s tirade? Why is blaming OPEC better than acknowledging the law of supply and demand? That he could hoodwink the American public is possible, but the rest of the world wouldn’t buy it. The IEA is already pressing OPEC that the mission is accomplished. Maybe, this is Trump’s attempt to pressure them. As if the exit from the “cut” would make much of a difference, anyway. All this has the same logic as blaming Mommy, because the ice cream truck no longer goes down our street.
Ok, I read where they think it is a preemptive measure to blame OPEC for high prices before he puts new sanctions on two of its members, thus raising the price higher. And the line would be? Yes, prices are higher, but we are punishing them for it? Gads! Prescription for that throbbing pain. Hit the offending area with a hammer. It will hurt more, thus reducing the concentration on the throbbing.
I think prices are already locked in to his actions towards Venezuela and Iran. They will increase later, at some time, due to shortages. In the meantime, I will be researching the best EVs.
So, Trump is upset at OPEC over oil prices that are now,”artificially very high”.
I thought USA is energy independent and dominant. So why should we care what OPEC does anymore?
BTW OPEC is bailing out a very large US industry, as US upstream has proven it cannot make money at sub $50 WTI.
Maybe Trump is thinking, “We are nearing $70 WTI now, where do we go when I rip up the Iran nuke agreement?”
What possibly could go wrong?
– rip the Iran nuke agreement
– give “Freedom fighter” in Nigeria new money
– mix up in Lybia now the biggest warlord has health problems
– boycott Venezuela even harder
– I forgot: Start a few trade wars, especially with russia
SS says…”Maybe Trump is thinking, “We are nearing $70 WTI now, where do we go when I rip up the Iran nuke agreement?””
yep that is my take, that and a bit populism to keep the purple state voters support
what i think we all know…the longer prices are kept artificially low the higher they will go in response to an supply disruption
We are almost at this stage – US LTO is just enough to replace plummeting Venezuela oil at the moment – and deep sea investment has been eliminated for a few years. It will take years to catch up there.
Together with a strong demand growth, this has desaster written all over it. LTO growth is not only drilling holes, but all the up / mid / downstream investments that can take several years to come online. Fracking pumps, trucks, road repairs, pipelines, raffineries, harbours – even road repairs can get a bottleneck when all the heavy trucks have to drive on a pothole highway that was never build for heavy duty traffic. And close down a highway for road repair in the middle of an oil boom? So growth is there, but it can’t replace anything.
According to many sources we’re already at -1mb/day at the moment – and demand is still growing.
One additional political hickup, and we see the 3 digits again. Good time for oil people to make some money, bad time for international politics due to turbulences (too much too fast).
I think we’ll see a very turbulent new oil boom / bust cycle again, with price shooting up now, everyone investing – and the following crash when demands come down, not to electric cars but to broke consumers / more economic usage by the transport sector.
The level of crude oil stored in tankers is at a record low – tanker tracker company – Kpler
(long term = anchored for more than a few days)
2018-04-20 (Kpler) long term worldwide floating storage is at a record low of 8.8 million barrels compared to 17.4 million barrels registered at the beginning of this year.
https://twitter.com/Kpler/status/987317006188851202
https://twitter.com/Kpler
Products levels at these fuel hubs has been falling since the middle of March
It’s a monthly chart but the data point for April is the latest weekly data
Baker Hughes weekly U.S. oil rig count: up +5 to 820.
Permian +8 to 453
Natural Gas no change at 192
Rystad Energy estimates that 3.3 million of hydraulic horsepower will be added…
2018-04-20 (Reuters) Schlumberger expects to see growth in the North American pressure pumping market, but warned that its ability to raise prices would be constrained amid capacity additions.
The company anticipates add 1 million extra hydraulic horsepower this year, but deployed fewer frack fleets than anticipated in the quarter due to softer pricing and deployments by competitors.
Consultancy Rystad Energy estimates that some 3.3 million of hydraulic horsepower were added last year, and another 3.3 million will be added this year.
https://www.reuters.com/article/us-schlumberger-results/schlumberger-profit-barely-tops-street-says-oil-market-balanced-idUSKBN1HR1KP
EOG seems to be more than doubling permits in the Eagle Ford prime positions.
https://www.platts.com/latest-news/oil/london/heavy-volume-of-us-crude-oil-exports-to-hit-europe-26945361
Exports looking up.
https://oilprice.com/Energy/Crude-Oil/A-Crisis-At-The-Heart-Of-US-Shale.html
He puts them al together in this article.