A Guest Post by George Kaplan
Colombia
Colombia production is holding a plateau over the past year after a large decline in the last part of 2015 and first half of 2016. August value was 858 kbpd (down 0.04% y-o-y).
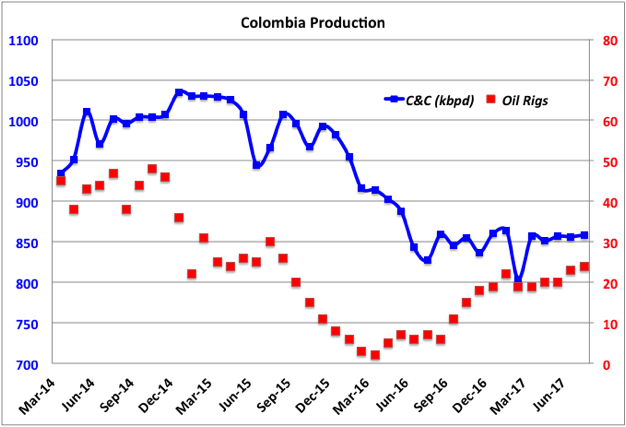
Colombia oil reserves at the end of 2016 were 1.66 Gb (down 16.8% from 2 Gb in 2015 which followed a drop from 2.31 Gb in 2014). At the average 2016 production rate of 885 kbpd this gave an R/P of 5.1 years, the lowest for any significant producing country. Most of their production is heavy oil. Ecoptrol, which accounts for more than three quarters of Colombia’s crude and natural gas reserves and output, estimated about 45% of their decline was due to the “pronounced fall in oil prices”.
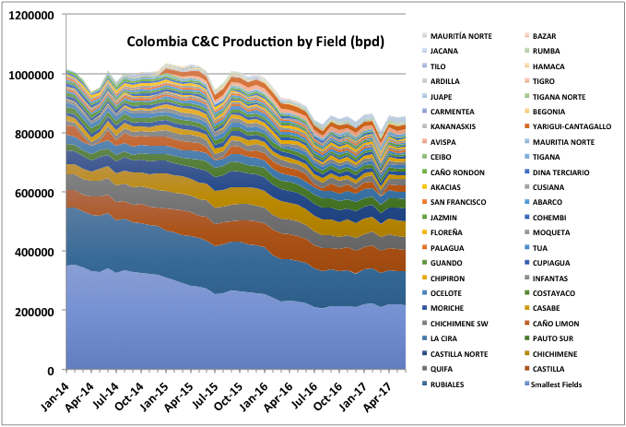
Individual field production is reported through the Colombian hydrocarbon agency (ANH), but data is only available to June. The previous decline mainly seems to have come from the many smaller fields (there are almost 500 total producing fields listed for 2017) and the largest one, Rubales. A few smaller fields were added in 2015, but the main cause of the plateau seems to be an arrest of the previous declines in the mature fields. Some of that may have been to do with the cessation of insurgent sabotage on pipelines.
It’s unlikely they will be able to maintain a plateau without new discoveries. Exploration has dropped significantly in the last couple of years; Anadarko has been one of the few companies to maintain some activity but they only found gas and the latest news from them would appear to indicate they are going to use money for share buybacks rather than expansion. Even EcoPetrol look more interested in opportunities abroad (e.g. offshore Mexico).
Mexico
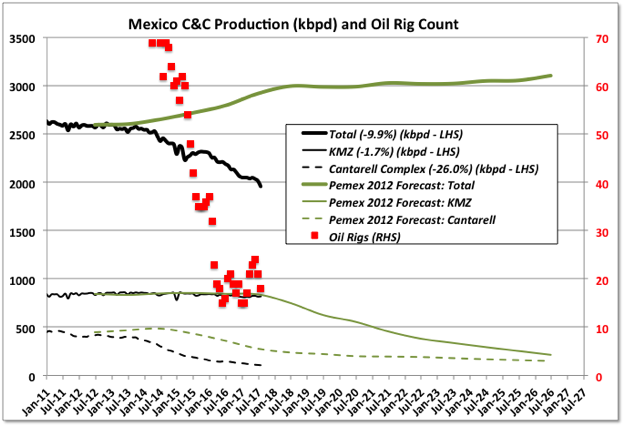
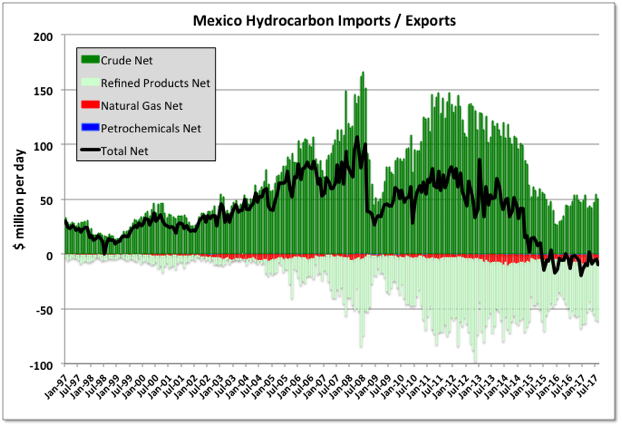
After a stable plateau for the first six months of 2017 Mexico’s C&C production dropped in July and had another big drop of 56 kbpd in August (down to 1960 from 2175 last year, or 10%). Almost all the decline came in the Southwestern Region offshore; some of it is maintenance, but the major turnarounds were meant to be finished in early August. Total liquids (including NGL) were down 75 kbpd from July to 2196 (a 10.8% decline y-o-y). KMZ is still holding up, but Pemex forecasts from 2012 indicate it should be starting to come off plateau soon. The KMZ oil is, on average, heavy but not consistent across the fields with Maloob and Zaap at API 12° and Ku at 22°. The production facilities have segregated systems for each, which may impact how the decline curve looks (for comparison Cantarell is API 21°, the heavy end of medium).
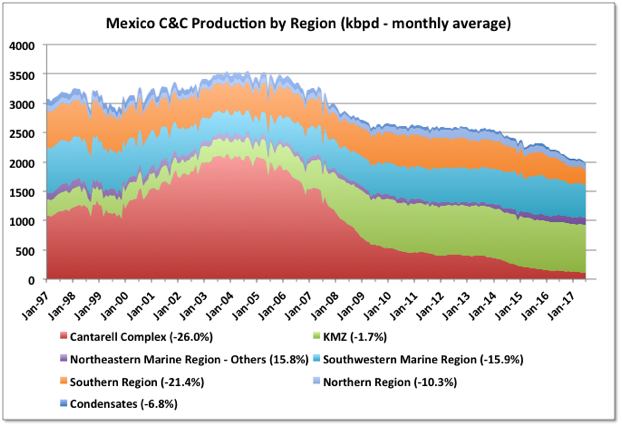
Overall it looks like Mexico’s net import of hydrocarbon products, which switched from a net export in early 2015, is starting to creep up.
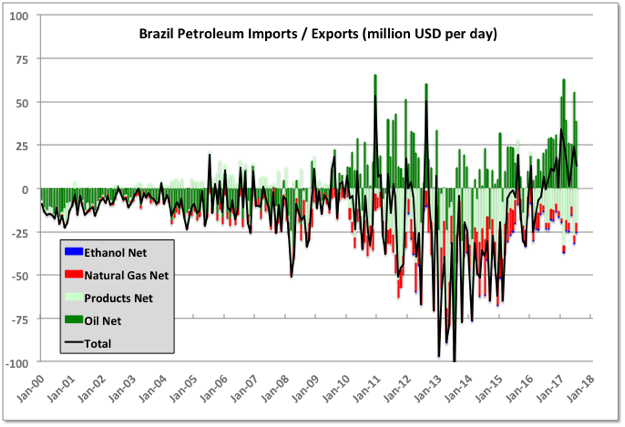
Brazil
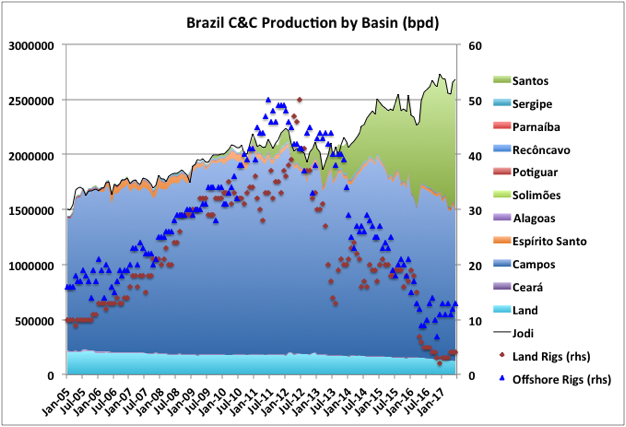
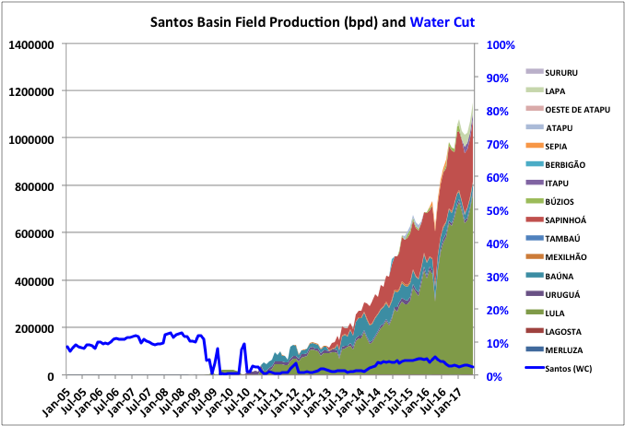
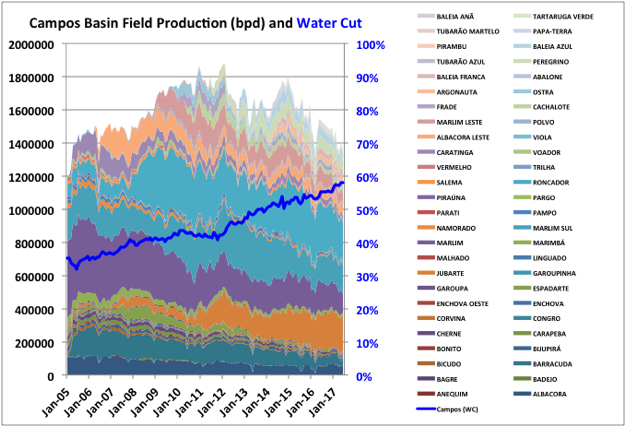
Brazil field data is available from ANP through June. Total production for July has also been issued and is about the same as June. Overall production is generally on a plateau, with newer production from the Santos basin replacing declines in the Campos and other offshore basins, and land wells. There are another three FPSOs with 450 kbpd nameplate due this year and another eight due in 2018 and 2019, with about 1 mmbpd nameplate. Decline rates in the mature deep water wells are very high, but the new developments should mean new production records are continually set for a couple of years (barring accidents). However, beyond that, activity in Brazil for exploration and approving new developments has been going much slower than expected by some, there are reports that three other FPSO contract’s are being negotiated, but they have been around for about a year, and there are five other identified deep water developments.
Brazil continues to be a net exporter of hydrocarbons (by value), although slightly declining at the moment.
Off Topic Finish
Hubble Deep Field – cosmic!

Petrobras just released their September production numbers…
Rio de Janeiro, October 18, 2017 – Petróleo Brasileiro S.A
The average oil production in the country was 2.17 million barrels per day (bpd), 2.8% above the volume of August. This result is due mainly to operations getting back to normal, after the scheduled stoppage of FPSO Cidade de Itaguaí and FPSO Cidade de Maricá, both operating in the Lula field, in Santos Basin pre-salt.
http://www.investidorpetrobras.com.br/en/operational-highlights/production-and-marketing
Chart on Twitter https://pbs.twimg.com/media/DMcwGYZX4AMi56k.jpg
Petrobras just released their September production numbers…
Rio de Janeiro, October 18, 2017 – Petróleo Brasileiro S.A
The average oil production in the country was 2.17 million barrels per day (bpd), 2.8% above the volume of August. This result is due mainly to operations getting back to normal, after the scheduled stoppage of FPSO Cidade de Itaguaí and FPSO Cidade de Maricá, both operating in the Lula field, in Santos Basin pre-salt.
petrobras.com
Okay, I must comment on your Hubble deep space photo. Off topic but you posted it here so I must respond here. This photo is of a tiny spot a fraction of the diameter of the full moon. The tiny dots you see are the first galaxies in the universe. They are over 13 billion years distance and therefore you are seeing them as they existed 13 billion years ago. However this article says they are almost 14 billion light years distant… and therefore years ago. That would make the known universe 28 billion light years in diamater.
How Big is the Universe?
But though the sphere appears almost 28 billion light-years in diameter, it is far larger. Scientists know that the universe is expanding. Thus, while scientists might see a spot that lay 13.8 billion light-years from Earth at the time of the Big Bang, the universe has continued to expand over its lifetime. If inflation occurred at a constant rate through the life of the universe, that same spot is 46 billion light-years away today, making the diameter of the observable universe a sphere around 92 billion light-years.
So the observable universe is 92 billion light years in diameter, the light we see from the furthest galaxies we can see are 13.8 billion light years distant and therefore the light we see left those galaxies 13.8 billion years ago. They are now 46 billion light years distant.
What is out there? I am sorry to informe you but you will never know.
Earth is the only place with life.
Yeah, that’s what the religious nuts have been saying for thousands of years. And you have exactly as much evidence for that claim as they had.
You are right Ron, its just my hunch.
For all practical purposes, I am correct, and the implications of that is-
we should treat this place as precious. Like one in 80 quadrillion.
And there is the unobservable universe, that is probably billions times larger than the observable one. Not to mention the multivers theory 🙂
The multiverse theory is, in my opinion, a load of bullshit. It was made up to counter the fine-tuning problem.
I agree Ron.
And CERN has not been kind to our multiverse friends:
“The great tragedy of science”, said Thomas Huxley, “is the slaying of a beautiful hypothesis by an ugly fact.”
http://backreaction.blogspot.com/2016/08/the-lhc-nightmare-scenario-has-come-true.html
Now that the diphoton bump is gone, we’ve entered what has become known as the “nightmare scenario” for the LHC: The Higgs and nothing else. Many particle physicists thought of this as the worst possible outcome. It has left them without guidance, lost in a thicket of rapidly multiplying models. Without some new physics, they have nothing to work with that they haven’t already had for 50 years, no new input that can tell them in which direction to look for the ultimate goal of unification and/or quantum gravity.
What No New Particles Means for Physics
https://www.quantamagazine.org/what-no-new-particles-means-for-physics-20160809/
This fellow mentions something about more than one universe early on in this YouTube video.
Michio Kaku – Rash of 100 Year Disasters – Global Warming
https://www.youtube.com/watch?v=m8Hc45u9tZ8
Michio is a multiverse advocate, and educator.
They prevail in the current system, and won’t be gone until they die.
They hire and promote other multiverse people.
Everyone knows that the universe is expanding, but, no one knows what what the universe is expanding into.
You mean to say that the universe must be expanding into something? I don’t think so. The universe is just expanding… expanding into nothing.
Well, it cannot be expanding into itself, because then it would not be expanding. [Kind of like blowing up a balloon in a room – it does not end up creating the room, it just takes up more space in the room.]
But, your position is that more universe is being created every second, deal with it. Great. Kind of like a religion that says God exists, deal with it.
Clueless,
Nothing or Nothingness means state of not-knowing. The “mysterious” means that which is not known, that which cannot be known, intrinsically unknowable. How can the unknowable be reduced to knowledge.? Impossible. To “know” you need an insight, not knowledge. Knowledge is small, tiny and existence is enormous, vast. How can tiny knowledge contain vast existence? It cannot.
The balloon is all there is; there is no room. If there were a room it would be part of the balloon, since the balloon is the metaphor for the universe, and since the universe is everything.
The universe is expanding, it is not expanding into something, it is not even expanding into some void. Space itself is changing.
Further reading: https://en.wikipedia.org/wiki/Metric_expansion_of_space
I have been trying to get my head around whether nothing is something for well over half a century now, when thinking about astronomy.
When somebody figures it out, I hope they will post the explanation here, lol.
“What is out there? I am sorry to inform you but you will never know.” – I think you are correct (in this and many other things), but is it necessarily a bad thing? As for multiverses – one of my favourite books is ‘Flow My Tears the Policeman Said”, where multiverses get created by a drug (by the incomparable Philip K. Dick – and not yet turned into film, although I think there is an option for it). The speed of light is a hard limit – even though it is a huge number it is tiny compared to the speed needed to see what is actually happening in the universe right now – and actually what does right now mean when we all have our personal time depending on the speed we happen to be moving at? My brain hurts a lot (to quote Bowie, who I’m pretty sure was playing himself in ‘The Man Who Fell to Earth’), and in the absence of the multiverse drug I’m going to make do with another beer (there is no time limit when you are retired).
The speed of light is the barrier.
Our techno narcissists friends assume it is just a barrier to overcome—
But, betting against Einstein is usually not wise.
If it was easy to overcome – we would be flooded by aliens on a vacation trip to visit the underdeveloped zoo animals. Like in hitchhikers guide to the galaxy.
The same with a time machine – if it exists, every historic event like Katy Perrys boobs at the super bowl would be flooded with badly cloaked visitors…
Yep—-
The odds are slim for a encounter, even if complex life is common.
And while prokaryotic cells may be common, eukaryotic cells are probably not– if Lane’s science in The Vital Question is correct.
That’s a great book – I think he’s better than Dawkins, maybe not quite as good as Gould or Feynman as a writer. The one about the top ten inventions of evolution was also tremendous.
I agree—
Lane is good.
Hi, George
This is my brief view on Brasilian offshore:
http://en.angi.ru/news/1383-Alexander%20Khurshudov%3A%20No%20oil%20paradise%20in%20Brazilian%20offshore/
No, that is not the problem. The problem is accelerating to even a fraction of the speed of light. How do you accelerate in open space? You must throw something else in the opposite direction. Your acceleration rate is determined by the weight of what you throw and how fast you throw it.
Conventional rockets are propelled forward by throwing spent rocket fuel in the opposite direction at a speed of about 3,000 meters per second. So if a rocket could throw spent fuel in the opposite direction, equal to the weight of the ship plus fuel, at 3,000 meters per second then it would speed away from that spent fuel at a rate of 3,000 meters per second. But it would speed away from the spot in space from which it threw it at only 1,500 meters per second. That’s right, you only gain half the the speed of your throw-weight. The other half is the spent fuel speeding away from that spot at 1,500 feet per second.
For the best chemical rockets, the exhaust speed is around 3,000 meters per second. When electric propulsion is used, exhaust speeds can be up to 20,000 meters per second or more.
Okay, you could use electric propulsion and throw fuel, or whatever, at 20,000 meters per second. But electric propulsion is very slow because you only can throw tiny particles in a jet stream. However, you have years to accelerate so you take years to throw the weight of your ship plus fuel in the opposite direction you would then be moving away from that spot at a rate of 10,000 meters per second. The speed of light is 300,000 kilometers per second or 300,000,000 meters per second. So you would be moving at 1/30,000 the speed of light.
(I know, you would be throwing it gradually and dumping fuel gradually, so it would really be a lot worse than my example, but you get the idea.)
So you see you could never hope to travel more than a tiny fraction of light. You could not possibly carry enough fuel, even using electric propulsion, to accelerate to even 1/30,000th the speed of light. And don’t forget you still have to stop. And it takes just as much energy to decelerate as it does to accelerate.
And don’t give me that silly Bussare Ramjet science fiction bullshit:
Finally, the Bussard ramjet will only work when the vehicle is moving fast enough to collect interstellar mass in usable amounts. Therefore a secondary propulsion system is needed to boost the spacecraft up to this critical speed – about 6% of the speed of light.
6% of the speed of light is 18,000,000 meters per second. And using fuel equal to the weight of your ship plus fuel would accelerate your ship by 1/1,800th that amount. You could not possibly carry enough fuel to hope to accelerate to 18,000,000 meters per second, even if you gave up all hope of ever stopping. (You could reverse thrust but your ramjet would flame out once your speed dropped below 18,000,000 meters per second.)
Isn’t there a theory that you can continually create a black hole in front of you which sucks you forward. Of course if it had been tried we’d see long straight lines of black holes out there somewhere, one of which would likely swallow us up, or maybe they are up there and the swallowing up is coming at exactly the same speed as the light that tells us it’s coming and … oops, gone!
Really George? I have never heard of that one. But no, that is not a theory any self respecting physicist would propose.
I think it’s a possibility based on the physics, actually engineering such a thing would be something else entirely, but not a joke – I think from a Nobel Prize winner, nothing from a first go round with Google though.
I think it’s a possibility based on the physics,
No, it is not a possibility. Creating a black hole, out of nothing, many kilometers ahead of a speeding spacecraft, is not a possibility.
That had to be a very bad joke some frat brat just made up.
Ron,
Yes, it’s an as silly idea than the self driving locomotive in the children book Jim Knopf – they used a switchable magnet on a pole.
The black hole thing I read in Pherry Rhodan – but thats a gun & space battle pulp SciFi not aiming for any plausibility.
George – You may be thinking about electromagnetic propulsion – EMP.
I have in recent years been thinking that AI to AI is the only plausible spread of life in and across galaxies…travelling at light speed it should be near ubiquitous. Whether intelligent life giving rise to it is unknown of course, but so far we are one for one on plausible planets, or one for 8 worst case.
Perhaps we will live long enough to find out
In a galaxy is one thing, across galaxies is a different thing altogether. Galaxies are millions of light years apart. Our closest galaxy, not counting the tiny dwarf galaxies that are satellites of the Milky Way, is the Andromeda Galaxy. It is 2.5 million light years distant. If we sent them a message today it would be 2.5 million years before they received it, and another 2.5 million for us to received an answer if there ever was one.
Ron – I think that you are right. In my opinion, the only way to have space travel is if there are other dimensions that make it possible. The only example that I can think of is when you take a 1 inch x 12 inch piece of paper, twist it once and then tape the ends together. If you start marking a line down the middle of the twisted strip, after 24 inches you meet your starting point – i.e., you have created a one sided surface. So, go out 12 inches from your starting point and make a mark. Either way you go from the starting point, it is 12 inches away. But, if you pinch the paper together, it is only the thickness of the paper away.
It’s called a Mobius Strip. Google it. But it has absolutely nothing to do with interstellar space travel. Well, that is unless you believe in magic.
Neither do wormholes, but they keep talking about them.
Lol, why not warp speed. That is attaching on to the gravitational pull created by other stars gravitational warp? Do not adjust your television,
Need to build a fleet of spaceships the size of a coke can, equipped with a very light weight sail, and drive them with a giant laser.
The other alternative is to tear the fabric of space and move down the crack, because theoretically it suspends inertia and infinite acceleration is feasible. But I don’t know how that’s done. I read it in a science fiction novel.
Need to build a fleet of spaceships the size of a coke can, equipped with a very light weight sail, and drive them with a giant laser.
It would not work. Laser light still must obey the inverse square law. Any push a coke can size ship would get from photons hitting a sail would be down to nothing before the ship reached the orbit of Jupiter.
The other alternative is to tear the fabric of space and move down the crack, because theoretically it suspends inertia and infinite acceleration is feasible.
You read that in a science fiction novel. I believe you. I know you did not read it in any science fact text.
The smallest possible spread is given by a diffraction limited beam. Here, the spread depends on the wavelength and the smallest diameter of the beam (or waist). The equation is approximately
spread=wavelength/(pi*waist width).
with a 1 meter wide laser source at green light of 500 nm wavelength the spread would be 1.59E-7 radians divergence. That would produce a beam 184,154 meters diameter at Jupiter.
“In man’s struggle against the world, bet on the world.” ~ Franz Kafka
The Energy Report 10/18/17
Tough Making a Shale Buck
Oil producers in shale and oil sands are finding it tough to make a buck and keep production levels rising. While the oil trade has been betting on ever rising shale production the truth is that production has leveled off. Some are saying there is a “shale band” at $60 basis Brent crude, that the market cannot cross without getting a flood of shale oil. The truth is that even if oil prices go up the market will be disappointed with increases in shale oil production. That goes for oil sands as well. In the short-term oil will be focused on the resurgent U.S. dollar and oil inventories that may show another big oil supply draw down but big picture oil fortunes may be driven by the markets misreading of shale oil production and production projections.
While we have pointed out before the problems with shale oil early on and now others are starting to see what we are talking about. The Financial Times covers the points we have covered before in an article “In charts: has the U.S. shale drilling revolution peaked? Data show slowdown in rig productivity and drilling time improvements leveling off.” The papr reports that the market is seeing shale productivity gains leveling off and pointing out that the production per shale oil well is declining.
The FT Writes” Yarrows, a Paris-based energy research firm, has done that exercise for the Permian Basin of west Texas, the hottest area for investment in the U.S. oil industry recently. Its conclusion is that productivity adjusted for well length stopped growing last year, and may even have fallen a little in 2017. As the industry has recovered since last year, companies have moved from drilling in only the most productive “sweet spots” and started to produce from more difficult rocks, creating a natural drag on productivity. Improvements in production techniques have to fight against that drag, and it seems that in the Permian recently they have been losing.”
The last three years have seen dozens of new projects mothballed and expansions put on hold, meaning millions of barrels of crude from the world’s third-largest reserves may never be extracted. Where industry groups in 2014 expected Canada’s oil sands output to more than double to nearly 5 million barrels per day (bpd) by 2030, that forecast has been knocked down to 3.7 million bpd. This follows a spell of consolidation that has seen foreign majors sell off more than $23 billion in Canadian assets in a year and turn to U.S. shale patches such as the Permian basin in Texas, which produce returns more quickly and where proximity to refiners means the barrels fetch a better price.”
http://www.321energy.com/reports/flynn/current.html
HuntingtonBeach,
The reason for the dismal shale performance: there is a nearly three fold increase in monthly production decline rates over the last three years, at huge implications on companies cash flows (see below chart). 3Q17 quarterly results will be very disappointing.
This is the reason why BHP Billiton went out of its USD 20 bn shale investment with a USD 15 bn write down. This is why BNP Paribas, the French bank does not finance shale anymore. This is why stocks like Whitington Petroleum WLL crashed from USD 95 per share to just 5, the same for CHK, RRC….Thousands of investors have lost their lifetime savings, still hoping in vain these shares will eventually rise again at some point.
As I can understand how important shale is for the US dollar and economy, it must be also real. It cannot be based on the losses of ordinary shareholders and investors. People who have got the knowledge have the responsibility to communicate the truth.
If I owned one of those stocks at present, I would hold until oil prices rise over the 2018-2020 period, but I would then sell around 2023-2025 (whenever it looks like peak oil has hit). An aggressive investor might wait a few years until it looks like the transition to EVs is underway in a big way (by 2030 would be my guess), but lookout for recessions, I would sell as soon as it looked like the economy was heading south (in reality nobody sees this until after it has occurred), so it would be far safer to sell within a year or 2 of reaching the next peak (83 Mb/d in 2023-4).
Don’t ask for any refunds for this WAG, you get what you pay for, find a CFP for better advice. 🙂
I own no oil stocks and mostly invest in the market (S+P 500 or total stock market index), my experience is that I do not do as well as the market when picking individual stocks.
Dennis, WLL carries already USD -1.4 bn in retained losses – and losses are still mounting, especially as huge impairments are looming by the end of the year. The environment does not improve for this stocks. Only a miracle (huge spike in oil price) can save these companies.By the way, you did have some oil calls uwti just when oil collapsed. I have warned you then, I hope you have sold timely.
Dennis: “If I owned one of those stocks at present, I would hold until oil prices rise over the 2018-2020 period, but I would then sell around 2023-2025 (whenever it looks like peak oil has hit).” & “I own no oil stocks and mostly invest in the market (S+P 500 or total stock market index)”
You are giving contrary advice based on what you said how you are investing ? You should have said: sell all individual stocks (including oil stocks) now and invest in world stock market index.
Hi Ves,
I don’t recommend selling stocks when they are at their bottom.
I am not suggesting that anybody should buy these stocks, but you may be correct, if buying them is not a good idea, then selling them may be a good one.
I expect a patient investor will be rewarded by holding such a stock. Oil prices will rise by 2020, probably to $80/b minimum.
https://oilprice.com/Energy/Energy-General/Why-Petrol-Powered-Cars-Arent-Going-Anywhere.html
https://oilprice.com/Energy/Energy-General/Norways-Energy-Minister-Sees-Strong-Long-Term-Demand-For-Oil.html
A person can still buy the best run companies in the best shale plays and hold for a number of years collecting a nice dividend and more than likely do just fine. Ff course that advice has been true for over two years when the entry points were much better. US shale oil will be produced, much of it at a nice profit because the world is going to need it. just the facts for those of us who deal in facts rather than utopian socialist propaganda.
TT.
Do you think the independent shale companies will pay high dividends? Most do not now, and I assume they will use income generated from higher oil and gas prices to increase CAPEX and hopefully retire some debt.
Also, most are trading lower than early in the year, contrary to the rest of the market. Early 2016 might have been a better entry point, but took a lot of guts.
I own shares of 3 firms that are big into shale. XOM, which has lost money in upstream US almost every quarter the past three years, and is basically this years’ dog of the Dow, but for GE.
I own COP, which cut its dividend and has divested a lot of assets. It has trouble earning much of anything, and borrows to pay its dividend. The one saving thing is I have also owned it for a long time, therefore I also have shares of the PSX spinoff. They pay a very strong dividend and the share price has appreciated nicely.
The third I own is EGN. It was an Alabama gas utility that owned some Permian and Four Corners assets when I bought into it in 1995. It had A- rated debt and was one of the best performing stocks I owned, paid a decent dividend. They sold the gas utility to LaClede, used the $1.6 billion in proceeds to drill Permian hz wells, eliminated the dividend and now have junk debt.
I do not see Shale only firms as a buy and hold investment. I should have sold EGN, but my worst trait financially is not pulling the trigger.
that’s what makes market SS. I do see them as buy and hold investments for the next bull oil market. As to your question regarding dividends, the upstream co I own are paying 2-3 % and the mid stream co around 6% so I have a portfolio paying ~ 4%. So no complaints. I expect increases in prices and product volumes for the foreseeable investment horizon so I am holding both.
Midstream have definitely performed better. Do not need high product prices. Definitely suited to dividends.
Upstream independents typically do not pay much in the way of dividends, even in times of high oil prices, as all income is plowed back into CAPEX. COP and OXY are, but they are divesting assets to do it. Both have shed a lot of BOE to maintain the dividend, and COP had to cut the dividend. That sent the stock price down.
Go back and look at OXY through the years and see if you can find a three year period where earnings have been worse.
Both of these companies will go up if oil goes up. But companies like PXD and EOG say they don’t need oil to go up, they will grow production exponentially at current prices.
WTI is below $51 this morning.
I think that is very faulty reasoning.
Hi Shintzy,
If one assumes that a major World recession is unlikely in the next 7 years (as I do), then an increase in oil prices seems pretty likely by 2020 at the latest. If there is a peak in oil output by 2023, there may be substantial profits in the oil industry from 2021-2027, perhaps extending to 2030. After 2027, World recession (or depression) seems more likely.
It is possible that problems might be mitigated by transition to Electric vehicles, but I doubt this will happen quickly enough to avoid a severe recession starting from 2025-2030 and lasting 5 years or more.
HuntingtonBeach,
I believe you get to the ROOT of the problem, whereas most continue to fumble around with scads of meaningless detail and worthless data. While the U.S. Shale Oil Industry is now in dire straights, the Major Oil Companies aren’t too far behind.
WORLD’S LARGEST OIL COMPANIES: Deep Trouble As Profits Vaporize While Debts Skyrocket: https://srsroccoreport.com/worlds-largest-oil-companies-deep-trouble-as-profits-vaporize-while-debts-skyrocket/
I have read some of the comments here on Petrobras. If my chart can be posted in this comment, you will see that Petrobras wins the award of the top 7 Global Oil Majors with the most debt. If not, here is the direct link: https://dj0s31cxqi9ot.cloudfront.net/wp-content/uploads/2017/10/Worlds-Major-Oil-Companies-Long-Term-Debt-768×555.png?x65756
Not only that, Petrobras now has to fork over $6+ billion a year in interest payments to service that ELEPHANT-SIZED Debt they hold on their balance sheet. Unfortunately, the massive increase in debt had a negative side-effect as Petrobras cut its dividends to a BIG PHAT ZERO.
Thus, if you are a shareholder, you are screwed, and if you invested funds in Petrobras as in Bonds, etc, you are screwed because the return of your capital is likely a BIG PHAT ZERO.
steve
Thank you for this chart.
Even during times of very high oil prices, debt was increasing.
Although it cannot be attributed all to North America, I wonder just how much of this debt increase is due to upstream North American shale and Canadian tar sands?
I know that Statoil is heavy into the Bakken, and just look down post at Rune’s article as to Bakken profitability.
Furthermore, ExxonMobil and Chevron have been consistently losing money in North American upstream since Q1, 2015.
Finally, Shell seems to have been burned everywhere they have tried shale, be it Appalachia, the Eagle Ford Shale or the Permian Basin.
To me asset values are extremely inflated in North America, but what do I know. Pretty much everything I thought I knew about finance went out the window in 2008.
Shallow,
If you enjoyed that chart, you might find this next one even more interesting. The Return On Capital Employed has sunk to all-time lows in these Top 7 Major Oil Companies.
In 2004, when the oil price was $38, these oil majors enjoyed between 20-40% Return On Capital Employed. Last year with the price at $43, their Return On Capital Employed fell to the low single digits. Something is seriously wrong at the Oil Majors, and I can assure you that the TOP BRASS knows it all too well.
Only the public, as well as the ignorant retail and institutional investors still believe in BIG OIL.
steve
Based on what I see the majors doing, I think they are trying to pull out as much money from their businesses as they can before it all fails apart. They do a few deals to appear to stay in the game and prop up stock prices, but are making plans for a future that involves less oil use, either because it isn’t there to profitably produce or is being curtailed for environmental, economic, or strategic reasons.
Steve,
In my view debt is not the problem here – on the contrary it may be part of a clever policy to keep production high and costs low – of course at the expense of investors. High debt enables high capex and thus high production. If the share price tanks – who cares? Top management gets paid anyway and the best thing is when the companies get bankrupt as then the new owner can produce virtually debt free at very low costs and with brand new equipment. This way it should be possible to create a highly competitive oil and gas industry, while investors are holding the bag. In that sense it should be an excellent policy to bankrupt most of the shale industry first as then the industry is really cost competitive – virtually debt free.
However there is a snag as shale assets are not long term assets and wells deplete at escalating speed. Wells decline and deplete on average within one year. So, if a company is in bankruptcy procedure, the wells may have gone already when the procedure has closed – and the new owner sits on an empty shell.
The crux with shale is that it needs always fresh money and there are no long lasting assets like in the offshore business. As many investors can already smell the rat, I think we will see substantial declines of shale production ahead.
They don’t deplete in a year – look at Ennos statistics published here every now and then.
They only lose much of their production in the first year, tickling down on a long tail of 20 years production.
Here’s the hard data, collected from 10.000s of shale wells:
https://shaleprofile.com/
Eulenspiegel, yeah I know Enno’s data, but prefer to rely on the EIA drilling report.
I don’t know about the differences, that’s ok.
What I only want to state is: They don’t deplete totally in one year. They decline much, depending on the fracking technic.
But they deliver oil for about 20 years, last years as a stripper.
Even when they decline 8% a month, you have about 2% of the initial production after 4 years left. And if initial production was 1000 barrel a day, you still will collect these 20 barrels.
About fracking decline rates here are experts that know more – especially there are initial decline rates and a “long end” of slower decline after years of production.
I think 20 years is overly optimistic. Then, again, there is no proof either way as we are over 10 years from finding out. However, if it were true, then the number of wells producing less than 10 barrels a day would keep increasing, and RRCs data contradicts that.
Heinrich,
Don’t forget about plugging and abandonment costs. If a single well cost $100,000.00 to plug and abandon then 1,000 wells x $100,000.00 = $100,000,000 liability. Thus far bankruptcy does not discharge that liability.
I keep thinking aboutl these Co. Announcements that say have 5,000 or more drillable locations.
John S.,
I think this is a good point. It will not be easy to abandon all liabilites and just roll over to a new owner.
Heinrich,
All these 5 mbd of shale is doing is defending the petrodollar and debt based financial system. That’s all to it – without any judgement. Debt is always increasing regardless of the price of oil. Drilling is relentless regardless of price of oil.
Ves,
Agree with you. Yet the cost to do so is now mounting to a very high level – and rising exponentially. Will there be enough naive investors believing in buy and hold shale assets? In my view they are poised for a rude wake up. ‘Men go mad in herds, yet recover their senses one by one.’
Hi Heinrich,
The wells do not deplete in one year, this is based on the faulty assumption that if the well output declines by 10% in the first month that output will be zero in 10 months. Two problems with this:
1. The decline rate is not constant, it decreases over time.
2. Even if the rate was constant (it isn’t), you cannot multiply the rate together, a 10% per month decline would mean a 72% decline in one year.
Based on Enno Peter’s data for all US LTO the average decline rate from month 2 (peak monthly output) to month 13 is about 9% per month over that first year after the peak, in year 2 the decline rate falls to 5% per month, in year 3 the average monthly decline rate is 3% per month, in year 4 2% per month and in year 5 the average monthly decline rate is 1.2% per month.
The EIA’s drilling productivity report is not very good and does not agree very well with EIA’s tight oil production estimates, it also includes output from the LTO regions which is not tight oil output which confounds the analysis.
Dennis,
Yet the decline rate of all existing wells rises every month. This is the most important link to the economics.
I have just gone through the accounting numbers of a few companies again and the numbers are horrible and – as the decline rate of existing wells still rises – these numbers will worsen much more. It is just madness to adapt here a buy and hold stance.
Shale is at current prices simply a very bad business and this will not change until prices are going up substantially.
Hi Heinrich,
I agree at present oil prices, tight oil is not profitable.
Do you expect oil prices will remain under $60/b until the end of 2019? I do not.
Recently the number of horizontal wells completed in the Permian basin has been increasing, this will lead to an increase in the legacy decline.
Dennis, there is a massive structural shift for the shale business. Even if the oil price is much higher, this will not benefit shale companies accordingly as costs escalate at
higher decline rates. Besides, many shale companies have diluted share holdings manifold (WLL has now 360 mill shares outstanding). So, many shale companies will not go back to its former glory – even if oil prices rise. Oil will only rise when shale production stalls or declines.
Hi Heinrich,
That depends on how much output increases elsewhere. US tight oil might rise about 2 Mb/d over the next 5 years, if oil prices rise, if not output will be flat, but inadequate World supply will eventually lead to higher oil prices. Demand will continue to increase at 1.5% per year, but without an increase in oil prices supply may not keep up.
In short, I disagree with your analysis.
Oil Supply will be short within 2 years. if oil prices remain under $60/b.
Heinrich Leopold,
I agree with you that the DEBT is not the major issue today, but it becomes a significant issue later. The increase in debt on these Major Oil Companies balance sheets signifies they cannot produce oil at a profit. Thus, they have to borrow and steal energy elsewhere.
As you stated, they are stealing the STORED ECONOMIC ENERGY from shareholders or via debt from poor slobs who are buying bonds from these energy companies… that will never likely see a return of their investment.
Regardless…. the increase in debt (including rising annual interest payments), is the INDICATOR that tells us all is not well in the Major Oil Industry. I did not say this would impact the market or energy companies tomorrow, but it will become more of a negative issue as the years roll by. And, at some point, it will catch up to them.
Lastly, the U.S. Treasury increased the debt by $318 billion in one day on Sept 8th. Since that date, they have added another $271 billion. Thus, Uncle Sam has added more than a HALF A TRILLION of debt in just a month and a half.
As we can see, the increase in U.S. Debt is now rising at a much more rapid rate than before. Which means, we have entered into a quicker EXPONENTIAL phase.
steve
Steve,
The FED has managed so far to nurture the bubble. In my view only a higher current account deficit can prick the bubble. This is why shale is so important.
Hi Steve,
It is really debt to GDP that is important.
From
https://fred.stlouisfed.org/series/GFDEGDQ188S
Recently the EIA updated its tight oil estimates see “tight oil production estimate” at page linked below
https://www.eia.gov/petroleum/data.php#crude
The past 12 months (Sept 2016 to August 2017) the trend has been a 676 kb/d increase per year.
Note that this estimate does not include conventional output from the various “tight oil regions” as is the case for the Drilling Productivity report.
Hi all,
If we take the chart above and assume a bit of an overestimate of tight oil output by the EIA (too high an estimate for Texas LTO) so that the actual July tight oil output is 4500 kb/d and the rate of increase is 500 kb/d per year, then after 4 years we might see a 2000 kb/d rise in tight oil output for a peak of 6500 kb/d in 2021.
Note that demand is increasing at about 1500 kb/d each year so at the World level we would need another 1000 kb/d from conventional (I am including deep water offshore as “conventional” oil) and oil sands each year (4000 kb/d over a 4 year period). I am highly doubtful that Brent oil prices at less than $60/b in 2017 US $, would result in the necessary increase in World output to about 86 Mb/d by 2021.
This in a nutshell is the reason I expect oil prices to rise, demand for oil will grow faster than the supply of oil, if the price of oil remains under $60/b.
George. Thank you for another very informative post.
I took a look at Petrobras financials on Morningstar. Annual losses in 2014-16. Over $100 billion of long term debt. They just refinanced $2 billion of debt with 7 year 5.3% bonds and 10 year 6% bonds. Those are also backed by Brazil, as is apparently all of the debt. Petrobras is attempting to sell assets to pay down debt.
Any idea as to who owns the debt? I have read about corruption regarding this firm also.
Interesting that production is rising despite these financial facts.
SS – thanks. One reason PetroBras is increasing production is because they went nuts in placing contracts, and I think a big reason for that was the corruption – you can’t get backhanders unless someone is being given the big buck contracts. Some drilling rig contracts have been cancelled but the rest went ahead with couple of delays. That is also why they have the huge debt. I don’t know who holds the debt, but I think a lot is in USD and Euros, which adds some problems given their inflation, but maybe is cancelled by the oil getting paid for in USD. In know they are trying to sell assets but I haven’t seen much news of success – they’ve been trying to sell old onshore and shallow offshore production, most of which has water cuts above 90% and rising – so might be considered a poison chalice by prospective buyers. There also seems to be a three or four way conflict going on between PetroBras, who are trying to be more independent and open to outside investment and involvement, the Government and ANP (the petroleum board) who are protecting national interests (e.g. local content requirements) and also have the corruption ever present in the background and the judiciary who often rule based on ecological issues as well as protecting local interests.
Chinese crude oil production averaged 3.79 million b/day in September, +0.5% m/m, -2.9% y/y
Chinese consumers moving from coal to natural gas to cut smog, pipelines still being built…
BEIJING (Reuters) – China’s state planner warned on Thursday it expects supply and demand conditions to be “serious” this winter, underlining growing concerns that the country’s pipeline and storage capacity won’t be able to handle new demand.
This winter, millions of homes across the north of the country will be heated for the first time by gas rather than coal, as part of the government’s efforts to boost clean fuel use.
https://www.reuters.com/article/us-china-pollution-gas/china-warns-of-serious-gas-market-conditions-this-winter-idUSKBN1CO04Q
The production data releases so far in October. The chart title is in the order of the release date. I was just seeing what it looked like, I don’t usually bother…
2017-10-19 BEIJING (Reuters) – China’s oil refineries increased their run rates by 12.7 percent to a record for September, data showed on Thursday, after a major new state-run refinery launched operations and independent plants came back on stream after maintenance.
https://www.reuters.com/article/us-china-economy-output-crude/china-refineries-run-at-record-september-pace-stats-bureau-idUSKBN1CO0PH
Quite a big drop in Norwegian production last month – a fair chunk is because Goliat has been shut down while ENI corrects the safety issues on Ex equipment.
“The basin reported a daily production of 1,772,000 barrels of oil, NGL and condensate, which is a decrease of 171,000 barrels per day compared to August. Total gas sales were 9.6 billion Sm3 (GSm3), which is a decrease of 0.7 GSM3 from the previous month.”
https://www.energyvoice.com/oilandgas/europe/153637/norways-production-falls-2/
http://oilprice.com/Latest-Energy-News/World-News/India-China-US-Complain-Of-Venezuelan-Crude-Oil-Quality-Issues.html
Counties are not happy with Venezuela’s oil quality. They are asking for substantial discounts, or sending it back.
The article has some technical glitches, refers to soil instead of sediment, says Rosneft is trying to buy PDVSA. But overall it’s right. What it doesn’t say, and nobody knows for sure, is whether some of the bad oil being shipped is contaminated intentionally. There’s an emerging resistance movement which may be undermining the regime by causing glitches in the oil production system.
Probably will be impossible to determine if it is intentional, or not being given the right tools and supplies to work with. The income is not being transferred back to the people, so it could be the result of being intentional, or just not caring. Probably it will get worse, and much harder to sell what they do produce. The world glut that eventually remains, may be parked off the coast of Venezuela.
Oil production is below 2 million BOPD and drops continuously. Two days ago Capriles said it was evident the dictatorship would not allow a democratic election to force it out of power, therefore it seems an option is to sabotage the oil industry, to weaken the regime and convince the Castro Mafia they won’t gain by continuing to support their invasion force.
https://oilprice.com/Latest-Energy-News/World-News/PDVSA-Booted-From-Caribbean-Terminal-Over-Unpaid-Bills.html
Yeah, looking kind of bleak. If you can’t sell it, and can’t pay for the storage, what do you do with it?
George,
We see that Mexican net hydrocarbon imports are rising. That chart is just for volumes? So if we adjust for the price of NG, crude and products, the net import problem would be larger?
Try reading the y axis title. Also try actually reading Tainter while you’re at it.
Oops – yes, the axis title does say it.
Yes, I’ve looked through Tainter – his work doesn’t address modern energy problems. I am curious about agriculture, but not enough to try to become an expert on ancient vs modern ag problems – you can’t be an expert on everything. I’m more interested in “extra-somatic” energy stuff (I realize there’s a lot of overlap).
For the same reason, I don’t comment much on climate research. I figure I’ll just trust the climatologists…
A Great post by Rune Likvern on the Bakken at his blog fractional flow
https://fractionalflow.com/2017/10/08/a-little-on-the-profitability-of-the-bakkennd/#more-1235
Rune, if you’re reading here, I haven’t gotten through all of it, but about half.
A few items. We already discussed 6% p.a. and credit ratings, so I will set that aside. 6% is not something pulled out of the air. I can quibble with it but not hugely so and you didn’t just imagine the number so best it be accepted as working hypothesis.
“The second cycle may have been rationalized by several factors like an expected rebound in the oil price, which OPEC (primarily its Middle East members) helped derail through their rapid increase in oil supplies starting in early 2015 in an (believed) effort to fight for market share. The second cycle may also have been rationalized by the incentive structure for management of LTO companies in which these were rewarded by volume growth over profitability.”
This para would be 100% better like so:
“The second cycle may have been rationalized by several factors like an expected rebound in the oil price. It may also have been rationalized by the incentive structure for management of LTO companies in which these were rewarded by production volume growth over profitability.”
Completely uncomfortable with noting Bakken production as relevant to OPEC pursuit of market share. US oil export was prohibited in that time frame. Ban not removed til late 2015. US imports were not significantly coming from OPEC. As far as OPEC is concerned, the US market is served by US flow, Canada flow and Mexico flow. OPEC sources less than 20% of US imports, and most of that is Iraq plus Venezuela, neither of whom had production choices affected by market share concerns. Both just want to ramp up production and market share pursuit is 0 importance to them.
KSA certainly has/had concerns about market share, but the US market and the Bakken were irrelevant to that. Their concerns were China and India and from whom they were buying oil (Russia, Iran and Iraq). Since US crude could not export to compete for those markets in that timeframe it was irrelevant . . . so best that whole rationale come out of your paragraph.
Pretty solid analysis what I’ve seen so far.
Hi Watcher,
What happened to the level of US C+C imports from 2008 to 2014?
The oil market is a World market.
For those interested in more details about Colombian oil production, I’ve been following it for the past three years in detail here: https://peakoilcolombia.wordpress.com/
To add to coffee’s point a while back new industries continue to spring out of the shale patch and the production it brings. While I do not much care for the author of this article it brings home that point while at the same time dispelling a number of the myths within the peak oil blog echo chamber.
Some highlights:
Natural gas production in the Haynesville is up 20 percent so far this year, and the EIA predicts output will increase by another 2 percent between October and November. The rig count current stands at 44, up from just 16 at this point last year.
This time around, private equity giants are trying to profit off the long-overlooked Haynesville. The WSJ reports that private equity-backed companies have spent billions buying up Haynesville acreage from oil majors like ExxonMobil and Royal Dutch Shell.
A third reason for the renaissance underway in the Haynesville is that there are new sources of demand for the gas that didn’t exist a decade ago when the drilling frenzy first got underway. The Haynesville is close to Cheniere Energy’s Sabine Pass LNG export terminal, which came online in 2016. It was the first in a long line of LNG projects planned for the Gulf Coast, which will likely lead to a massive volumes of U.S. shale gas sent to Europe, South America and maybe even Asia. By the early 2020s, the U.S. will rival Qatar and Australia as the largest LNG exporter in the world.
At odds with the LNG craze is the flurry of petrochemical complexes that have been built in Louisiana and Texas over the past decade, hoping to take advantage of the abundant gas supply. The WSJ estimates there are about 80 major petrochemical facilities under construction in the region, with plans to make fertilizers, plastics, and other industrial products. The petrochemical industry battled LNG developers years ago in Washington, hoping to slow the growing federal support for U.S. gas exports. LNG suppliers largely won that fight, and gas exports have been given a green light. So far, the feared price increase for gas hasn’t played out, at least not yet.
https://oilprice.com/Energy/Energy-General/The-US-Shale-Play-To-Watch-In-2018.html
so bottom line free markets work when allowed to. who would have thought….next to no one here?
TT
To give a little follow up regarding the prodigious nature of the Appalachian Basin, the well you mentioned a few weeks back with a 24 hr IP of 61 MMcf – the McGavin 6 – flowed the month of August over 56 MMcfd.
Total just under 2 Bcf – 1.82 Bcf in 34 days.
That’s gotta be the most productive unconventional well of all time.
Pennsylvania just released August’s numbers.
2 wells on same pad from Cabot – T Kropa 8 & 10 have been online under 6 months with combined output over 10 1/2 Bcf.
A 5 well (of 7) pad – the King – just passed the one year mark online with production of 32 Bcf combined production.
One year. 5 wells. 32 billion cubic feet.
This much hydrocarbon is going to start to encroach upon all forms of other energy sources.
Several big pipelines are under construction or far along in the permitting process.
14 months out – end of 2018 – Appalachian Basin output could be in the 40 Bcfd range.
This will make the russians really furious – they earn lots of money delivering piped gas to Europe.
It could also help for CO2 reduction in Europe – replacing all these coal burners, as already in place in the USA.
I think we must change to renewable energies – but this process will take 30 years at least. And gas is a good bridge technology, better than coal.
And lets see how many is left in Marcellus & co after 30 years. US conventional gas is already in deep decline, so in 30 years that has to be replaced, too if you want to stay with gas.
And better to have a source besides Katar in the islamic golf, everytime ripe for an all out SA Iranian Trump war.
JODI numbers for August are out: https://www.jodidata.org
Saudi stocks continue to fall, down 0.41% m-o-m about in line with the past twelve months (7% y-o-y), April and May had big drops at above 1% and January was about 2% m-o-m.
It’s also worth noting that before September 2015 the stocks were rising at about the same rate as they are now falling so overall Saudi has lost about 3 to 4 mmbbls per month (say 120 kbpd) of net excess. The last big production addition from a Saudi new field development was Manifa which completed ramp up at the end of 2014 and added 900 kbpd.
It is worth noting that this is in combination with reduced ezports
PETROBRAS AWARDS SEPIA FPSO
Brazilian state-controlled company Petrobras has awarded Japanese floater specialist Modec International a long-awaited contract to charter a large floating production, storage and offloading vessel to be deployed at the Sepia field in the Santos basin pre-salt province.
The Sepia project will see the floater linked to 15 development wells, with first oil scheduled for 2021.
This has been talked about for a long time. It’s a bit different than previous developments where PetroBras tended to buy new build cloned designs – this is a leased conversion (less debt and less opportunity for corruption).
http://www.upstreamonline.com/live/1368579/petrobras-awards-sepia-fpso (possible paywall – how Upstream chooses what can be seen and what not seems pretty random to me).
On the other hand the next Buzios FPSO has been delayed further. The Sepia project is a year later than originally planned, the Buzios one is likely to be two.
http://www.upstreamonline.com/hardcopy/1367352/bid-date-for-supply-of-fifth-buzios-floater-delayed
Hi George
News from Azerbaijan.
Zardab Field Operational Update
Zenith Energy Ltd. (“Zenith” or the “Company”) (LSE:ZEN;TSX.V:ZEE), the dual listed international oil & gas production company operating the largest onshore oilfield in Azerbaijan, is pleased to announcean operational update on wells Z-21 and Z-28 in the Zardab field, Azerbaijan.
The Company’s operational team is routinely performing checks on a number of wells across the Zardab field.
The Company has recently carried out an intervention in the Z-21 well, specifically by coiled tubing and wireline, without the use of a workover rig. Well Z-21 had been shut-in since 1988 and no surface pressure had previously been recorded in well inspections.
Well Z-21 has periodically been flowed since the completion of this work, producing at a rate below 5 BOPD with negligible wellhead surface pressure recorded. On account of this low production it was decided not to flow the well for a period of two weeks.
On October 18, 2017, an unforeseen build-up in pressure caused a blowout after the failure of a flange on the wellhead. The Company’s field personnel immediately sealed the well and replaced the broken flange. Zenith’s environmental team arrived on-site within 15 minutes and the Z-21 wellsite has now been environmentally restored.
A subsequent well test on October 19, 2017 observed that the surface pressure of well Z-21 had substantially increased and stabilised at 30 atmospheres (atm), with a peak surface pressure reading of 90 atm. The Company’s operational team views the significant increase in pressure as highly surprising, especially as previous well tests had, as aforementioned, recorded very low surface pressure. �
The advances and adoption of these floating facilities will cut both costs and development time dramatically if they continue to be effective.
The world’s largest ever floating structure – Shell’s Prelude – is currently being positioned and moored off Australia’s west coast.
More ships are being used as floating storage and regassification facilities so smaller markets can accept LNG without the huge expense of land-based plants.
As an aside, GE’s modular LNG facility in Elba Island can enable both expansion, speed, and greatly reduced costs for smaller gas producing regions who wish to go the LNG route.
Cut development time compared to what – there aren’t really many (or any?) alternatives to FPSOs in deep water or for smaller, stranded gas deposits, so they’ve not been developed in the past as there were cheaper sources elsewhere.
Mr. Kaplan
The nature of deep/ultra deep development will always call for floating structures.
As your linked article describes, leased conversion, (couldn’t access behind paywall), would reduce the cost significantly from a new build.
There are ongoing innovations – primarily targeting liquefied gas – that will allow operators to possibly target smaller, shallower water depth resources without the necessity of extensive infrastructure.
There are numerous older LNG ships that are being refurbished/remodeled with newer tanks incorporating chilling along with partial repressurization.
The idea being that these ships could dock for extended periods of time and act as a storage/regassification unit to smaller, far off markets.
This approach is coinciding with the rollout of new, downstream hardware targeting the micro grid market.
Islands, semi remote areas, even frigid upstate New York (Albany) are putting these small gas fueled configurations out there to provide both heat as well as electricity.
This is not altogether relevant except to efficiency of using gas and oil, but I foresee small home owner sized electrical generation using gas as the fuel being a big thing in times to come, especially in northern areas.
With computerized controls , small generators can be tied into the home in front of the meter, starting and stopping automatically as needed, and providing juice if the grid goes down, or if peak load pricing is in effect.
When it’s cold outside, the ordinarily wasted heat of combustion can be captured and used for space heating and domestic hot water heat, and by driving a heat pump with the generator, and or directly off the generator engine, which is easy to do, a little bit of gas can return the homeowner an impressive amount of heat and electricity.
I don’t really have a clue as to how big a difference this could make in the market for gas, near to middle term, but long term, this sort of gas fired small scale generation could get to be as common as refrigerators, in northern climes. And the bigger the building, well, the more economic it would be to have one.
The engines could also be made to run on diesel fuel, propane, or even gasoline, but these fuels require storage tanks and trucked delivery and more complicated and troublesome engine management hardware.
Long term, this could conceivably cut the demand for gas for heat in northern climes by as much as half,due to the magic of heat pumps, while also cutting somewhat into gas consumption at the utility scale.
Mac
Don’t know how familiar you are with this whole topic, but reading up on micro grids, gas microturbines, reciprocating engines, CHP (Combined Heat and Power … cogeneration), Distributed Generation can provide a glimpse of what might be over the horizon.
At scale of hospital complexes, small city infrastructure, large industrial operations, these processes are starting to be more widely adopted.
The electricity markets – and heating, also – are in the early stages of significant disruption.
Mexico – maintenance work following Hurricane Harvey resulted in a -16% decrease in output at Ku-Maloob-Zaap. September oil production lower by -10% to 1.73 million b/day
Countries added as they report their September production. Added Pemex too.
US Baker Hughes Rig Count Oct 20th: -15 to 913 (previous 928)
Rotary Oil Rigs: -7 to 736 (previous 743)
Rotary Gas Rigs: -8 to 177 (previous 185)
Permian -6
Canada -10
Baker Hughes GE: http://phx.corporate-ir.net/phoenix.zhtml?c=79687&p=irol-reportsother
On that note:
http://www.energyeconomist.com/a6257783p/exploration/detail/permian/Permian_Basin_Overview.html
Thanks for the previous numbers!! Very, very helpful!!
Sorry, I am bored right now.
Two reasonable drops in a row. I wonder if it’s a coincidence Zero Hedge stopped doing rig count posts last week.
Anyone have any thoughts on this? Onshore Uruguay. The drilling campaign has been quite the farce so far, but after about 4 months to drill 845m they finally got there and found something in the target zone.
On October 20, 2017, the Cerro Padilla X-1 well, located to the northeast of the department of Paysandú, reached a total depth of 845 m, the exploratory objective being the sandstones of the Tres Islas formation.
This is the first exploratory well drilled by Schuepbach Energy Uruguay under the Exploration & Production contracts with ANCAP in the Salto and Piedra Sola blocks.
The profile analysis showed 2 m of sand with oil saturation at a depth of 793 m. Fluorescence occurred throughout the entire range.
This is the first onshore exploratory well in 30 years in Uruguay and the first one in which hydrocarbons have been discovered. Despite this, it remains to be determined whether the discovery is marketable.
The next step will be to study the flow of hydrocarbons to the surface.
The information will not be extended until the new stages of work are completed.
Exploration and analysis work remains to be carried out, but data acquired during this drilling have improved understanding of the geology and exploratory potential of the Northern Basin.
Notes:
Fluorescence: analysis to detect the presence of hydrocarbons
Hydrocarbon saturation: a characteristic that is calculated from the resistivity to the passage of electric currents that allows to conclude that in the pores of the reservoir the hydrocarbons (non-conductors) have displaced to the water (conductor of electricity) originally trapped in them. As an indirect method, it must be confirmed with direct evidence.
https://www.ancap.com.uy/innovaportal/v/2758/1/innova.front/pozo-cerro-padilla-x-1.html
3.5 million people. 39K bpd consumption
don’t need to find much to fuel themselves
https://oilprice.com/Latest-Energy-News/World-News/Schlumberger-Warns-Of-Moderating-Investment-In-North-America.html
From the horse’s mouth. Large scale production increase as EIA predicts, is not in the cards. Upstream will need another year of healing process, even if oil goes to over $60. If this company says this, maybe EIA will take notice. Most of the DUCs are parked on the balance sheet, but still will affect cash flows for this year. Bet they allocate more of their capex to completions for 2018, and less to drilling. Comparable to what they did for 2016. My guess is that, production will increase the first half, followed by a decline. But that depends upon the price of oil, though not as much as EIA predicts. 2017 is almost over, but by having a majority of the income coming in during 2018, it will make a big difference to the income statement, and cash flows for 2018.
There is still approx double the average number of barrels waiting offshore USA, updated to October 21st
Chart on Twitter https://pbs.twimg.com/media/DMrg7YmXUAEwiJX.jpg
Data from http://tankertrackers.com
There has been over a five million draw from the strategic to commercial over the past month. Per the EIA that is supposed to be taken from commercial and refunded to the strategic, at some point. At least, that was the original announcement during post Harvey. That should make up some of the difference. The other could possibly be explained by the small amount of ships that can be let in, at any one time. Still, a bucket brigade waiting in line.
Didn’t see this posted above but it fits in with a couple of the threads. From the FT but copied in full by Hart EP (who should be expecting a letter some time soon telling them to desist from doing that).
IN CHARTS: HAS THE US SHALE DRILLING REVOLUTION PEAKED?
https://www.epmag.com/charts-has-us-shale-drilling-revolution-peaked-1663686#p=full
As the industry has recovered since 2016, companies have moved from drilling in only the most productive ‘sweet spots’ and started to produce from more difficult rocks, creating a natural drag on productivity. Improvements in production techniques have to fight against that drag, and it seems that in the Permian recently they have been losing.
You have some companies who only own “bad rock”. So, they drill to try to stay alive. If oil were at 80, they would be fine, but they are close to the funeral, now. There is also some drilling to hold “bad rock” leases, as they expect the low prices to gradually rise, and those “bad rocks” will transform into “good rocks”. In short, it hasn’t peaked yet. However, unless there are serious technological advances (we only get 8 to 14% of the total), it won’t ever reach the peak currently being talked about. Just my opinion. Ok, you get what you pay for.
Hi George,
Great article.
From the article you linked:
Companies have been using ‘bigger’ fractures, with higher volumes of sand, and the result has often been higher production. But there is some evidence that that process may also be hitting its limits. A good way to assess underlying productivity is to look at production per well, adjusted for the total depth and length of that well.
Kayrros, a Paris-based energy research firm, has done that exercise for the Permian Basin of west Texas, the hottest area for investment in the U.S. oil industry recently. Its conclusion is that productivity adjusted for well length stopped growing in 2016, and may even have fallen a little in 2017.
As the industry has recovered since 2016, companies have moved from drilling in only the most productive ‘sweet spots’ and started to produce from more difficult rocks, creating a natural drag on productivity. Improvements in production techniques have to fight against that drag, and it seems that in the Permian recently they have been losing.
This is summarized in the following chart. (Bigger chart in article, 2nd to last chart in the piece.)
Paris based research firm. Permian has a bunch of new players. There is some exploratory drilling in all that. Take, for instance, the Alpine High. I looked at the first ten of those, and got bored, they were so puny. However, I understand that they finally drilled enough of them to make some positive assumptions. Then, there is drilling to hold leases, and there is a big area to hold leases. On the other hand, I have heard some very positive reports from normal developmental wells. Wonder if our French firm took these differences into consideration. Also, completions have been very low this year, so it doesn’t take much to skew the results.
Hi GuyM,
Unfortunately I do not have access to lateral lengths for wells completed so I cannot check the analysis. Do you agree that some of the increase in average output for horizontal Permian oil wells is due to an increase in the average lateral length of completed horizontal Permian oil wells?
I do agree that the factors you mentioned may also tend to reduce output per well and eventually the sweet spots may become saturated with wells so that more marginal areas will need to be drilled.
The fact that 25-30 Gb of oil has already been extracted from the Permian Basin area may indicate that much is already known about the geology and the sweet spots may be fairly well defined. If that assessment is correct, then it is likely the most productive areas were developed initially and the other areas may be less productive.
Based on Enno Peters data at shaleprofile.com it looks like there has been little productivity increase since 2Q2016 in the Permian basin. The 2Q2016 wells (535 wells) have an average cumulative output of 138 kb at 13 months and peak average output (in month 2) of 620 b/d and after 13 months output is 224 b/d for the 535 well average. That is a 64% decline over 11 months (month 2 to month 13) and an average monthly decline over those 11 months of 8.84%/month.
https://shaleprofile.com/index.php/2017/10/06/permian-update-through-june-2017/
I think there is some decrease in productivity, yes. The extended laterals did increase production, but questionable increase to productivity. Just a cheaper way to increase production. May pay for that later. Drilling too close of wells probably decreases production, but helps them drill more in sweet spots. Every thing is justified to show they made more production. However, they are better during the drill, but that is old hat. Just had problems with an outside firm trying to indicate that they are being relegated to drill in non-productive areas due to a decrease in productivity. Lame deduction.
I agree, but if the chart is accurate (I don’t have access to the data so I cannot confirm) it suggests we might be getting close to the point that productivity per foot of lateral length is decreasing. I also agree there could be other explanations such as completing wells on a lease so it is held by production (HBP).
As this play is so mature, wouldn’t there be old vertical wells already producing on any prospective lease so that pretty much everything is HBP already?
https://www.cnbc.com/2017/10/18/iraq-oil-shipments-to-turkey-reportedly-plunge-after-standoff-with-kurds.html
Thought the Iraqis had it under control. Lol. My bet, there is more to come, but it won’t be to the US benefit, because we left before the wedding. The bride found another groom. The Iranian Guard has no possibility of defending a push back by Putin, or a longtime resistance from the Kurds. ISIS had no chance against the Kurds. Yeah, they may give some ground, but only for strategic purposes. They are the Kurds. Same Heinz 57 as the US.
GuyM,
What caught my eye the other day is that Rosneft has taken a majority part of the Kurds’ own pipeline to Turkey, the one that has allowed the KRG to ship oil to the Turkish port Ceyhan on the Mediterranean. This is not the Iraqi pipeline.
Turkey and Russia have been cozying up for some time now in dealing with Russia’s increasing its supply of NG to Turkey by starting a new pipeline across the Black Sea. Now Russia’s largest oil company is going to be running the Kurds’ export of oil through Turkey at the same time that Erdogan has threatened to stop the flow of Kurdish oil through Turkey.
I think Putin is having a good time.
Vlad The Bad is having a good time!
https://oilprice.com/Energy/Energy-General/The-Approaching-US-Energy-Economic-Crisis.html
Somebody tell me what she is saying is the Goldilocks price? $100 is way too hot, $60 to $70 is probably too hot, and the current price will create a capital problem (it has). In the meantime, “I’m stuck in the middle with you”.
Hi GuyM,
I can never follow Gail’s analysis. In the article she start with “energy”, but then shifts to oil. Clearly other energy sources can substitute for oil, so that claim needs to be backed up by all energy sources peaking and declining which she fails to demonstrate. This might happen over the long term, but a population peak around 2075 and continuing improvements in real GDP per unit of energy consumed may mitigate this problem.
Then she makes the tired argument that rising oil prices were the main cause of the global financial crisis, this claim is highly suspect. As World real GDP growth continued at 2.5% per year from 2011 to 2014 when oil prices were high. This is only slightly less than the long term rate of growth of World real GDP from 1980-2014 of 2.9 % per year.
The $60-70/b price being “too high” is pulled out of thin air and is not supported by any argument she makes.
She goes on to wage disparity and I lost interest.
Chart below shows natural log of real GDP from 1973-2015, the slope in the linear trend line is the average rate of growth in real GDP, about 2.95% per year.
Slower growth recently may be due in part to slower rates of population growth. Also as the World economy becomes more developed rates of growth will tend to slow down as has occurred in more developed nations (Europe, North America, and Japan) already.
Natural log of World Real GDP per capita in 2010 $ in chart below, the average growth rate from 1971-2015 is about 1.45% per year. If energy supply is constrained in the future due to peak fossil fuels and a slow transition to alternative energy (renewable and nuclear), the rate of growth in World real GDP per capita may slow down.
I do not assume real GDP per capita growth will continue at the 1971-2015 average rate, my only claim is that so far there is little empirical evidence that there has been any significant change in the long term growth rate.
I could follow it as well as I did Gracie, on the George Burns show. Yeah, that’s going way back.
http://www.houstonchronicle.com/business/article/Labor-shortage-weighs-on-oil-industry-recovery-12295475.php
At the end of 2015, fracing companies had dropped from a high of 61 in 2014, to over 20. Of course, what are left are higher dollar, now that there is demand.
I think it was a World Oil article that said in May 2017, that a shortage of crews may force the brunt of the drilling results to be pushed into 2018. Since that time capex has cut back, upstream is becoming more profit oriented, and the workforce shortage still exists. While EIA states: “to the Moon, Alice!”
Texas RRC came out yesterday. All categories were down year over year (where is the 1 mill bbl/d increase over last year?). Although the data will be revised later, below chart shows especially in gas well gas a massive decline of gas production to a 25 year low.
Texan producers are doing in my view exactly the right thing: cut production as much as possible in this low price environment and start with full force again when prices are much higher again – and they will be much much higher very soon.
Hurricane Harvey struck the end of August and first of Sept. and some Eagle Ford wells were shut in. I don’t think we can determine the direction of production for another two months when Oct is posted. In my opinion it was declining a little in July, but there is a lot of water under the bridge since then. Literally. I was anticipating more of a drop, but then the August numbers were posted several days late, allowing more time for late numbers to be posted. The month after the initial reporting is when a large part of the late numbers are reported. The RRC had a week they were closed due to an electrical shortage. In short, Quien Sabe? But, in relation to gas, the numbers speak for themselves. Operators have been concentrating on liquid production in the sweet spots for a good while. Gas is only a small part of their income.
Guym,
just the scale of the drop is outstanding: 8 bcf/d. Not many countries world wide produce that much. And there is more to come. The chart reveals a freefall over the next months. They like it big in Texas.
BHP Billiton exiting U.S. shale
https://www.upi.com/Energy-News/2017/10/18/BHP-Billiton-exiting-US-shale/3571508318297/
(maybe the Australians have just been upside down for too long?)
Goodby Eagle Ford, it was good to know you——
BHP is mostly in the gas/condensate window of the Eagle Ford. Hard to make a buck, if gas is less than $3, and the oil won’t pay enough. EOG has also divested some of its gas window property, but the oil and condensate windows in the Eagle Ford are still it’s bread and butter.
And there is a lot of gas in different fields in Texas. Haynesville, Eagle Ford, and more. But if you are a upstream company, it’s more profitable to drill for oil. Prior to 2015, there were areas in the Eagle Ford who made a smaller amount of oil, but more gas. They were profitable, because oil was at $100 a barrel. Now, they are out of those areas, and concentrating on the oil window. Gas is still produced, just in a smaller quantity. At less than $3 per mcf, it’s just not as profitable as the oil.
Hi Heinrich,
Why are you only reporting gas well gas? There is quite a bit of Gas from oil wells in Texas.
Dennis, I could now write an article about RRC data, yet I want to leave this to Ron. Associated Gas is also down yoy , yet holding so far at peak as in my view the GOR is increasing.
HL-Plus, I am not sure where you are pulling your numbers from. I don’t see a drop below 20 billion cubic feet per the Texas RRC final numbers.
Hi GuyM,
Where do we find “final numbers”? At page below the preliminary estimate is about 17 bcf/d for July 2017. These estimates are usually far lower than the actual final totals.
http://www.rrc.state.tx.us/oil-gas/research-and-statistics/production-data/texas-monthly-oil-gas-production/
Yes, we’ve talked about that numerous times. I was only looking at what he posted and picking up “final numbers” for about six months ago and considering them as close. I then scanned the numbers going back to 2013. Nothing was indicating that total gas production would ever show below 20 billion cubic feet, based upon what’s been posted. In other words, ballpark figures said what was posted was not right for total gas production in Texas. Forgive my poetic license.
However, as we are on the topic, only Texas has final numbers. They may be incomplete, for awhile, but nobody ever reports their final numbers to the EIA. The only numbers that EIA ever has are estimates. Unless, they adjust those to Texas actual.
Hi GuyM,
That is correct, for the most recent 24 months the numbers are not very good as reported by the RRC, the EIA estimates based on surveys of the producers that produce about 85% to 95% of total Texas output. The EIA also uses the RRC “pending file” in making their estimate.
After 24 months, the EIA adjusts their estimate to what is reported by the RRC.
So for data older than 24 months, RRC is the best, but for the most recent month to 18 months EIA estimates tend to be closer to the “final” data, between 18 and 24 months it’s a tossup and the average of the EIA estimate and RRC reported output may be the best estimate.
Bottom line, figuring out Texas output for the most recent 18 months requires guesswork, basically nobody knows, but in my opinion EIA estimates especially for the most recent 12 months is best.
I do not disagree with any of those statements.
Guym,
Go to
http://webapps.rrc.state.tx.us/PDQ/changePageViewAction.do?pager.offset=20
click on General Production Query
Initial view : lease
Data range: set date
Choose One: both
District: statewide
submit
Monthly Totals
Then you get exactly
386 bcf of gas well gas production for August, which is around 12.4 bcf/d.
This is now far below past peak of over 20 bcf/d and a loss of over 8 bcf/d within a few months. This equals roughly 1 mill bbl of boe per day or a loss of revenue of USD 10 bn per year. No small chicken feed. You can also see the condensate made a huge drop and also oil fell yoy.
Numbers will get revised upwards next month, yet not that much that the falling trend is undone.
What Dennis was trying to tell you, is that you are not adding casing head gas to the gas well figures. Using the exact same query, you have 197,551,729 casing head gas. Together, they total 583,794,409. That is actually higher than last month that totaled 534,777,620. Eventually, the total gas after a couple of months, will be well over 630,000,000, which will not show any substantial drop from previous months.
I think I am the only one who regards RRC data as providing trend data. Dennis thinks I’m nuts. However, even I don’t see any downward trend, or upward trend from this query. Too many variables for August and September data due to Harvey, and the RRC being out of the main office for a week.
For yearly comparisons, go to the main rrc site, and under the tab for oil and gas, you will find another tab for research and statistics. Find Texas monthly oil and gas reports, and you will find the current totals for all months and for all years back to 2013.
Hi Guym,
I think you are right, but I think Dean Fantazzini’s method (which uses past RRC data going back about 3 years) gives us a better estimate. From last month we have the chart below, which confirms your estimate that EIA may be about 300 kb/d too high.
From Dean’s estimate for July, I like the 13 months vintage data estimate.
Bottom line, I agree with you.
As I have a lot of respect for your opinions, that means a lot to me. Thanks!
Thanks, you follow the Texas data closely, so when we disagree I look closely to check my anaysis.
When we agree we must be right. ☺
anaysis should have been analysis in comment above.
Guym,
As associated gas plateaued in 2014 and starts falling in 2017, the overall picture of a production free fall in Texas remains in place (see below chart). The total fall stands now at 7bcf/d from its peak. However, the current fall is not the real story. It is the shape of the curves, which indicates much more to come.
The data are also confirmed by the RRC drilling report which shows a dramatic fall in gas well drilling completion from 1682 last year and 777 this year until September.
However this is welcome news. Nothing wrong with that, as this paves the way for huge price increases and makes drilling profitable again. Well done you guys in Texas.
Hi Heinrich,
There has indeed been a decline in Texas Natural Gas output.
Based on Dean Fantazzini’s estimate for the July data and using the most recent 13 months of vintage data output has fallen from about 24.5 BCF/d in July 2015 to about 22 BCF/d in June 2017.
This has been made up for the US as a whole by increases elsewhere.
At link below US “Dry shale gas production estimates” can be found (just click on link after scrolling down)
https://www.eia.gov/naturalgas/data.php#production
Data is through August 2017.
From 1Q2007 to 4Q2011 shale gas output grew at about 36% per year, then slowed to 13.6% per year from 1Q2012 to the end of 1Q2015 and slowed further to 3.9% per year from 2Q2015 to 3Q2016. For the past 12 months the trend in shale gas output has been an increase in output at a 10%/year annual rate of increase.
The chart below shows the natural log of conventional dry natural gas production in the US from Jan 2009 to July 2017.
The average decline rate has been about 6%/year over that period.
If we assume that decline rate continues, to remain on plateau shale gas output will need to increase, but the rate of increase can gradually fall because of the falling absolute amounts of conventional natural gas. Currently conventional natural gas is about 38% of the total dry gas output (I have ignored coalbed methane, no data after 2015). This suggests that currently about a 3% annual increase in shale gas output would be enough to offset a 6% decline in conventional natural gas output. This would be roughly correct through 2021. Eventually the shale gas will be subject to the same “red queen” effect as tight oil output, with a peak possibly before 2030, though I have not investigated this in detail. Generally EIA forecasts for tight oil are about two times higher for the US than my best guess (100 Gb for the EIA vs about 50 Gb for my best guess for the US tight oil URR), the same might be true for shale gas with the EIA reference scenario being two times higher than is reasonable.
Heinrich,
Do you have any idea if the drop in production is from conventional or unconventional wells? And do think that operators may be voluntarily curtailing gas production to account for an 8bcf drop because of low prices? I have only had experience with one operator that chose to curtail production because of low prices but that was years ago.
I have no idea how much joint operations are involved in the unconventional plays but in the case of conventional joint operations, gas balancing between working interest owners is an issue when an joint interest partner stops taking its pro rate share of gas. In my experience, if gas balancing could not happen with the affected wells, the partners ultimately had to cash balance.
I would think that gas balancing accounts in an unconventional project would a nightmare with the rapid depletion of these wells.
JohnS,
The reasons for the slowdown in Texas may be manifold. Many gas wells probably do not get financing as the money goes to the Appalachian plays.
However, what I do know is that thousands of gas wells are net shut down in Texas. At some point this must lead to a steep fall in production (see below chart).
Hi Heinrich,
The wells that are shut down are low flow wells, this affects output very little.
Do you remember your predictions for tight oil output in Texas? I believe you were predicting a decrease of 1 Mb/d per year in Texas Tight oil output. There was a small decrease in total Texas C+C output from the March 2015 peak of 450 kb/d as was expected due to fewer completions in the Eagle Ford and fewer vertical completions in the Permian basin because oil prices dropped precipitously from $110/b to $40/b. Since the Sept 2016 low (3150 kb/d) output has recovered a bit to about 3300 kb/d in Feb 2017, since May 2017 there has been a slight fall in Texas C+C output based on Dean Fantazzini’s estimates by about 100 kb/d over 2 months (a 600 kb/d annual rate of decrease if it should continue for another 10 months). The EIA may be overestimating Texas C+C output from April 2017 to July 2017 with the July estimate about 250 kb/d too high. Note that the drilling productivity report’s estimates are even further from reality than the EIA’s C+C and tight oil estimates.
In my opinion the drilling productivity report’s poor estimates are part of the reason the market thinks tight oil output is quite high when in fact actual tight oil output may be 250 kb/d lower than the EIA’s tight oil production estimate for July 2017 (if we assume all of the Texas C+C overestimate by the EIA is from tight oil).
This would suggest that US tight oil output has been relatively unchanged from Feb 2017 to July 2017 at about 4.37+/-0.03 Mb/d. The increased output estimated by the EIA in August and Sept 2017 for tight oil production is also likely overstated by as much as 400 kb/d in Sept 2017.
Eventually the EIA will revise these figures lower.
JohnS,
Beside the shut down of many wells, also completions and permits are way down (see below chart). There must be some purpose of this. In any case, steep production falls in the months ahead are baked in. And this will lead to the turnaround of the gas market.
Your missing half the picture of gas production in Texas. When a horizontal oil well is drilled in Texas, it will also produce a good quantity of gas. Gas is good, for the most part, because it provides pressure to bring the oil to the surface. Normally, the is a corresponding decrease to the gas production, as it decreases with the oil production. However, it usually continues to produce during the life of the well, even if a pump is attached. If you look at your charts, you will see the interest in gas wells start to decrease around 2010, which is the same time frame for an uptick in interest in shale oil drilling. Total gas production is not dropping because of that. It will also vary somewhat, based upon oil production. If oil production drops, you will likely see a gas production drop. So, if you want to analyze gas production, you have to include casing head gas. In Texas, they call a well that produces primarily gas, a gas well. Usually, they designate it a gas well prior to drilling. That’s all you are looking at. A well that produces primarily oil is called an oil well, or an oil and gas well. You have not included any of these wells in your analysis, although they produce a large quantity of gas.
Guym, I have included the casinghead gas figure in the number of total gas. Otherwise the fall would be much steeper.
June 2017, total gas production was over 616,000,000, and that is an incomplete month yet. Still having problems of where you got your numbers. That is from the table I referred you to in the previous post, which is on the main RRC site, not the queries. I do perceive an overall drop, but not to the magnitude you are showing. Then too, oil production is not increasing, lately.
Guym, in July 2015 Texas total gas production has been 758,013 bcf. This is considerably higher than 616,000 bcf. I would say
this is a steep drop.
Hi Heinrich,
You miss the fact that the data is incomplete, the final number will be close to 680,000 BCF, the annual decline rate from August 2015 to August 2017 using a “final” estimate of 753 bcf for Aug 2015 and 674 bcf for Aug 2017 (based on estimates from Dean Fantazzini) is only 6% per year.
The decrease mostly occurred over a 15 month period ( from Sept 2015 to Nov 2016), over that period we would have a steeper decline of 9.6%/year. Since Nov 2016 output has been fairly flat at an average of about 21.7 BCF/d+/- 0.3 BCF/d.
Future output will depend on both geology and oil and natural gas prices along with changes in technology.
Dennis,
The very deep number of July2017 535,0 bcf has been corrected to 622 bcf and the current August number of 588 bcf will be also in this magnitude – as they have reported late in month, the correction ill be smaller.
The fall in production stands at 150 bcf per month and it is falling faster by the month.
Hi Heinrich,
The chaos created by the hurricane may make the correction factor larger rather than smaller, best guess is about average as the two factors might offset (later report vs hurricane problems).
Hi Heinrich,
The “corrections” are simply a matter of late reporting or paperwork problems, they occur over a 12 to 18 month period. So the “corrected” number for July 2017 reported by the RRC is still too low by 58 BCF.
Hi GuyM,
Yes there was a drop of about 3 BCF/d from about 24.5 BCF/d in mid 2014 to mid 2015 to about 21.5 BCF/d in 3Q2016, since then Texas natural gas output has bounced around between 21 and 22 BCF/d based on Dean Fantazzini’s estimates using RRC data through August 2017.
You are correct in my view. Just as the “steep drops” in LTO output that Heinrich envisioned never came to pass.
The same is likely for natural gas. There may be some decline in Texas, but as oil prices rise there may be continued increases from casing head gas that offsets the decline from “gas well” natural gas. So plateau or slow decline is my best guess, it will depend on the rate of increase in oil prices which I will not guess at. (Though $100/b in 2021 seems a reasonable guess, the path from $50/b to $100/b will be volatile.)
Lol. $100 for 2021 is a pretty safe guess. The longer traders try to keep the price in the artificial “shale band”, the quicker and more severe will be the spike. My guess is by mid 2019, we will be scaring $100. But who knows. It’s all a quess, except for the long term scenario, and even that has questions (but not very many).
Hi GuyM,
Long term there are many questions as well, for example we don’t know how high oil prices will go when peak oil hits ($150/b, $200/b?) or how long those prices will last, how fast transition to EVs occurs, or how soon a severe recession hits. No doubt there are many other questions besides these.
Uncertainty is the only thing that is certain.
Texas RRC website has a lot of limitations. Incomplete data being the biggest. The “final” numbers are at the location I referred you to. Yet, they may not be final for over a year, or longer if we hit a big uptick in production. Data on permits on the main website is usually the only thing that has anything close to real numbers. Completions are not complete numbers. One can only estimate trends from completion data. Ad nauseam.
Thank you Heinrich,
I appreciate your comments, analysis, and perspective.
JohnS, Thank you
also for being so constructive.
Hi Heinrich,
There is only a steep decline baked in if there are not enough permits for the number of completions, this is doubtful. Also the number of completions can change month to month as there are plenty of DUC wells that can be completed.
Also a significant portion of total gas is casinghead gas so one would need to consider both oil and gas permits and completions for an accurate picture.
The steep drops you see are a combination of poor data from the RRC (for the most recent 12 months) and poor forecasts from the Drilling productivity report.
Recent estimate from Dean Fantazzini using last 17 months of vintage RRC data. There was a shift in the RRC data to lower correction factors starting in April 2016 which is the reason I use only the most recent 17 months of RRC reported C+C data (most recent 24 months reported by the RRC in each month from April 2016 to August 2017 [17 months] or 408 data points in all used in the estimate).
The chart reports in b/d and the table is kb/d. Reported estimates are for Texas C+C output. The chart is based on estimates by Dean Fantazzini.
Chinese inventories – I agree with this although I doubt that anyone can see that an SPR salt cavern is being filled, not from space? And so there are still some doubts…
Bloomberg – 23 October 2017
Storage data gathered by satellite implies the amount of crude China is putting into storage is below what can be extrapolated from the nation’s customs and production data, Barclays Plc analysts wrote in an Oct. 23 note. That means it may be consuming more oil than official data indicate and that the global supply-demand balance is tighter than estimated.
“If satellite data are accurate and reflective of broader activity in the Chinese oil sector, this is bullish for oil fundamentals,” New York-based analysts Michael Cohen and Warren Russell wrote in the report. “It implies that China’s refinery runs and end-use consumption may be understated, and that global balances are tighter than consensus and our own forecasts.”
Data from Ursa Space Systems Inc. implies inventories in the world’s largest importer expanded by about 360,000 barrels a day from April through August, equating to a year-to-date stockpile build of 87 million barrels, according to the note. That’s about two-thirds lower than the 1 million barrel-a-day rise government data suggests for the period, the bank said.
https://www.bloomberg.com/news/articles/2017-10-23/seen-from-space-china-s-oil-demand-looks-stronger-than-expected
Barclays: https://pbs.twimg.com/media/DMy3UNvX4AA6kLi.jpg
Just to add context, the IEA’s guestimate for Chinese inventories…
LONDON, Oct 12 (Reuters) – China has built its crude oil stockpiles at a record pace in 2017 and while its purchases could tail off towards the year-end, inventories could hit the billion-barrel mark in six months, the International Energy Agency said.
Chinese oil stocks are opaque and data on them has been hard to come by or unreliable. Using figures from China’s National Bureau of Statistics, along with cargo tracking, refinery throughput and crude output, the IEA crunched the numbers.
The IEA said various sources put China’s storage capacity at between 800 million and 1 billion barrels, although it was not clear whether underground sites were included.
“If we use the upper limit of the range of Chinese storage capacity estimates, some 150 million barrels could still be available,” the IEA said.
“If filling continues at a rate similar to 2017´s year-to-date average, it would take another six months to reach full capacity.
The agency estimates that over the first half of 2017, Chinese stockbuilding hit a record 1 million bpd, although that halved in the third quarter of this year.
http://www.dailymail.co.uk/wires/reuters/article-4973620/Chinas-crude-oil-buying-spree-looks-set-continue–IEA.html
IEA charts on twitter
https://pbs.twimg.com/media/DL73OdVW4AAOTyc.jpg
https://pbs.twimg.com/media/DL73PGdW4AA6hAl.jpg
Why don’t these calculations focus on consumption?
Car sales are taking place at a 21 million unit rate this year in China, and the latest consumption data as of July has growth taking place at 6.6%.
There are quotes from Chinese oil company executives saying that oil production is falling faster than expected.
Combine those two items and why is it a surprise that imports are increasing? Further, why presume that increase is going into storage rather than out the exhaust pipe of cars? Those folks create numbers that say what they want them to say and I’m confident that they don’t want Chinese consumption to be increasing at 6.6%.
China Shuts Down Tens Of Thousands Of Factories In Unprecedented Pollution Crackdown
China’s government may be finally getting serious about enforcing its environmental laws.
– estimates that 40 percent of China’s factories have been at least temporarily shut down in the latest spate of inspections.
– the economic hit will be temporary as companies that specialize in clean tech get a boost from so many factories now being forced to comply with much stricter laws.
http://www.npr.org/sections/parallels/2017/10/23/559009961/china-shuts-down-tens-of-thousands-of-factories-in-unprecedented-pollution-crack?
Most of the huge increase in SPR was done with tanks, which lend themselves to overhead analysis.
Hi George
Saw this today.
https://www.energyvoice.com/oilandgas/north-sea/153888/premier-oil-successfully-hooks-catcher-fpso/?utm_source=Sailthru&utm_medium=email&utm_campaign=EV%20Daily%20Newsletter%202017-10-23&utm_term=Energy%20Voice%20-%20Newsletter
The number of natural gas wells in Texas is in a down trend too.
I’m starting to wonder how often the EIA review their assumptions? I guess they may say that due to the large number of DUCs that they are going be right one day?
Above 5,000 MCF/Day: 101
Between 1,000 and 5,000 MCF/Day: 1,284
Between 250 and 1,000 MCF/Day: 8,761
Less than 250 MCF/Day: 67,953
Gas Completions: 101
New Drill: 80
Re-Completion: 20
See the posting above, about Texas gas production. This is a much more complex issue than trying to analyze Permian production trends, without separating conventional from horizontal production.
Don’t forget that much of the natural gas output in Texas is “casinghead gas” which comes from oil wells. An analysis of natural gas output must consider both gas wells and oil wells to be complete.
API: US petroleum product demand hits 10-year September peak
WASHINGTON, DC, Oct. 20 – By Nick Snow – OGJ Washington Editor
US petroleum product demand averaged more than 20.2 million b/d in September, 2.4% more than a year earlier and the highest level for the month since 2007, the American Petroleum Institute reported.
Deliveries, which API uses to measure demand, rose 2.1% year-to-year to an average of 20.4 million b/d during this year’s third quarter, and climbed 1.2% in the first 9 months to an average of 19.9 million b/d from the comparable 2016 period, API said in its latest monthly statistical report.
http://www.ogj.com/articles/2017/10/api-us-petroleum-product-demand-hits-10-year-september-peak.html
Norway wealth fund watchdog reviewing investment in U.S. pipeline firm
https://www.reuters.com/article/us-northdakota-pipeline-norway-swf/norway-wealth-fund-watchdog-reviewing-investment-in-u-s-pipeline-firm-idUSKBN1CS1HH?feedType=RSS&feedName=domesticNews
There are also questions in their parliament about whether Goliat should have been approved – it is still shut down (ENI tried to start up and were told not to), won’t pay out until 2022 (rather than 2019 or 2020) and might not make any gain based on 7% IRR which is what the NPD uses. I think the way Norway works is similar to UK and Canada in that there is no royalty to the government until payout – then it is about 50% on average, so they are effectively losing money if there is a long delay.
https://oilprice.com/Energy/Energy-General/300000-Bpd-Offline-As-Kurdistan-Conflict-Continues.html
Not over, yet.
http://blog.pricegroup.com/2017/10/23/slowdown-in-shale-the-energy-report-102317/
I am beginning to like this guy, again.
Took a quick look at Brent Dec futures price (monthly data), recently up to $57/b, maybe a rise to $70/b by May 2018 and if oil supply is tight possibly $90/b by Sept 2018. At that point increases in tight oil output might keep the oil price flat for 6 to 12 months, but at some point it becomes clear that tight oil output will not be enough to fill the supply gap and oil prices increase to $120/b by Sept 2019, perhaps by then Russia and OPEC might fill the gap but continuing demand growth may make this difficult (though higher prices might reduce the rate of demand growth).
It will be interesting to see how supply responds to increased oil prices, there is typically a 6 to 12 month lag (possibly longer) before supply can respond to higher oil prices.
Chart from
http://www.cmegroup.com/trading/energy/crude-oil/brent-crude-oil-last-day.html
“But at some point it becomes clear that tight oil will not be enough to fill the supply gap”. EIA could do that now. Get prices back up, and there would be less of a price shock, later. Or, at least keep it down for awhile. But they keep far over estimating what shale production can be. I remember reading not too long ago, where they were estimating we would be energy independent on oil. Get a grip on reality.
For an informed person, it would be enough to question a million barrel increase in one year, while the major oil service companies are indicating a decrease in capital expenditures next year, and the rest of this year. These are the guys who will complete the DUCs. Completion costs are as much as 70% of the total outlay for drilling. Major upstream companies have already forecast a cut in projected capital expenditures for this year. Hello, EIA, anybody home?
Your oil price projections are close to my guess. Guess is as good as any. I mean all may go to the wayside if we get some type of major technological improvements, or a major conventional find. Until then, good as any.
Hi Guym,
In this case two people agreeing means very little. Nobody knows what future oil prices will be it is all a guess, but $100+/-20 per barrel (in 2017$) for the 2020 annual average Brent oil price seems as good a guess as any and might have a 50% probability of being correct. 🙂
Note that I would also claim there is about a 25% chance that average annual Brent oil prices in 2020 might be lower than $80/b (2017$) and a 25% chance they might be higher than $120/b (2017$).
Read an interesting article in The Hill, that proposed that there might be a shift in who produces massive quantities of oil. Going forward, more are anticipating that mid and small size upstream companies will attempt to produce enough oil to make them profitable, but stay within means limiting output. On the other hand, big oil has the financial capacity to go all out. Interesting, but not entirely logical, as limitations on completion equipment and crews would not be changed that much. Millenials still view oil with disdain, and as not very stable (really?). Although, I would welcome their entry due to the vast R&D. A lot of work to do in enhanced recovery.
US SPR released 300kb crude oil in week ending Oct 20th. Releases now total approx 7.5 million barrels due to hurricanes Harvey & Nate
My understanding was that most of that was going to be returned to SPR. Which would make it both an import, and a draw when it occurs.
http://www.worldoil.com/news/2017/10/23/halliburton-ceo-defends-fracing-business-as-margins-disappoint
The other two biggies, say business is slowing. Halliburton, however, says they need to raise prices. Which, will help upstream companies, how?
http://english.alarabiya.net/en/business/energy/2017/10/24/IMF-s-Lagarde-praises-Saudi-vision-on-future-of-oil-at-landmark-conference.html
They say they’re on track to sell some Aramco stock in an IPO next year.
There’s some discussion upthread about Chinese oil storage. It seems obvious to me that if they’re storing more oil day after day, they believe that buying it NOW means getting it at a bargain price, compared to next year, even after allowing for storage costs. Otoh, it could be that they are more worried about supply disruptions than they are about the price going up. Maybe both factors are in play equally.
I agree. The Chinese are far from stupid. Most Chinese high school students are probably more adept at mathematics than those at EIA.
China’s existing SPR capacity has largely been filled (mostly above ground so far). Another 75.4mb is under construction for 2018 (Rock Caverns). And more SPR capacity is planned (Salt Cavern).
From – IEA’s Medium-Term Oil Market Report & Barclays Research
Table on Twitter: https://pbs.twimg.com/media/DM5ZQ0FX0AAMLRJ.jpg
Schlumberger’s Earnings Call Transcripts are often worth reading…
Schlumberger’s (SLB) CEO Paal Kibsgaard on Q3 2017 Results – Earnings Call Transcript
Brent crude which is now in backwardation is seeing faster inventory draws and stocks are already approaching the five year average. In North America land where the E&P companies have added significant CapEx over the past year, the production growth is so far falling short of expectations, driven by supply chain inflation, operational inefficiencies and the need to step out from the Tier 1 acreage. This has led to a moderating investment appetite where the previous pursue to production growth is now being balanced out with an equal focus on generated solid financial returns and operating within cash flow.
This moderation can be seen in the flattening trend of the U.S. land rig count during the third quarter and it is also reflected in our customers’ 2018 activity outlook. The more tempered activity outlook for U.S. land combined with the short cycle nature of the business has an immediate impact on the outlook for production growth, which for 2017 and 2018 has been revised down by 100,000 and 500,000 barrels per day respectively. This clearly has a material impacts on the global supply and demand balance.
https://seekingalpha.com/article/4115119-schlumbergers-slb-ceo-paal-kibsgaard-q3-2017-results-earnings-call-transcript?part=single
Thanks EN. The most pertinent statements are “it is also reflected in our customers’ 2018 activity outlook.” …”which for 2017 and 2018 has been revised down by 100,000 and 500,000 barrels per day respectively.”
These guys are a lot better source than EIA. I can’t tell exactly from this what they originally predicted, but downward seems the trend. It’s also worthy to note that Schlumberger has been buying into upstream this year.
I am not sure that SLB wants to buy into upstream. I think it might be more that customers need money from them in order to drill a well, so SLB agrees to participate – in effect donating services for part of the well.
Somebody here might know if I am totally wrong.
Donating? I knew it was bad, but upstream companies have now become charities? ?
Just kidding, I knew what you meant, and the answer is, I’m not sure.
Should keep US demand high for years to come:
https://www.cnbc.com/2017/10/24/gm-plans-to-cut-sedan-production-continue-shift-toward-trucks-and-suvs.html
OGJ – Oct. 20th – WoodMac: Libya’s oil production might have reached near-term potential
– WoodMac said export capacity remains constrained by damage to the key ports of As Sidrah and Ras Lanuf, limiting production to a maximum of 1.25 million b/d, which Libya’s National Oil Corp. has announced as its year end target.
– international oil companies’ reluctance to recommit capital and expertise, a national oil company starved of funding
http://www.ogj.com/articles/2017/10/woodmac-libya-s-oil-production-might-have-reached-near-term-potential.html
Oct 11th Libya’s National Oil Company said that it would be difficult to reach the target, 1.25 million b/d without investment.
The Times has been doing a series of articles on Saudi, mostly prompted by the Aramco IPO and this week’s investor presentations, all behind a paywall though. The foreign business people in Saudi at the moment are as much looking for opportunities based on what the money is going to be spent on; these were highlighted: a new mosque ($25 billion – I can’t even begin to imagine what a building costing that much involves), two new metro systems (about $31 billion), new airport ($8 billion) and new ‘Kingdom Tower’ ($$1.2 billion). So not so much left over for transferring the economy away from oil, or even developing new oil supplies. They also had a prediction for total internal hydrocarbon use of 8.3 mmboe per year in 2028 (3.4 in 2010), which I think would be about a 50% cut in their exports (assuming Flt production, which I doubt can be maintained), and would seem to suggest they aren’t going to be transferring to solar power.
Well, for awhile, they will support construction. Your right, though, I don’t see much of a vision 2030 in that. Unless, they are planning on charging entrance fees to the mosque.
Tourism was the only thing mentioned as a growth industry – apparently they have some pristine beaches. How many people will have money for that?
While I was living in Arizona, I still remember a bumper sticker that said: “nice beach, where’s the water?” Most of Saudi Arabia could use that one. Tourism? Heck, they don’t even like us. Why would I want to go there?
Or the opposite point of view:
Australia- Arkansas with a beach.
Topless?
No Euro is going to go there.
Prince Mohammad unveils $500 bln megacity
“NEOM will be backed by more than $500 billion over the coming years by the Kingdom of Saudi Arabia, the Saudi Arabian Public Investment Fund, local as well as international investors”, said Prince Mohammad, who is also chairman of the PIF.
Future technologies will form the cornerstone for the development, such as autonomous cars and passenger drones; new ways of growing and processing food; free high-speed internet; free online education; full scale e-governance; net-zero carbon houses; and a city layout that encourages walking and bicycling, he added.
NEOM will operate as an independent economic zone with its own laws, taxes and regulations, according to its official website.
The new development – which will be solely powered by renewable energy – is expected to boost economic growth and diversification, create job opportunities, and enhance the Kingdom’s gross domestic product.
https://www.argaam.com/en/article/articledetail/id/511012
https://twitter.com/ArgaamPlus
And everything under Sharia and religion police to enforce gods rule with worldly force?
Rigzone – October 24, 2017 – The U.S. Department of the Interior’s Bureau of Ocean Energy Management (BOEM) on Tuesday proposed what it claims is the largest oil and gas lease sale ever held in the United States.
BOEM will solicit bids on 76,967,935 acres in federal waters offshore Texas, Louisiana, Mississippi, Alabama and Florida – an area roughly the size of New Mexico. According to the Interior Department, the amount of acreage up for lease includes all available unleased areas on the Gulf of Mexico Outer Continental Shelf (OCS).
http://www.rigzone.com/news/boem_plans_biggest_gom_lease_sale_ever-24-oct-2017-152191-article?
Will it do any better than the last offshore auction?
A moment for Sovereign Wealth Funds. The talk above about KSA spending will likely be from a new (recently created) and separate SWF from their primary. Important item, the KSA SWF is not in any way independent of anything. It is within the auspices of and controlled/managed by the KSA central bank. Imagine that. And a reminder. The domestic spending, of whatever magnitude, to keep the people happy . . . remember that? Well, it doesn’t come from the SWF. They prefer to issue bonds to fund that (and I’ll leave the identity of the bond purchasers (lenders) as an exercise for the reader).
Norway’s SWF is called “The Oil Fund”. It is largest in the world at $1 Trillion (btw Norway population 5.2 million). Mostly stocks, some bonds. International portfolio. It has “Pension” in its formal name, but the money supports no pensions. Norway has a separate pension fund (like US Soc Sec) that is not connected to The Oil Fund. That separate pension fund is funded as other pension funds are funded — via worker contributions. The Oil Fund doesn’t have any of that.
Now then, Norway’s budget runs a surplus of about 3% GDP. The influx of oil revenues have some US style extraction tax/royalties on it and that goes to the government budget, along with other general taxes — and spending is subtracted from that to generate that surplus. What is left over from taxes/royalties goes into the SWF. And has for years and years and is now $1 T. Fund management has an ethical governance criterion on companies. They won’t buy into anything distasteful and have divested now and then when something offends them.
Norway debt 35ish% of GDP, and as best I can tell only because someone told them it’s normal to have debt.
$1T underpins stocks globally. $1T is 1.3% of all the stocks in the world. They add every time they sell more oil. You can add Kuwait, UAE and KSA to that. They do the same.
Hi all,
New post by George Kaplan on Gulf of Mexico
http://peakoilbarrel.com/gom-july-production-update/
and a new Open Thread
http://peakoilbarrel.com/open-thread-non-petroleum-october-25-2017/