The following June OPEC data is based on the latest July OPEM Monthly Oil Market Report and is in thousand barrels per day.
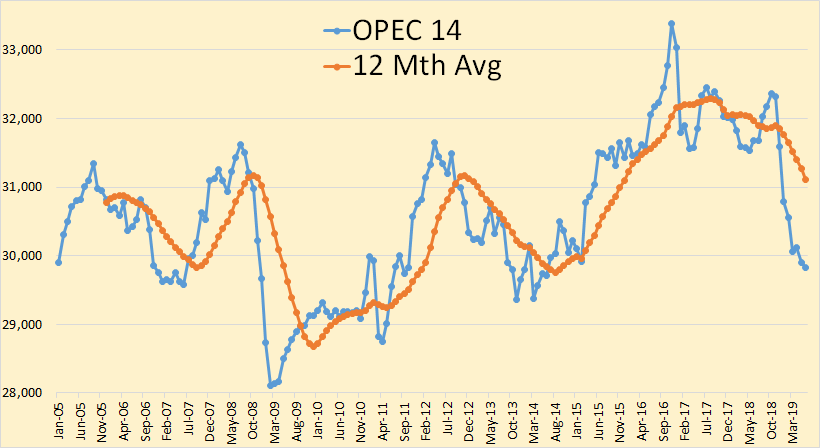
OPEC 14 crude only production was down 68,000 barrels per day in June.
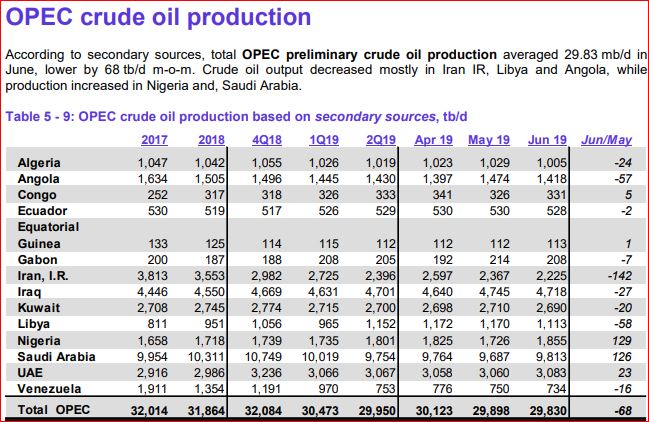
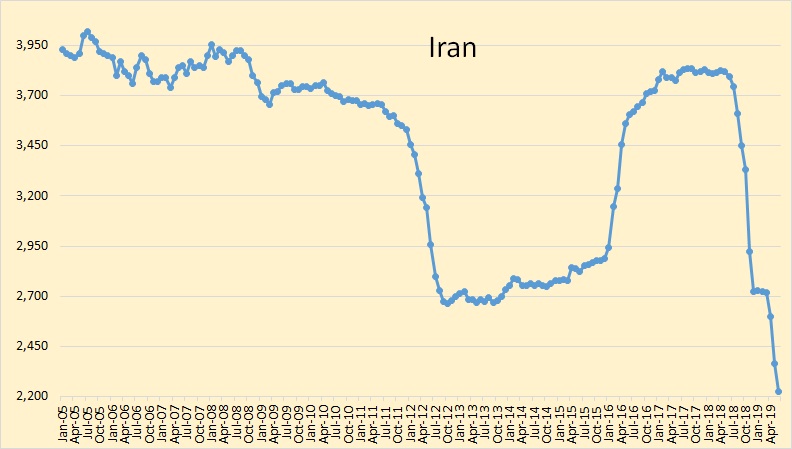
Iran continues to decline, down 142,000 barrels per day in June.
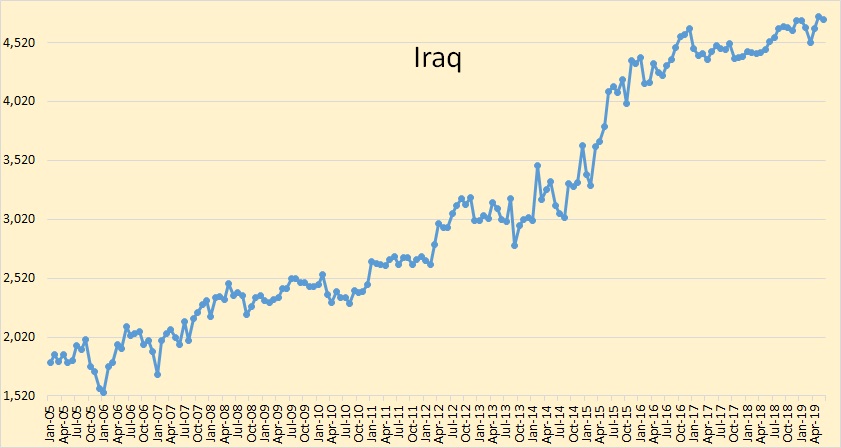
Iraq is still pretending quotas do not exist.
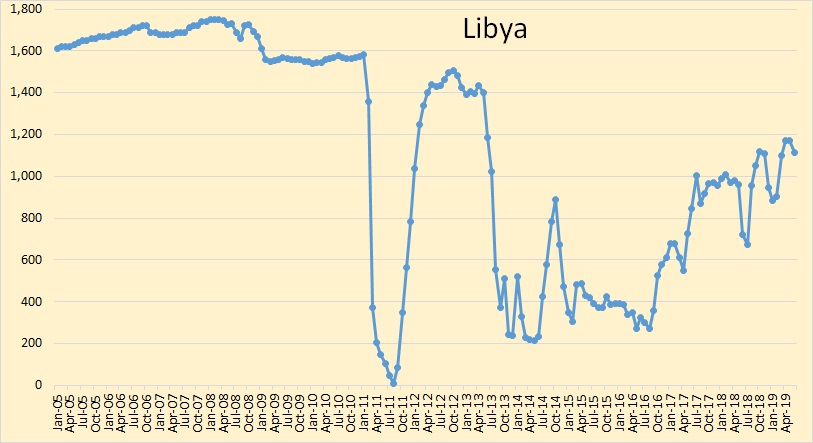
I think the rebels are only having a slight effect on Libyan production. They appear to be producing at near maximum possible production even if there were no rebel problem.
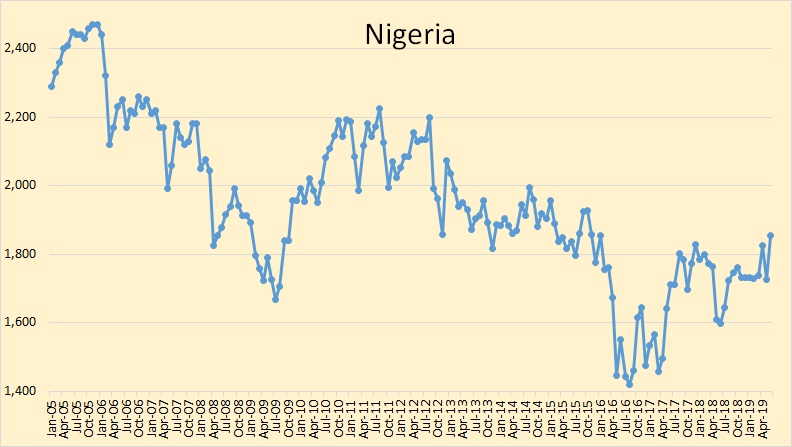
Though Nigerian production was up 129,000 barrels per day in June, I think they are well past their peak and are now in slow decline.
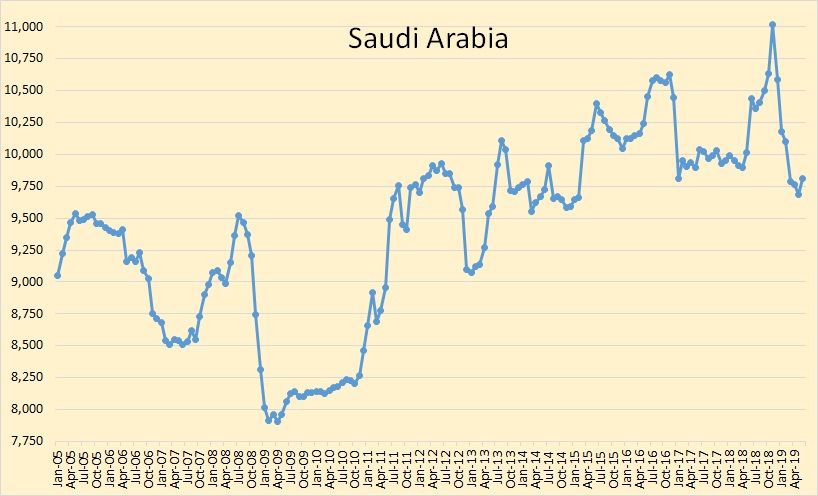
Saudi Arabia, though their production was up 126,000 barrels per day in June, is still producing half a million barrels per day below their quota.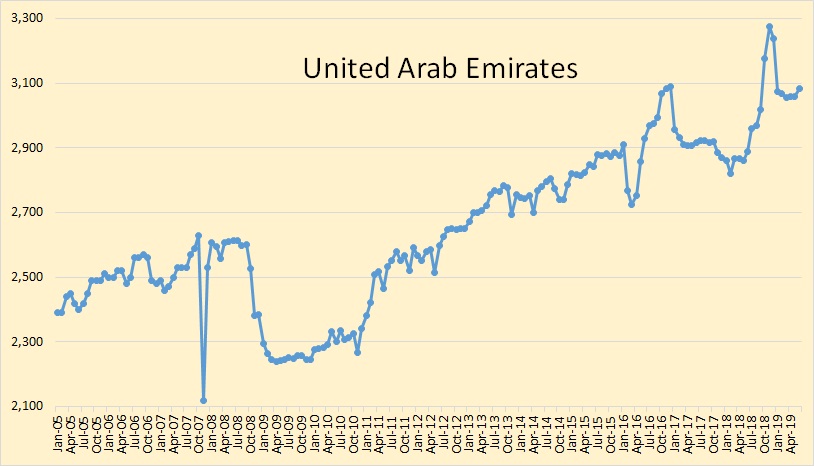
The UAE is holding steady at just over three million barrels per day.
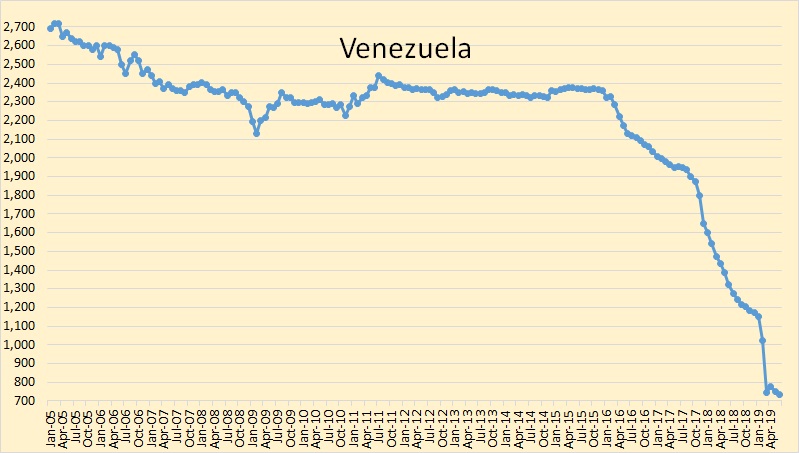
Venezuela seems to have bottomed out at just over 700,000 barrels per day. Venezuela averaged almost 3,000,000 barrels per day in 2001, the first year I have records of their production.
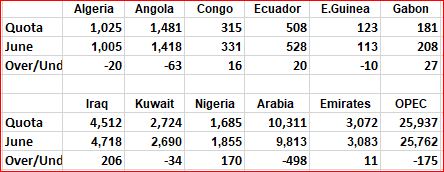
Iraq, Libya, and Venezuela are exempt from quotas. Iraq is not exempt, they are just ignoring their quota and producing flat out.
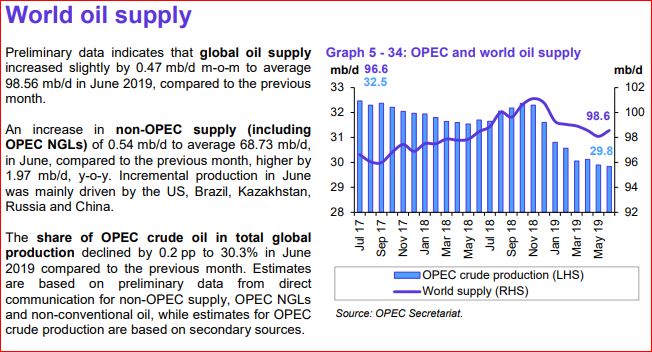
I think OPEC’s estimate of world liquids production for June is just a tad optimistic.
Rystad Energy Shale Newsletter
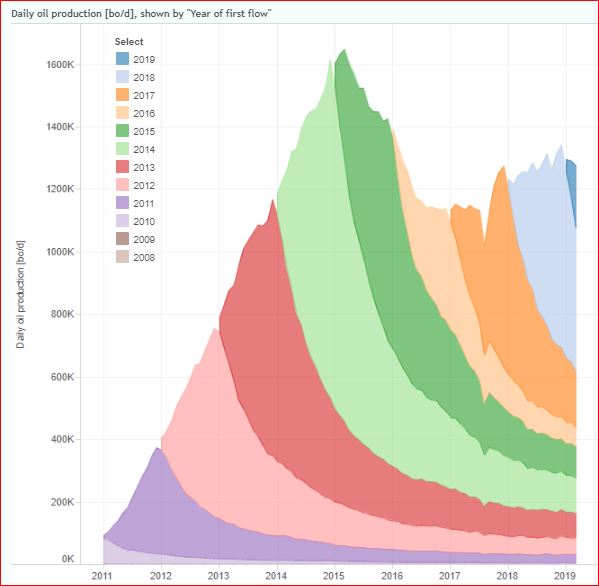
In a previous commentary, we focused on the profitability of modern shale wells across the Wolfcamp A zone. This time, we are analyzing historical vintages of Wolfcamp A wells from 2014 to 2018. Figure 1 shows a historical three-stream production profile for these vintages from ShaleWellCube, along with the forecast for future periods. The combined output from all five vintages peaked at 1.452 million barrels of oil equivalent per day (boepd) in December 2018 and it is expected to decline to 420,000 boepd by December 2022.
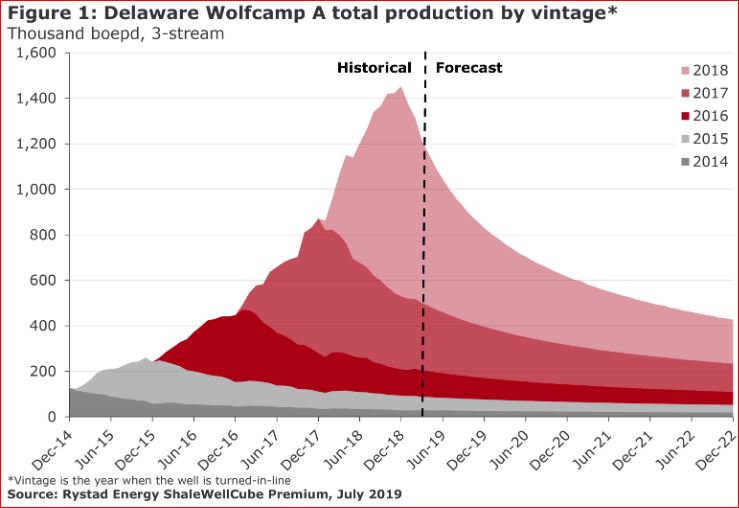
The above chart shows only production prior to 2019. The interesting thing about this chart is that it shows Delaware Wolfcamp production, prior to 2019, declining by 600,000 by December 2019. That’s how much it needs to produce in 2019 just to stay even.
Enno Peters’ Eagle Ford update through March
342 responses to “OPEC June Crude Oil Production”
Very interesting chart on the Wolfcamp A. It’s the main driver for growth in the Permian. It’s definitely not the only shale or oil source in the Permian, but definitely the one with the highest expected growth. They have a B, C and D, but they get less productive and with more gas, the lower you go. No surprise on the EF.
GuyM,
You should read the Rystad piece, based on their analysis the IRR of the average 2016 Permian Wolfcamp A well is 24% and for the average 2017 well about 27%, and for 2018 drops to 20% due to the recent fall in oil prices.
See this chart that shows how average 2018 wells IRR will change with different oil and natural gas prices (NGL assumed to be 33% of crude price).
I’m a little bit suspicious of Rystad because they tilt bullish consistently, and I’m specifically suspicious because only 10% of the shale companies operating int he US have positive free cash flows.
If these wells were really spitting out mid to high double digit IRR’s then these companies would be rolling in cash.
They are not.
Despite saying “fully burdened” multiple times, it wasn’t until I got to the very last paragraph of the report where I found this:
++++++++++
“While the economics of recent vintages in the most prospective US liquid basin remain exceptionally robust, we should note that these ATAX IRRs still do not correspond to fully-burdened returns.
For a complete picture, we also need to take into account land cost, where the variability between early and late entrants is expected to be significant. We aim to tackle this assumption in a forthcoming analysis.”
+++++++
Oh.
They left out land costs. You know, one of the largest line-item expenses there is.
Put those back and these wells are negative I will bet you. And that’s a decidedly “bearish tilting” discovery.
Yeah, the “singers” leave off land cost, road cost, earth moving equipment, tanks, and pipelines, which can easily add up to a couple of million more per well.
Thanks Chris
I missed that. For some basins there might be a 10% IRR at 65 per barrel for the average new well over its productive life for all costs including land.
Howdy from a hot S. Texas, Chris. IRR is a bad financial metric for the shale oil biz; its easily manipulated, much like break’even prices. And generally speaking it’s the same folks always doing the manipulating. The IEA and the EIA are Rystad, DI and IHS’s biggest clients. Good news sells, bad news, not. As George says, it’s not a lie if you believe it.
ROI’s on CAPEX have always been an important, and overlooked key to the failed shale oil business model. The possibility (often based on exaggerated EUR’s to begin with) of earning $13MM undiscounted cash flow on a $8.5MM dollar investment, over 15-20 years, no less, was never conducive to staying out of debt to grow. And current 165% ROI’s on the very BEST of wells are not now conducive to paying interest, reserve replacement and ultimately, we hope, deleveraging debt. It simply does not work. The “models” that predict growth, and debt reduction, short of $85 oil prices, sustained for many consecutive years, are ridiculous. By year end ’19 we’ll see how ridiculous.
The American shale oil phenomena (not to be confused with the American oil industry) is a textbook example of “non-profit capitalism.” From printing press to Central Banks to lenders to shale companies, the end result is suppose to benefit the American consumer at the pump and burner tip and is a great redistribution of wealth in our nation. But it’s the people in the middle that are making the killing, the lawyers that put the deals together, the banks that get the yields, the CEO’s that make the +$20MM annual compensation packages while their EPS suck…the royalty owners getting the free money, they are the big winners. And none of those folks want to see it end. EVER. They could care less about 2 BCFPD of associated gas being flared, or all the LTO getting exported at $20 discounts to Brent, or ground water levels in Reeves County…they love the shale thing because it makes them money. And they all do whatever they can to make sure people believe it’s a miracle, a revolution; a game changer.
Phftttttt.
The real oil business, the real America, works on profit. Debt is for pussies, for weenie-necks, for dads who do not care what sort of life they leave for their kids.
Keep up the good work, buddy!
Yeah, $85 and above would work for some, not all. $65 would work for a lot less of them, and $55 is pretty much a sucking action for cash on almost all. And as a royalty owner, I would much prefer them not to drill until $85. But, royalty owners do not run the damn companies. Faulting them is like laughing at the homeless. I have about 30, or more, wells that can be drilled on my lease, and I have a tiny ownership. Do you think I am happy with $55 to $60 drilling on it, you are wrong. It’s about the last hope in life I have, and I am happy with wasting it??? GD, I am 70, but not that senile, yet. Ok, I may be an exception, but, at least, you could say some, or maybe even a lot. Otherwise, it’s discrimination, which for you, I would not guess. But, all royalty owners, is like downgrading the homeless. Most, do not have a clue they could have had steaks, instead of mush.
I am “discriminating” against greed and in any way I can trying to draw attention to the need to conserve America’s remaining resources. Continuous 120 day drilling commitments in MOST oil and gas leases, term assignments and/or farmouts has led to over drilling, increased GOR and potential loss of BHP and recovery rates. It’s also led to excessive flaring and the waste of associated gas, overproduction, much lower product prices… and more debt. If operators (Lessees/Assignees) do not comply with these continuous drilling provisions they typically lose acreage they’ve paid thousands of dollars per acre to lease.
I am a royalty owner and consider it one of America’s great privileges. By proper management of my minerals I have ensured my family will benefit from them for many, many decades. Onerous drilling to earn provisions, however, are part of why the shale oil and shale phenomena in America is, essentially, out of control and on a mission to drain the last of our country’s hydrocarbon resources as fast as borrowed capital will allow. If your leases do not contain Pugh clauses and drilling commitments then ignore my observations and goodonya.
I guess I see a different picture of most royalty owners than you, and I will just concentrate on the EF, as that’s where I am. Most of the EF was leased up by around 2009, far before public knowledge of the field. Ours was originally with Cheatapeak for about $800 a net acre. The common way to lease it, was through third party land men, who would lie with impunity. The standard story was, if you don’t lease it, with our lease, you may not get anything if they find oil. In return for signing their lease, as is, was a generous quarter, rather than the usual eighth. I knew the rest was BS, but a quarter sounded pretty good. The continuous drilling clause in that, was so weak to be non-existent. No Pugh clause. That was standard. I actually did not sign with Cheatapeake, nor EOG, but the lease wording was basically the same. My guess, is the vast majority of mineral right owners were given the same deal. Maybe not the majority of land, but certainly the number of signers. Most of the Permian was leased many years ago, with an eighth, or less. Chevron actually owns 100% on a lot, and so does Oxy, no doubt. Exxon’s acquisition of the Bass families’ holdings in the Delaware span 4 decades. EOG’s entry into the Delaware was through purchase of Yates. I believe the picture you are painting of royalty owners is distorted, for most. With, at least, the big holders, the number of wells is determined by the company. Not the lease. And most of the rest have very little capex to complete with.
There are so many mineral owners in so many different situations that it is difficult to paint all with a broad brush.
However, management of shale weren’t playing with their own money, and so what happened happened.
If we could just not keep having these quick drops like Q4 2018 and Q2 2019.
I think that it will be interesting to see what happens to all of the sub 10 BOPD shale wells. Better hope no down hole failures. Pretty hard to pay 8 figure pay packages to management on the backs of those. Lol.
I think all investors need to think about what happens when these companies start to run out of shale locations and have falling production.
Just go to shaleprofile.com and run some calculations on 2014-2016 wells in the various shale basins.
By the time you subtract 25% royalty, then severance, LOE, G & A, it’s apparent that the majority of the wells cannot payout in a reasonable time. 3-5 years.
I guess in early 2015 those of us in the conventional upstream arena were saying this. Vertical wells fell off a cliff. But shale wells (with OPM) kept on trucking.
And the stories told about break evens, which we knew were fraudulent, have proven such.
It is not necessary I “distort” the truth or generalize the role greedy mineral owners have in the overdrilling and premature depletion of America’s shale oil resources; the evidence is in every courthouse in every county in every shale oil basin in America. Google it, or better yet, go research public records yourself, as I often have to do. It is abysmal, the requirements made of Lessees, Assignees and Farmoutees to develop those shale oil resources, regardless of price, or pressure preservation or common sense. It is very much part of the problem the shale industry faces. They, and the regulatory agencies that protect them, may have brought it on themselves when they changed applicable field rules…nevertheless the big winner in all of this shale gig is the American royalty owner, RI and ORRI combined. I estimate to the tune of about $800 billion in free money the past decade. Those are just the facts, as painful as they may be.
As a side note, the Texas DPS reports 30 people have been killed on Texas oilfield roads in July so far…all in a hurry to deplete America’s last remaining hydrocarbon resources, flare its associated gas, and export the shit to Korea.
I give up. Communication is at a firewall, here. Ok, the royalty owners are the problem. I will no longer reply to any more of your tirades.
Mike.
I’m not familiar with Texas shale leases nor who the mineral owners tend to be, so I am not qualified to comment as I did.
Where I am, several royalty companies have bought fractional interests in active leases and also where production is inactive.
During the high prices we tried to lease a tract offsetting us, which had been abandoned. The wells are in the state plugging fund. The mineral owners are from a shale state, and they wanted a large royalty, much larger than had been granted here. Plus cash upfront. Plus wanted us to drill the two remaining locations within a certain time or forfeit them (which made no sense given the lease boundaries, etc. So we passed. It has sat abandoned for several more years, Wells haven’t been plugged either.
However, we have reactivated several leases from 1990s to present, and we are working on two more small ones that offset us right now. In each case the mineral owners have been relatively easy to work with.
I ballpark that we have produced over 50K BO from those reclamation projects. With royalties from 1/6 to 1/8, I’d say those that worked with us have fared pretty well.
I guess maybe when you aren’t operating near shale things are a lot easier.
Hi Mike,
I would think the smart companies would not agree to those requirements for a lease. It is a strange way of doing business, at least the way you lay it out. What percentage of shale leases would you guess have such onerous terms?
Hi Mike.
This is a whole different topic: Kayross (I haven’t heard of them) are quoted on Rigzone today as saying that Permian CAPEX data for 2018 have been underreported by some $4.1 billion. They quote Andrew Gould: Average production costs have been underestimated and production per well overestimated. He says that current shale-oil production is substantially more water- and sand- intensive than commonly believed.
Kayross: Sand and water intensity in Permian tight-oil production in 2018 is 23% higher than previously recorded, with sand demand underestimated by 9.2 billion pounds and water by 12.5 billion gallons.
Is this something you’ve come across?
I am having difficulty resolving the discrepancy between the declining production in Wolfcamp A chart above with the attached chart using EIA data the two rising Permian basins, Wolfcamp and Sprayberry. For May, the EIA is showing production of 1.36 Mb/d for Wolfcamp and no sign of rolling over. The linear fit indicates a production increase of 34,200 kb/d/mth.
I always have trouble reconciling EIA data.
Ovi
The chart shows output by year wells completed. So it answers the question what would output look like if no wells were completed after Dec 2018.
Not a very realistic scenario.
Thanks Dennis
What I missed was that there was no 2019 production shown on the chart. I just notice that the 1200 kb/d was lower than the latest EIA LTO data.
Ovi,
I think the chart shows Delaware Wofcamp only where EIA data lumps midland and Delaware wolfcamp formation together, so I expect the numbers would be different.
I can’t take my eyes off of these charts as they unfold in real time. In the last year I am back to watching every post and comment like a hawk. If this weren’t so ridiculously important, I would say I have an addiction problem and need to get help!
Bloomberg news article: “Frackers still don’t seem to realize their glory days are behind them”
https://twitter.com/StuartLWallace/status/1149104114501971968
Thanks Paul,
Chart below from that Bloomberg piece suggests that without all the external capital, US tight oil output would be only about 2 Mb/d instead of 7.5 Mb/d in May 2019. We might see relatively flat growth going forward, much will depend on future oil prices (low prices might result in decline, medium prices, flat output and high prices a small increase, perhaps to 9 Mb/d or so.
Agree, and I don’t think price increases will dent that much for awhile.
GuyM,
Yes probably 3 to 6 month lag between price increase and completion increase and majors may choose to develop more slowly so I expect if there is an increase in tight oil output it will be a much smaller rate of increase than 2017-2018 (where the annual rate of increase was about 1300 kb/d), I expect more like 400 to 500 kb/d annual rates of increase from 2020 to 2022 (on average) and then slower rates from 2023 to 2025 (maybe 200 to 300 kb/d on average). Peak will be 2025+/-1 year with gradually increasing rates of decline.
May be a longer lag. The completion crews may be dropping like a rock, again. They have to permit and drill first, and completions may be a bit sluggish to appear after that. And the funding to do that, is seriously in question, now.
GuyM,
Majors have plenty of money and they may choose to expand output if prices are right. Chevron can deal with lower oil prices and still make money, XTO not in as good a position on NRI.
Wow!
https://www.bloomberg.com/amp/news/articles/2019-07-12/cracks-show-in-the-permian-s-promise-as-shale-producers-retrench
Even EOG. Flat, at best. One could expect more rig count drops soon. Because, this does not reflect the multitude of smaller companies that make up a good portion of production.
This can be used for reference to the article for perspective.
https://www.rrc.state.tx.us/media/50413/top32producers2018.pdf
Oxy is actually three of those companies, now. Both the Oxies and Anadarko.
Up In Smoke
North American oil producers burned to through 187 billion of cash since 2012
Are these the same people who complain about government subsidies for renewable energy? Or scoff at those who dare suggest we need an all out World War II like effort to transition away from all fossil fuel use as quickly as humanly possible?
Inquiring minds would like to know!
Market Summary > Tesla Inc
NASDAQ: TSLA
243.11 USD +4.51 (1.89%)
Market Summary > EOG Resources Inc
NYSE: EOG
90.61 USD USD −0.22 (0.24%)
Jul 12, 9:58 AM EDT
Cheers!
Be sure to let us know when Musk’s vanity project pays a dividend.
https://ycharts.com/companies/TSLA/eps_ttm
https://www.nytimes.com/2019/05/02/business/tesla-stock-fundraising.html
Elon Musk and America’s Toxic Cult of the CEO
“If you have a reckless CEO who can’t be fired because it would hurt the company, then you don’t really have a company; you have a cult.”
https://newrepublic.com/article/151479/elon-musk-americas-toxic-cult-ceo
It’s not about Musk, it’s about the hypocrisy of the fossil fuel advocates who can’t see the berms in their own eyes but call out the splinters in the eyes of others.
WARNING This comment is in part a political rant.
It’s relevant here because electric cars have as much to do with peak oil as geology itself, in political and economic terms.
Sometimes in the eyes of the public, or certain segments of the people, the man and the party, or the man and the company, or even the man and the country, are pretty much one and the same.
It disgusts me to think of Trump as the man and my country, but that’s pretty much the case, in terms of public perceptions of who and what the USA is all about these days, in the eyes of people from other countries. In the eyes of his FOLLOWERS here in this country, as THEY see things, he is all about what the country IS or at least SHOULD BE.
Political revolutions require charismatic leaders, if they are to succeed. Like it or not, as contemptible and physically repulsive as he is, Trump is as attractive to his followers as the most beautiful woman in Holly Wood is to an eighteen year old farm boy who isn’t getting any except from his plain but faithful girl Minnie Fingers.
Economic and technical revolutions can and do come about MUCH sooner, and mature MUCH faster, if there are charismatic leaders.
The leader’s charisma may well be FAR AND AWAY more important than his actual personal leadership and technical skills, so long as the leader makes sure he has a highly competent and dedicated management team.
Trump’ s REAL team is competent, as evidenced by the fact that his REAL friends are getting what they want, namely lower taxes on business and big incomes, looser or not existent environmental legislation and regulations, judges who will toe THEIR line, etc. Nothing else REALLY counts, from HIS pov. All the rest is either show or distraction or a joke. Trump is president of this country because as ugly and repulsive as he IS, he has charisma by the TON, so far as his FOLLOWERS, the foot soldier voters of the R party, are concerned.
Personally I believe that Elon Musk has more personal charisma than anybody else on the planet, in terms of inspiring followers in the high tech industries, now that Steve Jobs and a couple of other such visionary guys are history.
Musk IS Tesla, and Tesla IS Musk. He has by the force of his personality held the electric tech true believers together and kept them faithful to the dream. They bought Tesla’s sight unseen because he inspired them to do so. They put money into the company based on their belief that he would succeed where everybody else has failed in breaking into the auto industry from startup status for going on a century now.
AND so far as I can determine, from reading anything relating to him personally I have run across, he has world class brains and leadership skills as well, as evidenced by his work, his technical vision, and his ability to hire a hog’s share of the best and brightest people in fields related to the electric automobile industry, heavy construction industry, and space industry.
It’s true he has over the last year or two developed a habit of shooting his mouth off unnecessarily at some considerable expense to himself and maybe to the company as well, but anybody that expects perfection in human beings has a rude awakening coming.
It’s also true that he’s been lucky. Some famous political leader, maybe Napoleon, once said SEND ME LUCKY GENERALS.
Musk IS Tesla, in my estimation. The company wouldn’t exist without him. It wouldn’t be the world’s leading company in the electric car industry, and the likeliest leader in the electric trucking industry, and additionally the leader in the space launch industry as well.
Tesla may well have a substantial lead in the autonomous car industry as well, but that remains to be seen. Tesla, or Musk, also seems to be years ahead of everybody else in the future of the inner city transportation industry, given that the Boring Company is NOT actually boring at all.
The Boring Company is admirably positioned to build the future equivalent of subways, and years ahead in the tech that will be used to build them, and I would put money into Tesla to be part of that new industry, except I don’t have any.
Call TESLA a cult if you want.
Some people consider Christianity a cult, and Christianity meets all the usual requirements of the definition, except for size.
Christianity is TOO BIG and TOO INFLUENTIAL, and has been, for over a thousand years, to be properly referred to as a cult.
A week or two ago, some of my hard core nit wit Trump supporting friends and relatives were gloating over the prospect of Tesla going bankrupt, because they only selectively listen to what they WANT to hear. This week they’re totally uninterested in electric cars.
My guess is that the electric car industry is at least five to ten years closer to maturity than it would be without Tesla and Musk.
That five or ten years might be the difference between a successful transition to a post peak oil economy and a crash and burn transition.
Some highly successful but very poorly educated southern general of the Civil War era, when asked the secret of his success, said it was paraphrased, getting thar fustest with the mostest.
Thanks GuyM,
Very nice piece with a bunch of good charts and info. The last two sentences sum it up nicely.
Such measures mean the U.S. will continue to see shale production, but the explosive surges of the past may be over, according to Janus’s Barrett.
“U.S. production in absolute terms will continue to grow,” he said. “But the pace of production increases will slow.”
This assessment concurs with your views quite well, you have been saying this for at least 6 months, I think.
Lol, it’s my opinion, but everyone has one, just like a part of the anatomy everyone else has.
GuyM,
When looking at new drill oil completions for Jan-June in both 2018 and 2019 the numbers are nearly the same, for the Permian in particular the new drill completions for the past 2 months have been higher than the rate of the past 12 months, also the trailing 3 month average new drill oil completion rate is higher than the rate for the past 12 months and also higher than the average completion rate in 2018. It will be interesting to see output levels for the tight oil from the Permian basin in June 2019.
Interesting thing happening in the world of Chinese oil consumption.
First of all, one has to understand the narrative — which is “the trade war will slow Chinese GDP and reduce its oil consumption”.
Chinese 2018 oil consumption was 13.5 mbpd, an increase over 2017 of 5.3%. Domestic oil production fell 1.3% 2018 vs 2017 and is now at 3.8 mbpd.
2019 first half — crude imports to China (the above numbers are all liquids so the arithmetic requires thought) grew to 9.87 mbpd. This is an 8.8% increase.
Scrambling then begins to align with preconceived narrative.
1) Legit scramble is the 1.3% fall in production. That would indeed require more import. So the 8.8% might become 7.5% — still jaw dropping and try not to laugh at EVs.
2) Semi legit scramble is examination of refinery status. If a refinery is down desperate folks leap to declare the imported oil is not “consumed”. Stored instead. Then one digs into the numbers.
3) Exports of fuels is up 13%. But the numbers are small. 13% isn’t a huge number of barrels. Total exports are about 1.4 mbpd, and that’s after the 13%, so growth in exports is only 170K bpd. And 170K / 13.5 mbd (total consumption) is only 1.2%.
And so, sports fans, Chinese consumption is enroute to a 6-7% growth year. That will put it at 14.5 mbpd.
It’s relentless and it will kill Americans someday unless it is stopped. By force.
” Chinese consumption is enroute to a 6-7% growth year….It’s relentless’
I’ll leave other to respond to the call for war, if they so choose.
But I will say that the USA would be wise to have no plan to import oil from beyond this hemisphere, because others, including China, will be consuming all that is available from Africa and Asia.
There will come a time when EV’s look brilliant. To some they already do.
Are they consuming oil or stockpiling it?
Again, the numbers matter. 1 million bpd for half a year is 180 million barrels. Their spr capacity is five hundred million and the last data available says it’s 410 million filled. That was for late 2018.
You can’t just imagine that you have a hundred million barrels of storage lying around that you chose not to have already filled. The whole storage meme globally is analysts making a guess about oil price, throwing together meaningless explanation and hoping the coin flip comes up in their favor so that they have ammunition for their next pay raise negotiation.
Hi Watcher,
Where do you get your info on Chinese storage capacity and such?
Sometime back,quite a while back, I posted comments to the effect that I thought the Chinese were admirably positioned to build lots of storage capacity, considering that they had the money, manpower and industrial capacity to do so, and that the economy was slow at that time. However, due to a lack of research skills, or maybe secrecy on their part, I couldn’t find much in the way of information on their storage, actual or planned.
So … If they built this hypothetical storage capacity, and put a gazillion barrels of oil in it, when oil was thirty or forty bucks…….. Well, they have made out like bandits.
I strongly suspect that they believe that no matter how much oil they have in storage, it will never be too much,as THEY see things, considering that between depletion and world wide economic growth, the price is apt to go up fast enough that they earn a respectable return on their investment in stored oil…… barring a major economic crash.
And having a huge oil reserve has to be a major national security issue for them, considering their need to import such a large percentage of their consumption.
Personally I think our own leadership is as dumb as a fence post for not having a SPR four or five times as big. It’s impossible to say how long it might be before lost export capacity could be restored if a hot war breaks out anywhere in the Middle East.
Interestingly Trump has the opposite opinion and is selling as much SPR as allowed….
Arctic sea route opens for the summer with first Yamal LNG cargo
https://www.reuters.com/article/russia-arctic-lng-idUSL8N246304
Anyone have any thoughts on why Iran is sinking so much lower than the previous round of sanctions? It looked like they had stabilized at a similar plateau earlier in the year but now they’re spiraling down again.
Could be anything. Iran has quit reporting to OPEC. Who knows where it really is. They are, naturally cheating all they can. No doubt, some elements in Iraq are helping, and Russia or China will not disclose anything. We have sanctions on Russia, and a trade war with China. Quien sabe?
Cheating?
What does cheating mean? This production number is way under the OPEC allowed quota.
This was covered here years ago. Look at a map of Iran and look up at their northern border. Oil shipments don’t have to go through the Persian Gulf. We had a great analysis here of how many small tankers go back and forth on the Caspian Sea. Pretty easy to mix Iranian crude with crude from other countries up there.
Yeah, poor choice of words.
https://bakerhughesrigcount.gcs-web.com/static-files/850b7922-b3d5-451f-9e70-364e8a4a17ce
Rig count. Down. Where the heck is Energy News??
Permian down 6, Eagle Ford down 5. Permian down 8% YOY, and EF down over 18% YOY. Total Texas down almost 14% YOY. As of the end of June, Texas completions for oil down almost 13% YOY. Getting close to that magical flat zone, Dennis.
GuyM,
Consider rig counts in early 2018 and note that the annual rate of increase in tight oil output in 2018 was 1800 kb/d. Rigs may need to fall quite a bit to result in flat tight oil output. Much depends on the number of fracking crews and the data is harder to find on that.
Oh, it’s up some. I don’t expect flat to really occur for a few months.
GuyM,
Are you expecting that oil prices will decrease? I think a continued slow increase is likely (annual rate of increase of 400 kb/d) at current oil price level or higher.
No, not decrease, but in this craziness they could. Up and down very slow increase like current. But that is Wag, for sure.
agree with that assessment, or my wag is similar to yours.
Dennis,
We can also see from the DUC data (eia) is that there is more completion than wells drilled currently. Completions are at a higher level than 2018, around 1’400 wells per months between March and June 2019, vs 1’300 in the same period in 2018. But they have to tap in the DUC wells to reach this level of completions, and DUC wells may not be as productive as freshly drilled wells.
I think it is pretty hard to guess the growth of the US production for 2019…
Agreed
The latest SRSrocco is quite interesting.
FINANCE COSTS ARE KILLING THE SHALE INDUSTRY
All true. Interesting that he picked Anadarko to comment on. Pending vote by shareholders for Oxy takeover. WAG is Shell will wind up with Oxy. Follow the stories on the Oxy jet. But, that is basically why the smaller companies will have little capex for drilling. They can’t borrow, and no cash flow.
From Rigzone , Permian is slowing down.
https://www.rigzone.com/news/wire/permian_shale_boom_slowing_down-12-jul-2019-159292-article/
I believe from this very soon US tight oil production will peak and the decline will be huge. The world is not able to face this as there will be lack of oil. Perhaps Mr. President should give some aid as the investors could at least get back some of their investment.
The July EIA Drilling Productivity Report is released in a couple of days. We’ll see what it says about the Permian.
https://www.eia.gov/petroleum/drilling/
https://www.eia.gov/petroleum/drilling/pdf/permian.pdf
Tony,
Took a look at DPR from July 15, 2019 and the trend for US tight oil for the past 12 months is an annual rate of increase of 712 kb/d. For the past 5 months the annual rate of increase is a bit higher at 800 kb/d. The DPR is often on the optimistic side, so I still like my earlier estimate of 600+/-200 kb/d for the annual increase for US tight oil output in 2019.
Another article on Permian slowing down
https://finance.yahoo.com/news/shale-boom-permian-slowing-down-100000463.html
An understatement.
https://seekingalpha.com/amp/article/4274378-oil-and-gas-capital-flowing
Interesting. Marshall Islands would follow US, along with Panama. Bunch of Iranian tankers without a flag country.
https://mobile.reuters.com/article/amp/idUSKCN1U72DS
The early season hurricane in the GOM is going to put a major dent in US July crude output. Around 60% of production is shut-in and will be that way for around a week. This storm is weak but so sprawling there is a huge area of the Gulf flying helicopters is dangerous
Not the Big One for the industry, New Orleans or Houston by any means. Still, Gulf is hot and favorable for storms this year.
The weird part, is that it started forming over the US, and then went to the GOM.
I’m more than a little anxious about this week. Both the Dow and S@p500 have a broadening pattern or some people call it a megaphone pattern sitting on top of them. Both are touching the upper boundaries at close on friday. Like to the pip touching. On monthly chart both have a massive amount of what is known as classical bearish divergence.
Meaning price is making higher highs while the oscillator is making lower lows. RSI (Relative Strength Index) is the oscillator i use most often. Possible end of current uptrend for US equities. The set up could be the possible end to the up trend from 2009. Meaning the all time high is in and it isn’t going any higher. Which is why i’m more than a little anxious to see what happens.
Dollar index. If you use the RSI and look at the dates of 09/17/2018 – 01/28/2019 – and – 06/24/2019. The RSI is making lower lows while price is making higher highs. This is what is known as hidden bullish divergence. Meaning dollar index is likely going a lot higher just judging by it’s structure.
10 year likely hit a low. and will work it’s way back to 3%
Trendline resistance on WTI chart coming off the 2018 highs back in last october comes in at just tad above $62. So some pretty strong resistance should be met there and price should hit it this week as it’s not but maybe $1.50 away from current price.
You do know this is not an investment blog?
And you presumably do know the United States owes about 22 trillion dollars, and each 1% on that is 220 billion?
The FED buying bonds could not possibly have a more compelling reason than that.
Don’t give a crap if this is an investment blog or not watcher. If that top on US equities plays out like they normally do. Your going to see a sea of red on monthly charts.
Go compare any time period where there is a lot of red on monthly charts of US equities and you’ll see WTI and Brent didn’t do very well at all.
I don’t come on here and post my damn charts. And i’m not going to. I’m just giving an opinion on where price is ahead. Dennis gives his opinion about price everytime he does a chart because a lot of his assumptions are based on higher prices coming.
Knowing what i know about global pensions funds. And Dennis is projecting peak oil around mid 2020’s. The Mother of all financial crisis is coming. Between now and 2030.
But keep telling yourself The FED and other central banks can abort a bad ending with unlimited money. People who believe that truly don’t understand how money works. Also why monetary policy should have never been used in response to 2008-2009. We should have ate our peas then.
What FED should do is set rates at 7% and keep them there and let all the chips fall wherever they do. That won’t go over too well though. But what the FED doesn’t tell everybody is when they do cut rates they can’t ever really raise them back up. How negative can rates really go? That is the question. When the price of money can no longer go any lower the game they are playing is over.
Europe and Japan are a lot closer to endgame than the FED is by the way.
You need to understand what a bad ending is. You don’t seem to know.
A bad ending is not when lines on a screen go down. It’s not when asset price numbers decline by 50 or 60 or 70%.
A bad ending . . . a collapse . . . an implosion . . . all the favorite words for this sort of thing, equates to 75-85% global population decline over a period of 12-24 months. You don’t have that, you don’t have a big deal. You get loud talk and hands waving over the heads of guys in suits. You don’t get more graves dug. Only graves matter. The rest is pretense.
If deaths are threatened because non-physical numbers on a screen have a value, then declare the numbers changed. By decree. You think an equity smash down 80% and hints of deaths occur, you think we can’t have a govt decree that all trades of that day or recent days are now cancelled — you think voters with 401Ks would oppose that? There would be no opposition other than shorts, and suspending court funding to hear any such lawsuits is another item that would see no opposition.
A peak in oil production, assuming oil is defined exactly the same way it was defined at all historical parts of its curve, also isn’t all that determinant of big body counts. It only becomes so if demand (not consumption) continues its relentless spike upwards. If people want it, if they desperately want it or need it, then unavailability and lowered consumption gets you body counts, either from mushroom clouds or starvation.
None of which has to have anything to do with squiggly lines on Wall Street graphs.
You need to learn how to keep score. The score is kept in dead bodies, not dollars.
Land ≠ Money
Kid: “Dad? Why are there rich people?”
Dad: “What do you mean by rich? You mean like in spirit?”
Kid: “No-o-o-o-o… Like they have lots of big houses and cars and money!”
Dad: “Ohhh, you mean those kinds. Well, you see, sweetie, our society allows some people to make more money than other people, working no harder than anyone else. Society then allows those with more money to acquire more land than others. Over time, this creates the dynamic for most, if not all, problems we have in society today, like landlessness, homelessness, poverty, social unrest, war and collapse.”
Kid: “Why does society allow that?!”
Dad: “Corruption. Society uses force to uphold undemocratic, unethical laws that say that one person with more money can have more land than another with less money.”
Kid: “Why can’t we stop that!?”
Dad: “Corruption again: This setup is upheld by people with guns and weapons, or access to them, like police, security guards and military people– people (among many others) who often don’t understand this basic and very simple immoral core of our society.”
Kid: ” ? ”
Dad: “Ya; ? “
Japan has demonstrated that when it comes to economics there is no end game. As Watcher often says a pretend system can be manipulated any way you want. Geology can’t. On a side not I have visited Japan every summer for 20 years and I take note of change and it is fair to say the infrastructure is falling apart. Simply not enough workers to keep up even with endless money supply.
HHH, I don’t usually agree with your analysis or conclusions, but I enjoy reading them and feel they help me sort through things. Confirmation bias is something we can all get trapped by if we don’t continue to look at things from different perspectives. This applies to the peak oil question as well as investments.
One of the other common bias is that most on this board and many energy investors over weigh the effect of North American production and inventory. Thankfully Ron keeps reminding us about the rest of the world with posts as above. There are a bunch of countries struggling to maintain production, and a surprise could come from anywhere. Political, economic or resource depletion could all trigger drops.
HHH,
You are correct that low oil prices will result in lower output. I have explored the case for tight oil where oil prices never rise above $70/b for Brent oil in 2017$.
The chart below summarizes my best guess cases for US tight oil for two oil price cases shown on right axis. If oil price is lower than the “low oil price scenario”, then output would be lower if no other model assumptions are modified (well costs, land costs, OPEX, transport cost, taxes, royalties, discount rate, interest rate, etc).
An economic crash will undoubtedly reduce demand for oil, I do not think I can predict future economic output any better than I can predict future oil prices.
So I simply assume IMF estimates of future economic growth will be roughly correct (this often proves in practice to be a poor assumption.)
Note that the $70/bo oil price is based on comments at oilprice.com where a prominent member believes oil prices are likely to remain at $70/b in the medium term (about 5 years), I simply extended that assumption to see the effect on tight oil output.
Hi there Triple H (HHH)
“Knowing what i know about global pensions funds. And Dennis is projecting peak oil around mid 2020’s. The Mother of all financial crisis is coming. Between now and 2030.”
Interesting comment you made there. I’d be very interested to know more about your knowledge and opinions. Wold you ever consider a guest post on this fine blog, (if they let you haha)? I’d like to read more of what you have to say, and why, if that interests you.
Thanks for the interesting comments you bring here.
I have disagreed with some of you about the likelihood of a traditional war.
I think this is the future. It is much cheaper for countries to launch.
https://www.politico.com/story/2019/07/13/trump-cybersecurity-defense-1415650
“No Energy store holds enough Energy to extract, collect and utilise an equal amount of the total Energy it stores.
No energy system can produce sum useful energy in excess of the total energy put into constructing it. EVs, too!
This universal law is applicable to all energy systems – the sun, nuclear fission and fusion, wind, solar, hydro, galaxies and you name it.
Humans have never managed and will never manage to extract, collect and utilise one unit of excess Energy expanding less than one unit of Energy – all along.
All forms of power production humans have today are gold-grade fossil fuels derivatives.
This includes shale oil and gas.
Energy, like time, only flows from past to future” (The Fifth Law).
ROFL, great comedy! Thanks.
“No energy system can produce sum useful energy in excess of the total energy put into constructing it”
Sorry to say you are wrong, especially since you so carefully selected your brand name, advertising and website.
Simply, you forgot about plants, here on planet earth.
Imagine how much more energy one acorn turned to oak can collect, store and distribute over 300 years, than it carried into life.
In this real world.
Oh, and the sun doesn’t count in this equation.
Lets be clear.
Its in a different system. Out there.
Despite reading here for years, today i post my first comment. FRED contains a wealth of information, for example data for car sales, displayed below.
https://assets.wallstreet-online.de/_media/1591/board/20190713210220-uscarsaless190713.png
This image demonstrates the influence of current oil prices on consumer behaviour.
It is not possible to extrapolate this curve in such away that it combines higher oil prices and a flourishing car industry.
What is D and F. Are the sales monthly? Pls provide some commentary or a few words from the WSJ
Domestic and Foreign Autos, data from:
https://fred.stlouisfed.org/series/LAUTONSA
Because the high variation of sales numbers, a 12 month average is used for the y-axis.
The x-axis is C+C production per day from EIA, times WTI cost per barrel, averaged per month.
https://www.eia.gov/beta/international/data/browser/#/?pa=0000000000000000000000000000000000vg&f=M&c=00000000000000000000000000000000000000000000000001&tl_id=5-M&vs=INTL.53-1-WORL-TBPD.M&vo=0&v=T&start=199401&end=201903
Because EIA has about three months delay, the last three months are from OPEC MOMR, with a correction factor.
None of that makes sense. China alone buys about 24 million cars per year. Your vertical axis says the US domestic and foreign sold 450K cars last year. Correct number for vehicles is about 16 million.
You might also want to look into FRED’s definition of car. Sales are over 2:1 SUVs / light trucks now.
Sorry, i missed the light truck numbers. Sales are per month, but averaged about the last 12 months. Including light trucks, the graph is very different, and much less dramatic.
https://oilprice.com/Energy/Energy-General/IEA-Huge-Oil-Glut-Coming-In-2020.html
As long as this BS continues, oil prices will stay low. More BKs and mergers, and flat shale output. Because, it’s now official, big oil determines Permian output. Which will not be recognized much until 2020. Because, the elevator do not go to upper floors. I wasn’t going to call it until an Oxy takeover by a major, but I can finish the sentence with the words we have. Final conclusion will have to wait for the official autopsy, but the doc needs to be smart enough to know that the patient died. May be quite smelly by then.
GuyM,
As Mr Cunningham points out in the end of that piece, the forecasts for US tight oil growth are probably wrong as completion rates are likely to slow down. It is possible that growth rates in tight oil output might increase if oil prices rise. One problem with some of these forecasts is they look at total stock levels rather than crude, light distillates, middle distillates, and fuel oil. There may be quite a bit of growth in “other products”, such as NGL, but those products are less important and supply is relatively amply (they are mostly a byproduct of oil and natural gas production and with the exception of pentane-plus are less important for fuel supply for transportation).
In addition a lot of pipelines are being built and some of the increased “stocks” are used to fill those pipes, a better measure is days of forward demand and by that measure OECD commercial stocks have been flat since 2018Q2 at about 60 days. There has been no “huge” surge in stocks since 3Q2018 when days of forward supply increased from 58 to 60 days for OECD commercial stocks.
Eventually the market will get this right when the 2Q2019 OECD estimates come in in August or Sept, they may well have decreased from 1Q2019 levels as US tight oil output may continue its rate of increase at only one fifth the 2018 rate of increase (2018 annual rate of increase 1800 kb/d, past 7 months the annual rate of increase was 340 kb/d).
Perhaps by 2020 the market may realize that oil supply is short.
Attached is a chart that compares the DPR monthly production predictions for the Permian basin with the actual production increases as reported in the DPR. The EIA has just issued the July report.
As can be seen, the production volatility between Jan 17 and Jan 19 is very high. This indicates that they didn’t have access to good data from many drillers. However, It appears that something has changed as of Jan 19.
The variability has decreased and the actual production numbers appear closer to the predictions. More significantly since May, the monthly increases have been closer to 40 kb/d with the August prediction being 34 kb/d. In early 2018, their monthly predictions were closer to 80 kb/d and nowhere near the actuals.
For all of the LTO basins, the DPR predicts an increase for August of just 49 kb/d. If true, it is not clear to me how OPEC and the IEA are seeing US production increases of 1.5 Mb/d to 1.7 Mb/d for 2020 unless there is a significant increase in drilling activity. At this time all of the indicators are in the other direction
Not a big fan of the DPR. Apples, Oranges Times bananas yield ???
The whole point of the post is to show that maybe they finally got their act together. They are certainly doing better than OPEC and the IEA.
Ovi,
I agree the DPR is better than in the past, it would be better if they modelled rigs in separate categories vertical oil, vertical gas, horizontal oil, and horizontal gas, but in any case it is better than a few years ago. Agree it is better than OPEC and IEA estimates of all liquids output, a number that was never very useful.
Yes, granted, they are. Even the usually strange weekly is within reason. Over, but within reason. I take their monthlies as very close to reality. Their projections ain’t so realistic, just justified numerically.
GuyM,
The AEO 2019 tight oil predictions are not bad through 2026 or so, after that I agree they are not very good at all.
Ovi,
They may be using YOY comparisons and the fast growth of 2018 makes those impressive. They might also be expecting some increase in GOM output as their are a number of projects close to completion or currently being ramped up. SouthLaGeo has better information on this. I think he expects perhaps a 300 kb/d increase in GOM output from Dec 2018 to Dec 2019, this still would be far below the OPEC and IEA estimates for US C+C increase which I agree are too high by at least a factor of 2.
Another problem with both IEA and OPEC estimates is they focus on all liquids output, so perhaps much of this increase that they expect is NGL from associated gas and Appalachian Natural Gas output.
The international statistics are not very useful, except the EIA’s statistics which focus on C+C, unfortunately the EIA statistics are reported very late, with the most recent update only through March 2019.
https://www.marketwatch.com/amp/story/guid/1D0C8511-8ECD-484F-9286-7F5B84A284A8
Odd one. But, Carrizo is in the EF, and Callon in the Permian. Combined Texas production about the size of Anadarko or Apache.
This won’t make the papers like Callon and Carrizo but it is very interesting nonetheless.
Natural Gas Partners (NGP) a private equity group based in Fort Worth has started rolling up the Permian companies it has funded.
Bluestone Natural Resources, Bravo Natural Resources and Blackbeard will combine, The surviving company will be Blackbeard who has offices in Midland and Fort Worth. Bravo and Bluestone people will be working themselves out of the picture over the next month or so.
Last year, NGP started rolling up its Oklahoma companies to sell primarily because it recognized that real liability exists from SWD induced earthquake damage in the SCOOP/STACK and MERGE plays. And also because the plays suck.
It’s a big deal. They are also invested in Centennial, and many others. 20 billion in investments, and they are starting to shrink.
Callon is offering a 25% premium in an all-stock acquisition, based on Friday’s closing prices. But it’s the absolute price that tells the real story. Carrizo is selling out for $13.12 a share, getting it back to where it traded just less than three months ago – and way below the $23 level where it sold a slug of new shares last August. If Callon is engaging in some bottom-fishing, Carrizo is nonetheless grabbing eagerly at hook, line and sinker.
Carrizo’s decision to sell with its stock trading close to its lowest levels in a decade is the salient fact here. It is being paid with stock and its shareholders will own 46% of the enlarged Callon, so they can participate in any gains once the deal is done. They’re better off not looking too closely at their screens on Monday, though: Callon’s stock slumped by as much as 17% Monday morning, wiping out the implied premium.
https://finance.yahoo.com/news/shale-frackers-decision-sell-says-150950126.html
https://oilprice.com/Energy/Energy-General/Shale-Investors-Fear-Bloodbath-As-Earnings-Season-Kicks-Off.html
Ok, the more I read his stuff, the more I understand the more where he is coming from. You have to read his last paragraph.
Four months, Dennis. Price will waver slightly to the upside, before reality sets in. Discounting, even slightly the shale myths is going to take time, and harder numbers. Investors grasp it now. Oil traders and paper traders in oil are a hard nut to crack, because all they believe in is EIA, opec, and IEA. Which will be the last group to get it.
GuyM.
Similar deal in grain trade.
Lots of Ag professors at major universities study grain trade. I listen to some of their podcasts. This is what they say in unison.
Right now the US corn and soybean crop is not looking good. But the funds do not so crop tours, talk to farmers, fly drones over fields, etc. So as long as USDA says all is well, grain prices stay low.
USDA estimated 91.7 million acres of corn planted most recently. None of the Ag professors believe the number, nor do the various independent traders I listen to. But the funds went with it and corn sold off limit down.
That’s a very close comparison. Very interesting.
So as long as USDA says all is well, grain prices stay low.
https://www.axios.com/trump-administration-moving-hundreds-usda-scientists-dc-kansas-city-c53e4520-c37c-4a40-8770-51a584b3d183.html
Trump administration moving hundreds of USDA scientists from D.C. to Kansas City
Details: ERS jobs remaining in D.C. mostly belong to “administrative staff, analysts who perform market outlook estimates and those who collect data,” according to internal documents reviewed by the Union of Concerned Scientists. Their analysis showed that “[e]conomists and other ERS researchers who make conclusions from that data are likely to be reassigned to Kansas City” — but the USDA disputes that.
May you live in interesting times! (Chinese Curse)
WJ Clinton moved the toxic wizards of the FDA to Arkansas. The Elephant in the Room is the unfunded/unacknowledged $40 Trillion (?) Liability for Gov Mules. Get them out of DC for Resiliency.
Both were (and are) corporate whores–
The proletariat can argue who is the worst—
Clinton is a bit brighter, but the Fat Guy is not hampered by any moral decisions.
They guy in the White House is Trump and whether or not he accepts responsibility is irrelevant, the buck stops at his desk. What Clinton did or did not do is water under an old and very rickety bridge. As much of a slimeball as Clinton may have been, at least he understood that certain policy decisions have consequences for the welfare of the entire planet and he wasn’t hell bent on deliberately blowing things up just for the sake of doing so.
The fact of the matter is that the Trump administration doesn’t want the truth about a lot of what the USDA scientists are reporting out of the bag. A lot of it isn’t good news!
Furthermore this was a blatant move to silence them!
https://news.vice.com/en_us/article/evy9ew/usda-scientists-are-quitting-in-droves-thats-really-bad-news-for-climate-research
The researchers’ union anticipates, after an unofficial count, that as many as 80 percent of the employees are planning to quit rather than move, and that will disrupt entire fields of study, ranging from honeybee pollination patterns to how crop prices fluctuate with changes in consumer demand. Their positions will take years to fill, if USDA staff recruits new hires at all.
“Toto, we are not in Kansas anymore!”
One wicked witch down one more to go!
Cheers!
“As much of a slimeball as Clinton may have been, at least he understood that certain policy decisions have consequences for the welfare of the entire planet and he wasn’t hell bent on deliberately blowing things up just for the sake of doing so.”
I’ll disagree vigorously on that one. Clinton repealed Glass-Steagal doing immeasurable damage to the entire middle and upper middle classes. We’re going to be eating the losses from that overt move towards financialization for the rest of everybody’s lives on this board, and several generations past that.
Without the resources to re-build or construct anew, very little can be done compared to had we been prudent instead.
That’s just one example. Clinton was awful. So was Bush. Obama too. Now Trump. See the pattern?
It’s almost as if the president is a meaningless distraction and there’s an embedded state function that chugs along courtesy of the several million non-elected federal employees.
That’s just one example. Clinton was awful. So was Bush. Obama too. Now Trump. See the pattern?
Yes, I do see a pattern! Clinton, Bush and Obama really awful for Americans and I do take your point about Clinton specifically. I’ve never been a fan!
Now Trump is a real danger to the entire planet. I also get the distraction bit and consider Trump to be a puppet but The planet is going to hell in a hand basket and Trump happens to be the figurehead stoking the fires! I consider the damage he is doing to American prestige on the international stage to be off the charts.
In the 1930’s Populism, Fascism and Ultra Nationalism led to WWII with profound consequences for Europe and the world. In the 2030’s it might literally lead to the end of industrial civilization and the extinction of most life.
To be clear, my personal view is that the ‘Global Economy’ is a subsidiary of Ecosystems Inc. Your views may differ.
Cheers!
“The researchers’ union anticipates, after an unofficial count, that as many as 80 percent of the employees are planning to quit rather than move, and that will disrupt entire fields of study, ranging from honeybee pollination patterns to how crop prices fluctuate with changes in consumer demand. Their positions will take years to fill, if USDA staff recruits new hires at all.”
Clasical big business move. Want to downsize? Move business to a far away place, people leave, you haven’t laid people off, blame it on natural wastage.
NAOM
GuyM,
Do you mean that it will take 4 months for the oil price to start to increase as the traders remove their heads from uncomfortable places?
Mostly, yeah.
Is Bakken directors cut overdue?
https://www.chron.com/business/energy/amp/Icahn-takes-another-shot-at-Oxy-Anadarko-fiasco-14044142.php
Per Icahn, he wants a buyer for Oxy. But, I don’t think that differs much from management’s goals. The benefit for mgt would probably be less under him, and no doubt, a different buyer.
Neither one is anywhere near healthy, but it combined size may make it more attractive for a merger, buy, or whatever.
https://www.bloomberg.com/amp/opinion/articles/2019-07-15/callon-petroleum-buying-carrizo-oil-gas-reveals-fracker-woes
Interesting read – 2020 looks to be a big consolidation year for shale. The wheat is getting separated from the chaff, as big banks don’t appear to be interested in loaning to smaller tight oil cos that haven’t ponied up. Specifically, EOG, Pioneer, Chevron, and Exxon look set to come out on top and possibly be the only players of any significance in shale, likely by the end of 2020.
https://oilprice.com/Energy/Energy-General/Shale-Investors-Fear-Bloodbath-As-Earnings-Season-Kicks-Off.html
Oh, don’t forget about ConocoPhillips and Shell. Shell is looking to be a bigger player. And the other top 32? Who knows.
Suppose there’s a subsidy. Then what?
Suppose oil supplies are unlimited. Or that BEVs fall to half their current price level, or that subsidies for BEVs continue.
Many different suppositions could be made.
North Dakota has published their May directors cut. May prelim is 1393284 up 799 from the revised April of 1392485.
They have 91 (revised) completions in April and 94 (preliminary) in May. EIA has 129 in April and 126 in May. And EIA has a lot less DUCs than the directors cut. Where is the difference??
Toby,
EIA includes Montana and North Dakota in their Bakken estimate so that is part of the difference, where can completions be found at the EIA?
Bakken/TF was basically flat, a change of less than 1 kb/d and at 1337 kb/d well below the peak of 1347 kb/d in Jan 2019.
https://www.dmr.nd.gov/oilgas/stats/historicalbakkenoilstats.pdf
https://www.eia.gov/petroleum/drilling/#tabs-summary-3
There is an Excel file “DUC data” where completions are listed by month. More than 30 completions a month in Montana seems to be weigh too high…
Thanks Toby,
The alternative explanation is that the EIA data is not very good, for North Dakota Bakken tight oil completions your best bet is shaleprofile.com
https://shaleprofile.com/2019/06/19/north-dakota-update-through-april-2019/
Looks like it might be 30 completions per month in Montana, or the EIA estimate is just not very good.
And how do 700 DUCs in the Bakken (EIA) compare to 985 DUCs in NoDak alone according to the directors cut? I think that´s just guesses. A little more than 90 completions in NoDak sounds reasonable to because more completions should have resulted in more production growth. It Looks like NoDak Needs around 90 new wells a month just to hold production flat.
Toby,
No idea on the DUCs, often the EIA data is model based and not very good. As I said, shaleprofile.com data is very good, the best free data available, in my opinion.
Enno Peters does an excellent job.
They have activity in Montana, but 30 is not close to likely. EOG is up there, but not much in 2019 plans.
GuyM,
In my opinion where there are errors are probably in the DPR. I have no clue what the completion rate is in Montana.
Looking at Montana data from the state of Montana there were only about 3.4 horizontal oil wells per month completed in Montana in 2018.
For all oil wells completed in 2018 it was about 4 per month in 2018 in Montana.
http://www.bogc.dnrc.mt.gov/WebApps/DataMiner/Wells/WellCompletions.aspx
North Dakota Monthly Oil Production Statistics through May, 2019.
Yeah, that looks pretty flat. Gonna stay that way, or down a tad.
GuyM,
I agree, at the present oil price level. If they go up output may rise and if oil prices fall output may go down. Much depends on the price of oil which is muy dificil to predict.
And again, as usual, no evidence of that. Look at the chart. Extend it back to 2014. Oil’s price has varied a great deal over the last five years, but clearly mostly way down from 2014. No sign of it in the production chart. It’s relentlessly upwards. Didn’t care what the price was.
And that’s the end of the analysis. The presumption of price being determinant only has to fail once to be proven invalid. There’s the chart and we know the price has varied all over the place. It’s certainly far down from 2014, but guess what. Bakken production is not.
Game over. Hypothesis fails. Stop pretending.
Just take the supply with OPM from Investors and retirement fonds as benchmark.
While not at positive cashflow – no space left on the credit card no drilling.
That’s why investor sentiment is important now – are they still buying the bonds and the stocks to get new money?
Oil price is important too – because it determines how much additional capital they need.
In the past that was no problem – if you have limitless credit on your card you can shop limitless.
Watcher,
Depend how much price falls. Output of tight oil decreased from March 2015 to Sept 2016, primarily due to oil prices decreasing. The increase in price over the 2016 to 2018 period led to rising tight oil output. Changes in costs to produce oil as plays are better understood (Permian basin tight oil mostly during 2015 to 2018 period) and output per well increased is a complicating factor. Not only price determines output, things are never as simple as you assume.
Meaningless gobbledygook. Repeat after me. You only have to fail once for a hypothesis to be rendered invalid.
Don’t equivocate about costs and then pretend that your hypothesis is intact. If price does not determine production and something else does, then price does not determine production.
And don’t wave hands over head and try to make a case for it being a special case. Not more than a few months ago we talked about another occasion where price clearly and absolutely did not determine production in any way whatsoever, throughout the early 1940s. Price didn’t determine production and supply and demand did not determine price. End of theory. Find another.
Put the silliness away. It is normal for other factors to determine these things. It is abnormal for something like price to be the major issue.
One failure ends a theory. We know of many. The theory is ended.
Watcher,
Your math skills seem to be limited to equations with a single independent variable.
The world seems to be quite a bit more complex than that.
Costs are not fixed, and there are multiple different formations in both tight oil and throughout the World at different stages of development.
I am pretty sure an oil pro would tell you that the price of oil will affect their decisions on whether to develop a well or not, but once the process reaches a certain point the project will likely go forward and the oil may be produced because sometimes (perhaps always) shutting in the well will do damage, rates of production might be reduced in a low price environment.
For each well drilled and every project considered the economics will be unique, but for any single decision the price of oil will be one of many variables that will affect the final decision.
This is not a hypothesis, it is a fact, though I will defer to Shallow Sand or Mike Shellman who actually have made these decisions for many years and know far more than me.
I think the discussion was the 30s not the 40s during the Great Depression (ended in 1939),
you seem to not understand what demand is.
It is not the desire for a good, it is desire backed up by money to make the purchase.
Pretty basic stuff. You also don’t seem to get that supply and demand determine the price of a good and either curve can shift for a multitude of reasons, you can call it hand waving, I call it reality, things change always, it is the only constant.
Money Versus Gun
You and I are at a pool of oil that, in its entirety, both of us somehow needs badly/very soon for our survival (let’s say for a few salads) but only one of us can have it because it is not big enough for another…
There’s someone, completely unarmed, who claims it, standing along with us who’s willing to offer it to the one with the most money…
You have lots of money and are also completely unarmed, and the price is affordable to you. I have no money, but a gun…
Who likely gets the pool of oil?
Marx And Ethics
“Marx also argues that in a developed exchange economy, money replaces need as the mediator between human beings and the object. If I have a real need or talent, but no money, the need or talent may well remain unrealized and even may appear unreal and imaginary. On the other hand, if I have money but no true talent or need, I can easily realize my slightest whim. Thus, money distorts reality; it turns essential reality into an unreal dream, and mere whims into reality.”
Two quarters of land with copious amounts of sand sold for 20 million dollars. Far more value in the sand than 20 million dollars paid for the two quarters of land.
The sand will be used for fracking Bakken wells.
Expect the Bakken to begin to produce more oil, not less.
The numbers don’t lie.
Bakken might increase a bit more, much will depend on the future trend in well productivity, I expect the average new well EUR in the Bakken/Three Forks will eventually start to decrease, perhaps we will see evidence of this by 2020. Once this starts it will relentlessly decrease and output will decrease as well completion rates may decrease due to lack of profit. Depends in part on oil prices, if oil prices rise enough to make the wells profitable, then flat output might be maintained for a couple of years, but by 2024 under any reasonable oil price scenario, Bakken/Three Forks output will start to decline.
Watcher,
Did you look at the chart? It only goes back to May 2016. Oil prices have mostly been trending higher from May 2016 to Oct 2018.
In fact the ND output was pretty flat from May 2016 to July 2017 and then tracked up with oil prices from July 2017 to Oct 2018, the fall in prices after oct 2018 then led to flat ND output, often there is a lag between prices and output as it takes time to drill and complete a well, typical lag is about 6 months.
tight oil output and WTI oil price (nominal)
That shows no correlation between investment decisions and output. Extremely low prices slowed it down but didn’t stop it despite any wells being drilled then being money losers. And it started soaring again at $50, which we now also know is an unprofitable price.
It hasn’t been economically driven at all until now.
As I’ve written above, now as formula:
(Nr_of_new_wells) = ( (Oilprice)*(NrOfBarrelspumped) + (NewDumpMoney) ) / (CostPerWell)
A high oilprice can increase wells – or new dump money. To maintain production at sinking oil prices the amount of dump money has to be increased – so more staff doing flashy Powerpoints are needed.
In this model the paying of dividends is not included – when the oilprice rises enough to not needing OPM anymore, production is increased relentless until it is limited again by OPM.
Propoly,
Lower prices reduces profits ceteris paribus, and higher oil prices raises them.
There is a lag between price changes and production changes of 4 to 6 months. Also output per well improves as the nature of newer plays becomes better understood.
So we would not expect perfect correlation in a complex relationship where multiple variables are changing.
“The issue is that to complete more wells, you need to spend more capex. And to spend more capex, you need to spend outside of your cash flow. This requires shale producers to access the capital market, which is no longer available even for the leanest of producers. In addition, investor pressure on disciplined capex spending means less capex, not more.
This combined with the increasing treadmill effect will be the ultimate drag on US shale production. This doesn’t mean US shale production won’t grow this year, but it means that when it does stop growing, it will do it in a blink of an eye and catch the world off guard.”
https://seekingalpha.com/article/4275164-shale-oil-well-productivity-stalls-putting-growth-estimates-risk
It won’t come close to that for 2019. Otherwise, the overall graph is more realistic, than in the past.
Striking is that it has been essentially stagnant for almost a year. All but certain that will prove out over the next couple months. Remains to be seen if this is a coincidence between particularly bad winter, mediocre prices and growing cutbacks in funding. Or if this level is at or slightly beyond the sustainable max in the real world.
Very interesting graph. If flat when still manage to compleate DUC to 60% of a cost of a new well than there should soon be a decline if oil price remains at 50 range WTI. I guess the Companies already know what DUCs gives the lowest break even price and highest cash flow, that they might first compleate. In the mean time some increased activity and investment is ongoing offshore where it seems some fields have suitable profit with brent 50 usd/bbl , but this new oil that might come 3-5 years from now cant replace the drop in US shale as a consequence of changed incestors strategy , first they need to show profittable Buisiness to get access to funds.
No, they don’t Freddy, and that’s the core reality.
This is society’s lifeblood that we’re talking about. You will never allow yourself to die, literally die, because of a substance created from thin air by central banks. If these people have to have access to funds to make the lifeblood of civilization flow then access will be provided, regardless of profit.
It won’t make any difference. You can’t fight entropy with printed money. The entropy of the oil we get is increasing. It is less concentrated, less usable, and requires more energy to obtain and transform.
If you print the money what it means is that a larger share of the economy is dedicated to obtain the oil (even if we don’t notice), and as a result the economy performs worse and society becomes more fragile. That path leads to a sudden simplification, also known as collapse, as per Joseph Tainter.
I think rationing would make more sense. So much of oil goes to non-essential uses. People don’t “have to have” oil to make trips to the grocery store in SUVs. A country doesn’t have to print money to keep that oil flowing.
Pretty amazing to see all these hypotheses regarding the plateauing in Bakken production with little (no?) mention of the largest, most proximate reason being the limits on gas flaring.
Helms has only mentioned it about a gazillion times.
For folks who track any of the real world events occurring in western North Dakota, the owners of DAPL are planning on increasing capacity from current 570 000 bbld to 1.1 million bbld.
There are 2 other proposed takeaway pipes targeting the PRB, Bakken, and DJ regions for sourcing with ultimate capacity in the 300,000 bbld range.
And, again, for those looking at real world events, the ongoing advances in completion/production (especially flowback) techniques should recognize that tier 1 acreage is actually growing.
A great many of these techniques bode well for the future wave of refracs.
As an aside, the Liberty Resources EOR project is continuing.
Collaborating agency NETL posts ongoing status reports.
Hi Coffeeguyzz,
I agree there is no peak in Bakken oil production yet. Looking at total production of Liberty wells I have to say that this might be the reason why they have no more rig running in NoDak. There are several wells from 2017 that haven´t made 50 thausand barrels. Wells from january 2018 are below 150 thausand Barrels. There is indeed tier 1 acreage left to drill, but it is not operated by Liberty.
Toby
No doubt that Liberty owns somewhat marginal rock.
When they (Liberty I) bailed out of the Bakken in 2013, it was clear, at least in hindsight, that they preferred to get the money upfront rather than spend decades slogging it out in a fiercely competitive, capital intensive industry.
When they re-entered the Bakken a year later with Riverstone’s financial resources backing them, Chris Wright and his team set about – on this somewhat fringe acreage – to develop cutting edge fracturing/completion/producing protocols that might lead to industry wide productivity gains.
The spinoff Liberty Oilfield Services has earned perhaps the industry’s highest regards for fracturing expertise.
(An unidentified – to me – completion company recently came all the way across country from North Dakota to Tioga county, PA, and fractured 3 wells on the Kinnan pad.
Operator SWEPI (Shell) has declared that these wells are their best performing AB wells to date).
So, all in all, looking at Liberty’s production alone might obfuscate, somewhat, the “bigger” goals of this outfit.
Coffee,
I don’t pay much attention to the AB.
Why are these 3 wells better than any other well in the area?
Has SWEPI, disclosed any info other than IP ?
How long have these wells produced? What are SWEPI’s future plans for this pad and the area around it? How many wells are planned for the rest of this year?
John
These Kinnan wells were said to be the best SWEPI wells by a local on a Pennsylvania landowners site – gomarcellusdotcom – who, apparently, got that info from a Shell press release.
These are not better, currently, that the Painter 2H, which has 5.3 Bcf with 234 days online.
The Painter is now owned by Montage Resources and is, I believe, over 14,000 lateral length.
The 3 Kinnan wells – 21/23/25 – has produced just over 2 Bcf each with 141 days online.
They are all currently (May report … came out the other day) flowing at 15.6 MM cfd on restricted choke.
I am unaware of precisely why SWEPI would describe these Kinnan as their best, but they follow a multi year long pattern of SWEPI bringing on 3 wells at a time, same pad, and flowing on restricted choke until line pressure is reached.
At 15+ MMcfd at the 5 month mark, these wells surpass previous wells’ production.
There have been rumors that SWEPI may suspend AB operations, but their CEO is on record as being very bullish with unconventional operations.
They currently have almost 1,000 permits on about 250 pad sites.
All these wells – Painter and Kinnan – target the Utica, but Tioga county has many high producing Marcellus wells also.
Correct on the flaring problem. They need to get infrastructure in place. Would be nice if RRC did as good a job as North Dakota on gas capture or at least provided statistics. Maybe the EIA will step in in 2021.
In comment above I suggest North Dakota is doing a better job on laring than Texas.
That is wrong.
Texas about 4-5% of natural gas is flared (lately), North Dakota about 12 to 15%.
Stuck between a rock and a hard space.
https://www.bloomberg.com/amp/news/articles/2019-07-16/no-fast-exit-from-permian-oil-for-private-equity-rs-energy-says
All the way from Occidental (largest Permian acreage owner) to the private equity shrimp, everyone is looking to be adopted,
API data
Crude -1.401M Cushing: -1.115 M Gasoline -476K Distillate +6.226M
U.S. crude stocks fell less than expected last week, while gasoline inventories decreased and distillate stocks built, industry group the American Petroleum Institute said on Tuesday. Crude inventories fell by 1.4 million barrels in the week to July 12 to 460 million, compared with analysts’ expectations for a decrease of 2.7 million barrels. Crude stocks at the Cushing, Oklahoma, delivery hub fell by 1.1 million barrels, API said. Refinery crude runs rose by 17,000 barrels per day, API data showed. Gasoline stocks fell by 476,000 barrels, compared with analysts’ expectations in a Reuters poll for a 925,000-barrel decline. Distillate fuels stockpiles, which include diesel and heating oil, rose by 6.2 million barrels, compared with expectations for a 613,000-barrel gain, the API data showed. U.S. crude imports fell last week by 41,000 barrels per day to 7 million bpd.
Ron and Dennis,
thanks for keeping us up-to-date. I find this site very informative.
I work in the utilities sector. Just got back from a conference this evening. Long story short, I doubt any combination of solar panels or Ev’s etc will make any difference to the economy when peak oil finally does hit home. Just my observation.
Another guy who measures Apocalypse in a substance created from thin air by a handful of unelected people running Central Banks.
When peak oil finally hits home, quote-unquote, there will be no economy. Peak oil means food does not move. The average calorie that you stuck in your mouth today traveled 1500 miles to get there. If there is insufficient oil, and there will be insufficient oil, the Public Service Commissions you deal with for rate increases won’t be holding any more meetings.
No need at all to see peak oil in black or white. No need to see Apocalypse coming. There will be a gradual decline in living standards and life expectancy. The strating point of the decline will differ from country to country, the steepness of the decline will differ greatly from place to place. And the impact of the decline will differ from class to class. It might take years or decades or even generations. There will be no overnight effect at all (unless in places that find themselves suddenly war-infested.)
It is already happening since 1990 (or, arguably, since 1973).
” There will be no overnight effect at all (unless in places that find themselves suddenly war-infested.)”
Note that Watcher has recently called for US to go to war with China.
Crude force isn’t the best option anymore. There are cleaner, cheaper, more effective, and less damaging ways to dominate countries.
We’ve got some people here really locked into an apocalyptic vision of the future, but I think Verwimp is far more realistic.
Wait, what? What is cleaner, cheaper and more effective than erasing consumption of somebody else?
It’s pretty easy, and probably always has been, to imagine that people will choose to smile happily and share scarcity. If that were human nature, there would never have been any wars for anything.
The winners write the history books. Whoever wins and gets the oil lives. The other side dies. Then the books will say the dead guys started it by X and Y and Z evil behavior.
Look At Per Capita Consumption. The people who are behind are trying to catch up. It is their moral obligation to catch up. Their govt would be essentially treasonous if they agreed to perpetual subordinate status to the bigger consumers that you can make a case for translating to life expectancy and higher pension payments.
The people who are ahead have not held a meeting and agreed to back off. Why should they? Go tell Americans they should reduce consumption and anyone rational will look at the numbers and say . . . yeah, you’re saying we should change how we live so Chinese housewives can have SUVs.
I guarantee you it is a very short step from that snide remark to finding reason to eliminate their consumption.
Dropping bombs is expensive. Cyber security is cheaper.
Wars, other than genocide, don’t start because someone wants to wipe out a population. And even if someone did, biowarfare can do that.
Your vision just doesn’t match history or current events. Countries might start wars to claim assets, for defensive reasons, or for ego. But other than genocide, they aren’t started for population control.
And besides, if we wanted to reduce consumption through killing, we might as well eliminate part of our own population. Well, I suppose we could draft those Trump supporters and get them killed off.
If we have a conventional war, it uses resources. Consumption goes up for some of them.
If the goal is to wipe out a bunch of people to preserve resources, disease is better.
“The Spanish flu pandemic of 1918, the deadliest in history, infected an estimated 500 million people worldwide—about one-third of the planet’s population—and killed an estimated 20 million to 50 million victims, including some 675,000 Americans.”
https://www.google.com/amp/s/www.history.com/.amp/topics/world-war-i/1918-flu-pandemic
https://en.m.wikipedia.org/wiki/Spanish_flu
Australia and Singapore seem to have a different opinion on this Elto. We cold do the same kind of thing here as well.
https://cleantechnica.com/2019/07/16/high-voltage-undersea-transmission-lines-green-hydrogen-could-make-australia-a-clean-energy-powerhouse/
“covering 15,000 hectares, it will supply some power to Darwin and other NT cities but its most unusual feature will be a 3,800 kilometer undersea high voltage transmission cable that will supply power to Singapore.”
Ron might agree. I do not. Prices will rise people will use less when that occurs. The transition may be difficult. Difficult to predict.
I’ve argued that I don’t think Trump is going to get himself stuck in another war. There’s not a lot of support for it and I don’t think he can count on it as a way to get himself re-elected.
But what I can see him doing to picking on a group of people who can’t fight back. So he can use scare tactics to get his base to demand that wall with Mexico. It’s totally safe. Not like picking a fight with Iran or China.
I know some of you envision the world blowing up, but I don’t see Trump engineering that. Politically it does him no good. He needs a weak enemy, not a formidable one.
It seems that Russia is unable to stop producing contaminated oil. I guess this is the reason why the pipeline operator, Transneft, has set limits on oil intake from certain producers, like Rosneft. It looks like implicit admission that some oil Transneft gets is still bad. Therefore, Transneft must mix bad oil with good oil, and of course, proportion is important.
Is that a standard procedure in other parts of the world? Producing contaminated oil and then mixing it with good one? And a technical question: Are chlorids used to make production simply possible, or maybe just to increase the flow?
It is interesting that the case of contaminated oil is one of the few when pipeline does not seem to be the best choice of transport.
A chlorine-based material that has been pointed at as contamination is a fairly common item and removal of it is similarly common and somewhat easy. For some weeks now I have smelled propaganda in this story.
You meant that Russia delibaretly sabotaged its oil production? if they want to limit production, they could make cuts like Saudis, or…?
OK, so world oil supply is at the same level as year ago, demand is up by about 1.5mb/d, but the price is 10 usd/b lower than year ago. Weird.
ETP theory rises its ugly head. The claim is that economy, failing from high priced oil, will put the downward pressure on oil price, reducing oil flow finally, since oil production demands more and more money (or energy).
~50 $/Barrel, and car sales in China grow. ~75 $/Barrel, and they shrink. First i have set up the following diagram for german cars, made an error with US cars, and now i have adopted the diagram for chinese cars. Today 300000 cars/month less are sold than at the end of 2017.
Reality is ugly, ETP is a description of reality based on physics.
dood, they either tariff imports or the populace voluntarily tariffed them in anger. The choice is then buy domestic or wait for it to blow over. Not likely price related.
ETP is not a sound theory for those who understand thermodynamics.
Only makes sense when energy for all of society is considered. ETP looks at single product, oil production, delivery and distribution has inputs from coal, natural gas. Oil. Nuclear, hydro, and other renewables.
The analysis has to be for the entire energy use of society to be sensible. In reality the analysis should be for the entire earth system.
‘the entire earth system’ : like energy produced by flowers (flowers are known accelerators of many insects), too?
If look at it qualitatively, not quantitatively,
ETP is thermodynamically sound, only the monetary aspect is not entirely lucky since it relies on the presupposition of price discovery by market, which doesn’t seem to exist anymore, at least not in the pure form.
Non-Oil-Energy would be only relevant, if such energy was able to compensate for growing energy cost of oil recovery.
Actually, the situation may be even worse in the sense that oil enegry outflows to other energy systems (gas especially) may be greater than the reverse inflows into oil energy system itself.
As far as I know, Johan Sverdrup is to be the first oilfield powered by external hydropower from the land.
Hi Dennis,
ETP is a very sound theory, and i am quite fit in thermodynamics. Have you recognized, why so much energy is required for oil production ?
Here https://www.peak-oil.com/wp-content/uploads/2018/05/2018-05-23_etp_thermal_equilibrium.pdf it is written
The HG has discovered, that the machine “Petroleum Producing System” generates very much entropy, but they did not see the reason to generate the entropy.
The reason is very simple: Oil production changes the temperature equilibrium of earth.
The price prediction from HG is influenced by many uncertainties, so i prefer to watch the real oil prices:
HG has predicted a price decy of 11 $ per barrel and year in 2013, and the real price decays with only 7 $ barrel and year. This is still a very good match.
Many others who understand thermodynamics very well realize that Hill’s ETP theory is flawed, including a mechanical engineering professor who specializes in thermodynamics.
Bottom line, the fact that energy por the petroleum production system comes from energy sources besides oil breaks the link for EROEI having any direct connection to the price of oil.
Some of the errors come from mistakes in the thermodynamic analysis and some from the mistaken assumption that the net energy content of a product determines its price. There is no such connection.
http://peakoilbarrel.com/on-the-thermodynamic-model-of-oil-extraction-by-the-hills-group/
The drop in the price of oil in 2015 was due to over supply relative to demand, supply and demand determine the price of oil, it really is that simple.
Net energy of a good has nothing to do with its price.
Why does electricity have a positive price?
Net energy is less than zero, but it is convenient to use. Is it not possible the same might be true of crude oil at some point?
Price will always be determined by the price people are willing to pay for the good and the price a producer is willing to accept for the good produced, when an acceptable price is agreed between the parties the good is exchanged.
How much energy was used to produce the product is usually unknown, the producer cares only how much it cost to produce and deliver the product and that the price at which it is sold allows them to make some acceptable level of profit margin.
The thermodynamics is only important for society as a whole, if energy becomes scarce we will waste less of it (use energy more efficiently).
Hi Dennis,
Some years ago i decided to find out how long the oil age will last. The first thing i learned was, that all infos and news about oil reservers and oil economy are filled with lies. Even the most honest article might be wrong, because its based on lies told by other people. The main reasons for the lies are:
A) Oil production deals with very much money, and people lie for money.
B) Whole industries are dependent on oil (Oil production, car production, Banking, air transport) and will suppress discussion on peak oil and lie.
C) People do not like to change their life, and prefer lies if their life style can remain as it is.
D) Among scientists: not invented by me / contradicts my results.
When i heard of the HG study, i ordered it. First question was : Is the study a lie ? I ordered the book of “Moran/Shapiro” to check if the equations the HG refers to are correct. I worked through chapter 6 of the book, recognized that the “control volume entropy rate balance” is identical to the second law of thermodynamics and found out that the example 6.6 “steam turbine” of the book is very similar to the oil production problem. (For people unfamiliar with thermodynamics: The second law can’t be violated, it is always valid. The second law is no lie).
So it was clear, that the HG study is based on real physics. And it was clear, that the net energy delivered by a barrel of oil to the economy shrinks with time.
Next consequence: If the net energy per barrel goes down, at some point in time it will be equal to the energy contained in the barrel. At that point in time the price of the barrel of oil will be zero. At that point, it makes no sense for the world economy to produce oil.
So it is necessary to observe the oil price to find out when the oil age ends. All inaccuries the ETP model has (water cut, other energy forms, temperature of oil and environment, dollar to kWh) will have an effect in the real oil price diagram. See graph below.
For a long time, i had a problem understanding why the entropy generated by oil production is constantly growing? The explanation of the HG (wear out of machines) was unsatisfactory for me. In a discussion about geothermal energy i recognized: The huge amount of entropy is necessary because oil production changes the temperature equilibrium of earth. I did set up the slides: https://www.peak-oil.com/wp-content/uploads/2018/05/2018-05-23_etp_thermal_equilibrium.pdf
Now two independent derivations for the ETP equation exist. It is a pity, that the HG did only recognize that the oil production process produces very much entropy (derivation 1), but did not realize that the entropy is necessary to change the earth temperature equilibrium (derivation 2).
To SKs article: I propose to work through the book of “Moran/Shapiro” instead of reading Sks article, and to look at the “steady state rate balance”, which SK prefers to ignore.
I base my estimates on work of authors such a Jean Laherrere, Steve Mohr, Paul Pukite, USGS, and many others.
See
https://www.amazon.com/Mathematical-Geoenergy-Discovery-Depletion-Geophysical/dp/1119434297/
and
https://royalsocietypublishing.org/doi/full/10.1098/rsta.2013.0179
I have never understood the Hills Group model, but I do understand how entropy is used in thermodynamics and I understand how the concept of entropy is used in statistics and statistical mechanics.
What needs to be done before something gets accepted is to formulate a simple model filled with appropriate values so that others can get a feel of how it works. If you don’t do that people have to accept it on faith that it is a meaningful model. Berne has done that with his PDF, yet to me it is an apples and oranges discussion. According to my mental model, temperature really does not play into oil extraction and poor efficiencies can be exploited at very small margins.
I am not an engineer or geologist but have been following the ETP issue on peak oil .com . Without going into technicalities, my question is what would be the price of oil today if all the voluntary and involuntary cuts had not been administered ? The total cuts are anything between 3-4 mobd . If this were in the market I am sure the price would be very close to the MAP price or could be even lower . Just my take .
Here is a file for calculation programs. It can be used to play with the numbers.
https://www.peak-oil.com/wp-content/uploads/2018/05/etp_calc_example.ods
To understand the slides, remember the two important facts:
1. If something is in temperature equilibrium, energy must be supplied from external sources to change the equilibrium.
2. With the exception of volcanic areas (and human intervention), the earth crust is in temperature equilibrium. The flow of heat from the earth core to the earth surface through the crust is constant since millions of years and part of the equilibrium.
Remark: thermal equilibrium changed to temperature equilibrium.
Brendt,
Your second statement, you need to elaborate. Saying the earth is in thermal equilibrium is wrong. It is akin to saying the earth is in the state of maximum entropy. So choose your words wisely.
Hole in head,
The hills group model assume that when supply matches demand, their price scenario will be followed. The cuts in output simply attempt to match supply with demand. If net energy deterines the price of oil, then oil prices should have been falling as net energy has fallen. If one takes a casual look at oil prices from 1960 to the present, the reverse is the case.
ETP only says that the price of oil should be falling after 2012. 2012 was the year when the invested energy of recovery crossed 50% of energy of barrel of oil. Before 2012, if you produced more barrels, your surplus of energy was still increasing, after 2012 it is your enrgy deficit that is increasing when you pump more oil.
POB had an article on ETP
http://peakoilbarrel.com/on-the-thermodynamic-model-of-oil-extraction-by-the-hills-group/
Not so sure about two glasses analogy, since in reality they are exchanging heat with air. They equalize to air temperature, not to each other. But definitely there is some transport of energy from reservoir to surface.
Anyway, water is heavy and has a large thermal capacity, so flushing a lot of water up and down takes a lot of energy. Nowadays, every oil tanker could be actually accomapnied by something like 90 tankers with water. Those 90 water tankers is energy cost of one oil tanker.
And, I’ve noticed that
the Sun is Warm, and Bright.
Some of it reaches the Earth.
China is phasing out ICE cars just now.
https://qz.com/1500793/chinas-banning-new-factories-that-only-make-fossil-fuel-cars/
https://www.economist.com/china/2018/04/19/why-a-licence-plate-costs-more-than-a-car-in-shanghai
They are not doing it in a gentle way.
I have read a few weeks ago that they have now separate driver licences for BEV cars and ICE cars. A new ICE car driver licence can be now obtained with a tax of about 10000$ .
In the meantime, new ICE car market is going down before there are enough BEV cars to replace them.
hahahahaha
You’re almost there. The next step is to realize supply and demand is not a law of nature. It’s not gravity or electromagnetics. It’s all imaginary, and largely silliness.
According to this morning’s weekly production numbers from the EIA, Lower 48 production has dropped to 11,900 kb/d, a drop of 400 kb/d in one week. Rounding errors indicate that the drop may be closer to 350/b/d.
Lower 48 includes GOM. Had a major storm, touching on hurricane classification.
I was wondering how much of an impact it had. We will have to wait to see how much it bounces back.
That should be all temporary storm outage. Most platforms in the Gulf were shut in as a precaution. Barry wasn’t strong enough to do real damage.
Quote from CNBC.
Additionally, U.S. oil companies on Monday began restoring some of the nearly 74% of production that was shut at platforms in the Gulf of Mexico because of Hurricane Barry.
https://www.bloomberg.com/amp/news/articles/2019-07-16/permian-watch-america-s-hottest-shale-play-is-slowing-down
Rehash, plus extra.
Guy
Maybe the EIA is also starting to believe that the whole LTO play is slowing down. Below is a chart using the July STEO projection for the lower 48 out to 2020. The chart is showing signs of rolling over. A simple model of the data indicates that peak production could occur close to July 2021.
Probably be adjusted down as we move forward, but not totally insane, now. And, we have to consider that lower 48 includes GOM. They are constantly over on that projection.
No reason to think a quadratic will model output properly, there will be a peak, but is unlikely to be in 2021 unless prices remain low because OPEC decides to increase output or Iran and US reach some agreement. And Venezuela and Libya solve political problems.
All of these seem unlikely.
I expect oul prices will rise to a level that allows Permian output to grow at about 800 kb to 1000 kb/d in 2020 and 2021, then output gradually slows to zero for all US tight oil from 2022 to 2025 as declines in other plays gradually offsets Permian increases. Permian peaks in 2027 or 2028.
This scenario assumes USGS mean TRR estimates are correct and costs for capex, opex, transport, royalties, and taxes remain at roughly 2018 unit costs.
Dennis
It was too tempting to not to try to fit a quadratic through those points, especially when one has a lot of free time available. While it’s a great fit, we do understand that it cannot predict the future.
More importantly it would be more informative to have a better idea of what the EIA is seeing to make them project the slowing production in the lower 48. Clearly the legacy decline is increasing. According to Enno, for March it was 350 kb/d/mth. However, according to the March DPR, the total legacy decline is 551 kb/d/mth. That is a significant decline rate to overcome.
Also of interest, according to Enno’s chart, January production was 207,442 bbls/d, February production was 659,083 kb/d and March was 1,124,427 bbls/d. So February’s additional production over January was 451,641 bbls/d and March was 465,344 bbls/d. Since Janaury, February and March total production are essentially flat at close to 6.7 Mb/d, this implies a legacy decline rate of closer to 450 kb/d. This happens to be exactly the average of Enno’s decline rate and the DPR. Coincidence?
I see that in a later post below, you are predicting an LTO increase of 464 kb/d/mth. If I am reading things correctly, this implies a washout between legacy decline and production. So Maybe July 2021 is not that unreasonable or maybe even sooner. I guess we will continue to keep a watchful eye on this evolving story.
What I don’t understand is why the LTO producers want to take on OPEC. Why not share the pie? Why not just keep drilling at a pace that will extend the life of their reserves? Let OPEC do the heavy hauling to get the price up. The companies will then ultimately get more total revenue. Not being an oil guy, I certainly would appreciate some insight into this question.
Ovi,
If you look back at earlier posts by Enno for the US, you will see that typically the most recent 3 to 4 months gradually get revised upward with newer updates. If you go back 6 months and compare the last 3 months reported with the numbers reported in the most recent update for those same months this will be clear.
The short message, don’t pay a lot of attention to the output numbers for the most recent 3 months which rely on incomplete data from state agencies.
When output remains flat will depend on the completion rate, which depend in part on price and in part on the geology of areas where new wells can be completed and the cost to complete (CAPEX) and costs for ongoing production (OPEX), in addition royalty payments, taxes, transport costs, and interest rates, and even the price of natural gas, and NGL will affect the completion rate.
A simplistic analysis that only the oil price matters has never been my approach though there are a few that seem to think that is how it works (not you I am thinking of).
My guess is that Enno Peters estimate of the legacy decline is far better than the estimate of the EIA, Enno has a decent model backed up by a ton of individual well data, the EIA’s model is not very good.
Dennis
I raised the same issue with Enno and below is his response.
Ovi,
My number was just meant has a rough indication. There are several methods you could use to estimate this and the number is changing all the time, as the age distribution of the wells in the population is shifting. I agree that the 350 kb/d is somewhat generous (on the low end).
Ovi,
Thanks.
For my models if no new tight oil wells are completed after May 2019, the maximum monthly decline for US tight oil occurs in August 2019 at 441 kb/d.
In short, Enno is correct as I would expect.
Ovi,
Mistake above, maximum is 509 kb/d in July 2019.
With 637 b/d for maximum output for the average US well from Jan 2018 to March 2019, this suggests 509,000/637=799 wells needed for flat output. In March 2019 there were only 733 tight oil wells completed, and an average of 735 new wells per month in 2019. In 2018 the average number of wells completed were 979 new wells per month.
Note that often the most recent few months of shale profile data gets revised higher.
Based on EIA data, tight oil output is up from Dec 2018 to May 2019. So it is likely that completions so far in 2019 are more than 799 completions per month.
Ovi,
Also if we look at shale profile data from the most recent US update, considering only wells completed through Dec 2018, we get a maximum legacy decline rate of 488 kb/d, fairly close to my model estimate for May 2019 (509 kb/d), as my estimate is model based, it is likely less accurate than the estimate from shale profile.
Note also that the lower completion rate in 2017 relative to 2018 leads to a smaller legacy decline for early 2018 (for all wells completed through Dec 2017) of only 271 kb/d. In 2016 the legacy decline was 233 kb/d and in 2015 the legacy decline was 243 kb/d. All estimates based on shale profile data.
Dennis
Decline rates are definitely increasing and your model number is heading toward the DPR rate of 550 kb/d/mth and as Enno indicates his number is conservative on the low side. Another month will bring updated estimates.
Below is a chart showing the June tight oil production data. June production increased by 108 kb/d and is in line with the average rate since February of 117 kb/d/mth. Note this rate is 36 kb/d lower than the 2018 rate. I wonder how much is contributed by the increased decline rate.
Ovi,
The higher completion rate of 2018 would be expected to lead to higher legacy decline, likewise as completion rates decrease (as they have in 2019) we will eventually see a decrease in the legacy decline. The lower rate of increase in 2019 is partly due to fewer completions per month on average and partly due to higher legacy decline.
Also note that the completion rate was accelerating in 2018, over the first half of the year the 12 month average completion rate increased by 15%, in 2019 the rate of increase was slower at about 5% (used DPR DUC sheet for completion data). This may be part of the story behind the lower rate of increase in tight oil output in 2019.
It seems quite clear from links posted here on this side and also what so far have come out from the shale play of news in 2019. Espesialy there are two majour differences with huge impact that seems quite clear.
1. In 2015 – 2018 production have increased with millions off barrels, link posted in this site shows this increase was driven by depth and not profit from operations. If lended money or investment from wall street have been made available the production have been flat.
2. In 2019 wall streets and banks made it clear shale need to prove positive earnings , cash flow before they will get more funds, the same with the banks. From what we know with a oil price WTI in the 50-60 range most Company will continue to burn cash. If things remain as now , oil price 50- 60 WTI there will not be more funds to drill many new wells when the DUCs that still is profitable have been compleated. In this environment when the truth of American shale plays came to the surface I am quite sure the majours will withdraw their buisiness because their shareholders will see their values disapear.
Just as I predicted, plant condensate which is not crude has entered the refinery as crude. Mason Hamilton of EIA confirmed it in his tweets yesterday.
https://twitter.com/T_Mason_H/status/1151586951247646722
So, what part of these liquids are being counted as crude? Obviously, not all, or the correction would be 4 million and not 400k. But, I guess I must be looking at the wrong data. This data may be all of production, and not just the gas part. It’s normal, I stay confused.
The adjustment factor will likely remain above 500 KBD as a portion of plant condensate has entered the refinery as input on a consistent basis. The plant condensate can be directly used as gasoline blend material just as butane in winter months. Expect gasoline production to remain high as a result.
These NG shale management folks have even less of a brain that shale oil folks. The NG stocks have pummeled and many stocks such as RRC and AR hit 52 week lows.
In the Delaware, oil and gas are both high. Gas management is non-existent.
Just a quick mention that XOM’s acquisition of XTO some years ago, was as much about NG as oil. And note that Exxon has a presence in Argentina where shale gas is as much a focus as oil. Gotta presume XTO guys were sent down there.
Yes, that would confuse the reporting. Apples and oranges, again. And, it is substantial:
https://www.eia.gov/todayinenergy/detail.php?id=38192
Enno posted yesterday that the shale decline rate is running at the rate of 350KBD/month (or 4.2 MBD/year). I expect the treadmill effect to slow down the shale growth to a virtual crawl sooner rather than later.
THAT, would not shock me, though it does go against most expectations. Enno does keep up with it better than any I have seen, so far. Though keeping current increases at 350k a month is probably not a big deal, yet. But, the volume decrease from past wells will catch up sometime with flat completions, for sure. And, his first graph for March 2019 on 2019, looks a lot like 2016. There was a yearly decine that year.
GuyM,
To fill the decline of 350,000 barrels per day each month or 10.5 million barrels per month the average 2018 well would need 555.5 wells completed each month to keep output flat or 6666 wells per year. In 2018 there were 9769 tight oil wells completed, in 2017 there were 7832 tight oil wells completed and in 2016 there were 5204 tight oil wells completed. In the first 3 months of 2019, an average of 620 wells have been completed, an annual rate of 7440 new wells, that suggests an increase for the year of about 464 kb/d, if the decline rate remains 350 kb/d each month for legacy wells and the productivity of new wells in 2019 remains at the 2018 well profile and the completion rate of the first 3 months of 2019 continues for the remaining 9 months of the year. Any of these assumptions ( and probably all of them) may be incorrect.
Note also that based on RRC data it looks like the completion rate increased in the Texas Permian basin in May and June, compared to the first 3 months of the year and for the first 3 months of the year Permian basin output increased by 45 kb/d while the rest of US tight oil decreased by 88 kb/d. For the past 2 months (April and May) Permian output increased by 130 kb/d and the rest of US tight oil increased by 50 kb/d.
If we see tight oil output increase at the rate of the past 3 months (91 kb/d each month) for the remainder of the year and EIA tight oil estimates through May 2019 are roughly correct, then US tight oil may increase by 778 kb/d from Dec 2018 to Dec 2019.
The average of the estimate based on shale profile (464 kb/d) and the estimate above (778 kb/d) is 621 kb/d. So perhaps 600+/- 200 kb/d for the increase in US tight oil output from Dec 2018 to Dec 2019 may be in the ball park.
I don’t think so. By November, Texas new drills averaged 613 for completions. We had a bump of 150 in May which kicked it up. June was back down 100, and my bet it will get worse. Texas average new well completions to June is around 580. Parent child problems, and completing old DUCs won’t help. It may be up, but 700k bpd is not in the cards with these prices, and it doesn’t look like it will improve for awhile.
For the completion rate I am looking at the shaleprofile.com data for all tight oil wells in the US and using the average well profile for all US tight oil wells which started producing in 2018.
For all US tight oil legacy decline is 350,000 b/d and avg 2018 well has max output of 630 b/d, so 555.5 wells gives flat output for entire UStight oil industry.
For all US tight oil completions the shaleprofile estimate is 619 wells per month for Jan to Mar 2019.
619 minus 555.5 is 63.5 extra wells above what is needed for flat output. 63.5 times 630 b/d is 40 kb/d increase each month. For a year that is 480 kb/d. The higher estimate from the EIA data would require a higher completion rate of 656 on average per month for all of the US tight oil plays. You are correct that this may not happen at current oil price level, Which is why my best guess is 600 kb/d.
I think oil prices will rise and completion rate may also go up from Jan to March levels.
I have guessed wrong in the past and this may also be wrong.
We will know in 7 months.
Based on your breakeven analysis of well north of $60/barrel, there is no rationale for production growth at current prices. If the companies show financial discipline, there should be very little oil production increase. Looks like CDV will be in trouble as Mark Papa jumps ship to SLB.
Yeah, a lot of the smaller ones that jumped in, used up their capital before price drops. Now, production is down, and no new money. They can’t drill, because no cash flow. And that goes for some of the bigger companies, too.
GuyM,
New drill oil completion rate in May and June was close to 2018 average in Texas based on RRC completion report. Perhaps it will slow down in future.
Reality is more complex, there is a lot of sunk cost in DUCs and some of those may be completed. Also there can be high grading where best areas bave wells completed. Finally I have expected the completion rate should slow down since 2015, perhaps this will finally occur. Note that the breakeven is about 65 per bo on average including average land costs, NRI, and well costs. Some companies may have lower well costs, land cost, or higher NRI, the breakevan price will be lower than average for those companies.
I focus on Permian in Texas and June new drill oil completions were about the same in the Permian for May and June, maybe there was a big drop elsewhere in Texas.
So far through May Permian has been up and EF has been flat. Maybe it will get worse but May and June were better than earlier in 2019 in Texas. The completion level in May an June was not very different from the 2018 average when output grew at a blistering pace of about 1000 kb/d. I do not think that will be repeated, but output at 600 kb/d seems possible to me.
The reason my guesses are wrong, is the future is unknown.?
GuyM,
On completions slowing down in Texas. New drill oil completions averaged 601 per month in the first 6 months of 2018, in June of 2019 new drill oil completions were about the same as this average rate (596). The annual rate of increase in Texas output for the first 6 months of 2018 was 1150 kb/d. For the past 3 months in 2019 (April to June) the average number of new drill completions has been 604 per month. Surprisingly the lower rate of 559 completions per month from Jan to April 2019 resulted in only a 526 kb/d annual rate of increase in output from Jan to April 2019. The recent data suggests about 508 new drill completions are needed each month to keep Texas output flat, based on 2019 well completions to date (maximum average output about 857 bo/d through March 2019.)
Of course we do not know future completion rates, we would have to guess. 🙂
But, we do know rig counts are falling, logic is completions follow, at some point.
GuyM,
Sometimes falling rig counts are offset by increasing rig efficiency. There may have been a bottleneck in completion crews, or some other factor so that a lower number of rigs was optimal.
In 2015 when rig count dropped, the number of wells completed per rig increased, it is possible that the same could occur in this case where increased rig efficiency completely offsets the decline in rig count. Do we have data on the number of fraccing crews that are being utilized?
In the past that has been the bottleneck, perhaps this is still the case.
There was close to a 50% drop in completions for June in the EF. To April, it’s over 50% down. April was close to 200, and June is way below 100. Running total to July the 20th shows EF about the same, maybe up ten, but Permian down close to 70 based on reported to June 20th. It doesn’t look healthy, but the month is not over yet, and Permian does not reflect NM. My guess is that it will continue to disappoint, and I no longer project much, if any, raise in production by Dec 19, over Dec 18. Too late for price increases to affect anything. I have no guesses on N Dakota, but Okla has to be dropping like a rock. Concentrating on the Permian history could catch you off guard. EF initial production is close to double Permian initial, and so is the Bakken.
Long time reader, let me throw in my own picture of RRC completions, looks like january price drop affected feb/march – april/may showed recovery almost on par with 2018 – while june shows a much larger drop compared to 2018, so I think GuyM is right, with the last crash the difference to 2018 is just about to grow much larger.
Nice graph presentation. And, your using total oil completions, and not new drill. Earlier years have a ridiculous amount of shallow wells in the Permian, and distort everything. It may still be weighing on EIA’s silly productivity report, but, very little, now. Conservative, but conservative is always closer. And, I think the flaring problem, along with the capex limitation will continue to drag on the Bakken. NM? They have been introduced to the Red Queen. Okla., my original birth place and alma mater, has hit its max, and going down. All that is left is how much of the 200k increase is going to materialize in the GOM (sarc). And, I’m not calling it down, because if the price is right, they still have a little time to unleash the non-productive DUCs. Though, not much time until Dec 2019, and they have to find capex to do that, and enough completion crews, sand, and ad naseum. Ok, per my wag, it’s over and done for for 2019, and probably most of 2020. Because, after the next wave of BKs, investors and lenders might be a tad more cautious. But, the majors will still increase their output to fulfill requirements of the multi, multi billion dollar investments in new refineries, and new chemical plants designed for the Delaware Basin, and other LTO. Additional export expenditures? Yeah, they may come in quite useful for refined products. Heavy additions to pipeline capabilities may not fare so well.
And, the ex-CEO of EOG and Centennial jumping off a dead horse, and climbing on Schlumberger story, is simply amazing.
Cats have nine lives, but odds are, this guy has got more. And, he has the same outlook on shale, as I do. Viva, la Papa!
But, the realistic version of all of this, is what is it I am missing?
GuyM,
Why would they need more completions crews? If they keep completions flat output increases. The majors and more successful independents can pick up crews from less succesful producers. At least through May output has been flat for tight oil plays besides the Permian. Perhaps the data from drilling info is incorrect, the EIA uses drilling info data for tight oil estimate, and as you know drilling info gets its data from state agencies.
Very interesting reading, US exsport reach a new record last month according to news. But I am still try to understand the mix of shale oil and some liquid from gaz production that goes in the same pipe system and are reported as oil . From what i read here the price for this condensate is much lower than oil. If this is included in the EIA report it might be that cash flows from operations Capex have started to decline even oil production shows a small increase. When the profittable DUCs are compleated it will be interesting where they shall getvthe funds from to drill lots of new wells to keep up the decline rate. The majours might earn some money as they will controll the whole value chain from oil production , rafineries that will be built to suit the demand. But it might be 5 year from now that profit is washed away as the tight rock that they drill in is getting further away from the sweet spots , it might also be the oil as we see getting more super light…that might be mostely cracked to gazolin and air fuel with lower margins. In total it means the stock holders of majours like Exxson have already exspressed concerned the Company do not earn much on their US activity , they need to suxseed else they might be forzed to sell everything of their shale buisiness…
Freddy,
Keep in mind that as the rate of increase in oil output decreases as we approach the peak, it seems unlikely that demand will fall faster than supply before 2037, so from 2022 to 2037 we are likely to see rising oil prices, probably peaking at $120/bo in 2017$ by 2027 and then remaining at that level until 2037 before declining as demand falls below supply at $120/b by 2037. My expectation is that tight oil output will peak around 2025 if mean USGS tight oil TRR estimates are correct.
Envision,
Look at the variability in the completion rate in 2018, basically the June 2019 completion rate is very close to the 2018 average completion rate. Also for Permian basin (which has the highest productivity oil wells in Texas) the completion rate in May and June was very similar. Most of the fall in completions in June was in the Eagle Ford, capital is continuing to switch focus to Permian basin in Texas which currently has the highest maximum average monthly output (2018 and 2019 wells) of any tight oil basin in the US.
Dennis, I think the completions are now – with restrained access to OPM – more price sensitive then in the down turns before, this is what I read out of the completions, june last year maybe was also a seasonal high, because its gettin too hot or holiday season in Texas takes his toll in july/august – the price was right at this time last year, it is not today – in 20 days we will have the july RRC data and see, as for today we have 15% lower completions in Texas compared to last year, with the underperforming month all after the price crashes in dec/jan and may.
So to confirm my theory: on todays pricing, july will be another underperforming month compared to last year and the gap will get bigger.
Envision,
Only a limited number of completions are needed to keep output growing. Keep in mind that last year’s level of completions resulted in a 1500 kb/d increase in tight oil output, so a small decrease in the completion rate will still result in a rise in tight oil output, probably at about 600 kb/d for 2019 (Dec 2019 to Dec 2019).
A 15% lower completion rate has still resulted in increases in Texas output through April 2019, I expect Texas output and US output will continue to increase.
“Keep in mind that last year’s level of completions resulted in a 1500 kb/d increase in tight oil output, so a small decrease in the completion rate will still result in a rise in tight oil output”
Also keep in mind 2018 had a 60% higher completion rate then 2017 – so the treadmill of fight against legacy decline is actually a lot faster then it was in 2018, june completion was 30% below 2018, if july undershoots again by a bigger margin the the currently 15% year to date, growth may completely stall and is doesnt look like pipelines are the real problem – as you said Permian ist still growing – but Eagle Ford is already in trouble.
envision,
So in 2017 there were about 513 completions per month from Jan to June, and in 2019 the monthly average for Jan to June was 630 completions per month. In 2019 the number was 723. So basically 2018 was 15% higher than 2019 and 2019 is 23% higher than 2017.
Growth in 2019 will probably be between the 2017 and 2018 growth rates.
I know there are a lot more productive areas in the EF to drill. I assume that they are trying to keep their capex limit for this year. Shale is not dead or dying, but the shale explosion of productivity is over. It’s not what it was cracked up to be. It’s expensive, and if people want to pay the price, they can get it. Otherwise, you better have cash in the bank, or credit to buy a Tesla, or something equivalent. Because, the longer the talking heads keep the price low, the more expensive all oil will become.
The editorial on oilprice.com that I referred to earlier, indicated Andy Hall (oil price god) was not wrong, just off on his timing. I agree, although he did lose his title, because of it.
GuyM,
Based on shale profile data for Eagle ford, the average maximum monthly output for Eagle Ford wells is 611 b/d which started producing from Jan 2018 to March 2019, for Permian basin for same period it is 744 b/d, and for ND Bakken/TF it is 659 b/d (Jan 2018 to April 2019).
For all US tight oil wells (weighted average) the average maximum monthly output for wells which started producing from Jan 2018 to March 2019 is 637 bo/d.
Note that this is higher than the average Eagle Ford well.
In 2014 Eagle Ford initial production was higher than Permian basin on average, in 2019 this is no longer the case.
GuyM,
Are you using the link below for estimates or something else?
https://rrc.texas.gov/oil-gas/research-and-statistics/well-information/monthly-drilling-completion-and-plugging-summaries/
That report has about 432 Permian new drill oil completions in June and in May it was 431, in 2018 the average Permian new drill oil completion rate was 379 completions per month. Perhaps you typed June and meant July, in June there were an average of 14.4 new drill oil completions each day, so if that rate were matched in July we would expect the total to be 144 less on July 20 than on July 30, so if we are down by 70 to date compared to end of month, we are actually ahead of the June 2019 rate.
If you meant June and not July, you are using a database I am not familiar with.
I think you might have meant July because you used that for EF and for Permian typed June 20, but perhaps meant July 20?
Yes, typo error. To the 20th, I used completion search. It is never matches the reports, but comes close. I click box for matching submitted date and click none. Horizontal, oil, District, and initial production are checked. Field selection is pretty useless. You also pick up some wells that are definitely not EF.
And 600 something average just doesn’t look right. I know the DPR is off, but not that bad.
https://www.eia.gov/petroleum/drilling/
Not clear what 600 represents. Maximum output, completion rate?
In some cases I use RRC data (for completions), in others (for well profile data) I use shale profile data. For the most part I ignore the DPR.
I will try the completion search.
You are looking at horizontal wells only, which is different than the drilling and completion summary.
Thanks for explaining the completion query at the RRC. For everyone else
http://webapps.rrc.texas.gov/CMPL/publicHomeAction.do
So I checked horizontal oil well completions in Permian (districts 7c, 8, and 8a, as you know) and for Jan to june there were an average of 16.7 horizontal oil well completions in the Permian basin (3028 completions in 181 days). For the data the latest submitted date is july 18 so for 18 days we would expect about 301 completions, for July 1 to July 18 there were only 237 completions, so about 64 completions short of what is expected, For a 31 day month that would give us 408 completions, about 110 short of the first 6 months average completion rate.
In short, I agree with your estimate, it looks like things are slowing down in the Permian basin, at least for the first 18 days of July.
You will be able to drill down to the completion report for each well. The high month should be at least 60 to75% times the initial production. Usually, closer to 60%.
GuyM,
Too much work to do that for hundreds of wells, especially when I can get the data from shaleprofile.com.
https://oilprice.com/Geopolitics/Middle-East/Oil-Tumbles-After-Iran-Offers-New-Nuclear-Deal-If-US-Drops-Sanctions.html
https://oilprice.com/Geopolitics/Middle-East/US-Navy-Shoots-Down-Iranian-Drone-In-Show-Of-Force-Over-Strait-Of-Hormuz.html
Diametrically opposed. Shooting drone is the answer of Trump and Co. Senator is just on an uphill treadmill. Nice show by both sides, but US just proved they can equal Iran pound per pound with BS. They are probably visited daily by drones, it’s a very small Staight. As an ex Navy guy, circa 1970, modern warships provide an electronic super defensive and aggressive features that are super scary. But, since hacking and EMP have been retrofitted for backup to my time. And, they were scary then. And no genius level IQ can overcome a trigger and a guy with a laser rifle that can point to where the charge should go, close range. Or, a thirty mm cannon, operated by the same. Small boat Navy is hardly the answer, and the amount of subs are limited, and are easy targets for the aircraft. Any one that says the US Navy would take a long time to obliterate Iran Navy is ill informed. Ground forces would be stupid. But, they could lay-off shore and obliterated the Air Force, too. They don’t have the resources for air and ship. And, obviously, we wouldn’t be the only country involved. I am not so sure about the Saudi’s coalition, but the Israelis are scarier than our military. And the Russians and China will be complaining to the UN, replacing what they can. They have done that, and been there.
“Iran denied losing any of its drones following the perplexing statement from Iranian Foreign Minister Javad Zarif yesterday evening saying he was not be aware of any drone downing following Trump’s announcement, according to Reuters. “We have no information about losing a drone today,” Zarif had told reporters at the United Nations. Instead, Iranian officals are now suggesting the US Navy actually shot down its own drone by mistake. Iran’s Deputy Foreign Minister Abbas Araghchi said on Twitter early Friday:
“We have not lost any drone in the Strait of Hormuz nor anywhere else. I am worried that USS Boxer has shot down their own UAS (Unmanned Aerial System) by mistake!” ”
https://www.hispantv.com/noticias/defensa/433455/dron-iran-guardianes-eeuu-golfo-persico
Lol
Who knows?
Believing much from either side is treacherous.
“The Pentagon said earlier that it has a video showing the downing of the Iranian UAV near the USS Boxer. However, the alleged video has not been released, so far.”
“The IRGC let the ‘Mesdar’ go after reminding her of the relevant rules. The ship has turned southwest to continue its planned voyage.”
So they let the second ship go.
They just wanted the British one—
I wonder why? (sarc)
“IRGC Navy Special Forces have stopped a 3rd Oiler named LR2 Poseidon which is Panama-flagged. The Oil tanker was stopped by #IRGC in the #Oman Sea. It is highly possible that IRGC releases this tanker. But the Stena Impero which is operated by #UK will remain seized.”
Finally, someone put all the pieces together. On oilprice.com under a free firewall. It’s sink or swim US shale. Fits my viewpoint in each section. An editorial. The only thing he didn’t say, clearly, was that independents were a has been, but you can read between the lines.
There is some misunderstanding up above in the scroll. There was talk of cyber combat rather than conventional or nuclear combat and it’s pretty clear that some folks don’t know what war is.
War is a political instrument to advance policy. Through history, policy can get complex and convoluted. A circumstance of oil scarcity does not run any risk of complexity or convolution. If you don’t have enough oil your leadership are treasonous if they don’t take the necessary steps to get the oil required by their country. No one is going to tolerate a slow diminishment of living standard or life expectancy that can trace to inadequate oil. No one could ever win an election if his policy was to tolerate perpetual subordination and decline.
This is not rocket science. Scarcity not only has a precedent in warfare but it probably defines the majority of warfare. Besieged cities are the precise prototype for scarcity in warfare. Nobody sits in the city or sits outside among the besieging troops waiting for a gradual slow decline in the lifestyle or life expectancy of the other army. The tactic is to starve them out of the city or starve the surrounding troops by having destroyed all the crops nearby. No one is looking for long delays in this.
The fundamental misunderstanding of folks who are perhaps of a green or liberal persuasion is they don’t grasp that the purpose of war is to advance policy. You don’t go to war just to have killing. You go to war with a purpose and in a world of oil scarcity, the purpose is to get the oil and deny consumption of someone else.
You don’t do that with some sort of cyber combat. That would not be an instrument advancing the political purpose. The purpose is to consume and deny consumption by the enemy. Cyber this and that doesn’t burn any oil and burning oil is the goal.
The fundamental misunderstanding of folks who are perhaps of a green or liberal persuasion is they don’t grasp that the purpose of war is to advance policy. You don’t go to war just to have killing. You go to war with a purpose and in a world of oil scarcity, the purpose is to get the oil and deny consumption of someone else.
Science and reality don’t give a rodent’s rear end whether you are green, liberal, conservative or just plain ignorant and stupid. The policy of war for oil at this juncture in human history may be tried again but this time it just isn’t going to work and neither is Cyber! Burning oil produces climate change which in turn impacts global ecosystems and makes most of our current agricultural systems non viable. That in turn leads to collapse of industrial civilization and massive dieoff. Lose, lose!
No war needed!
https://www.youtube.com/watch?v=emFGiIJvce8
Climate Change, Insect Biology, and the Challenges Ahead
Good luck!
Au contraire. Plant productivity is rising at 0.2% per annum due to the extra 2 ppm of carbon dioxide in the atmosphere. There has been a 20% increase in crop yield over the last 20 years due to that fact alone.
That is an outright lie! You’re an either an imbecile or a troll, perhaps both!
At least he is consistent.
Not an outright lie. It is 20% over 30 years for the CO2 effect. There has been a 60% increase in corn yield per acre in the US over the last 30 years. A third of that would have been due to CO2. See USDA graphic following.
The corn and soybean belt has been moving North and West, I presume due to increasing temperatures and increasing rainfall. Lots of corn grown in ND and S.D. in places where it wasn’t in the past.
However, heavy rains this year have also resulted in a lot of fields that were partially planted or not at all.
Would not attribute yield increases just to issue mentioned above. Lots of other factors. Hybrids, weed control, precision farming and others.
“A third of that would have been due to CO2. ”
Please explain?
There are so many factors involved in corn production that I am at a loss for how that chart offers proof of anything at all except higher yields per acre.
But being able to assign “20%” productivity increases on CO2 is impossible from that chart. Do you have a similar chart for, say, forest mass increases over time?
That would be a decent control group as forests are typically not fertilized, subject to GMO related improvements, precision planting/amendments, weed suppression, etc. That would be interesting if anything showed up.
But I’d be very surprised to see such an effect.
Chris,
In fact for tropical rain forests the effect may be lower forest growth as CO2 level has rapidly increased over the past 50 years.
What? Higher CO2 level will result in lower forest growth? That is planet absurdo. The flowering plants evolved when CO2 was 1,200 ppm. Plants breathe via their stomata. It used to be that they would lose 100 water molecules for every CO2 molecule they took up. Now its probably down to 90. Thus the greatest gains in plant productivity are in the water stressed areas.
There may be an increase in yield per acre but there is growing evidence that increased CO2 concentration has negative impacts on plant nutritional quality.
https://phys.org/news/2018-08-co2-climb-millions-nutritional-deficiencies.html
As CO2 levels climb, millions at risk of nutritional deficiencies
Rising levels of carbon dioxide (CO2) from human activity are making staple crops such as rice and wheat less nutritious and could result in 175 million people becoming zinc deficient and 122 million people becoming protein deficient by 2050, according to new research led by Harvard T.H. Chan School of Public Health. The study also found that more than 1 billion women and children could lose a large amount of their dietary iron intake, putting them at increased risk of anemia and other diseases.
Mr Archibald,
So no changes in use of fertilizer and pesticides and no use of new seed types,etc.?
Possibly CO2 increase has a small poitive affect up to the point that changes in temperature and rainfall patterns lead to crop failure.
Don’t take my word for it. See the ad for the Johnson CO2 generator:https://www.johnsongas.com/industrial/CO2Gen.asp
From that ad:
Nightime levels in a greenhouse range from 400 to 500 ppm due to plant respiration.
Shortly after sunrise this level will drop to normal atmosphere (300 ppm) due to the plant using the early light to start photosynthesis.
After 3 to 4 hours of early morning sunlight the CO2 level can drop to around 100 to 150 ppm, then growth is practically stopped.
Supplemental CO2 added during this period can substantially increase your plant and flower production.
The issue with Archibald is that he originally published something totally different with regard to climate change. Now he apparently doesn’t believe any of that but instead now says that CO2 is good. This is what pseudo-scientific crackpots do — they make up BS according to which way the wind blows. That’s their ticket to fake science notoriety.
He does seem to have transition from the climate change denial phase to the ‘more Co2 is good phase’.
Don’t take my word for it. See the ad for the Johnson CO2 generator:https://www.johnsongas.com/industrial/CO2Gen.asp
Seriously?! Do you really consider, what amounts to a sales brochure for a commercial CO2 generator, to be a reputable unbiased source of information?!
Supplemental CO2 added during this period can substantially increase your plant and flower production.
Yes it can, which may be great for producing big beautiful flowers in a commercial greenhouse! However it doesn’t work all that well for producing the necessary nutritional content out in the fields of the major basic staples such as rice, wheat, corn and soy that vast numbers of human beings depend on for food!
And BTW, that lack of nutritional content is made worse by shifting rainfall patterns and increased temperatures due to global warming. Why don’t you go and eat a bowl of roses!
You go to war with a purpose and in a world of oil scarcity, the purpose is to get the oil and deny consumption of someone else.
Watcher, you should know better than that. Trump asked, “Why didn’t we get the oil?” But we did not. We didn’t get a fucking drop of the oil. We don’t go to war to get steal their oil. Only Trump would make such a dumb suggestion. And I am really shocked that you would suggest that we would go to war to steal any countries natural resources. European nations did that during colonial times. Those times are long gone. And good riddance.
Donald Trump’s Odd Fixation on Seizing Middle Eastern Oil Fields
Trump has repeatedly endorsed the bizarre, bellicose fantasy that the U.S. could and should seize oil fields in Iraq and Libya.
Bizarre indeed.
Ron.
Maybe Watcher advises Trump on his twitter feed. 🙂
Actually, you are the one talking about stealing resources. And certainly others have. But not me. Yet.
I am the one talking about suppressing competing consumption, by force. That’s not stealing resources. Yet.
The most probable scenario upcoming is interdiction of transport of oil to Japan. By China. They have that relentless 5.5% annual consumption growth rate to support. And that number is growing, of course, as domestic oil production dies. Is that stealing resources? Not really, since they may even be willing to pay for it (with pegged Yuan, but let’s not digress). And they really at that point would not be focused on reducing Japanese consumption. They just are doing what they must to support their own consumption and the flow to Japan is nearby and convenient, and their leadership would deserve applause for it — because when there is no choice and your people have to have it, you get it for them rather than commit treason and backstab your own country.
As for climate change, that takes care of itself. Scarcity will reduce total consumption involuntarily much more powerfully than any silly agreements about such things. What you folks have to look in the mirror and grasp is that the reduction in total consumption will not be gently, evenly distributed. Any such thing would require collective treason, followed by removal from power and replacement by leaders who are not traitors to their countries who then implement proper, uneven distribution of scarcity.
You seem to think war will be fought to provide wasteful consumption of oil. Americans do not need trucks to go grocery shopping.
I really don’t know why you think citizens will rise up to force country leaders to bomb other countries so their middle class lifestyles will be supported.
The wealthy in the world don’t give a damn about the average citizen. The military/industrial complex may benefit from war, but the rest of the population doesn’t.
And if Trump had his way, he would keep diverting defense funds to built a massive wall along the border and he’d pull out of NATO, South Korea, the Middle East, etc.
He has created a PR war to appease his base, which basically achieves nothing in terms of scarcity of resources, etc. Sure, he can argue that he is protecting our resources from the immigrant hordes, but he is also depriving the country of their cheap labor.
“Sure, he can argue that he is protecting our resources from the immigrant hordes, but he is also depriving the country of their cheap labor.”
We have WAY more cheap labor already than we have ANY possible use for.
There’s an EXCELLENT case to be made for the argument that too much cheap labor is one of the key ingredients of the mix that put Trump in the WH.
We have a shortage of labor at the moment. If immigrants are turned away, I think you will finding certain industries won’t be able to fill those jobs. Now if companies would pay $20 an hour to people working in nursing homes, that would be great to allow those workers to earn a living wage, but families whose relatives are in nursing homes often don’t have those funds.
Since you know agriculture better than I do, do you think farms can get by without workers from Mexico? What about meat packing plants?
WE DO NOT HAVE A SHORTAGE OF LABOR.
What we have is a shortage of JOBS that pay a decent wage or salary.
Anybody anyplace in the USA can hire all the help he wants to do virtually ANY sort of work if he is WILLING TO PAY A LITTLE BETTER THAN HIS COMPETITION.
When five hundred people show up to try for a position when only fifty will be hired, the company is in a position to pay a peanut wage or salary, because four hundred and fifty will leave without a job.
I have a couple of good friends who own small asphalt paving companies. They stay very busy during the hot months, but they have very little work during the winter, when the ground is wet,and preparing the roadbed or driveway or parking lot is tough, and the asphalt plant shuts down. Even the big boys find it necessary to mostly shut down, but if THEY want enough truckloads of hot asphalt, the plant operator will open for them for a day or two, or a week.
So how do my friends get the help they need? It’s as simple as shit, they pay enough that their employees are glad to work for them seasonally, and take unemployment or go hunting and fishing and work at projects of their own over the winter months.
There will be a ZERO shortage of farm labor if farmers are willing to pay enough to get the help they need when they need it. PERIOD.
Of course this would mean that the prices of hand picked vegetables and fruit would have to go up, but not nearly as much as you might think, because one, hand harvest is no more than one third the cost of producing any major vegetable of fruit crop, and often less. Two, the farm gate price per pound or kilo of just about any kind of produce or fruit is only rarely as much as forty percent of the retail price at the supermarket.
So farm workers get paid more, farmers in the end make about the same as they do now, really no difference at all to the farmer,ONCE the transition is made to higher wages, because farmers sell into the wholesale market, and generally have ZERO pricing power. They take what the market offers. They compete in an extremely cutthroat fashion with each other, and only the lowest cost producers survive.
I used to hire peaches picked for a dollar a bushel. Now the going rate is two dollars per bushel. It wouldn’t make a BIT of difference to me that it now costs two bucks, if I were to come out of retirement, because as a farmer, IN THE END, if I make it, I get back my expenses plus a big enough profit to survive as a farmer. Peaches are selling wholesale these days for three times what they were when I quit. Farmers still make just about enough, on average, over time, to stay in business raising peaches.
I could pay FOUR dollars a bushel, and would need to get only another nickel or at the most a dime per pound from my buyer. If this extra expense is passed along, and it would be, peaches would go up a nickel to a dime at the supermarket. Peaches are generally from a buck fifty cheap for the cheapest in season, to four bucks, averaging two fifty to three bucks most of the time.
At four bucks I would have potential pickers ringing my phone off the hook. College kids, retirees, out of work construction people, the odd housewife or house husband looking to make few hundred bucks extra…..
So what having all the work done by local people, as opposed to imported cheap labor, would mean that retail prices would go up a little for fruits and veggies, maybe ten to fifteen percent MAX.
There are PLENTY of LOCAL poor people who would JUMP at the chance to pick peaches at fifteen bucks an hour, instead of the going hourly farm rate locally of ten bucks, plenty of poor people in California who would JUMP at the chance to pick vegetables for twenty bucks an hour, but so long as a farmer can hire imported help for half that, well…… farmers will. Farmers don’t have any choice, because the margins involved are such that paying more than the competition is out of the question.
With some of the unemployed people working on farms, there would be less pressure on the rest to take a peanut wage job, other employers would have to offer a little more money.
The overall change would be that there would be a shift in purchasing power and living standard from people ( the vast majority of people who hang out on the net in forums such as this one) who have decent incomes to people who don’t, such as many of my neighbors and relatives. They would continue to do what they do now, namely, anything they can to make ends meet.
So some of them , MORE of them, would pick fruits and veggies in season, instead of cutting grass, or doing small carpentry jobs, or setting up at a flea market, or dealing a little pot and meth, or running a midnight auto supply business, or collecting welfare and babysitting or cleaning houses for cash under the table.
ENOUGH of them, MORE than enough, would show up to get the crops in, if farmers offer a high enough wage.
AND farmers WILL offer such a wage, but not until they HAVE to.
Now IF we were to cut of seasonal imported workers all at once, there would be some real problems…… for a year or two. After that, the wages and jobs situation in harvesting would resolve itself just fine.
Ditto the people who work in meat packing plants. The operators can get by paying very low wages, in relation to the difficulty of the work, and working conditions, BECAUSE and ONLY because there are five or six applicants, or fifty applicants for every job.
If you were to tour a meat packing plant, as I have done many times, you would simply be amazed at how much meat passes thru each employee station.
You know about the notice that says WATER ADDED to pork shoulders? Women( mostly black and brown, but some white women and some men too) entirely covered in bright yellow snugly fitted rain suits, so that ONLY their faces and hands get wet, jab an injection tool into a pork shoulder twice a minute… or used to, the last time I passed thru a pork plant. They are probably doing it faster now. The pork shoulder swells up as you watch, they put in ten percent water, and get a dollar for a penny’s worth of seasoning and water…… twice a minute.
Those women were making only about six bucks an hour the last time I got the insiders tour of such a plant. Some of my neighbors work in such plants today, processing both chicken and pork. We don’t have a big beef processor nearby. They take these jobs because they are the best they can get.
The plant operators could probably DOUBLE their wages while only increasing their own operating expenses enough that they would need to get another ten or fifteen cents per pound of meat out the door.
NO WE DO NOT HAVE A SHORTAGE OF LABOR. We have an economy that is WAY oversupplied with cheap labor, an economy that allows teachers, cops, engineers, managers, professionals of all kinds, members of powerful unions, etc, to live a little better on the backs of people who can’t earn enough to eat right, or get their teeth cared for, or send their kids to college, because there are TOO MANY of them looking at TOO FEW jobs available.
And of course farmers would continue to shift from hand labor and small tractors, trucks, etc, to bigger tractors and trucks.
The fruit and vegetable industries are already HIGHLY mechanized. This trend will continue of course, and within another decade or so, it’s likely that most of today’s hand labor farm jobs will be made obsolete by way of further automation. Robots are just now getting to be practical investments in terms of farm work.
Some of the most cynical and hypocritical bullshit propaganda I have EVER heard is the bullshit coming from businesses that profess to be all about the FREE MARKET……. not being able to hire enough help. The reason they can’t hire enough, is that they want it at a rate below which the market will supply it.
These people are NOT stupid of course. They know that this bullshit propaganda will help them get dirt cheap immigrant or seasonal labor at the wages THEY want to pay.
Thanks for the detailed explanation.
And I mean that sincerely. I’m not being sarcastic.
Why launch an expensive war when you can rally your supporters with plastic straws?
https://www.npr.org/2019/07/19/743683131/trump-seizes-on-soggy-paper-straws-as-campaign-issue-make-straws-great-again
The dead are notoriously low consumers.
Coal has declined. We didn’t declare war to prop it up.
War will use more oil than it will procure. If you bomb countries, that doesn’t get you their oil. You would need occupation to take over, which uses even more energy. When we fought WWII, we rationed oil.
Polls suggest that Americans are sick of our endless oil in the Middle East. Trump knows that. If he starts another war, not only will he risk losing the next election, but oil will become more expensive here.
You have a scenario in your head, but that doesn’t mean it matches reality. Going to war for oil, or going to war to reduce global population to free up more oil, will only make the oil more expensive for citizens, thus defeating the reasons you cite for going to war.
You seem to then guns will get you more butter. Rather, it is guns OR butter.
There is no radical action Trump can take to get the US more oil so some Trump supporter can keep filling his truck with cheap fuel.
And war is already being fought in cyber terms. It’s a lot cheaper to do it that way.
I witnessed WWII rationing. My father had a work related B card. No new cars were sold. The speed limit was 35mph. I couldn’t get tennis or basketball shoes. It is said that the rationing was actually designed to conserve the supply of natural rubber.
There is some talk about the tankers in The Straits of Hormuz not sailing a path required by regulation. The Iranians then grabbed some of these tankers and outrage followed.
Not a hell of a lot of attention has been given to the question of why the path sailed had diverted from the proper regulatory path prior to the Iranians being anywhere near them.
You can see all ships, with active transponders, passing through Hormuz. It’s very busy.
https://www.marinetraffic.com/en/ais/home/centerx:56.1/centery:26.3/zoom:8
Amazingly Loco, Billions Dieoff with just a burp in the flow of Go Juice powering the Global/Centralized JIT Logistic chain.
This sort of thing is part of why I mention stuff like permaculture and individual-/community-/local-empowerment/-resilience.
Iran is trolling but also demonstrating they are much more agile in the Strait than the USA is. Meaning that if they want to close it, they’ll succeed.
IMO it’s more likely they target UAE and Saudi directly as flat out closure hurts a number of countries they are trying to be on good terms with.
If they mess with enough ships, it will effectively close it. A lot of this stuff goes to India and China, pretty risky.
At this point, their best bet may be to close it down.
Then at bargaining time, offer to keep it open in return for lifting the oil export embargo imposed against them.
If they could avoid getting pounded, it would work in their favor.
They don’t have too many choices, except bringing all their military back within their borders and ending their relationship with their Hezbollah comrades. I don’t see that happening, since its all about a fanatical religious conflict to their leaders. That is their priority.
IMO it’s more likely they target UAE and Saudi directly
Yep, in 15 minutes both countries oil would be in flames.
And a world wide depression would arise.
Buy, Sell Hold? Anyone betting on the Service Co’s Returning to Former Glory?
https://seekingalpha.com/article/4276285-expect-nabors-industries-turnaround-soon?app=1
An answer to my own Q from The (IEEFA) – Institute for Energy Economics and Financial Analysis.
“EQT’s former CEO Steve Schlotterbeck recently made headlines when he called fracking an “unmitigated disaster” because it helped crash prices and produce mountains of red ink.”
“In fact, I’m not aware of another case of a disruptive technological change that has done so much harm to the industry that created the change,” Schlotterbeck said at an industry conference in June.
Amazingly Appears EQT displaced CHK as the GASSEST one to rule them all … with an Unresolved Strategy to bury their stakeholders even deeper in doom.
https://www.zerohedge.com/news/2019-07-22/why-us-shale-doomed-no-matter-what-they-do
https://www.rigzone.com/news/permian_fracking_activity_underreported_in_2018-23-jul-2019-159378-article/
Latest news from Rig zone , fracking underreported in permian in 2018. Seems there are not maby DUCs left to compleate and the oroduction each well is lower than reported that increase the break even price each barrel.significant. If this is true EIA need to revice their shale play forcast, also the majours their plans if they used the data reported that was wrong…
The majors get their own data. Why do you think they are so hesitant/ picky on what to buy up from “Saudi America”?
Inventories:
Crude: -10.961M Gasoline: +4.436M Distillates: +1.420M Cushing: -0.448M
U.S. crude stocks fell more than expected last week, while gasoline and distillate inventories built, industry group the American Petroleum Institute said on Tuesday.
Crude inventories fell by 11 million barrels in the week to July 19 to 449 million, compared with analysts’ expectations for a decrease of 4 million barrels.
Crude stocks at the Cushing, Oklahoma, delivery hub fell by 448,000 barrels, API said.
Refinery crude runs fell by 396,000 barrels per day, API data showed.
Gasoline stocks rose by 4.4 million barrels, compared with analysts’ expectations in a Reuters poll for a 730,000-barrel decline.
Distillate fuels stockpiles, which include diesel and heating oil, rose by 1.4 million barrels, compared with expectations for a 499,000-barrel gain, the API data showed.
U.S. crude imports fell last week by 467,000 barrels per day to 6.6 million bpd.
https://oilprice.com/Latest-Energy-News/World-News/Oil-Spikes-After-API-Reports-Largest-Crude-Inventory-Draw-Of-The-Year.html
Net build now 1.2million barrels for the year. Interesting, will be really to see number of Texas wells completed for July…
Hi guys, please read this article in the Oil&Gas journal:
“Oil and gas companies under-reported hydraulic fracturing activity for producing light, tight oil by more than 20% in the Permian basin during 2018, estimates Kayrros, a data analytics company serving energy markets.
Using optical and synthetic aperture radar imagery tracking coupled with proprietary algorithms to identify rigs and fracturing crews, Kayrros found that more than 1,100 Permian wells were completed but not reported through state commissions or FracFocus, a public repository for information on fracturing chemicals.
Kayrros counted 6,394 completed wells for 2018, representing a 21% increase on the FracFocus estimate of 5,272 wells as of June 20.
The backlog of drilled but uncompleted (DUC) wells is considerably smaller than believed, Kayrros said. In any given month, Kayrros evaluates the Permian DUC inventory at just about 1,000 wells.”
https://www.ogj.com/drilling-production/production-operations/unconventional-resources/article/14036674/analytics-firm-finds-permian-basin-statistics-misleading
If this were true, it would be a massive fraudulent behavior, more typical of an emerging market with a large black economy. I am somewhat speechless and waiting for more information.
There is nothing new in stories like this, and they always face the requirement of aligning with state tax revenues. If there is flow, there will be taxes. If someone under-reports flow, it requires that the tax authorities be complicit, and they have no reason to be so.
If someone over reports, then they are paying taxes they don’t owe and are taking money out of their shareholders’ pockets.
If flow is reported accurately but well count inaccurately, you might find shareholders caring about that, but it’s almost certainly not illegal.
That part may not be illegal but it certainly sounds like the average return per well is 20% less than we thought. So, the already poor productivity of shale wells is now 20% less than previous estimates.
“If this were true, it would be a massive fraudulent behavior,”
Like similar to the presidents tax situation.
As I recollect, production in Texas is usually reported on the lease basis. Production taxes, royalty and working interest payments are associated with each lease rather than each well. Some leases may have many wells others only one. So if completion reports are delayed, there might not be any real fraud, taxes would be paid, production reported, interest owners also paid. But DUC’s could be overstated, and productivity per well could be overstated.
Enno’s shale profile lists the following sources:
Texas RRC. Oil production is estimated for individual wells, based on a number of sources, such as lease & pending production data, well completion & inactivity reports, regular well tests, and oil proration data.
I am sure they use their best efforts to be accurate, but if fracfocus and RRC don’t have some of the wells, there are probably errors. I think we will be hearing more about this story whether it is correct or not, it is a big deal.
I think this news is not related to the flow of oil or financial reports to the SEC.
IMHO, it explains why the financial results of operators were worse than analysts thought.
And investors may reconsider their investments.
Link to the Kayrros media center which includes their public release.
https://www.kayrros.com/media
Commenting on the discovery, Andrew Gould, former Chairman of BG and Chairman CEO of Schlumberger and Kayrros advisory board chairman, said: “Misperceptions about shale oil in general and the Permian in particular have consequences, hence the importance of these measurements that show Permian production per well has been substantially overestimated. By the same token, average production costs per well are understated. With far more wells contributing to Permian and US oil production than accounted for, current shale oil production is substantially more water- and sand-intensive than is commonly believed.”
The findings have significant implications for the assumed efficiency of the Permian Basin. The analysis revealed that while oil production is accurately measured in monthly US statistics, it took many more wells to account for that production in 2018 than were reported. Assuming a cost of $5 million per horizontal completion, 2018 operator capex is also underestimated by as much as USD 4.1 billion. Further, the sand and water intensity of Permian tight oil production in 2018 was 23% greater than previously recorded with sand demand being underestimated by 9.2 billion pounds and water by 12.5 billion gallons.
If they are correct it would explain a lot.
Not quite sure I get who it is that is being lied to. The lenders know if they are getting timely payments on loans. Of course, they may package such non performing loans and market them to the public. There is precedent for that, but pretty risky regulation-wise.
It’s just become popular in the last 6 months to declare shale production somewhat bogus.
The final truth is that it doesn’t matter if it’s bogus. It will flow because it has to flow. There will be some sort of rationale or camouflage manufactured to avoid any risk to flow.
A little digging into previous claims from this energy analytic startup show that they have no better understanding of energy markets than other actors. Despite using cutting edge machine learning algorithms and other “hype” technology. It looks like that under the shiny wrapping of their website, there is nothing extraordinary.
One of their prediction in August 2017 was totally wrong:
http://res.cloudinary.com/diywkbi34/image/upload/v1501779181/Kayrros_note_-_Aug_03_seadna.png
I think they have a negative bias regarding LTO that strongly affect their research.
What is curious is the involvment of Andrew Gould in this venture… He’s a veteran in the oil and gas industry, and that gives a lot of credibility for this startup. Which is the reason their claim reached rigzone and oil&gas journal.
Maybe some general ETP perspective:
It is important to stress that it was the 2012 year that was the year of ETP, so to say, not 2029. Don’t think that something special will happen in 2029. According to ETP, since 2012 oil recovery does not bring any surplus energy to society anymore. Whether this energy deficit is 10% of energy-per-oil-barrel or 100% epob (as is to be in 2029) or even 100+% epob (after 2029), is of secondary importance. Oil production is already in red area. What is important now is that energy surplus from other sources (nuclear, coal, gas, renewables) should at least be increasing at the same pace as oil energy deficit is increasing. I think that for a time being we are kept alive by cheap coal and gas. Or maybe gas only – only gas has not peaked yet, coal and uranium and hydropower did. The collapse shall come when surplus energy of coal and gas and hydropower will be less than combined energy deficit of oil, wind, and solar (wind and solar equipment production and maintenance takes more energy then they bring during lifetime, actual lifetime of wind being 15-20 years, solar 20-30 years). Therefore, the year of unaivodable collapse could be maybe approximated to the peak gas year. At the moment peak gas is scheduled for 2025, AFAIK. It is not so much even whether the oil production falls or not, but whether the entire energy system has surplus or deficit, since the price of oil is the expression of the condition of this entire system, or economy. We don’t notice energy units or energy accounts in our life (unfortunately, energy is not a Kantian category like time is), therefore, I admit, all that may seem a kind of strange, like dying for unknown disease. But it is logical outcome of our situation. Money and prices should have been denominated in joules! Another ironic conclusion is that actually a falling oil production decreases energy deficit, while null is neutral here. So maybe the phenomenon of high oil plateau of last years is bringing the end closer instead farther. If so, then this is OPEC, which tries to keep its production around 30 mbd, that is reasonable, and not the shale drillers, who have tried to flood the market. All that analysing of Permian, EF, NG etc reminds me about sports kibbitzing, an activity without a real influence on the real world. In fact, our situation would be probably better if non-OPEC had behaved like OPEC.
The current climate policy of reducing coal and gas burning is anyway rather suicidal, even if well-meant (personally I consider the CO2 affair as a cover for peak oil). That is what happens when you base your actions on lies – a lie walks a short way, as the saying goes (or something like that). But since ETP was born rather lately, it probably had to go that way. Nevertheless, the 2008 crisis is a lost opportunity sacrificed at the altar of BAU. Ultimately, money is just token for real activities, and such a big crisis (and a high oil price) clearly suggested that the system is not sustainable.
What we are lacking is equivalent of Biodome experiment for wind and solar. We could put some mini community, 100% powered by wind and solar (perhaps some small part of hydropower) in an isolated area, leave them with all kinds of commodities and manuals, perhaps with few of Tesla and hydrogen cars and basic machinery, and see if they can continue industrial civilization, or they will forcefully descend to medieval low-tech. Then we would know what kind of communities we should be building for future.
https://en.wikipedia.org/wiki/Biosphere_2
You know intercontinal trade already existed at the end of stone age?
Special good flint stone was traded from the baltic sea up to Egypt.
Another thing: Why is oil production (which is not energy any more, but transportation) is not energy positive?
Even fracking is still positive, the big numbers from Russia and Saudi Arabia are still high positive.
Solar and wind are energy positive, too.
And all modern products live from world wide production – there is no more the possibility of a even nation wide self-sufficient society anymore.
The last experiments where the DDR in the eighties trying to build up an own computer industry – even then they needed some input from other countries.
An isolated village will even go back to stone age giving enough time. Iron work was a nation wide network to work out, using the best iron mines and getting enough coal.
Putting know how on only one family (the village smith) wouldn’t work in the long time, too – knowledge will get lost. Knowledge was distributed to not loose it, even in old times.
“The current climate policy of reducing coal and gas burning is anyway rather suicidal, even if well-meant (personally I consider the CO2 affair as a cover for peak oil).”
Bizarre opinion. You discredit yourself.
Coal is being phased out in the USA as a result of cost consideration.
I refer you to Lazard v.12 report on Cost of Energy, pg 2
Levelized Cost of Energy [in $/MWhr] 2018
Coal- [$60-143]
Solar Utility scale thin film- [$36-44]
https://www.lazard.com/media/450784/lazards-levelized-cost-of-energy-version-120-vfinal.pdf
It would be appropriate for this particular discussion to be on the non-oil/gas thread, considering its content.
It is actually discussion about oil, since the thesis about energy deficit (or halfpoint in 2012) is a core point of ETP, which is oil theory. Let’s say, if i expend 51 Joules and get for that 49 Joules, I have the deficit of -2 Joules, no? I am not absolutely sure that ETP is true, but it looks more true than untrue.
I have also made a point that OPEC in this story is actually a good guy, even if unwillingly. Only OPEC, and Norway, seem to think in categories of ‘sustainable oil recovery’, at least partly.
I think it was called ‘cunning of reason’ by Hegel.
As for solar and wind: it is hard to say for sure, and maybe ‘suicidal’ was too strong a word here, but until now there is no large scale replacement of fossil fuels by wind or solar WITHOUT goverment subsidies (which may be read as a form of energy deficit on their parts). Another point is that life expectancy of windmills and panels usually is shorter than expected.
The final problem of renewables is whether they will be self-sustainable in a perspective longer than a single life cycle of theirs. Let’s say…. ‘Solar Utility scale thin film’ – will be it yet cheaper in 20 years, when you will have to replace it? I don’t think so, and would say for a single windmill, ‘energy generated by this windmill throughout its lifespan will be not enough to produce the same windmill from the scratch AT THE ENDPOINT of a lifecycle of the said windmill.’
Even if a solar panel lasts for 50 years (slow degradation down to 60-70% of original capacity is likely in that timeframe), I too have concern about the shortfall in energy production to sustain a modern society of human beings at over 7.8 Billion, approaching 9 or 10, it seems.
Maybe 2-3 billion if we had discipline, wise leadership and appropriate priorities. We have none of those.
I think most people here expect changes as we hit peak oil and gas.
It’s what kind of changes. Consumption will have to go down. And to achieve that, probably the population will have to decrease significantly as well.
I welcome some changes. In the US we have houses bigger than we need, we make trips we don’t need to make, we have more clothing and food choices than we need, we consume passive recreational activities when we might be better off walking, gardening, etc.
There’s a big difference between sustaining our current lifestyle and living more modestly to cut energy consumption.
And even if there are much bigger changes, I don’t think Homo sapiens will become extinct immediately. Eventually, yes. But not right away. And when we’re gone, opportunities will be there for plant and animal life to fill in. I don’t anticipate a sterile planet.
“I don’t think Homo sapiens will become extinct immediately.”
Extinction ain’t so bad.
Its the chaos (scramble for leftovers) between here and extinction that sucks.
Sure. There will be chaos in some areas. But the upside is that chaos probably will significantly reduce population and consumption.
Changes in energy will produce disruption. That is a given. But some populations will do better with the disruptions than others.
Trade is necessity for some, but for others it is just opportunity. Neolith could go without intercontinental exchange, and surely the only long-distance trade was an opportunity trade, not necessity trade. By the way, how do you know it was trade and not exchange of gifts?
Too bad your opinions aren’t substantiated by supporting facts. The statement would be perhaps meaningful, if it was.
For example- ‘(wind and solar equipment production and maintenance takes more energy then they bring during lifetime,..)’
Please offer unbiased substantiation of this point. It is a highly faulty assertion, I suspect.
It would be appropriate for this particular discussion to be on the non-oil/gas thread, considering its content.
Hey OnofEU,
Here you go on Solar PV durability
SunPower of the USA- Now, they guarantee 98% production for the first year, and degradation of no more than 0.25% per year for the following 24 years. The warranty guarantees that the power output at the end of the 25th year will be at least 92% of the Guaranteed Peak Power rating.
Not all manufacturers are that highly rated, but you get the idea of what is possible.
Actually, how much more expensive is shale drilling for oil in comparison to shale drilling for gas?
Item. Turkey. Big new refinery now at full capacity, which is 200K bpd. Not a big number, but it’s designed to be conventional and also sour capable.
Inputs are to be Azeri and Rosneft. Azeri company funded it.
Outputs is the eyebrow raiser. The talk is “reducing Turkey’s fuel import bill by $1.6B/yr”. Total refining capacity is now over 800K bpd with consumption of 1 mbpd.
Somebody in Europe just lost a customer — and also some leverage re Cyprus drilling.
Watcher,
Sorry, I’m missing something: “Somebody in Europe just lost a customer…” Lost a customer for what?
Help? Thanks.
The new refinery’s output is to be domestic consumption per their expectation of lower imported fuel costs. That fuel got there last year, imported, from some refiner in Europe — probably Eni in Italy. Spain’s Repsol has some biggies. No reason to import from farther away but I didn’t hunt down who loses out. Whoever, that refiner loses a customer.
Watcher,
The Azeri refinery’s preferred supplier was Iran but the sanctions have halted that. A month ago purchase from Iraq was announced but I don’t know if that happened and I’d guess it didn’t because of the announcement of buying now from Russia.
The article said the crude inputs to that refinery were to come from Azerbaijan and Rosneft. It’s a Turkish refinery funded by Azerbaijan. I don’t know if they retain ownership or partial ownership or if they were to get anything other than a customer for their oil. The output of that refinery will be consumed domestically within Turkey.
If there had been mention of Iran in that article I would have noticed it. It was focused on the refinery coming online, and it had been partially online last year, so it is possible Iranian oil was flowing last year. But there was no mention of it.
Watcher,
I saw a statement that struck me as odd, that the refinery would not be handling Azerbaijan crude. I don’t remember where I saw it, so I just labeled it odd and let it go.
The refinery is at Izmir, on the Aegean, so transport distance could be shorter than from Azerbaijan; that’s a plus anyway. A negative is that the area is near the North Anatolian Fault, and seismically active.
This mornings EIA Inventory report shows a drop of 10.8 M bbls, confirming the API report. The production for the week shows a drop of 700 kb/d, most likely due to a drop in the GOM. Chart atatched
EIA report
Crude -10.84M exp -4.261M
Gasoline -226K
Distillates +613K
Cushing -429K
Production -700K to 11.3MM
That’s what a shutdown of over 70% of the GOM looks like.
With EV sales at 2% – 6% worldwide, is this having an impact on oil production?
From an investment point it might. If investors don’t have much faith in the growth potential and profitability of oil production, they don’t put up much money. This is already happening.
EVs are just one piece of a bigger picture. There are better investments than oil.
I agree there are better investments than oil given the prevailing sentiment. Oil won’t be any good until US shale peaks, which will be awhile.
As for EV, it is going to be a slow process. They are still a niche product purchased by people who have above average purchasing power and who have a specific mindset.
My personal experience living in the middle is they are very slowing growing here. In 2012 my doctor neighbor bought a Model S. He has since traded for a new Model S. His family still has three ICE vehicles, all have been traded in for ICE vehicles since he bought his first Model S. His wife is still very skeptical of EV, despite being in a family that has owned one for 7 years.
We now have two Model S here. Another doctor owns one. His family also has three other ICE (Maserati, wife drives a Mercedes, and owns a for F150 to pull his boat).
I have done more cross country driving and city driving this summer than ever, and I do see more Tesla’s, but it is rare. Most recently drove over 3,000 miles on four midwestern interstates. I saw the most Tesla on this trip, three Model S and three Model 3. Plus I saw a semi taking six Model 3 east.
Four of the six Tesla I saw on this trip had California plates. One had New York plates. The last had Iowa plates (I saw it in Iowa City, home of the University of Iowa). So, clearly one can travel long distances in these vehicles.
However, this is a trip of over 3,000 miles on heavily traveled interstates and through large National and State parks, where we saw a lot of cars, as well as driving through some decent sized cities. We played the license plate game and saw at least one plate from all fifty states (Yes, we saw a Hawaii plate) as well as plates from every Canadian province, except the far Northern ones, and we even saw an Aruba plate.
I have family in the Chicago suburbs and when we visit them we have to drive on I 80, I 355, I 290 and I 90 to get there. Heavy traffic for over one hour. I might see 1-2 Tesla. Usually where is see them is charging in the high end shopping mall parking lot.
So in 7 years since I first experienced my neighbors Tesla, the above is the growth I have observed. There is growth in the Midwest, but it has been slow.
Further, the jury is still out on whether Tesla is a structurally profitable company.
Then on the long drives I also think about all the semi tractors I see, all of the row crops, all of the people pulling trailers with pickup trucks, etc.
Slow transition.
I think worldwide economic and population trends are still a more important factor with regard to future oil demand.
Future oil demand will grow, largely with population.
Future oil consumption will not grow. This is a peak oil blog, after all.
Shallow- “Slow transition. ” ..towards EV.
Even though I see many ev’s and plug in hybrids here in calif every day, I certainly agree with your assessment.
I suspect depletion around the world will far outpace ev replacement of the ICE fleet.
On the other hand, on an individual basis, having an ev or plug in vehicle is great.
Nice to avoid the gas station. Some people don’t go anymore. Ever.
I saw that a guy in Germany now has over 900,000 km on his tesla odometer.
Well two things really.
First – Tesla lost another $400 million the first half of this year producing fairly expensive vehicles. This, at a time when their manufacturing techniques have been extremely refined and are relatively mature. So I don’t see how Coyne, Nick G, OFM, Illambiquated et al. can continue screeching that ‘prices will come down!’…. As much as I personally would love to own a Tesla, it is clear that it is nowhere near to being the technocopian triumph it is touted to be.
Second – From oilprice.com – ‘Oil and gas producers in the Permian underreported their fracking activity by as much as 20 percent for 2018, energy-focused data analysis services provider Kayrros has reported.
According to data collected by the company, drillers in the Permian completed more than 1,100 wells that remained unreported last year. The total for the year, Kayross said, was 6,394 wells, versus 5,272 wells reported to FracFocus, a public database of the chemicals that are used in hydraulic fracturing.
According to data collected by the company, drillers in the Permian completed more than 1,100 wells that remained unreported last year. The total for the year, Kayross said, was 6,394 wells, versus 5,272 wells reported to FracFocus, a public database of the chemicals that are used in hydraulic fracturing….”
Seems this finding by Kayrros could be a really big deal. I am unclear on how exactly a well gets completed and put into production without triggering the state reporting mechanisms…seems nigh impossible to me.
But it’s a heavy-hitting firm with Andrew Gould on its board. From the Kayrros media page of their website:
+++++++++++++++
New Satellite Data Highlight Large Underreporting of Hydraulic Fracturing Activity
Houston, 23 July 2019
Kayrros, the leading data-driven analysis company serving the energy markets, disclosed today that hydraulic fracturing activity (fracking), the process for producing light tight oil, was underreported by more than 20% in the Permian, the most prolific US basin, in 2018.
Using optical and synthetic aperture radar imagery tracking together with proprietary algorithms to identify rigs and frac crews, Kayrros found that in 2018 alone, more than 1,100 wells were completed in the Permian basin but not reported through state commissions or FracFocus, a public repository for information on the chemicals used during fracking. The total figure of 6,394 completed wells counted by Kayrros for 2018 represents a 21% increase on the FracFocus estimate of 5,272 wells as of June 20, 2019.
US light tight oil (commonly referred to as “shale oil”) has been the world’s fastest growing source of oil supply in the last 10 years, turning the United States into the largest liquids producer and a major exporter of crude oil and refined products. Experts rely their analysis of the sector on data submitted by operators to state commissions and FracFocus.
Kayrros measurements reveal that public data fail to capture the full scale of fracking. The macroeconomic implications of this underreporting are far-reaching. For one thing, the backlog of drilled but uncompleted (DUC) wells is considerably smaller than thought. In any given month, Kayrros evaluates the Permian DUC inventory at just around 1,000 wells. Most of this rolling inventory results from regular drilling and completions operations. Over time, the number of wells drilled generally matches that of wells completed, leaving DUC inventories relatively unchanged.
The prevalent view that shale operators sit on a large backlog of DUCs that could be quickly brought to production in the event of an oil crisis even without further drilling is thus deeply misleading. There is just no such inventory.
The findings also transform the perception of light tight oil economics. In light of these measurements, the average well is both less productive and higher-cost than reflected in public data.
Commenting on the discovery, Andrew Gould, former Chairman of BG and Chairman CEO of Schlumberger and Kayrros advisory board chairman, said: “Misperceptions about shale oil in general and the Permian in particular have consequences, hence the importance of these measurements that show Permian production per well has been substantially overestimated. By the same token, average production costs per well are understated. With far more wells contributing to Permian and US oil production than accounted for, current shale oil production is substantially more water- and sand-intensive than is commonly believed.”
Kayrros Chief Analyst and Co-Founder Antoine Halff added: “For all its revolutionary impact on the oil industry, shale remains poorly understood. Publicly available data based on old-fashioned company reporting have their limits. Hard measurements unlocked by new data technologies show that contrary to public belief, there is no great buildup of DUCs just waiting to be brought online. The whole idea that the market can rely on this sort of de facto spare production capacity is an illusion. The industry is actually running on a much tighter leash than that.”
The findings have significant implications for the assumed efficiency of the Permian Basin. The analysis revealed that while oil production is accurately measured in monthly US statistics, it took many more wells to account for that production in 2018 than were reported. Assuming a cost of $5 million per horizontal completion, 2018 operator capex is also underestimated by as much as USD 4.1 billion. Further, the sand and water intensity of Permian tight oil production in 2018 was 23% greater than previously recorded with sand demand being underestimated by 9.2 billion pounds and water by 12.5 billion gallons.
+++++++++++++++++++++
Chris,
Enno Peters reports 4832 horizontal wells completed in the Permian basin in 2018, his data tends to be quite good, though over time more data shows up at the state agencies so this number will likely get revised higher. The most recent Permian basin report has 3583 Permian wells completed in 2017, in July 2018 the estimate was 3251 Permian wells completed in 2017, so about 91% of wells were reported after 7 months, if this rate is consistent (and it may not be) this suggests perhaps 5310 total wells will be reported for 2018 by July 2020. Pretty convinced that Enno Peters gets this right.
There is a bit of discussion of this at shaleprofile.com
https://shaleprofile.com/2019/07/22/north-dakota-update-through-may-2019/#div-comment-6188
see comments at link above.
Mr. Sutherland,
Most of the cost of a Tesla is the battery, generally there are economies of scale in production and the cost of the batteries is likely to fall. Already the price per kWh has fallen from $750 in 2010 to $150 in 2016. That is an average rate of decrease in cost of 23.6% per year. If that rate of decrease should continue from 2016 to 2022, Li battery cost would fall to $30/kWh by 2022. The rate of decrease will likely slow down as physical limits are reached, but even if the rate falls to a 12% decrease in cost, much of this cost is manufacturing techniques, we might reach $60/kWh by 2022.
If battery cost for a Tesla M3 standard plus is currently $150/kWh then battery cost is about $9000, if battery cost falls to $75/kWh that cost falls by 4500 and the price of the car falls to 34500, a more basic car like a Toyota Yaris EV could probably be sold for 25k. Higher oil prices may make this happen fairly quickly (perhaps by 2030).
For those of you interested in comparing/monitoring shale production costs, below is a summary of what Suncor (SU), the second largest Cdn oil sands producer, reported yesterday. For reference appreciate that Western Canada Select (WCS), which is a blend of bitumen and a diluent so that it can flow in pipelines, is priced this morning at US$42.13 vs WTI at US$56.54. The last line provides a good indication of the financial health of the company
Oil Sands operations cash operating costs per barrel were $27.80 in the second quarter of 2019, compared to $28.65 in the prior year quarter, with both periods reflecting the impact of planned maintenance. The decrease in Oil Sands operations cash operating costs per barrel was due to the increase in production being partially offset by higher operating, selling and general costs and was further impacted by the yield loss associated with the increase in higher value SCO production. Total Oil Sands operations cash operating costs were $1.051 billion, compared to $940 million in the prior year quarter, due primarily to an increase in commodity consumption costs and higher ore preparation costs, partially offset by a decrease in natural gas prices.
Cash flow provided by operating activities, which includes changes in non cash working capital, was $3.433 billion ($2.19 per common share) in the second quarter of 2019, compared to $2.446 billion ($1.50 per common share) in the prior year quarter.
Operating earnings were $1.253 billion ($0.80 per common share), compared to operating earnings of $1.190 billion ($0.73 per common share) in the prior year quarter, an increase of 10% per common share.
Total Oil Sands production during the second quarter of 2019 increased to 692,200 barrels per day (bbls/d), from 547,600 bbls/d in the prior year quarter. Despite being limited by production curtailments, Oil Sands achieved a new second quarter production record, with the increase due to improved Oil Sands utilization and an increase in Fort Hills production. Fort Hills production was 89,300 bbls/d, compared to 70,900 bbls/d in the prior year quarter.
The company paid $658 million in dividends and repurchased $552 million of its common shares during the quarter.
Suncor is the 2nd largest producer because Syncrude is 1st. But Suncor owns 58% of Syncrude.
Suncor pays a 4% dividend because they actually earn a profit and have for many years. It’s a completely different kettle of fish than the world of shale. They have reserves that will last a long time.
Watcher
The largest Cdn producer is Cdn Natural Resources, CNQ. They produce over 1Mb/d.
New posts up
http://peakoilbarrel.com/open-thread-non-petroleum-july-25-2019/
http://peakoilbarrel.com/us-tight-oil-legacy-decline-and-us-tight-oil-scenarios/
I read this stuff all the time and I’m really confused. Don’t we have the American Institute of Certified Public Accountants? Don’t they have ethics and codes that everybody is supposed to follow? Yet, every time I read this cwap I find out that “Oh, they didn’t account for that, Oh, they didn’t reveal that. Oh, they submerged that into something or somewhere else. Right here they are outright lying.” Oh yea, then the rules of Wall Street that have been boiled down in a cauldron with a base element that says “Make money anyhow, any way you can.” It just seems to me that some authorities somewhere could expose this Ponsi Scheme completely. Anyway……..