I told Dennis that I was not going to post anymore but I just found a lot of time on my hands and decided to update the OPEC numbers from the MOMR that came out yesterday.
The new OPEC Monthly Oil Market Report is out with crude only production numbers for August 2016. All charts are through August 2016.
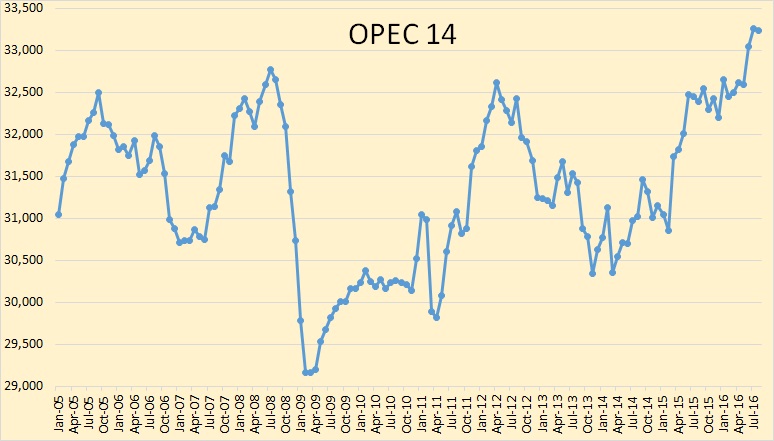
OPEC crude only production reached 33,237,000 barrels per day in August. This includes Gabon.
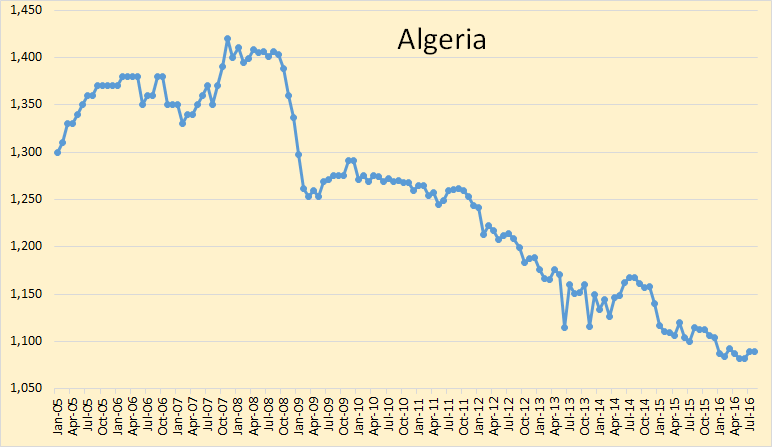
Algeria is in slow decline.
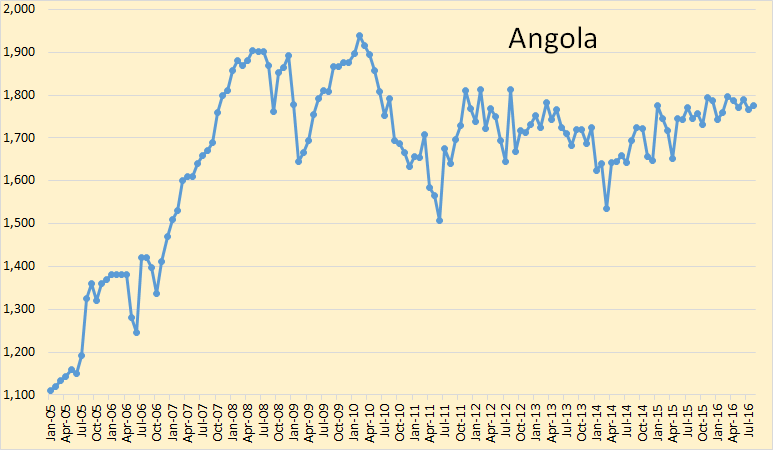
Angola seems to be holding steady.
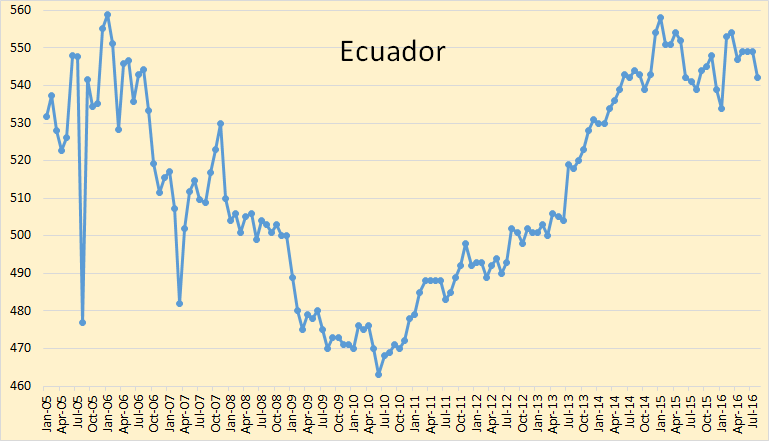
Ecuador was sharply down in August but seems to be holding steady for the last two years.
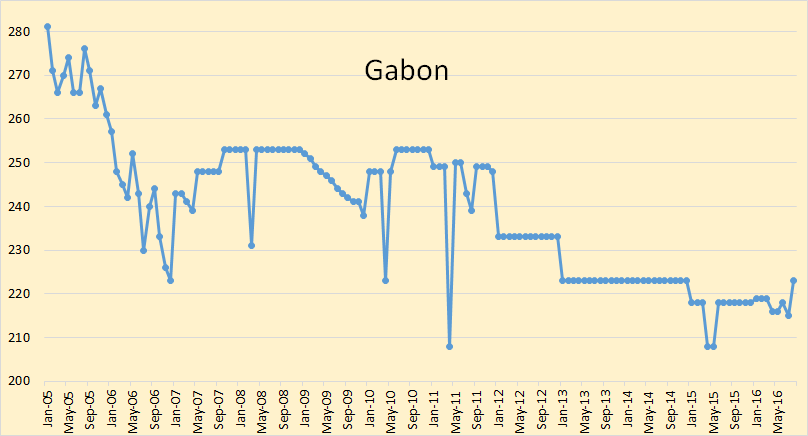
Gabon has been added to OPEC but their production is so low it will have little effect one way or the other.
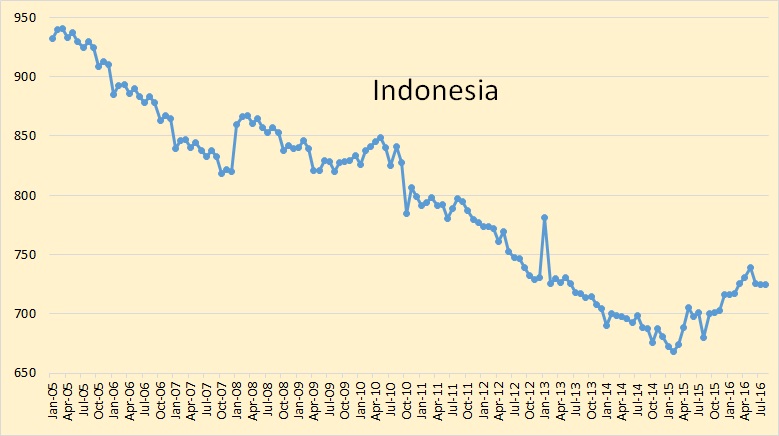
Indonesia will also not affect OPEC production in a big way one way or the other.
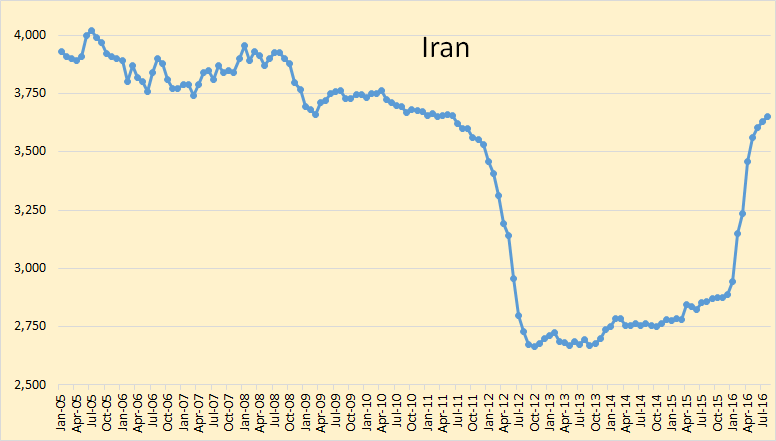
Iran’s increase since sanctions were lifted has slowed to a crawl. There are other problems on the horizon for Iran. They are talking about changing all their oil field contracts to “buy back” contracts. That is they want the option to nationalize all everything. This will likely cause a mass exodus of foreign oil companies from Iran and hit their production considerably.
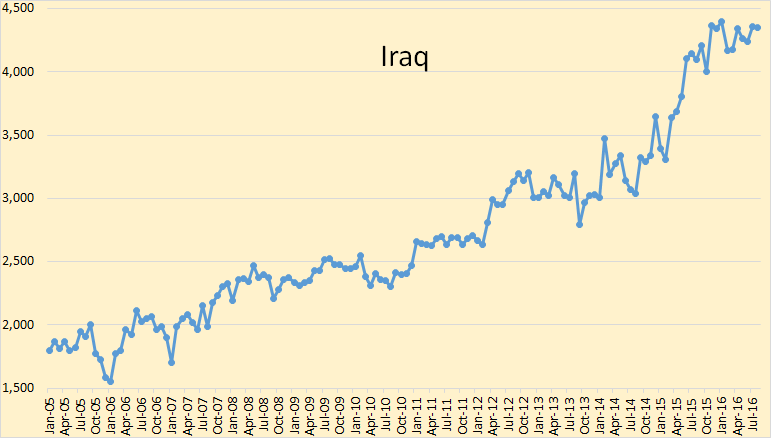
I wrote, two months ago, that Iraq had peaked, at least for the next several years. I see no need to change that opinion now.
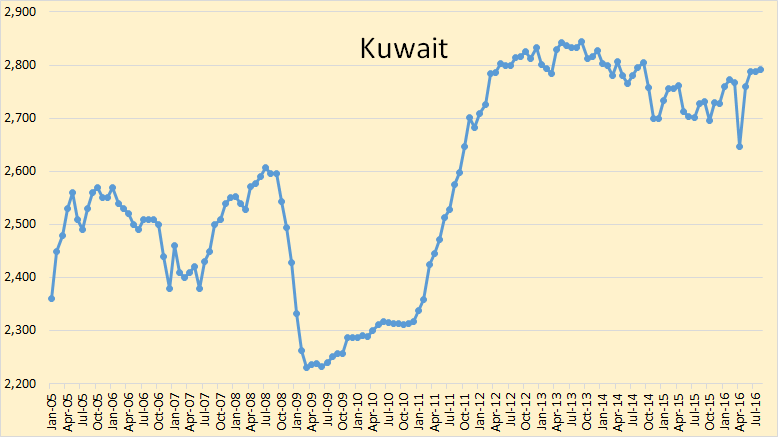
Kuwait has recovered from the problems they had in April. I expect their production to flatten out here with a slight decline over the next few years.
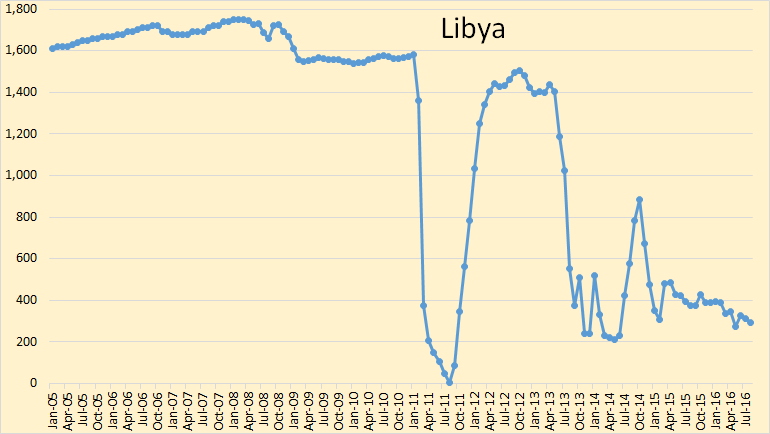
Libya’s problems continue, and will likely continue for a long while yet.
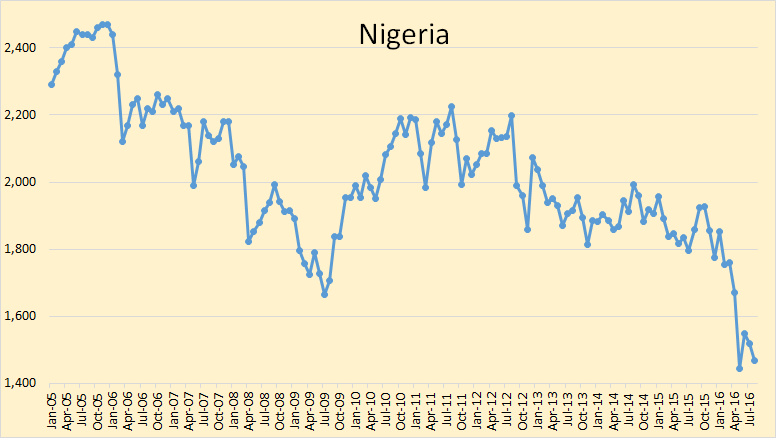
Nigeria’s problems continue and shows little signs of improving.
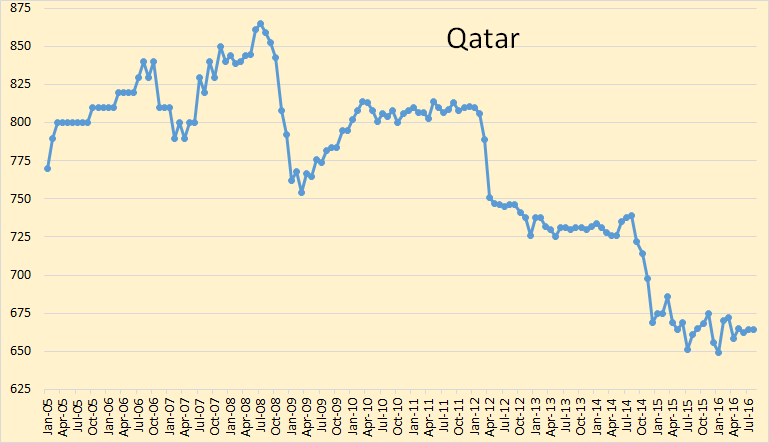
Qatar’s oil production seems to have bottomed out since late 2014.
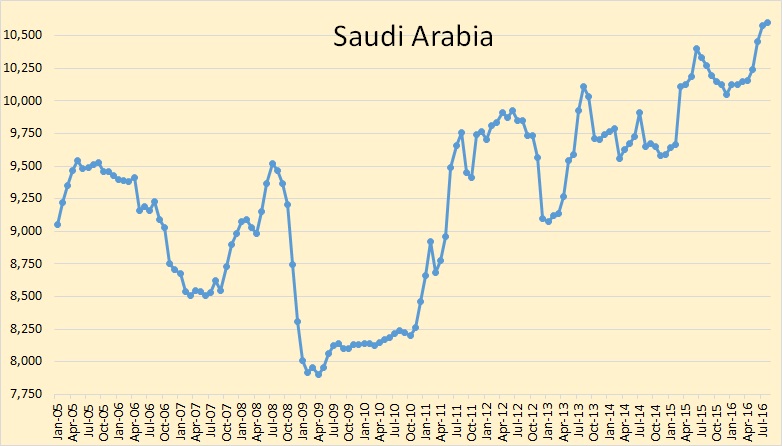
Saudi Arabia is, in my opinion, producing flat out and has been for several years now.
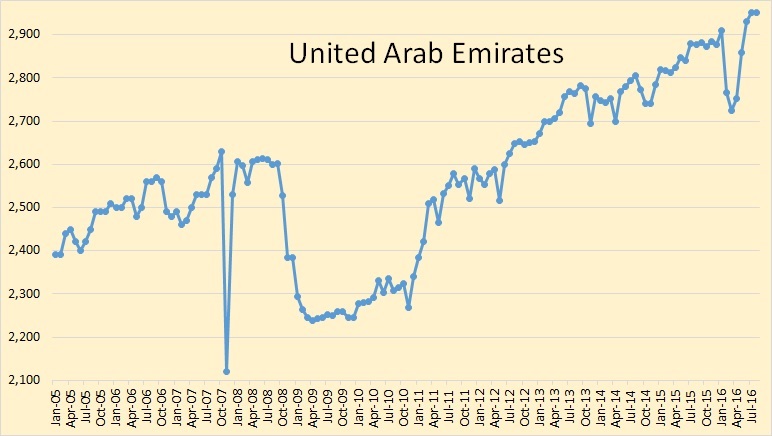
The United Arab Emirates had some problems earlier this year but they seem to have recovered. I think they will hold production steady for a while now.
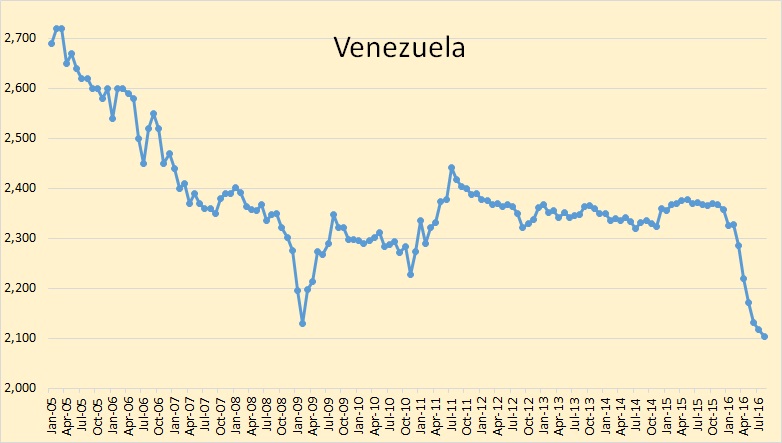
Venezuela’s oil production is still dropping but the decline seems to be slowing. Venezuela has very serious economic problems. They are nearing the “failed state” status.
China’s Oil Production Tanks, Foreign Oil Dependency Nightmare Intensifies
It might seem disingenuous to call any country’s foreign oil dependency a nightmare, but that’s exactly what it is. A myriad of problems stem from foreign oil dependency, ranging from a massive transfer of wealth, to securing vital supply lines and shipping lanes to other geopolitical considerations.
As a major country becomes more dependent on foreign oil, that particular country’s geopolitical decisions and foreign policy become more limited or even forced, something the U.S. struggled with for nearly 40 years as oil demand was one of the major factors influencing U.S. foreign policy, especially in the Middle East, with subsequent allies and foes in the region up to the present.
Now, China, the world’s second largest crude oil importer, the world’s second largest economy and the fifth largest crude oil producer, will increasingly wrestle with this same quandary.
113 responses to “OPEC August Production Data”
This post (except for the article about China at the end) appears to have been published twice: all the charts and text are duplicated.
No, not at all. The page “OPEC charts” is not a post. I did it that way for three years and this is the first time you noticed it?
I’m not thinking about the “OPEC charts” page.
Look again at this post: you’ll see that every chart is shown twice. Try doing a search: CTRL-F for “Algeria”, for instance. You’ll find the chart twice. It’ll be hard to tell, because it’s identical, but watch stuff on the right margin, which changes.
Yeah, I see what you mean. I don’t know how that happened but I have fixed it now. Thanks for the heads up.
You’re welcome.
I’ve found that everyone (definitely including me), needs professional peer review, editing and error checking.
Everyone!
‘I see everything twice!’ – Yossarian, Catch 22. Even so it’s good to have the OPEC charts back and contiguous, and hopefully an indication that Ron is coping OK with everything. Attached below is IEA oil production chart (have to wait 2 weeks for the details to be available) – that looks like a peak in 4Q15 to me, maybe at the edge of Ron’s predictions but pretty close. It may be matched or beaten in late 2017, but if so not by much and after that I’d say it’s all downhill.
For OPEC I think Ecuador, Venezuela, Angola and Saudi are all going to decline from here on, probably Algeria, Indonesia, Gabon as well. Nigeria may get back what they lost to sabotage but then will continue to decline – what nobody really talks about, especially the IOCs involved there, is that the onshore infrastructure is falling apart – some of the pipelines have to be run at reduced pressure so they don’t leak and that limits the flow, and the fields are “maturing” to the point of exhaustion. Offshore there are a few projects coming online but they are fighting usual high deep water decline rates. That leaves UAE (I think a long plateau), Qatar (probably slow decline), Kuwait (might increase if they invest enough), Iran and Iraq (I don’t know but most of their fields are 50 plus years old – when they go it will look like China does at the moment). Libya – I don’t know but I doubt they will come back very quickly or to previous levels however fast peace might break out. They haven’t had any rigs operating there for several years now.
Always useful to recall all oil is not created equal and Libya’s variety is diesel rich, vs others.
Note also on Venezuela – China looks like it’s giving up on them and 75% of their police force has quit (they get killed by the gangs to steal their guns). There are bigger and sadder issues than an oil peak there but nevertheless their putative 250 Gb of heavy oil might as well not exist for at least the next 15 years.
The attrition rate on the National Police force is 75%, but they keep replacing them. Also, a lot of policing is being done by the National Guard, and they have amateurs known as People’s Guards, who are particularly vicious and have been seen bearing women in public (I have video to prove it).
I don’t think Venezuela is a failed state (yet), it has anarchy, incredibly high crime, people are going hungry, the most basic medical services are mostly not available, so the death rate is going up. There’s a lot of random repression, the security services execute people on the street, etc. it reminds me of an African country just before a civil war starts in earnest.
Do you remember how two years ago I warned the country was going down a death spiral, and many red participants used to show up trying to prop up their reputation? The support for the Venezuelan regime is a bit weaker, but they are still paying for a bogus support network, and quite a few political parties abroad are still backing the Maduro regime (this includes the “United Left” party in Spain).
Hi George,
There is a lot of talk about a “glut” of oil. Usually a “glut” is a situation where supply far exceeds demand for a product. In 2Q2016, the IEA estimates that World liquids supply was 95,900 kb/d and that World liquids demand was 95,600 kb/d, so the supply was too high by 300 kb/d in 2Q2016 according to the IEA or 0.3% too high. I would not consider that a “glut”, though perhaps the IEA is wrong and other estimates (by OPEC for instance) are more accurate, I expect that supply will continue to fall and that demand will continue to increase. If there is a glut at present, it will be short lived. Somewhere in the $80-90/b price range for Brent monthly average price in about 12 months seems fairly likely based on weekly spot price trends since Feb 2016.
Thanks for your post Ron. Just wondering if you buy the comment today from IEA that they now believe oversupply will continue late into 2017? They seem to change their minds every other day. If KSA and Russia are producing flat out and US continues to roll over isn’t the supply/demand about to even out sooner?
Well it all depends on demand. I believe, very strongly, that production will be down next year, both OPEC and Non-OPEC. But a shaky world economy could suppress oil demand. However I think the odds are that the price of oil will increase in 2017. If I had to guess, and I do, I expect the price in 2017 to average somewhere in the mid $50 range.
Hi Ron,
I doubt the World economy will crash by 2017. If World real GDP grows by 2% in 2017 (about 3% is forecast) and oil prices average about $55/b in 2017, then any decline in World C+C output will be very small.
What is your estimate for the average C+C output in 2017?
The EIA estimates about 78.7 Mb/d for World C+C in May 2016, a fall of 1.9 Mb/d from the peak in Nov 2015 (80.6 Mb/d). In fact World C+C declined at an annual rate of 5% per year from Nov 2015 to May 2016.
It would seem you expect this decline rate to become smaller between May 2016 and Dec 2017 (maybe 1%?) based on your oil price estimate. Or you may expect a recession is around the corner.
I doubt the World economy will crash by 2017.
I presume you gleaned from my post that I did predict such a crash. Well, not in any post I posted lately anyway. Please don’t read anything into my posts that is not there.
What is your estimate for the average C+C output in 2017?
Slightly less than what it was in 2016.
It would seem you expect this decline rate to become smaller between May 2016 and Dec 2017 (maybe 1%?) based on your oil price estimate.
No, no, no, no. That may indeed be the case but no such thing can be gleaned from my post. All I am saying is that the state of the economy plays an equal part in the price of oil as does the production numbers. Well, at least an equal part.
Is a recession around the corner? Hell I have no idea. Yes, there is a recession in our future. Around the corner? Perhaps, or perhaps not. It is very easy to see what is coming but extremely difficult to tell how soon it will arive.
Hi Ron
If was trying to understand 55 dollar per barrel oil in 2017. Assume oil production decreases and there is no recession, how do oil prices remain low in such a scenario?
You are still thinking that $100 oil is normal. That was a period of abnormal, extremely high oil prices.
So far, 2016 oil prices have averaged about $40 a barrel. $55 a barrel would be an increase of over 37%. That is no small increase. I do expect oil prices to rise but obviously not nearly as high as you expect them to rise.
Hi Ron,
Oil at $55/b will not be enough to change oil output very much in my opinion. If we assume the IEA estimate for demand growth in 2017 is correct (97.5 Mb/d of liquids) and that 2017 oil supply remains at 2016 levels (96.2 Mb/d of liquids) or less, then the World would be short by 1.3 Mb/d of liquid fuel).
In June 2016 OECD petroleum stocks were 434 Mb higher than June 2013 levels and it would take 334 days to use the excess OECD inventory, if we assume there are no excess stocks in non-OECD nations (I cannot find good data for non-OECD stocks).
By Nov 2017 we would be back to June 2013 OECD stock levels and the consistent draw on oil stocks would lead to an oil price increase.
If one looks at futures markets from Oct 2009 to August 2014 for Dec 2017 Brent Crude Futures, it looks like 90 to 105 dollars per barrel was considered the new normal oil price. I think $55/b might possibly be correct for the 2017 average oil price, but if we consider monthly oil prices I expect Brent is likely to be above $75/b (nominal US $) by Sept 2017.
I agree oil price will depend on demand and the price above assumes your oil supply forecast is correct and that the IEA’s oil demand forecast is also correct.
Also if we look at monthly Brent spot prices from Jan 2016 to June 2016, the annual rate of increase in Brent oil price (using a least squares line through the data) is about 88%/year over that 6 month period.
http://www.cmegroup.com/trading/energy/crude-oil/brent-crude-oil-last-day.html
Chart below was pulled from page linked above.
My model says the future oil price will be ~$63 per barrel and increase with inflation thereafter.
You have a very good model Fernando.
Good answer Ron Patterson.
This is about Saudi Arabia so I hope nobody minds I post it here and not under non oil
http://www.independent.co.uk/voices/saudi-arabia-cannot-pay-its-workers-or-bills-yet-continues-to-fund-a-war-in-yemen-a7232466.html
Libya in the news…
Libya NOC Head in Tripoli Lifts Force Majeure on Zueitina
Zueitina port at 20k bpd after force majeure lift, will reach 120k bbl in days.
Tripoli: The head of Libya’s UN-backed unity government called for urgent talks on Wednesday after forces loyal to a rival administration seized the main eastern oil ports in defiance of world powers.
The seizure of all four export terminals in the so-called oil crescent was a major blow to Prime Minister Fayez Al Sarraj’s government, which is almost entirely dependent on oil revenues for its income.
http://m.gulfnews.com/news/mena/libya/libya-unity-government-seeks-talks-after-rival-seizes-oil-ports-1.1895900
Khalifa Haftar forces seizes oil port Brega in Libya
Forces opposed to Libya’s unity government have seized a fourth oil port, Brega, completing their takeover of vital installations in the North African country’s “oil crescent”, according to military sources.
Saleh said Hafter’s forces “liberated the fields and the terminals from the occupiers and those hindering exports”, referring to Ibrahim Jedran, who commands a force known as Petroleum Facilities Guards.
The NOC (National Oil Company) is split into two rival branches, one allied to the GNA and the other to the administration that Haftar supports.
On Tuesday, the NOC branch allied with Haftar said that it would immediately start working to resume crude exports from ports seized by his forces.
“Our technical teams already started assessing what needs to be done to lift force majeure and restart exports as soon as possible,” Mustafa Sanalla, NOC chairman, said in a statement.
http://www.aljazeera.com/news/2016/09/khalifa-haftar-forces-seizes-oil-port-brega-libya-160914061306594.html
Libya: Ras Lanuf, Es Sider force majeure lifted: NOC
Vietnam demanded China move a controversial oil rig on April 7 and abandon plans to start drilling in waters where jurisdiction is unclear, the latest sign of festering unease among the two communist neighbors.
The $1 billion rig, which was at the center of a fierce diplomatic stand-off between the countries in 2014, had moved into an area of the Gulf of Tonkin in the South China Sea about which Vietnam said the two countries were still “executing delineation discussions.”
http://www.epmag.com/vietnam-tells-china-move-oil-rig-gulf-tonkin-844721#p=1
China enters into an agreement with North Vietnam to explore for oil in the Gulf of Tonkin, the leadership changes, new leaders tell China to stop exploring for oil. It becomes a comedy, a snafu.
If Cnooc would discover a 500 billion barrel accumulated unit, the North Vietnamese would probably claim it all.
Then the fur would really fly. China and North Vietnam have trouble seeing eye to eye.
http://www.rigzone.com/news/oil_gas/a/127197/Vietnam_China_Expand_Joint_Exploration_in_Gulf_of_Tonkin
I did this post 2 years ago:
12/5/2014
10 years after peak oil in Vietnam: Asian Century sails into troubled waters in the South China Sea
http://crudeoilpeak.info/10-years-after-peak-oil-in-vietnam-asian-century-sails-into-troubled-waters-in-the-south-china-sea
An estimate of China’s oil imports
5/9/2016
China’s oil peak 45 years after the US peak
http://crudeoilpeak.info/chinas-oil-peak-45-years-after-the-us-peak
Looking for trends in natural gas, Texas…
Texas RRC – Well Distribution Tables + Drilling, Completion and Plugging Report
EIA – U.S. Total Natural Gas in Underground Storage (Working Gas)(MMcf) monthly to June
EIA – Natural Gas Gross Withdrawals and Production – Texas – (MMcf/d, Million Cubic Feet per Day) monthly to June
updated – TexasRRC Monthly Oil Completions and Wells Sept 14th 2016
https://s16.postimg.org/tr204dxph/Texas_RRC_Monthly_Oil_Completions_and_Wells_Sept.png
Art Berman’s Take
IEA and EIA dropped an oil-glut bomb this month. Their September monthly reports indicate that the world continues to have a glut of oil with little hope of a balanced market in the near future.
EIA data indicates that maximum consumption occurred when oil prices were falling into the low-$30 range and that consumption has weakened as prices increased into the mid- to upper-$40 range. This suggests the global economy is too weak to support oil prices in the current range.
Hi Ron,
If your forecast for decreasing oil output is correct and oil demand continues to grow as forecast (1 to 2% according to both IEA and EIA,) then eventually the market will balance. I doubt oil at $55/b or even Fernando’s $63/b will result in enough oil supply to meet demand, my guess is that $85/b will be needed for enough investment in new oil production to meet demand for oil.
The “glut” at this point is an illusion created by poor data fro the EIA and IEA.
The “glut” at this point is an illusion created by poor data fro the EIA and IEA.
Dennis, your knowledge of world affairs seems to rival that of Donald Trump. He knows more about ISIS than the generals do. And you know more about world oil storage than the IEA or EIA. And also more than OPEC knows as well. 😉
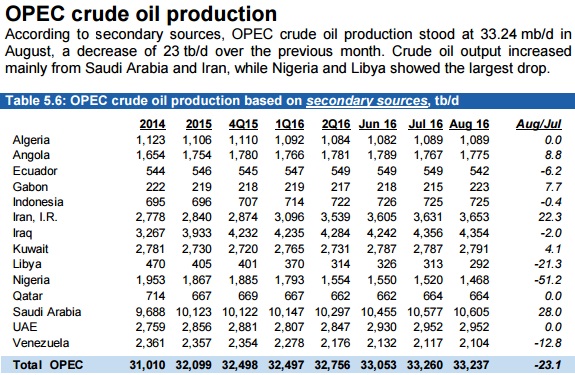
From the latest OPEC MOMR, page 7:
Nevertheless, the OPEC Reference Basket value is still some 9% below its last peak in June, as full storage tanks and production that exceeds consumption weigh on markets. Poor refining margins, despite relatively cheap crude feedstock prices, also pressured the oil market as refiners continued to pump more fuel than the market could absorb, resulting in overflowing storage tanks around the world.
Oh, one more very important point. I thought you believed that supply and demand determined oil prices, as I do. Well then if the current low prices are caused by a perceived glut caused by bad data, rather than a real glut, then Watcher is right, supply and demand don’t determine oil prices.
Well, I don’t believe a damn word of it. The glut is real. There is more oil than can be absorbed by this anemic world economy. And that is the reason for the current low prices.
Part of the reason for lower oil demand is the low price itself, which is a drag on oil demand in OPEC countries, Brazil, Russia, etc.
Kinda of like low to negative interest rates. Those who have the ability to save for retirement/retire become more conservative and spend less, knowing they need to hold back more funds due to low rates.
Used to do a lot of work for retirees, who were mostly in CD’s, bonds. Wonder how much of a drag it is on the economy now that they are getting 0-1.5% instead of 4.5-6%?
Diesel consumption in the US is down from 2015 in large part due to reduced oil drilling and coal transportation.
Roughly 40% of rail freight is coal…
Yep, coal is king of the railroad, we move 620 million tons a year (2015, will be less this year) . Used to be close to 900 million tons.
It seems to be the largest commodity moved by the railroad by a wide margin.
Yes, total rail carloads is in a major slump this year.
Part of the reason for lower oil demand is the low price itself, which is a drag on oil demand in OPEC countries, Brazil, Russia, etc
That statement cries out for an explanation. Low oil prices decrease demand? In what universe is that the law of supply and demand? How did the law of supply and demand get reversed? That is, the lower the price the less the demand?
So why don’t they just jack up the price which would increase demand?
Really now?
I admit I have not looked at the statistics, but it would seem to me if a country, province or state (ND, Alberta) has an economy which is heavily reliant on oil export income, a reduction in oil price by 60% would reduce GDP, would lead to job losses, and thus would lower demand in those oil exporting regions.
I could be wrong, just a thought.
Hi Shallow sand,
From an economist’s perspective, you are correct.
Ron,
An extreme example would be Venezuela.
They are likely consuming less than 2 years ago.
It’s a buffer effect – production is down by X, and domestic demand is down by Y, but X>Y, so it is merely a buffer on the overall change.
Some countries have the capital reserves to maintain domestic demand, others don’t.
It is probably a small total impact on global terms, but even a 0.05% demand change not anticipated by broad modeling is enough to have a price impact on the margin (i.e. WTI today would be $44 instead of $43).
Thing is, that doesn’t matter much when the prices varies by a larger amount from week to week anyway. That is to say, the “buffer effect” is smaller than the standard deviation, and would fall within measures of error, and thus not considered meaningful.
I do not know how much it affects price either.
My opinion on price is that supply and demand matters, but the prices do not move anywhere close in lockstep with supply and demand.
Traders have a lot more control over the price than we realize in my opinion.
$8-$140 from 1999-2008.
$29-$111 from 2009-2013.
$23-$99 2014-2016.
Those are price ranges we have sold crude for during the periods of time set forth.
Supply and demand has not fluctuated that much.
A very, very smart oilman, much smarter than I, told me that OPEC ceded pricing to traders a long time ago, and until OPEC decides to target a price, and restrict supply to meet demand to so it, there will be high and low cycles punctuated by volatility during the boom times and the bust times.
Right now, US investors think that prices will rebound. But each month that goes by, that sentiment will fade.
I am told the same thing happened in 1986. I note our area had a big drilling boom, which peaked in 1985. In 1986, there were wells drilled. OPEC acted in late 1986, prices doubled, and many wells were drilled in 1987. OPEC members cheated, prices fell in 1988, but wells were still drilled as they were in 1989, 1990 and 1991. By 1992, people started losing faith that $30 oil would return. Very few wells in 1992-1997. 1998 and 1999 pretty much nothing.
There was not much activity here again until 2006. 2014 was the peak. This time, however, 2014 was nothing close to 1985. And 2015 and 2016 have been almost completely dead.
It is all about recent memory.
Another thing, commodities seem to have multi year cycles. Grain is way off. Same thing as during last oil bust, when grain also was way off. Also, a supply demand issue, but traders exaggerate it both up and down.
Our problem was we didn’t see the lows being this low or this prolonged. But we weren’t the only ones.
One thing I might add. In the first half of the 1980s a lot of wells were drilled with other people’s money around here.
2006-2014, mostly locals who drilled out of cash flow.
LTO is the mother of all other people’s money plays, at least in the last 30 years, and it may top the early 1980s.
Shallow, Dennis, Brian, we are not talking about North Dakota. We are not talking about Venezuela. We are talking about the WORLD!
And no Dennis, Shallow is not right form any economist’s perspective. But if you think he is then please explain how low oil prices can decrease demand worldwide.
I mean this I just gotta hear!
Ron. I did not say worldwide.
I said part of the reason, I didn’t mean that to be taken as the sole reason. It only applies to oil exporters.
Hi Ron,
I agree that the glut was real and caused low oil prices. I think storage data for non-OECD nations is not very good and in general the data is poor. The IEA has 2Q2016 demand at 0.3 Mb/d less than Supply, in 3Q2016 the IEA forecasts demand to increase by 1.4 Mb/d, roughly in line with July output (according to the IEA), if World supply decreases in August and Sept (as I expect)and the IEA’s demand forecast is correct, supply may be less than demand in the third quarter of 2016. OPEC also expects World demand growth of 1.58 Mb/d for the 3rd Quarter. The excess supply estimate for 2Q2016 is 1 Mb/d for OPEC, very different from the IEA (about a factor of 3 different).
Also note that OPEC and the IEA have different estimates for supply and demand, I haven’t checked the EIA, that is also likely to be different. The correct answer is that we don’t know, but my guess is that before long supply will fall to the level of demand and the market will balance, demand will continue to grow, but until oil prices rise, supply will no longer match demand and eventually stocks will decrease and oil prices will increase. Bad data delays this process, the market doesn’t really know what is happening (as it only has faulty data.)
Article at link below discusses oil storage data
http://www.wsj.com/articles/how-much-oil-is-in-storage-globally-take-a-guess-1469380040
“The reality is, you don’t have any definitive numbers that give you huge confidence one way or the other,” said Doug King, chief investment officer at RCMA Asset Management.
In a nutshell, it’s a WAG.
Hi Ron,
Yes supply and demand determine oil prices, but when the market doesn’t know what supply or demand are at the World level, the market price may not reflect the true supply and demand picture.
I don’t know any better than the EIA, IEA, or OPEC what supply and demand actually is, OPEC and the IEA have different estimates of the “glut” in the second quarter of 2016. EIA storage data for the US has been appalling in the past, not sure they would do any better at the World level.
Jean Laherrere and others who I trust (initials RP) have often complained that the data from the various agencies is not very good. I agree with those experts.
Dennis, you simply don’t understand.It is not about data at all. It is not even about storage although storage does reflect the true supply and demand situation. It is about what a buyer has to bid to get the oil he needs.
It is just that simple. Rumors of a storage increase or decrease may cause a swing in the futures price but it is the spot buyers and sellers who determine the true and eventual price. If there is a true glut then sellers must lower their price in order to sell their oil. But if there is a shortage then the buyers must raise their price to get the oil.
Supply and demand is just that, nothing more and nothing less. Bad data or rumors can cause swings in the futures price. But it is only the actual supply and the actual demand that sets the actual long term price.
IF ANYONE WHO WORKS AT A REFINERY’s PURCHASING DEPARTMENT SEES THIS, PLEASE POST YOUR PROCESS FOR PLACING AN ORDER FOR OIL.
Watcher, if their storage tanks are full…. they don’t buy at all. And I will guarantee you that when they do buy, they buy from the seller offering the lowest price. They would be stupid if they did otherwise.
I don’t know what you are driving at with your ALL CAPS post, but in a free market economy,the fact that price is determined by supply and demand is denied only by those who know absolutely nothing about economics.
Just trying to attract attention of a skimmer.
We never seem to get any posts from refinery workers.
Hi Ron,
Nobody knows the actual supply or the actual demand, only prices from the past are known, future price is unknown.
How does the buyer of oil decide what price they should bid for a barrel of oil?
How does the buyer of oil decide what price they should bid for a barrel of oil?
Easy. they just buy from the seller offering his oil, or the grade of oil they need, at the lowest price.
Really Dennis, it is not that complicated. If there is a glut then sellers must lower their price in order to sell their oil. They don’t need to know how much oil is in storage. But if their storage tanks are full then buyers will be reluctant to buy at any price.
Hi Ron,
One must decide what price to bid, if one bids too low the sale may go to another bidder. My understanding is that in an auction setting, one must decide on a price to bid. How does someone arrive at that price?
Oh, the “glut” would suggest the price should be zero as there will be no bids because the storage tanks are full.
I understand perfectly well, how the market is claimed to work in theory.
In practice price expectations are key and these are determined by data. If the data is bad, people will make poor decisions.
It is much more complicated than simple textbook explanations in Econ 101. That’s why there are more advanced courses in economics, you cannot learn it all in 2 semesters.
Hi Ron,
Ok I see your point, it is the sellers that determine the price, but then the question simply shifts to the supply side. How does the supplier determine the proper price to sell their oil?
Note that you can say they will sell for the highest price that they can sell all their oil at. That simply begs the question.
How do they decide on the price?
The answer is that it is based on the data they have available. You suggest storage levels tell us the “true” supply and demand situation. Can you tell us what the level of storage is for crude plus petroleum products in non-OECD nations?
I cannot find this information so I do not know the “true” level of supply or demand for oil at the World level.
In theory, price is set by supply and demand and this works pretty well in a local apple market. For a World oil market it is more complex in reality than it is in a microeconomics textbook..
My understanding is that in an auction setting, one must decide on a price to bid. How does someone arrive at that price?
Dennis, don’t get your markets confused. The futures market is an auction. The spot market is not an auction. In the futures market there is always a “bid” and an “asked” price. Thousands of contracts are traded every day, ever hour, on the futures market. But the vast, vast majority of these contracts never result in any actual oil changing hands. They are simply settled in cash.
On rare occasions, when all the paper contracts expire, a buyer may “take delivery” or a seller may “make delivery” of the physical product. But only a tiny fraction of all oil is sold that way.
Most oil is bought or sold via a negotiated contract between the buyer and seller. Of course the current futures price would have an effect on that negotiated price.
Oh, the “glut” would suggest the price should be zero as there will be no bids because the storage tanks are full.
Oh now you are just being silly. You know better than that. A glut simply means there are more sellers than buyers. A seller can simply sit on his oil. He would never give it away. Oil always has a price.
In practice price expectations are key and these are determined by data. If the data is bad, people will make poor decisions.
Futures traders buy or sell paper barrels based on the data. And yes, the data is often wrong. And traders do make bad decisions based on bad data. And when they do they lose money. But the data never stays wrong, not in the same direction anyway. The data can never be wrong for very long because sooner or later the physical product will build up, or dry up, and the data will swing back to reflect the true supply.
Econ 101 is one hell of a lot more than just supply and demand. And I think you know that. The law of supply and demand is taught in all economics courses. But I am sure that part never takes very long, an hour or two at most. And then it only takes that long for a very few of the students to comprehend. Most of the students would get it in the first ten minutes or so.
Hi Ron,
I believe there is a spot market for oil, if it is like most markets there are bid and ask prices. Again the oil that is sold in a negotiated contract requires that a price is agreed on between buyer and seller. Those prices are not chosen arbitrarily, they are based on data.
I am very familiar with economics having taught it as a graduate student.
Dennis, no there is no spot auction. Such an auction does not exist.
Again the oil that is sold in a negotiated contract requires that a price is agreed on between buyer and seller. Those prices are not chosen arbitrarily, they are based on data.
Dennis, give me a break! I never stated that the price of oil was chosen arbitrarily. In fact that is what I have argued against from day one. What I said was:
Of course the current futures price would have an effect on that negotiated price.
In fact the current futures price would be the starting point for all negotiations. And the futures price is based on data. And as I said, that data is often wrong. And when it is the traders lose money. But the data never stays wrong for very long. Far too much money is at stake for the data to be wrong for very long.
The data sways in both directions, sometimes too high and sometimes too low. But it corrects itself within hours, or within a few days at most. Traders are not blooming idiots.
And the folks at the EIA, IEA and OPEC are not idiots either. They know, approximately, how much oil is in storage. To suggest that they all have it wrong, and have had it wrong for months, is a claim that is just beyond the pale.
Hi Ron,
So we agree that we do not know what the level of non-OECD crude plus petroleum products that are in storage. The storage data is the biggest problem with getting the output and consumption data correct and is reflected in the very poor performance of the weekly data from the EIA. As you know the monthly data is revised and the weekly data is not, but the traders rely on the weekly data which is often far from the mark. The monthly data is also not great, but is a few months late and revised later to correct past mistakes. So the futures market is basing their trades on very bad information and the futures market is the basis for much of the pricing negotiated as well as spot market pricing. Chart below shows weekly and monthly supply estimates from the EIA from Jan 2014 to Sept 2016. If we assume the monthly estimates are correct (they are actually too low after June 2015), the weekly estimates are not very good.
So we agree that we do not know what the level of non-OECD crude plus petroleum products that are in storage.
No, I don’t think we agree with that at all. I said the data is sometimes wrong but not wrong for very long. What I said was the idea that the data was wrong for months was beyond the pale. Does that sound like we agree? Good gravy, what do I have to say to show that we disagree?
The storage data is the biggest problem with getting the output and consumption data correct and is reflected in the very poor performance of the weekly data from the EIA.
It is not just the EIA, it is the IEA and it is OPEC. And we are talking about world storage, not just USA storage. They may get the data wrong for a week or so. But it is impossible that they have gotten the data wrong for months. No, no, no,… there is a glut of storage. Nothing could be clearer than that.
As to the chart below your post, that is US production. Oil is priced based on world production and world storage. And it is mostly based on world storage! That is because world storage is a measure of how much oil is being produced but not sold. And that could be because too much oil is being produced or not enough oil is being consumed.
Dennis, for God’s sake, the storage glut has persisted for over a year and a half. Do you think that the IEA, the EIA and OPEC, all three, have been wrong for a year and a half? Damn man, try to use a little reason once in a while.
The glut is real. You could deny that for a while but after a few months your denial just starts to look silly. And after a year and a half your denial just starts to look totally absurd. Even the six thousand year old universe people start to look reasonable by comparison. 😉
Hi Ron,
I agree there has been a glut from mid 2014 to 1Q2016, but my guess based on IEA data and the opinion of an expert (you) on future oil output, is that the glut ended in the second quarter of 2016.
So what is the level of non-OECD storage?
By your lack of an answer I assume you do not have one, neither does the IEA, EIA, or OPEC.
The US (which has one of the best sets of data) gets storage levels just in the US wrong for months at a time, based on that chart (where most of the problem is storage data), for the World the problem is much worse.
I agree there was a glut, I do not agree that there is currently a glut and for the 2Q2016 the IEA agrees with me.
Or do you think 300 kb/d out of 96,000 kb/d would be considered a glut?
Nobody really knows what supply and demand levels are, the perceived level based on bad data determines market price. I agree with shallow sand that these prices can be “wrong” for longer than you believe. Eventually the market figures out the “correct” price, but it takes a while.
Right now the market has the oil price too low imo, if your guess at future oil production and the IEA’s guess at future demand are both correct.
The EIA weekly data was too low by roughly 200 kb/d for about a year. So this shows that the data can be bad for more than a few months, I agree there has been a glut, I do not agree there is a glut (we cannot really tell due to poor data), the fact that OPEC and IEA estimates of the balance of supply and demand are very different reflects the fact that the current storage data is not good, it will take 6 months or more before we have decent data, in the mean time the oil price will be determined by guesses about supply and demand by market participants.
Hi Ron,
What is the level of oil in storage for the World? How many barrels?
What is the level of oil in storage for the World? How many barrels?
The World Is Not Running Out Of Storage Space For Oil
Hi Ron,
Based on that article, the IEA seemed to be the only source for storage data, but note that there is no data for actual world storage levels, only for the OECD.
In 2Q2016 the “glut” of oil supply relative to demand is under 0.5% about 300 kb/d out of World supply of 96,000 kb/d or 0.3%. If OPEC’s estimate is correct, there is a bigger imbalance, but growth in oil demand will take care of that if supply is flat or declines.
Ron,
You say it is simple, but it is not. If the market participants believe there is a glut because the data is bad, but in fact supply and demand are roughly in balance (as the IEA estimates for the 2nd quarter of 2016,) then the oil price that is agreed between buyer and seller will tend to be too low. Eventually this will be corrected, but if the IEA’s estimate is correct for April to June 2016, the “incorrect” price can last for many months (in this case from June to Sept 2016.)
Still waiting for World storage level of crude plus petroleum products, we have this data for the OECD, but not for the World.
So the “glut” in storage is difficult to measure without data.
Potentially 0.8 million barrels a day returning to the market from outages…
Bloomberg – In Nigeria, Exxon Mobil Corp. was said to be ready to resume shipments of Qua Iboe crude, the country’s biggest export grade, which averaged about 340,000 barrels a day in shipments last year, according to Bloomberg estimates. On top of that, a second Nigerian grade operated by Royal Dutch Shell Plc is scheduled to restart about 200,000 barrels a day of flow within days.
The resumption of shipments from the three Libyan ports would allow Libya to double crude output to 600,000 barrels a day within four weeks, National Oil Corp. Chairman Mustafa Sanalla said Tuesday in a statement on the company’s website.
The exports are possible after a substantial improvement in the security situation there, he said Wednesday in a separate statement. The Tripoli-based NOC lifted a measure called force majeure, which gives the company the right not to meet supply commitments.
Libya has made at least half a dozen failed pledges to restart shipments. What may be different this time is that the NOC has struck a deal with Khalifa Haftar, commander of forces who took control of Es Sider and Ras Lanuf. He also has control of the oil fields and pipelines that feed them.
http://www.bloomberg.com/news/articles/2016-09-14/oil-field-restarts-in-nigeria-libya-set-to-worsen-global-glut-it35knqy
My latest incremental crude oil production graphs are here:
11/9/2016
Incremental crude production update August 2016
http://crudeoilpeak.info/incremental-crude-production-update-august-2016
Top U.S. Oil companies got hit right between the eyes 1H 2016. After they paid CAPEX & Dividends, there were in the hole for $18 billion versus enjoying a $16 billion dollar surplus 1H 2011.
steve
What are the share prices now v 2011?
I think the share prices of XOM and CVX are both higher now than in 2011.
https://www.google.com/finance?q=NYSE%3AXOM&ei=rknaV4nHH8OPjAHGirrgCA
yield chasing
Hence 24% additional capital cuts to come this year according to IEA, and probably more next:
http://www.upstreamonline.com/incoming/1444004/investment-in-upstream-set-to-drop-iea
https://www.iea.org/investment/
‘Global upstream investments are expected to fall even further next year, if the current trend continues, according to the latest International Energy Association (IEA) report.
Last year saw an 8% drop in global energy investments to $1.8 trillion in 2015, down from $2 trillion in 2014, according to IEA’s World Energy Investment 2016 report.
‘Oil and gas investments were still number one, with $583 billion spent last year, accounting for over 45% of the total. This, however, was a 25% drop since 2014 mainly due to cost reductions triggered by lower oil prices.
‘IEA now forecasts that next year will even see a further 24% drop compared to this year, “to the lowest figures in 60 years”.’
(I don’t follow the arithmetic there though, 583 is 32% of 1800)
I think as each project is coming on line only an equivalent of about 1 in 3 or 4 new projects are being started and the rest of the budget is cut, that includes major greenfield and smaller brownfield projects for IOCs and NOCs. Exploration is being slashed at the same time. The train of projects that were in progress in 2014 when the cutes really started peters out in late 2018; 2019 have very few (Angola, Brazil), 2020 has Johan Sverdrup (I think just approved in mid 2014) and Appomatox (approved 2015). After that a drought – bigger projects can’t get online now before 2021 even if prices jumped to $120 tomorrow, there are few smaller projects because of the lack of discoveries, brownfield impacts are increasingly less cost effective on depleted fields. To me that is what decline after peak oil should feel like.
Actually ignore that Upstream Online article and quote it’s rubbish, they have this year and next mixed up apart from the percentages all wrong (I think they meant and overall 45% fall for oil and gas over two years, but who knows).
Hi George,
Do you have a WAG for average monthly Brent crude spot prices for 4Q2017?
Mine would be $80/b+/-$5/b.
Nope – I haven’t got a clue. But what would that price impact – maybe a small immediate impact on demand growing over a year or so and oil supply 3 to 5 years later mostly I think? The shale oil might be faster to react (which I think is partly why it gets so much attention – it fits within most peoples event horizon) but it certainly didn’t show much flexibility in shutting down on low prices, leaving investors with huge losses, so I’m a bit sceptical what happens on a ramp up (plus I believe much lower URR for the known basins than you).
Also keep in mind that with the dearth of recent discoveries the projects available are mostly those that didn’t make the cut when oil was over $110 per barrel, or buy back options on old fields in the Middle East, and the IOC and service company groups responsible for developing these will have lost at least 50% of their staff through redundancies and retirement.
Hi George,
Weren’t there some projects cancelled when oil prices dropped? When oil prices rise those projects may go forward (and there will be a lag of 5 years or so before we see any oil from the deepwater projects).
There could be more infill drilling and more LTO development at higher prices, and whether USGS assessments prove to be correct will be determined when oil prices rise.
Note that if your assessment is correct, I would expect that $80/b will be too low and would expect $100/b by 3Q2018 (perhaps earlier). In fact your assessment for supply seems in line with Ron’s, perhaps you believe as he does that the oil price will be $55/b. Would you venture a guess as to whether oil prices would be higher or lower than $55/b on an assumption of 2% World average real GDP growth over the next 12 months?
Dennis – I think nothing was cancelled that had already been through FID. Mad Dog II was cancelled in late 2013 (oil at $110 plus) as a big hub / spar project, but hasn’t yet been reinstated, though BP seem to think they have the price halved, but probably with much lower scope, and it might go ahead soon. A lot of Tar Sands were cancelled at the FEED or pre FEED stages. A couple of Angola/Nigeria projects were cancelled at conceptual design.
“There could be more infill drilling and more LTO development at higher prices, and whether USGS assessments prove to be correct will be determined when oil prices rise.” – yes there could be both but they wouldn’t be immediate: budgets have to be approved, bid packages prepared and reviewed, personnel hired etc. As I said I think the marginal gains for in fill drilling are declining, and even if used it just sets up a bigger crash a bit later. I think the sweet spots for LTO have gone so even with better efficiency they are in a Red Queen position.
The reason that there are boom and bust cycles in the oil industry is that it is a dynamical feed back system between demand / supply / price, but it has a high gain (or low depending on your perspective) element which is price impact on demand (i.e. very inelastic) and a big dead time delay in the feed back (the time it takes for supply to ramp up in response to price. Either of these is enough to produce instability (in a pure system a big sine wave), both together is a nightmare. There used to be a fast negative feed back loop as well, called OPEC, which smoothed out things quite well, but no longer. If I were 40 years younger I might be able to write and solve the Laplace transforms and/or plot a Bose diagram to show the expected frequency and amplitude of the oscillations – these days not so much, easy Sudoku is my limit. But with one caveat – there is an element in the feed back which is price impact on demand, that is the ‘world financial and political system’ – a big black hole that cannot be modelled – I think it is mostly stochastic not deterministic personally, but at the least there are lots if undetermined outside imfluences.
I have no idea on the price and neither does anybody else. Read the book ‘Signal and Noise’, I’ve forgotten the author but he is famous; ‘experts’ are useless at predicting anything, they are only experts at selling themselves as pundits and celebrities, nothing else and they do that mostly by either going for extreme, but totally unsupported, predictions or always following the trend but having good teeth to show on TV.
Bode not bose – good headphones though.
As usual, great comment George. I guess you were referring to: The Signal and the Noise: Why So Many Predictions Fail but Some Don’t by Nate Silver.
I agree great comment.
Hi George,
Yes very nice comment.
How about anybody else? Ron, who I consider an expert has guessed $55/b (technically he said mid 50s) for 2017, let’s say that’s the average oil price for Brent in 2017, Ron didn’t really say. George will not venture a guess we will call that 0 to infinity, not sure what the average is 🙂
Fernando thinks $63/b, I think $70/b for a 2017 average oil price for Brent crude.
Many don’t like to guess. Nobody knows the future price of oil.
I agree the future of oil demand is hard to predict as it depends on many factors especially the state of the economy.
Based on George’s comments he tends to think oil output will fall relatively rapidly, this seems to imply higher oil prices, but no doubt he expects an economic crash as well, so demand might fall even faster than supply in that case and oil prices might fall to $10/b, maybe less.
Clearly our views diverge so I may completely misunderstand, but if I have that right, I would not be able to predict prices either. I might think the system is a little more stable than George believes.
But with one caveat – there is an element in the feed back which is price impact on demand, that is the ‘world financial and political system’ – a big black hole that cannot be modelled – I think it is mostly stochastic not deterministic personally, but at the least there are lots if undetermined outside imfluences.
This is the crux of the argument, and of all the time and thinking put in here: model what is measurable, and hope for clues, knowing that there is not enough information.
I do wonder if you are wrong about the “modelability” of the political/financial system, however. My guess is that with AI and increasingly powerful computer systems, someone (Taleb, perhaps, or Hari Seldon?) is out there doing Monte Carlo runs trying to crack this nut.
Whether for good, evil, profit, political advantage, or just out of general boredom, however, I can’t say. 🙂
-Lloyd
PS- I really like your theory. It answers a whole bunch of questions about the last two years better than anything else I’ve seen.
Thanks all. Yes Nate Silver – his blog is 538 but he sold up and I don’t know how nuch he is involved. There is another book I haven’t read yet which is similar: Superforecasting: The Art and Science of Prediction by Philip E. Tetlock and Dan Gardner which, from the review, indicates the best forecasters are interested, widely read amateurs with no stake in the forecast (i.e. not smiley TV experts).
Hi George, Doug, Shallow sand, and anyone else who cares to give their opinion,
You seem to follow the business very closely, what do you expect C+C output to be in 2017?
Yes we do not know this, and without the oil price it would be hard to guess. More or less than 78 Mb/d, for average World C+C output in 2017? Or if you prefer World liquids, more or less than 94 Mb/d for the 2017 average World liquids output?
Assume what you will about the World economy and oil demand, though if you are explicit about your expectation for World GDP growth any guess would be clearer.
If the world struggles along as present with no major revolutions then based on the projects I know will be ramping up and assuming flat production or a fairly slow decline in OPEC (i.e. Nigeria and Libya coming back to offset somewhat declines in KSA, Ecuador, Venezuela, Indonesia (maybe Angola an Algeria), then I think we could see a new peak in September 2017 (but only just and short lived). That scenario doesn’t depend on price, just on momentum in current projects. It also depends on a big chunk of production coming on line from Kashegan – judging by previous performance history that could be a stretch.
Note I don’t think this is a good thing. The further the peak is extended the bigger the crash will be when it happens. We need a nice slow decline that allows first nat. gas and usage / efficiency changes and then renewables to step up. And even with this I cannot come up with a scenario in which the Middle East, probably starting in Egypt, doesn’t go up in flames – and then most importing countries are various shades of toast (though still maybe doing better than the population in ME how used to live on state hand outs).
If oil supply is maintained then I doubt there will b many FIDs for new projects that would be starting in 2021 or 2022, tar sands would be finished for several years. Discoveries would fall to the lowest again (probably – wildcats are entirely probabilistic and a monster might be found), however I think exploration for oil is trending to zero over 10 years whatever – it is not going to work having to drill 10 or more $250 million wells and come away with a 50 million barrel discovery at the end of it.
Note also until this year I though peak oil was the bigger issue in the medium term, but recent studies and results look to show climate change has put in a fast lap and is catching up at increasing pace.
I also agree with Ron (I think – he’ll probably yell at me for making assumptions about his position), but human nature and to some extent our phenotype (which is extended – i.e. not just our body but everything in nature we change for our benefit) as it mostly evolved in the the Environment of Evolutionary Adaptedness of the drying African planes doesn’t work in the current environment unless there is increasing amounts of cheap energy so that mostly everybody gets a slice of the pie and we can at least pretend that tomorrow will normally be better than today.
That last paragraph seems to have escaped from me and gone on the run – sorry about that, hope it makes a bit of sense anyway (edit failed in some different way this time – just a blank screen).
African planes can fly only over Africa?
Or, are they wood planes tough enough to shave ebony?
I’m confused.
Of course, African Plains are what I am thinking, but I could be wrong. har
Hi George,
Another great comment, thanks. Jean Laherrere’s latest estimate for crude plus condensate less extra heavy oil (oil sands from Canada and Venezuela) was recently updated to a URR of 2500 Gb. That is the same as my “low” scenario for oil when a 500 Gb URR for XH oil is assumed (same assumption made by Jean Laherrere). Total C+C URR is 3000 Gb. I will also assume as you do that 2017 output is near 2015 levels and then there is decline. The decline rate based on an oil shock model is around 2%/year from 2025 to 2040 and falls to under 2% per year after 2040.
Lots of mistakes in this article, but the $2 trillion for 2014 is ALL global energy investments of which $700 billion (or 35 %) was for oil and gas. They say that in 2015 global energy investments fell to $1.8 trillion or 10%, of which $583 billion (or 32%) was for oil and gas, a 16% drop in the oil and gas sector.
See Figure 4 on Matt’s post: http://crudeoilpeak.info/iea-in-davos-2016-warns-of-higher-oil-prices-in-a-few-years-time.
Agreed – but the IEA summary and charts are useful, although they also have the oil and gas budget at 46% (not 45%) rather than 32%, so I don’t know what to make of it.
Riot Police Begin Mass-Arrests at Dakota Access Pipeline, FB Censors Video
China’s oil demand shifting to consumers, not falling, Wood Mac says
“Oil has maintained its growth; in fact, it’s the exact same rate as 2011 despite the slowdown and the collapse in demand we saw in coal and gas,” said Ann-Louise Hittle, oil market analyst at Wood Mackenzie, during a recent meeting with journalists in Houston.
Chinese car retailers sold 21.1 million vehicles last year, and about 40 percent of those were gas-guzzling SUVs and multipurpose vehicles. Wood Mackenzie estimates China’s oil demand will grow between 350,000 and 450,000 barrels a day this year, the same rate as 2011.
“Despite the lower [economic] growth, there’s still a rising middle class, and with increasing income there’s a drive for personal mobility,” Hittle said.
But the IEA’s revised numbers puts global oil demand growth at 1.3 million barrels a day this year – the same figure Wood Mackenzie has forecast for months.
Similarly, Wood Mackenzie believes these offsetting trends will keep oil supply growth flat this year. Where they differ is when they believe the oil market will come back into balance. While the IEA said Tuesday demand and supply will realign after the first half of next year, Wood Mackenzie believes total worldwide oil demand will climb above supply in the fourth quarter of 2016.
“It’s September, and it’s looking like we’re going to end up with a slight (oil storage inventory) draw,” Hittle said. “We’ve got a rebalancing underway.”
http://fuelfix.com/blog/2016/09/14/chinas-oil-demand-shifting-to-consumers-not-falling-wood-mac-says/
TT
Don’t know how closely you follow output from the Appalachian Basin, but the recent numbers continue to be very impressive.
EQT’s fifth Deep Utica well, the Shippman, has been online 37 days and produced almost 1 1/2 Bcf. June’s production was just under 40 MMcfd, an almost inconceivable amount.
This company still plans to accelerate development of the shallower Upper Devonian formations as their recent wells are on track to hit the billion cubic foot mark in just a few months’ production.
Highly, highly prolific area with several shorteter pipelines coming into operation in the coming months.
Still won’t help the New England folks if this winter is cold, though.
Coffee, truly impressive numbers. Still wrapping my head around the changes I think will be a permenate part of our industry landscape. A true lesson for the benefit of private property, profit motive and free markets. I have always known if the oil/gas is there, the true scientist and engineers with a can do attitude will figure out how to get it out of the ground and at a profit. How fast this has happen has caught me by surprise. I don’t follow Appalachian closely as we have no interest up, but I do own stocks in the companies active up there. I am seeing similar advances (although smaller gross numbers) from the areas we are active. If the info Rystad publishes is correct, that horizontal shale wells produce 50% of overall EUR in 5-6 years our wells in central Oklahoma are going to make 10BCFG and 500k liquids with a 4500′ laterals. We are going to be happy campers. Always appreciate your insights.
TT
Pennsylvania Marcellus July results just released.
The above referenced well, Shipman is correct spelling, now posts 2.167 Bcf first 68 days online.
Incredible.
For folks familiar with oil numbers, that 2.167 Bcf is energy equivalent of over 360,000 bbls oil … in two months’ time.
The nearby Scott’s Run Utica well, arguably the most productive unconventional well ever drilled, has produced 9.74 Bcf in 361 days … energy equivalent well over a million and a half barrels of oil.
The Shipman lateral was 6,000′, about double the SR’s 3,200.
Both wells used 100% ceramic proppant, which may be the key to successful, Deep Utica development (12,000’+).
Offshore vs. Shale – shale positioned for a strong recovery
“Shale has the lowest payback time of 4 years assuming an oil price of $70/bbl and 8 years at $50/bbl as well as the highest IRRs.”
The fact that companies can recover investments faster reduces the risk of the source and make it more attractive. As a result, Rystad Energy expects that shale will have the largest growth in investment over the next few years”
http://www.rystadenergy.com/NewsEvents/Newsletters/UsArchive/shale-newsletter-september-2016
MIXED EVIDENCE FROM SHALE WELL DECLINE RATES: MORE STABLE INITIAL OUTPUT, BUT MORE AGGRESSIVE TERMINAL DECLINE
Figure 1 demonstrates how average oil 30-day initial production and 30-year EUR changed from 2012-2014 to 2015-2016 in major liquid plays. Only horizontal wells are included and EUR calculation is conducted at well level with a terminal decline assumption of 10%. It can be concluded that both average EURs and IP rates increased significantly over time in all plays. However, while IP rates improved by approximately 20% in Bakken, Eagle Ford and Permian Delware and doubled in the Permian Midland, EURs demonstrated a 40-75% increase in these plays except for an outstanding increase of 190% in Permian Midland.http://www.rystadenergy.com/NewsEvents/PressReleases/mixed-evidence
Hi Texas Tea,
We do not know what the future decline rates of the newer wells will be. It is possible that faster future decline rates will be even higher than 10%/year and the overall EUR over the life of the well will be unchanged or it might be lower than before. We just do not know. For the Bakken/Three Forks in North Dakota it is unlikely that any wells drilled in 2009 or later will surpass the average EUR of wells with first production in 2008. Higher IP does not necessarily imply higher EUR.
Hello Dennis, I am a “show me the money” type of guy. You are right we don’t know. Each trend, each formation, each well and completion have many variables. But time is the ultimate judge. I can and do only speak for trends and wells which I have personally knowledge and more often than not my own money involved. Having said that, our older wells I am quite sure will be money makers. I have little reason to believe that higher gross frac loads and tighter spacing will result in less relative production. I know because of personal experience, that experienced oil and gas professionals may disagree on the details and prefer one set of parameters over others, but in the end, well EUR are going up fast and well cost are still coming down. 10 years from now we can look back and say I told you so, hopefully from a standpoint of an adequate supply of affordable energy (with a profit) for our fellow country men.??
Hi Texas Tea,
The data so far suggest that EUR is more likely to decrease than increase over time. Have you ever looked at the data at shaleprofile.com. Well costs are coming down in some basins, but as more proppant and more stages are used well cost goes up, part of the decreased well cost is due to the low rate of drilling, if prices increase and drilling rates increase, well cost will increase.
Output might increase for 5 to 7 years (if oil prices increase to $90/b or more), but by 2022 US LTO will be in decline (at the latest, 2020 is more likely if prices reach $80/b by 3Q2017).
Bogus because stage count increased. Invalid well comparison between 2012 to 2015.
http://business.financialpost.com/news/energy/when-oil-turns-it-will-be-with-such-lightning-speed-that-it-could-upend-the-market-again?__lsa=e89a-7cab
The foregoing discusses the potential for a very sharp turn in oil prices when the supply and demand balance finally turns.
I found this noteworthy since it actually mentions oilfield depletion, which isn’t something I see in many such articles.
Additional perspective to Ron’s, Dennis and Shadows conversation above.
Oil Market Update
Clive Maund is an English technical analyst, holding a diploma from the Society of Technical Analysts
September 13th, 2016
“US oil inventories have continued to rise to yet another record high. These inventory levels, which used to top out cyclically at about 1.1 billion barrels (for combined inventories of crude, gasoline, distillates and other oils) have now arrived at 1.4 billion barrels. This is their highest level since at least 1990 and going forward they should exert continued downward pressure on oil prices, and this downward pressure is likely to be exacerbated if we see weakness in the economy, which will be presaged by falling markets, and markets have just started falling, dragging oil prices lower already.”
continued at http://www.321energy.com/editorials/maund/maund091316.html
There is no evidence technical analysis has any value at all, other than to offer it to prospective AUM who don’t know any better.
Characterization of behavioral finance cannot be objectively valid and there has never been a multivariate regression test of it that achieved significance.
blah blah
Those who do not learn from history are doomed to envision the future
I can never wrap my head around this storage issue. If the world is consuming 10 million bpd more than ten years ago wouldn’t you expect to have much more storage as part of that increase.
I live in Oklahoma and they’ve been adding new storage tanks at the Cushing terminal for the last decade.
GJ: The volumes of all of these new cross country 36 inch pipelines are adding to that total also:
I think the US is consuming about the same as it was 10 years ago.
Hi Nick,
In June 2006, US refineries produced 18,960 kb/d of petroleum products, in June 2016 it was 20,780 kb/d. The US might consume the same amount, but refinery output will affect storage levels.
The US was importing more refined product in 2006 and exporting less
https://www.usitc.gov/research_and_analysis/documents/foreso_petroleum_products-12-1-14_final_0.pdf
US shale’s resilience touted despite output decline: Fuel for Thought
http://www.oilvoice.com/n/US-shales-resilience-touted-despite-output-decline-Fuel-for-Thought/a0b7cec9a1b8.aspx
Hi Ron
I’d just like to thank you for all your posts over the years. It’s been a great pleasure coming to this site and reading your work and I’m very thankful for all the effort you’ve put into it. All the best
FED production numbers for natgas came out yesterday confirming the steep downward trend for natgas production down year over year -1.7% at a monthly rate of -1.5% per months (blue line in below chart).
FED production numbers came out yesterday confirming the steep downward trend of US natgas production, falling year over year by -1.7 % at a monthly rate of -1.5% (blue line in below chart). As drilling (red line in below chart) is still falling by over -50% year over year, this suggests a production decline of over -10% by February 2017. As shale gas represents now over 60% of US natgas production, we are witnessing for the first time a shale gas decline, which will be in my view much sharper than conventional production declines of the past. It will be now interesting how prices (green line in below chart) react to this trend. It is just the time lag between rig count and production which masks the current structural weakness of US natgas production.
There is also an interesting article by Ed Yardeni:
http://www.investing.com/analysis/slip-sliding-in-the-oil-patch-200153833
suggesting as well a time lag of 18 month between rig count and US production. In my view this reflects the combined time lag of shale production of about 6 months and 24 months for conventional production. The current US production still benefits from a rise in conventional production mostly from the gulf of Mexico. However, as the impact of rising GOM production fades in the coming months, the correlation between rig count and production suggests a steep fall of US production for the next year. If the correlation in Yardeni’s chart holds, the production could fall below 6 mill b/d by mid 2017.
At some point in the not so distant future, oil production is virtually sure to peak due to geological factors.
The laws of physics can’t be sidestepped, and nobody has discovered a new super giant field, or anything close to a super giant, for the better part of a century now. However much is in the ground, there is less and less remaining every year, and getting that remainder is dead sure going to cost more,as the years go by, in materials, energy, and manpower.
http://cassandralegacy.blogspot.co.uk/2016/09/peak-oil-by-any-other-name-is-still.html
Now whether the electric and autonomous transportation revolution can grow fast enough to reduce demand sufficiently to prevent a real oil supply crisis within the next decade or so is an open question.
If Dennis is right, and oil production declines very slowly, then we probably can manage via changing livestyles, improving efficiency, etc, for a long time, at least as long as matters personally to the regulars here in this forum.
If production starts declining at a couple of percent a year, we are probably going to be up the proverbial shit creek without a paddle, although I have never quite understood why the saying is not DOWN the creek. Given that you can float downstream, you have a good chance to get home without a paddle, lol.
A whole lot depends on how much lithium the battery manufacturers can put their hands on, and how much it is going to cost.
http://www.mining.com/web/why-china-is-really-dictating-the-oil-supply-glut/
Dated May 4, 2016
Ship tracking data from Bloomberg shows that 83 supertankers carrying around 166 million barrels of oil are headed to China, which has stockpiled an impressive 787,000 barrels a day in the first quarter of 2016—the highest stockpiling rate since 2014.
While the world was speculating about oil prices plunging to $20 and $10 per barrel, China was busy stockpiling its reserves.
That’s about 71,000,000 barrels of oil in 90 days.
Another hundred days of oil buyiñg accumulates another 78,700,000 barrels of oil.
After 400 days of squirreling away oil at a low price, China will place 300,000,000 barrels of oil in storage.
The Chinese have been around the block for a good 3000 years, so they know the score, know how bidness is done.
When supplies become strained, the demand will still be there.
The Chinese can keep their heads above water.
They’re probably stockpiling soap too. har
The Bakken will probably dip below a million bpd in November and December, it will be tough to keep running in place. Maybe some good wells will help it keep up, but they can wait for a price increase.
Some finesse is involved, that’s for sure.
Whoop de doo. The US has a stock of 2 billion barrels of oil.
This surprised me (from the article): “JP Morgan estimates that in March, the total demand for oil in China was 10.3 million b/d, down 2.5 percent over the previous year and down 2.3 percent month on month, whereas the chart shows that imports are higher compared to the same period last year.”
Does anyone have more recent data? Is China in a recession? What would that imply for global oil demand?