All data below is based on the latest OPEC Monthly Oil Market Report.
All data is through August 2017 and is in thousand barrels per day.
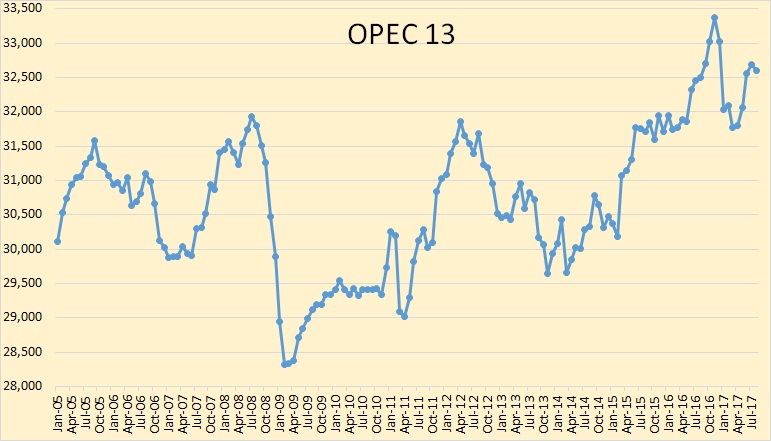
The above chart does not include the 14th member of OPEC that was just added, Equatorial Guinea. I do not have historical data for Equatorial Guinea so I may not add them at all. OPEC production has held steady for the past three months. Their production was down 79,000 barrels per day in August but that is not a big drop when production is over 32.5 million barrels per day.
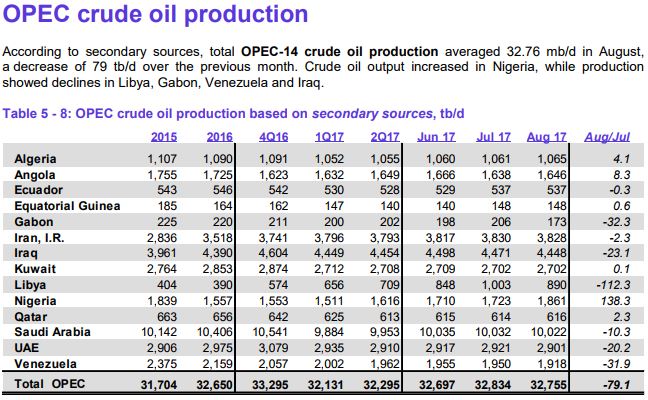
August production was down 79,100 barrels per day.
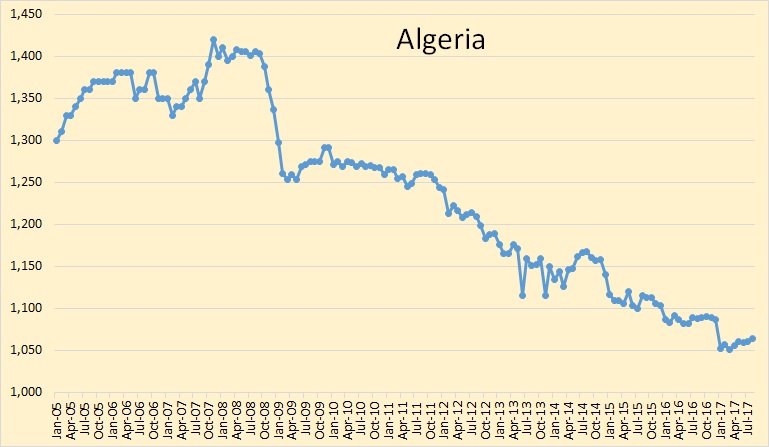
Not much is happening in Algeria. They peaked almost 10 years ago and have been in slow decline ever since.
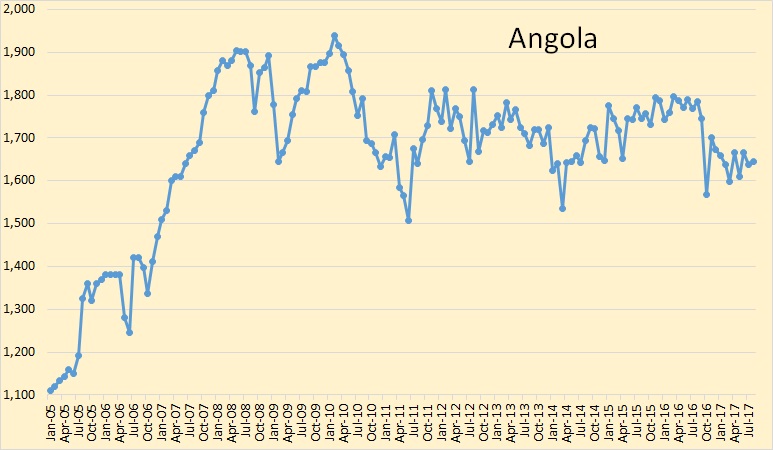
Angola peaked in 2010 but have been holding pretty steady since.
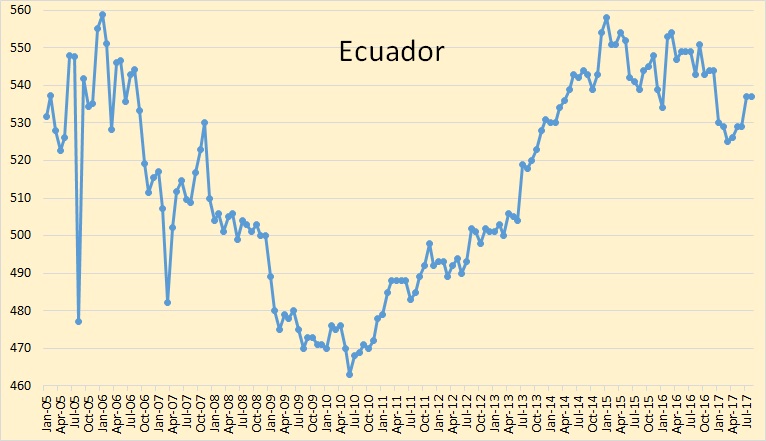
Ecuador peaked in 2015.
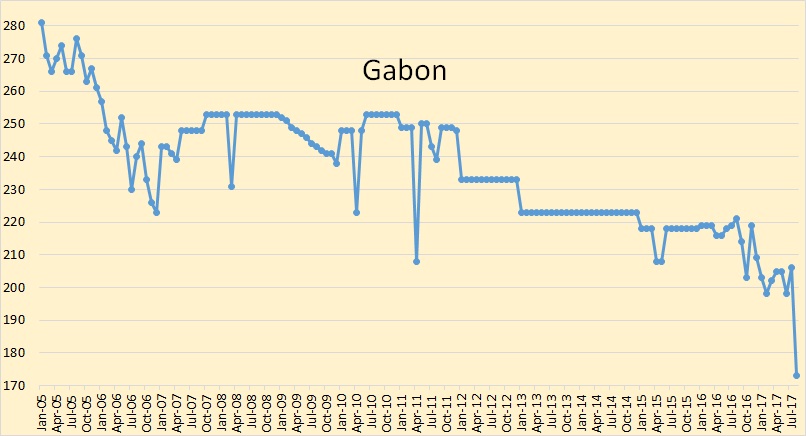
Gabon’s oil production dropped 32,300 bpd in August.
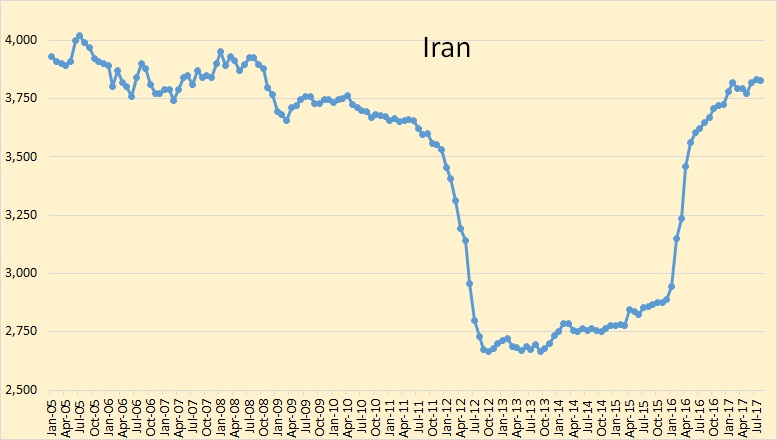
Iran has obviously reached peak post sanctions production. Like every other OPEC member, they are producing every barrel they possibly can.
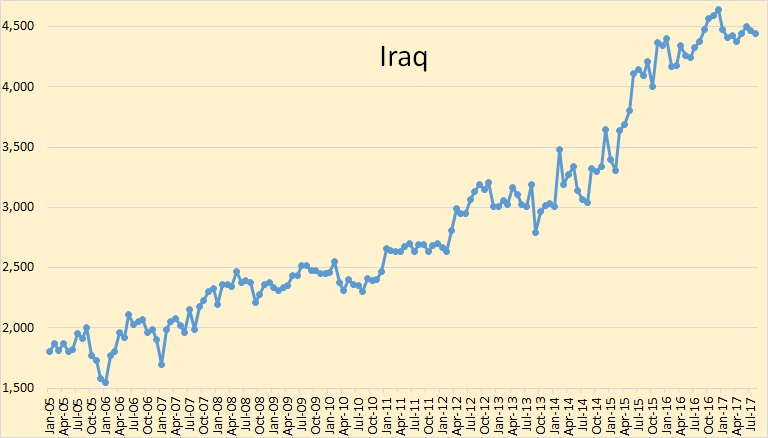
Iraq is holding steady since their December peak.
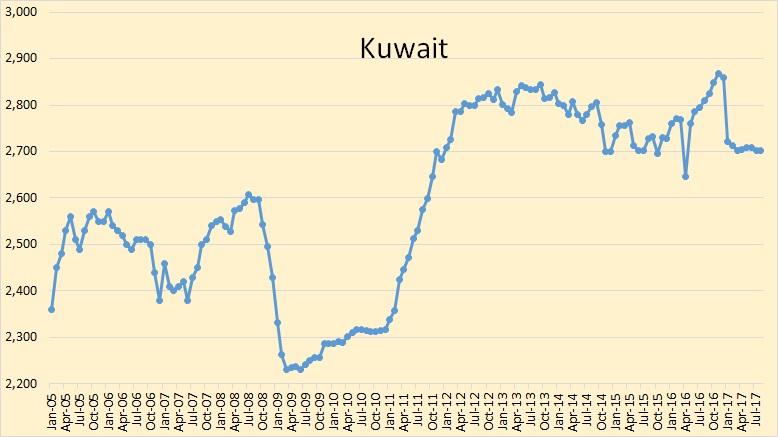
Kuwait is down 165,000 bpd from their November peak. That is about 5.75%.

Libya’s production dropped over 112,000 bpd in August. They are still having political problems.
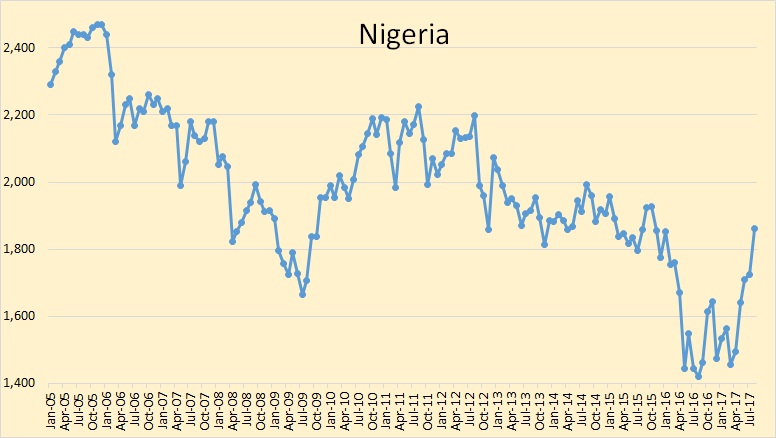
Nigerian oil production jumped 138,000 bpd in August. I am doubting they can hold at this level however.
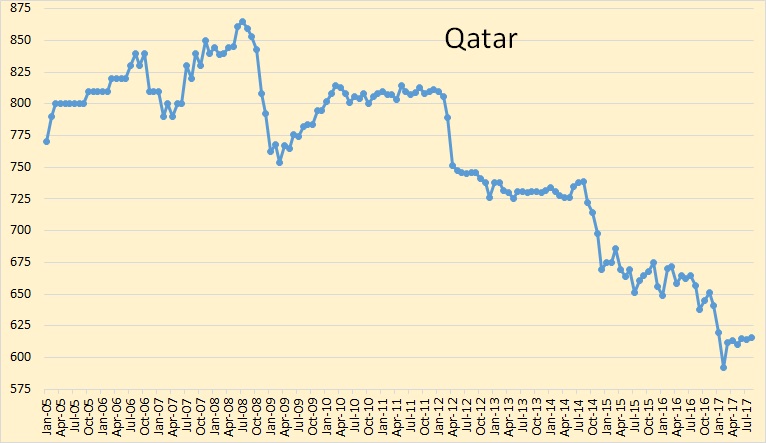
Qatar has been holding steady for the last six months. But I expect their decline to continue soon.
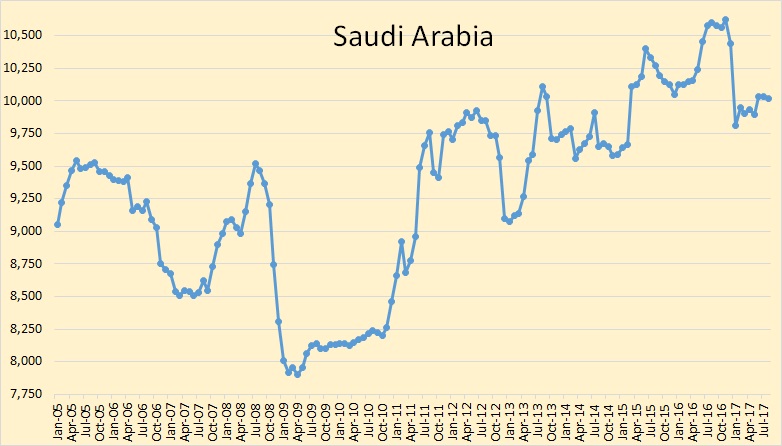
Saudi production was down 10,000 bpd in August. That was hardly noticeable for them.
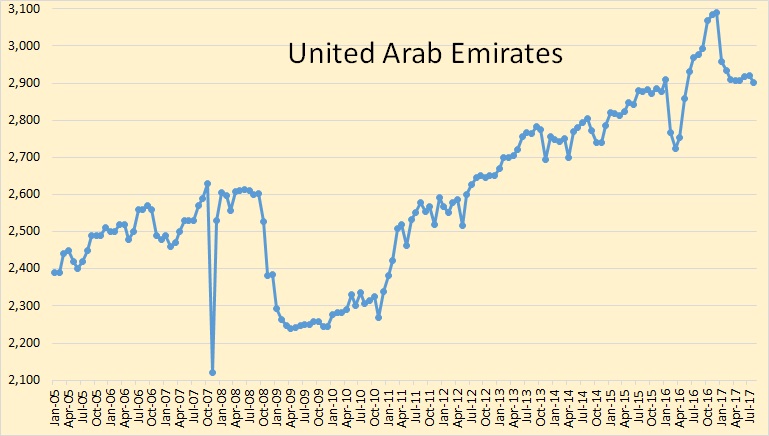
Nothing much is happening in the UAE lately.
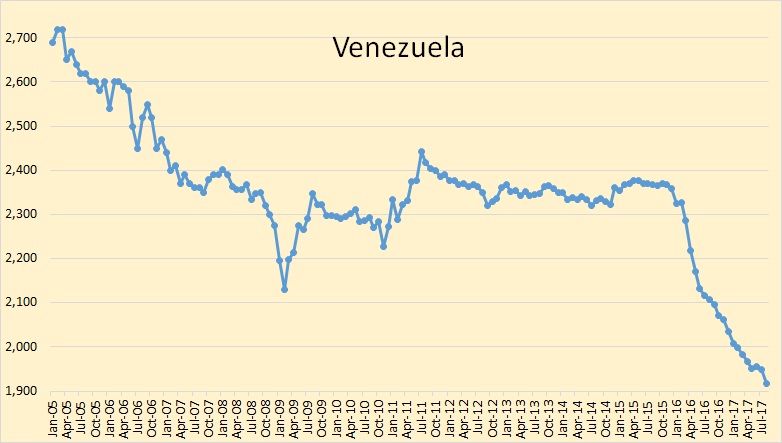
Oil production continues to decline in Venezuela. Their political situation is getting much worse also.
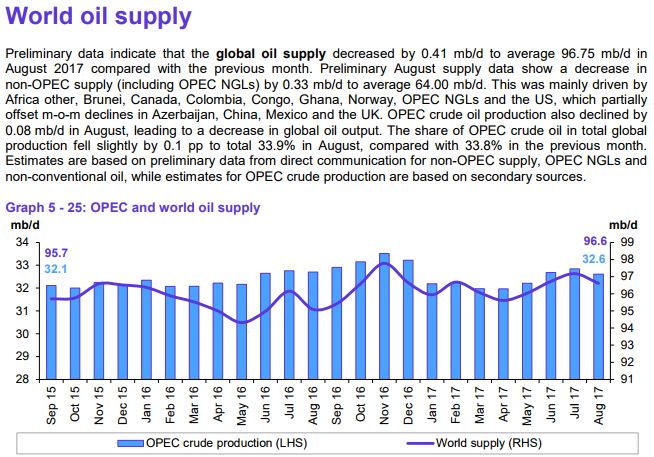
World oil supply decreased by 410,000 barrels per day in August.
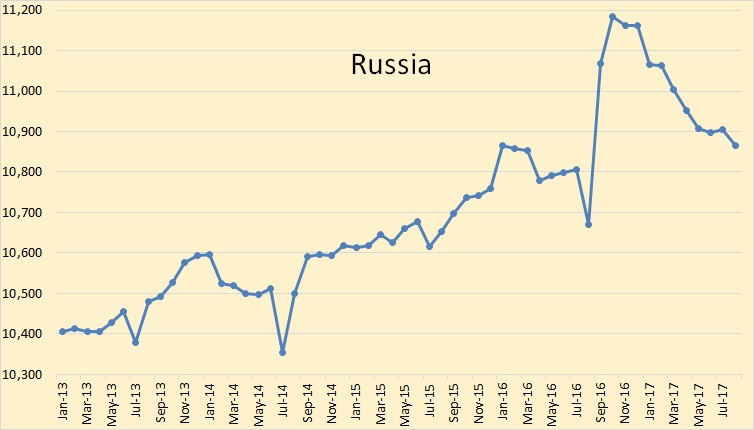
Russia is not an OPEC member but as the world’s largest oil producer their production is extremely important. Russian production was down 39,000 bpd in August and it is down 318,000 barrels per day since peaking in October 2016.
157 responses to “OPEC August Crude Oil Production”
Small correction? Under first table, you state oil is down 79,100,000? I am sure you meant 79,100. Which is ok. If EIA can add a bunch of extra numbers, so we all can.
Thanks, fixed it.
Interesting to note that opec has increased their demand numbers for 2015,16 &17 whereas iea had lowered theirs. Not zure what is going on?
Venezuela contributes to:
11/9/2017
Peak oil in Latin America
http://crudeoilpeak.info/peak-oil-in-latin-america
Is the consumption peak in Latin America primarily a result of the commodity bust or are their other factors, such as fuel efficiency and greater use of renewables?
Fig 10 shows that Venezuela’s consumption went down (by around 200 kb/d since 2012) – the reasons are known.
Brazil’s liquids consumption is also down by around 200 kb/d, and not because of bio fuels, they are included in BP’s definition of consumption and have been between 530 and 590 kb/d since 2013.
Brazil entered a recession in 2015
“The country, the seventh-largest economy in the world, has seen economic growth fall sharply in recent times.
This is due in part to low commodity prices and sluggish global growth.
High interest rates – currently 14.25% – have also affected consumer spending, an important element of Brazil’s economy, while this year, the government has introduced stringent austerity measures designed to tackle high levels of debt.
Government spending, including on unemployment benefits, has fallen sharply, while taxes have risen.”
http://www.bbc.com/news/business-34088144
Thank you for the information.
Hmmm.
Brazil’s Central Bank just set their benchmark interest rate at a bit over 8%.
They’ve been in recession since 2015. Think about that for a moment and think about why or how that can happen with a Central Bank in control, as is true elsewhere.
That 8% interest rate is only 1% higher than their all-time low.
Now then we might ask what is the horrible inflation rate that would cause them to set interest rates at that level. The answer is 2.49%.
They hope to see 3.59% later this year. Sort of like everywhere.
There is text around saying things like government upheaval has prevented the economy from improving sooner. The text does not mean that a lack of government spending or lower regulation or policy adjustment has been impossible during upheaval. Rather it seems to mean that capitalism can’t work without government (CB) making it work. As if that’s a reality peculiar only to Brazil.
Just as a reminder, Brazil is the dominant provider of a number of different agricultural items to the entire world. They are also home to Embraer jet aircraft company.
This is no one-trick pony economy. Net oil importer. Population of bit over 200 million, growth rate just under 1%.
I go on and on about US shale, but have completely ignored Petrobras. 2.7 million BOEPD. $96 billion of debt. Share price all time high of $70, now $9. Losses in 2015 and 2016. Appears, however, growing production.
Massive reserves, but doesn’t look like they work at $40 oil either. Continues to amaze all the oil that continues to flow at a loss.
http://peakoilbarrel.com/brazil-reserves-and-production/
SS – I’m not sure Brazil have quite as many reserves as some think. I did a post, which I should update sometime, as above. They may have some potential resources but, also, maybe not a many as expected at one time. They have tried to get IOCs interested but it’s going really slowly and their seems to be opposing camps – whenever things seem to be moving forward there is a challenge through the courts e.g. witness recent delays in BP and Total getting exploration licenses in the Foz deAmazonas basin (partly environmental, but I think also partly objection to foreign impact).
The debt load, corruption issues and, of course, oil price have had big impacts there, but they had a lot of momentum with new FPSOs coming through (many on contracts tainted with corruption). They may also have problems at some time from shortage of drilling rigs as a few were cancelled when the oil price dropped.
Vague recall of several years ago. There was a story somewhere pointing out that the Brazil offshore activity was so far offshore that only one model of helicopter in the world had the range to get there and back, and safety regulations required range to get there and back not just range to get there, refuel on the rig and return.
There were only a handful of helicopters of that model that existed in the world at that time. It was a big obstruction that Petrobras faced in bringing those resources online.
As you know they keep producing to try to make less of of loss, at least they get some of their investment back, rather than a complete right off. Just waiting for oil prices to rise again.
Bloomberg: Seadrill Files for Bankruptcy in Effort to Shrink Debt Burden. Company expects to emerge from Chapter 11 in 6 to 9 months
https://www.bloomberg.com/news/articles/2017-09-12/seadrill-files-bankruptcy-to-shrink-offshore-driller-s-debt-load
Large companies work with their internal price forecasts, at $50 Petrobras can get positive cash flow from offshore fields.
Brazil entered a depression as a result of government corruption and mismanagement during the Lula and Rouseff administrations. Rouseff compounded the problem when she acted with congress and changed existing laws to expose Petrobras much more to offshore projects, and allowed the Lula period corruption to continue. This included the Odebrecht case which is tainting dozens of leaders in Latin America (including the Venezuelan Chavistas).
We did a similar analysis of Peak Oil in Latin America here (in Spanish): https://peakoilcolombia.wordpress.com/2017/07/23/bp-statistical-review-2016-i-el-declive-de-las-energias-fosiles-en-latinoamerica-y-caribe/
[…] OPEC August Crude Oil Production […]
Rough estimate: If peace holds in Libya and Nigeria, OPEC, in the short run, has upward room of about 1,5 million bpd. Downwards I count 0,5 million bpd. While in Venezuela I don’t expect any change soon, Libya seems to be in trouble again. The DAESH is back with a vengeance: https://sputniknews.com/middleeast/201709061057147928-daesh-libya-comeback/
So OPEC will probably hold their production more or less flat over the next months. I wonder if the November 2016 global all time peak holds till the end of the year. As Russia is seemingly not increasing its production and therefore outside the OPEC only the US might have some extra barrels up their sleeve, my guess is a timid “yes”.
Yes it looks like OPEC production could be at a high as long as the agreement holds…
2017-09-13 Nigeria agrees to join cuts deal when reaching 1.8 million b/day – Bloomberg
I wouldn’t assume Venezuela will hold production steady. Its better to assume it will decline at 10 % per year. Other countries will also continue gradual declines, because they can’t justify investing enough to stabilize production until prices hit around $65 per barrel. Long term trend should be a gradual tightening which makes prices increase, and I would expect price spikes as long as there’s no unusual wars to depress demand.
IEA Oil Market Report released for subscribers today…
Global oil supply fell by 720 kb/d in August due to unplanned outages and scheduled maintenance, mainly in non-OPEC countries. The first decline in four months cut supply to 97.7 mb/d. Compared to a year ago, output was up 1.2 mb/d as non-OPEC continued to show substantial growth. Ten non-OPEC countries cooperating with production cuts achieved more than 100% compliance for the first time.
(highlights only) https://www.iea.org/oilmarketreport/omrpublic/
Some chart highlights on Twitter
OECD commercial stocks unchanged at 3.016 bln bbls in July when they normally increase, says @IEA
https://pbs.twimg.com/media/DJl2BeVV4AAG_AR.jpg
Oil stocks in floating storage down 8 million barrels in July and 25 million in August, says @IEA
https://pbs.twimg.com/media/DJl4bPWUIAAmzKI.jpg
Interesting that the Middle East OPEC countries have significantly increased oil rigs since 2011, to have a pretty modest increase in production. I think that suggests mostly in-fill drilling and hence potentially increased depletion rates.
Also interesting how interest in Iraq seems to have tailed off over the last three years (probably as it was mostly being funded through IOCs rather than NOCs).
On the other hand offshore drilling, especially Angola and Nigeria, has taken a dive – which is almost certain to show up in production numbers about 3 to 6 years later.
Hi George
Replied to you on your previous post.
Saw it, thanks for the info.
I don’t think Iraq is financially lucrative as it should be, if production costs were the only factor.
Genel Energy PLC produces oil in Kurdistan. Share price is off over 90%. Have lost quite a bit per share.
China, this sounds like the start of a fundamental change in smog prevention…
DONGYING, China (Reuters) – China’s crackdown on pollution is cutting output of chemicals, fuels and other materials in Shandong province as plants curb or cut operations amid random environmental checks.
Semi-official China Petroleum and Chemical Industry Federation reported last month, citing local media, that provincial inspectors had visited 1,891 plants by July 19 and that 43 percent of them had environmental violations.
The Ministry of Environmental Protection (MEP) said this month China was still facing “huge pressure” to meet politically crucial 2017 air quality targets.
The shutdowns at some chemical plants may be permanent as upgrade costs would render them unable to compete with imports, said IHS’s Chen.
https://www.reuters.com/article/us-china-environment-shandong/chinas-war-on-smog-chokes-shandong-industries-smokes-out-fuel-kiosks-idUSKCN1BO0BO
reposting re: North Korea resources:
Google Earth North Korea. The cities. The roads.
This is not some backward place. And I’m suspicious of how the leader has been demonized — for 20 yrs or whatever. He died just a few yrs ago. This is his son now. Not even the same guy, but the labels have stayed the same.
KSA has no significant elections. Nor does Kuwait or UAE. So how NK is run should not be on the table.
Want to read something interesting ppl? Start googling North Korea uranium mining. You really want them to ship some to ISIS? If you sanction them, why should they not?
“If you sanction them, why should they not?” Good point. Of course the US needs an enemy (military-industrial complex and all) but choosing one with a bunch of nukes (rumour says 60) that have a ready market in the Mid-east may not be the smartest idea.
Off topic, but excusable?
Ron – I beleive that the last I heard, you had moved to Florida. So, I am kind of surprised to see your post [you must have electricity], and I do hope that it indicates that you escaped major hurricane damage. If you do have “eyes on the ground” there, what is your first hand opinion of how difficult [or easy] the recovery will be?
I live in Pensacola, in the panhandle. The Alabama border is just about 15 miles due east of my house. We got virtually nothing from Irma, no wind and no rain.
The recovery, for those that got hit by the brunt of the storm, will be very difficult and take a very long time. And it will cost a lot of money.
That is good news. On the other hand, I would like to note that I would be devastated if I lost my wife of over 50 years [ so, I am sorry for your loss]. Among many other defects, I am completely handicapped when it comes to directions; she totally is in charge when we are on vacation. So I am able to relate – Please do not head due east to get to Alabama.
Ron, it all depends on the quality of the housing and infrastructure. I’ve had houses in areas struck by hurricanes, in all cases got power back in about 10 days, and all downed trees and branches were removed by 2 weeks. In one case a neighbor’s tree struck my roof as it came down, so we hired a guy with a chain saw to chop it up, put a portable swimming pool plastic liner over the hole, and about one month later the roof was fixed.
The key is to have a house fit por purpose, and if you are close to the beach better get roof anchors. Even better is to have an old house made with cement blocks or poured concrete (my Fort Lauderdale house is poured concrete, goes through hurricanes just fine).
One guy I know put large straps (the ones used to secure loads on large trucks) over his house, and anchored them with steel pins driven deep into his lawn or placed in holes he made in his driveway. I haven’t estimated the loads, but it seems to be a reasonable patch for houses with weak roofs.
Equatorial Guinea, historical crude oil production data is available from the EIA’s STEO, if that’s of any use?
https://www.eia.gov/outlooks/steo/query/
Hello All,
I haven’t been around for awhile, but I just saw these interesting numbers on Bentekenergy, I thought I would share with you all.
http://bentekenergy.com/
Sample Haynesville production reaching four year highs
Wednesday, September 13, 2017 – 5:46 AM
Sample Haynesville production has climbed to levels not seen in four years, after reaching up to 3.7 Bcf/d on September 1, suggesting that a resurgence of production may be underway in the Southeast. The Haynesville production sample has averaged 3.5 Bcf/d since September 1, compared to 3.3 Bcf/d in August, as well as 2.6 Bcf/d in the same period in 2016, with recent gains accounted for by two pipelines in the basin. Receipts on Enable are up by 123 MMcf/d month over month, while TGP has risen over 80 MMcf/d. Sample production last averaged this high in July 2013, and was on a swift decline at that time from the initial drilling boom in the basin. This resurgence has already led to over 0.8 Bcf/d of growth in average sample production since January 2017. Platts Analytics estimates Haynesville production averaged 4.0 Bcf/d in August, and projections reach 4.6 Bcf/d by December 2017 and 5.4 Bcf/d by December 2018.
I believe the reports of the demise of the Haynesville, have been grossly exaggerated.
I am not sure if the quotes of the day were, that the Haynesville required $4.50 or $6, but I do know is wasn’t $3mcf
Push
Great to hear from you and I hope things are going well.
One of the things happening in the Haynesville area is the recent targeting of the somewhat shallower Cotton Valley formation.
Range bought out a local outfit and they, along with Chesapeake and others, are ramping up production.
The recent USGS pegged the Technically Recoverable Resource for the Haynesville/Bossier formation at 300 Tcf, making it the largest area by far, although the Marcellus’ estimate is outdated.
Other day, Texas Tea mentioned Chesapeake Marcellus well flowing 61 MMcfd 24 hour IP,
Turns out the well, McGavin 6, has been flowing over 30 days on restricted choke at 55MMcfd.
D &C cost said to be $8 1/2 million.
Lottsa gas in the Appalachian Basin.
Thanks Coffee,
It appears they are certainly getting some big early flows from these gas wells. If these flows can be maintained without going into free fall, there is going to be a lot of gas around. Now they just need to get the pipelines built. Which should be coming shortly.
I have always been more confident of the shale gas producing, but not so sure of the shale oil, but time will tell on that one.
EIA twip: overall stocks down 5.7 mmbbls (o.7%), crude up 5.9, gasoline down 8.4 (3.8%), distillate down 3.2 (2.2%). Overall decline is similar to previous weeks, maybe a bit higher so supply disruption looks like is bigger than any demand decline, but the loss of refining capacity has changed the ratios, plus maybe a lot of cars being topped up in Florida, which will reverse in the next couple of weeks.
George
You might find this of interest.
Hurricane Energy plc, the UK based oil and gas company focused on hydrocarbon resources in naturally fractured basement reservoirs, is pleased to provide an operational update on the Lancaster Early Production System (“EPS”).
Highlights
· Lancaster EPS remains on schedule for first oil in 1H 2019
· Hurricane has taken the Final Investment Decision on the development of the Lancaster Early Production System
· Agreements now effective with Bluewater Energy Services for upgrade, lease and operation of the ‘Aoka Mizu’ FPSO vessel
· ‘Aoka Mizu’ now on tow to Dubai for upgrade work
· Rig contract signed with Transocean to complete already drilled EPS production wells
· Fabrication orders placed with TechnipFMC for SURF and SPS
· Development and Production regulatory approval expected shortly
Following completion of the equity placing and convertible bond offering announced in June 2017 (the “Fundraising”), Hurricane and its key contractors have proceeded with procurement, fabrication and contracting activities related to the EPS on the Lancaster field. The Company, now fully-funded to reach first oil, remains on track for first oil in 1H 2019.
FPSO Aoka Mizu contract awarded to Bluewater
On 14 August 2017, key contracts between Bluewater Energy Services and the Company outlining terms for the upgrade, lease and operation of the FPSO vessel, ‘Aoka Mizu’, and associated agreements, became effective in accordance with their terms. These agreements had previously been executed on 23 June 2017. The vessel left Gdansk on 27 July 2017 and is currently on tow to Dubai, where its upgrade is planned to be undertaken. It is expected to arrive by early October. The mooring buoy is also being fabricated in Dubai, where work has commenced.
Rig contract awarded to Transocean
The Company has entered into a contract with Transocean for the Paul B. Loyd Jr. semi-submersible drilling rig to complete the previously drilled Lancaster 205/21a-6 and 205/21a-7Z horizontal production wells, commencing 2Q 2018.
SURF and SPS contract awarded to TechnipFMC
TechnipFMC has commenced procurement and fabrication of the main subsea components of the development including subsea umbilical, risers and flowlines “SURF” and subsea production system “SPS”. Subsea installation activities at Lancaster are scheduled for summer 2018, in advance of the planned arrival of the ‘Aoka Mizu’.
A TechnipFMC vessel has recently completed a further seabed survey as part of the planning process for boulder clearance around the area planned for SURF installation.
The Company is making good progress with the regulatory authorities in relation to the approval of Company’s Field Development Plan (“FDP”) and associated consents and permits for the Lancaster EPS development. Approval is expected shortly, with no impact to overall project schedule anticipated.
Shell is third western IOC after ExxonMobil and Statoil to pull out (or get kicked out) of a major production deal in Iraq:
EXCLUSIVE: SHELL TO WITHDRAW FROM IRAQ’S MAJNOON OILFIELD – IRAQI OIL OFFICIALS
https://www.reuters.com/article/us-iraq-oil-shell/exclusive-shell-to-withdraw-from-iraqs-majnoon-oilfield-iraqi-oil-officials-idUSKCN1BN2XW
http://www.epmag.com/shell-focuses-basrah-gas-iraq-after-majnoon-exit-1657311#p=full
There is no way Iraq’s production is going to suddenly jump up significantly to replace declines elsewhere in the next five years.
Jamaica moving ahead with (L)NG!
Natural gas conference not limited to energy
Jamaica’s inaugural natural gas conference won’t be confined to just energy as professionals in other fields required by the new industry will also stand to benefit, according to Camille Taylor, manager of corporate communications, the Petroleum Corporation of Jamaica (PCJ).
“The industry is going to need legal services, persons in taxation, management services, logistics, finance, and manufacturers, which is a very big target group, so it really is open to all,” Taylor told The Gleaner on Tuesday during an Editors’ Forum at the company’s North Street base.
Taylor’s disclosure comes just a few weeks before Jamaica’s inaugural gas conference, slated for October 4 – 6, at The Jamaica Pegasus hotel in New Kingston.
The conference, a synergy between the PCJ and the Office of Utilities Regulation, seeks to provide a forum to discuss the opportunities, benefits, and implications of the introduction of natural gas into Jamaica’s energy mix.
The agenda for the conference has been developed in three broad sections, namely, the global natural gas sector; the local supply scenario; and finance, governance, and regulation.
“Participants will learn about how they can best position themselves or organisation to take advantage of the opportunities in the new industry. We will be providing a space where more experienced energy professionals in the industry can gather and give in-depth analysis of the international natural gas industry, but we also want to look at the local nuances of developing natural gas in Jamaica,” Taylor added.
In 2015, the United States-based New Forrest Energy signed a 20-year supply deal with the Jamaica Public Service (JPS), investing US$750 million into the construction of the liquefied natural gas (LNG) terminal.
UWI to build own LNG power plant
The University of West Indies, Mona (UWI) will set up and operate a 7 megawatt liquefied natural gas (LNG) facility, which is projected to shave off up to $350 million annually from the campus’ energy costs.
Those savings equate to around half of the campus’ energy bill, said head of the electroncs unit, Dr Paul Aiken.
“Energy costs are the second-highest costs to the UWI, followed by salaries, and we can’t do anything about salaries but we can add LNG,” said Aiken at a Gleaner Editors’ Forum on Tuesday, while making the wider point that the campus wants to reduce its expenses in order to better offset the rising cost of student tuition.
The project will allow UWI Mona to become independent of power provider Jamaica Public Service Company.
UWI, Mona selected American company New Fortress Energy as LNG supplier for its plant from a field of two other regional contenders.
“The capital to do the project will be somewhere in the single digit millions, in the region of US$7 million, but we are trying to get it down to US$6 million,” said Aiken following the forum. Those prices translate to around $800 million to $900 million in local currency.
The university expects to sign an agreement with New Fortress around October, after which it will purchase and install five General Electric engines to drive its power plant.
The plant will run on LNG, with liquid petroleum gas or LPG as back-up, and is due for commissioning by July 2018.
Under the partnership with New Fortress, the energy company will provide grants and scholarships and assist in training more than 100 electrical power engineering students, according to UWI. The number of those students is expected to increase to over 300 in the next two years, with the Government of Jamaica and the University’s goal to dramatically increase the total number of graduating engineers to over 1,000 per year. GE will also provide training to students, UWI said.
I am not too thrilled that my island is replacing one imported, non renewable fuel, with another. Having been a reader of this blog and before it The Oil Drum ( http://www.theoildrum.com ) I am all too aware of the uncertain future of NG markets. IMO NG is unlikely to remain as cheap as it is, with increasing use of the fuel in one of it’s main producers (the US) for electricity generation and transport likely to increase demand while low prices provide no incentive to increase production or even to continue extract as much as possible from existing sources). Once the plants and other infrastructure are built, the users will have little choice but to buy the fuel at almost any price, at least until the plants and infrastructure become due for replacement, that is, for at least 30 years.
Sorry about the broken link above guys. I thought I had fixed it. Here it is:
http://jamaica-gleaner.com/article/lead-stories/20170914/natural-gas-conference-not-limited-energy
Islandboy
Just wrote a lengthy response and accidentally erased it.
In a nutshell, check out micro grids, distributed generation,
GE, Siemens and Wartsila for the wide array of hardware for these purposes.
New York state, Denton Texas implementing micro grids along with many colleges.
FPSO/FLNG/FSRU plants that are ships that can store/regassify supply, sometimes on a temporary basis.
Solar meshes somewhat well with this type of reliable, economic, dispatchable supply.
Propane (LPG – Liquified Petroleum Gas) is more becoming the preferred backup fuel over diesel.
Supply should be plentiful and low cost for the foreseeable future.
South Pars/North Dome, Gorgon, Appalachian Basin, Russia, Fuling, Vaca Muerta are only a fraction of the gaseous resources on the planet.
Hi coffeeguyz,
And your estimate for natural gas URR?
It is not unlimited. It is doubtful resources will remain cheap after 2030.
As wind and solar become cheaper economically recoverable resources will become smaller.
Methane from shale and conventional may not be unlimited, but recovering landfill gas sure might might qualify as renewable.
URR is always unknown, but with 100 year old gas wells still producing in Pennsylvania, the economics along with amazing supply will provide bokoo product for many decades to come.
Slightly different topic, I’ve been pretty much tearing into the economics of solar/wind production along with EV sales.
You guys are apt to be shocked if Denmark’s, Hong Kong’s and Georgia’s experiences with end-of-subsidies plays out more globally.
Ditto regarding ITCs, PTCs, and mandatory purchasing from renewable sources as both federal and state incentives wither away.
It’s already happening and, frankly, even a sceptic such as myself was surprised at how shaky the solar/wind financial situation is.
You all constantly chide readers to be wary of oil/gas industry ‘spin’ in their communications.
Fair enough, but that goes likewise with the pronouncements from the renewable sector.
One big reason for wind build out is the time window on the ITCs.
Check it out.
Hi Coffeeguyzz,
I look at government research not industry hype. So just as I think USGS estimates are likely to be more reasonable than investor presentations, I use government research on wind and solar to evaluate it’s prospects.
I don’t pay attention to renewable advocates or oil and gas companies that have something to sell and will sell you swampland or the Brooklyn Bridge.
For US solar see
https://energy.gov/eere/sunshot/photovoltaics
For US wind see
https://energy.gov/eere/wind/downloads/2015-wind-technologies-market-report
There are international reports by some investment firms.
If natural gas is nearly unlimited as you seem to believe, then wind and solar may not be able to compete, I believe that my estimates of World Natural Gas URR are reasonable (see also work by Steve Mohr) and natural gas prices will rise by 2030 or sooner.
See http://peakoilbarrel.com/world-natural-gas-shock-model/
Case A URR=13,000 TCF
Case B URR=19,000 TCF
Case C URR=26,000 TCF
The peak for case B is about 2037, but slower growth rates in output around 2030 will lead to a rise in Natural gas prices.
I agree we do not know the URR, which is why I asked for an estimate.
EIA International Energy Outlook 2017: https://www.eia.gov/outlooks/ieo/
The only part that interested me was the huge difference in oil price assumptions (from approx. $30 to 140/brl in 2020). Probably same as used in AEO..?
Predicts oil and other liquids consumption goes from 95 million in 2015 to 104 million in 2030
This seems pessimistic to me. I think I just read where 100 million BOPD demand is projected to hit in 2019. Also, thought I just read 2017 demand growth estimate was increased to 1.6 million BOPD.
The report implies 600 thousand annual BOPD demand growth to 2030? Seems low, or am I making an error(S)?
Depends on oil prices and supply.
I think from a supply perspectiive they are too optimistic.
C+C will be under 85 Mb/d.
True. Think demand slumped below 1 million yoy growth in 2014 after 4 years of $90+ WTI and much higher Brent.
Just looked at Brent chart from that era. Rarely below $100, mostly $110-120.
Hi shallow sand,
Solar wind and evs may expand rapidly and by 2030 demand growth will be smaller so prices might be low due to lack of demand which may reduce supply as prices go down.
Dennis. Also a possibility.
EV oil demand destruction is a real wildcard.
I just hardly see any EV’s, even on the interstates and in the cities, but I also live in the middle, and it seems EV’s are seen much more on the West Coast.
But, it does appear governments are mandating them. So transition could be quicker than originally thought. Hard to say.
I did read that Tesla just installed its first charging center in downtown Chicago. Can charge 10 cars at a time. A full charge takes 50 minutes.
Going to have to build a ton of those. I have to drive up there some to visit family. Insane the number of ICE vehicles I see when I do that. For the first time ever, I saw a Tesla on I57. Had seen a handful on the Dan Ryan, Kennedy, Ike and Jane Addams tollway.
Funny thing, the Tesla Model S I saw on 57 was traveling about 45 mph. Trying to conserve charge I assume?
Hi shallow sand,
Market penetration is small, but with Bolt and tesla model 3 and others down the road things may change quickly.
I may be too optimistic. We will see.
The nowadays electric cars are more for technic freaks and kind of toys.
But verions 2.0 seems to be really around the corner with solid state batteries.
Then a Tesla with the same size battery pack will have double to tripple range as now – or can go the 300 miles on high speed.
Or the cheap commuter car with a range as a today bolt will be possible when the battery pack for a 200 mile car is under 200 KG.
This will change game, it will take time to ramp up production capacities, mining, loading facilities but the next 10 years will be interesting. But oil demand in 2030 isn’t possible to forecast because of this development.
In any case this is necessary – there isn’t enough oil spare capacity to develop Africa and other parts of Asia on oil base. Another 20 mb/day additional aren’t really possible.
It seems they are assuming the Paris agreement doesn’t have much effect, by that weren’t we supposed to be reducing emissions at an accelerating rate after 2020. They also seem to be assuming we start finding a lot of oil suddenly, despite success rate over the last couple of months being just about zero, and/or all the XH oil in Canada and Venezuela suddenly gets developed with development times on huge projects being reduced to about one year (by 2040 almost all current offshore production and any coming on line in the next couple of years will be finished and all the mature onshore supergiants will be in the superannuated class, more infill drilling or artificial lift just won’t work to maintain production).
I think that EIA only use an econometric demand side model, i.e. they show how much oil that is needed to maintain something that is structurally similar to BAU and assume that the oil will be there. Last year’s edition of IEA’s WEO contained a long term demand projection and a medium term supply forecast. This shows the infamous gap starting in approx. 2019/20. It will be interesting to see if IEA will update their supply forecast in this year’s edition. It will be released on Nov 14th.
Yet presumably somewhere at least a portion of TPTB is making decisions based on what the EIA come up with, otherwise why does it exist? And won’t the policies that come from Paris, if any do, have to act on the demand side first?
I plotted CO2 emissions based on the EIA reference case using factors for industrial coal, nat. gas and gasoline (as an average, probably a bit low though) from the UK government EPA equivalent and assuming 50% of the CO2 stays in the atmosphere. The trajectory is slightly higher than the RCP4.5 case (which in the early years is actually higher than RCP6).
With recent findings of permafrost melt, releases from soils, wildfires and possibly reduction in ocean sink efficiency the real curve would likely be much closer to RCP8.5. I think the EIA natural gas numbers might be close, but I can’t see where they get all the oil they are assuming, so to meet the energy demand they use would require more coal or XH oil (with consequentially higher emissions) or a much faster build out of renewables.
Hi George,
This would be better on the other thread. I doubt the EIA’s scenario will prove correct. Prices will rise and there will be a transition away from oil and coal to natural gas and renewables. Fossil fuel use will probably peak around 2035 due to depletion and ramp up of alternatives as fossil fuel prices rise.
Have to go back and look it up. My recall is SEC impairment evaluations are 2X per year, end of 1st qrter and end of 3rd.
China’s domestic crude oil output fell 3.1 percent last month from a year ago to 15.96 million tonnes, or 3.76 million bpd.
https://uk.reuters.com/article/china-economy-output-oil/update-1-chinas-crude-refinery-output-rebounds-in-aug-on-new-quotas-idUKL4N1LU2T7
How earthquakes in Oklahoma might screw up our oil supply.
http://www.politico.com/magazine/story/2017/09/14/earthquakes-oil-us-economy-fracking-215602
They need to change Oklahoma water disposal regulations. If necessary they will have to build a large water line to a region where thick high porosity acquifers are able to take huge amounts of salt water.
25 million commute to work 45 minutes or more, 4 million commute to work 1 hr and a half, one way, in US. Wow! Just heard that on Bloomberg.
Mike
If you are around this is the latest update on the HRZ shale well Alaska.
The Icewine#2 well was shut-in on 10th July to allow for imbibition and pressure build up to occur within the HRZ shale. Flow testing re-commenced on 31st August at 10:26 (AK time), and is ongoing. Results since flow testing recommenced are summarised below.
The Icewine#2 well is located on the North Slope of Alaska (ADL 392301). 88 Energy Ltd (via its wholly owned subsidiary, Accumulate Energy Alaska, Inc) has a 77.55% working interest in the well. The well was stimulated in two stages over a gross 128 foot vertical interval in the HRZ shale formation, from 10,957-11,085ft TVD, using a slickwater treatment comprising 27,837 barrels of fluid and 1,034,838 pounds of proppant.
The well was initially flowed back on a 6/64 inch choke and was reduced to a 4/64 inch choke after 26 hours to maintain pressure. Approximately 370 barrels of frac fluid had been recovered as at 1730 on 3rd September (AK time) at an average rate of 100 barrels per day. The choke was subsequently stepped up to 8/64 inch at 1800 10th September (AK time) as the overall declining pressure gradient versus time improved, indicating potential pressure support. To date, the cumulative amount of stimulation fluid produced from both testing periods is 5,277 barrels, 19.0% of fluids injected.
Wellhead pressure built to ~3,500psi during shut-in and has dropped to 106psi since flowback commenced and is now declining very slowly with a relatively constant flowback rate of 55 barrels per day. At 0930 9th September (AK time), a decision was made to run the flowback through the test separator due to minor gas indications being evident. To date the rate of flow has been unstabilised at between 2 and 4 mcf per day made up of 76% hydrocarbons, 20% atmospheric gases and 4% inorganics. The produced hydrocarbons comprise 93% methane with 7% heavier fractions.
The current flowback procedure remains early stage with only 19.0% of the frac fluid retrieved. The gas observed so far is not considered representative of the potential rate or composition of hydrocarbon in the reservoir. It is interpreted that additional frac fluid needs to be removed in order to achieve a representative result. A decision will be made on the most appropriate strategy to accomplish this within the next two weeks.
North dakota numbers are out. 15 kbpd increase over june
Looks like the wells are at 75 BOPD, including non-Bakken/TFS wells. 66 BOPD if all of the inactive wells are included. One can make money operating these wells, the problem is that many of them have not come close to payout yet.
Parshall 2 confidential wells, 521 non-confidential wells, non-confidential averaging 45,652 BOPD for July, 2017. 88 BOPD per well.
Alger zero confidential wells, 327 total wells averaging 17,459 BOPD for July, 2017. 53 BOPD per well.
Sanish 5 confidential wells, 615 non-confidential wells averaging 37,526 BOPD for July, 2017 61 BOPD per well.
The Bakken has gotten very boring, it appears. Just 5-10 years ago these fields were the hottest of the hot in all shale plays.
I suspect there is a lot of money to be made operating Bakken “strippers” at some point in the future assuming they can be bought cheap and assuming oil someday returns to 2011-2014 levels.
48-60K wells total is what I read, so still many more to be drilled over the next 10-20 years, again, if prices rebound substantially.
Hi Shallow sands,
I have seen estimates for total wells drilled from 30,000 to 60,000. My guess is no more than 45,000 and there will only be that many with very high oil prices (above $120/b in 2017$). The USGS median TRR estimate with decreasing EUR over time matches pretty well with about 42,000 wells, but how many of those wells will be profitable will depend on future oil prices, taxes, royalties, transportation costs, and interest rates.
In short, any guesses are highly speculative.
Question:. The output of a shale well will be water and oil (easily separated at the wellsite), gas and NGLs.
Some years ago when rail cars were exploding there was considerable question as to the content of those cars.
Where are the NGLs separated from the oil?
Ancillary: Has anyone ever correlated North Dakota tax revenue with quoted production? NGL would yield less money and less tax revenue and get reported barrel for barrel?
NGLs go with the gas and are separated out at a gas plant. I think the problems with the rail cars was that there were still a lot of light gas components left in the oil becasue there is only a single stage separation, with no heating, at the well site.
Hmmm, but these Bakken well sites are often remote. No pipelines. They have an on site tank for water and one for oil. A truck comes and empties the tanks periodically.
Lotsa gas is flared.
How do the NGLs get separated from the oil liquid on site? Does it not just go into the same tank as the oil? Don’t think there was ever talk of separate NGL tanks on site. We do have that upward API number creep for the Bakken liquids.
If the gas is flared the NGLs are flared with it.
Did some reading on oil / gas separator gizmos, as delineated from oil / water separator.
The NGLs are only liquid under pressure or cooled down, so that’s not going to happen at remote NoDak wellsites. So they are going to flow in any capture pipelines for gas (or flare, as you said), and they probably will gravity separate at the site so this is no problem.
However.
Condensate is going to be in the oil tanker truck that drains the oil tank.
Condensate comes from gas wells not oil wells. What would be left in an oil truck would be oil, but I think they are quite careful to drain everything.
Operating a stripper horizontal ought to be a challenge. I wouldn’t buy one until I check the directional survey, because it’s bound to have serious problems lifting the oil to the surface, and artificial lift for kinky wells can be excruciatingly painful.
Art Berman has a new presentation up:
http://www.artberman.com/houston-geological-society-presentation-11-september-2017/
Hi,
Here are my Bakken updates.
The most noticeable changes in the production graph since last month is another big increase for the 2008 wells. Also another big drop for 2015 which now has reached the 2014 curve.
2016 is not visible here, but production is currently about 50% higher than previous years. They have been completing a lot of wells in the sweet spot areas in McKensey were the well densities are still not so high. 2017 looks very good so far too so I think those years can turn out to be quite good.
Water cut shows a big increase for 2008. Must be fracking water irrespective of it´s re-frack or from fracking close by wells.
Never looked closely before but the 2007 wells seem to be 25 bpd with a water cut of 35% or about 9 bpd.
That’s well head of about $20/b (? incl royalty and taxes?) so $500 per day oil revs.
http://bismarcktribune.com/bakken/breakout/managing-bakken-wastewater/article_41f4c1e8-18d5-11e4-98a0-0019bb2963f4.html
That quotes water collection/transport of $8/barrel plus an additional disposal fee.
$72/day plus disposal fee. (factoid bakken produced water is 10X saltier than seawater)
Hard to find data on disposal fee. One article said 5 cents per gallon since 1990s. That’s $2.10/barrel and 9 bpd so $19/day for that well in the 1990s.
So maybe $100/day in water costs for a 25 bopd well.
Watcher, in the Permian water disposal is between $0.50-$1.00 per bbl. depending upon whether it is in-house or vendor service.
Good data. The 5 cents a gallon was Bakken and part of some court case.
Do you have an estimate of how many acres of core area (or sweet spots) there is still available without producing wells on it and/or without active permits or DUCs?
Hi George
A Verbier update just out.
Jersey Oil & Gas (AIM: JOG), an independent upstream oil and gas company focused on the UK Continental Shelf (“UKCS”) region of the North Sea, announces that, further to the Company’s announcement of 11 September 2017, the wireline log data from the initial exploration well, received late on 12 September 2017, has now been evaluated by the P.2170 Joint Venture partnership led by the operator Statoil (U.K.) Limited (“Statoil”). Indications of the potential for hydrocarbons to be present in a smaller accumulation up dip of the 20/05b-13 Verbier exploration well cannot be ruled out. Accordingly, over the weekend, agreement was reached by the P.2170 Joint Venture partners to target this resource with a sidetrack exploration well. All necessary approvals have been received and operations have now commenced.
Taking into account JOG’s carry position in relation to the P.2170 licence, it is currently expected that JOG’s net cost liability for this sidetrack will be approximately £0.7m, which will be satisfied from the Company’s existing cash reserves and forecast receipts. Drilling of the 20/05b-13Z sidetrack exploration well is expected to take between 25 to 35 days and a further announcement will be made in due course as appropriate.
No I don´t have those details. But looking at the GIS map server there are perhaps around 600 sections of sweet spots in McKensey. Grail has close to 5 wells per section and 2016 has been worse than previous years. About 3000 wells in the sweet spots area to reach Grail well density. About half of those have already been drilled. 40 wells per month gives us about 3 years. But that is the upper limit before the wells start to show noticeably worse performance.
Hi Freddy W,
Thanks. Enno Peters has not done the update for the most recent month, but last month’s update suggests that after 12 months the average 2015 well had fallen to the output level of 2013 and 2014 wells. So output is high early, but decline rates are also higher and the cumulative output after month 13 may be similar to 2013 and 2014 wells and after 24 months all wells (2008-2016) may have similar cumulative output. If this is correct, then 2016 wells have an EUR of roughly 18% higher than the average 2008-2012 North Dakota Bakken/Three Forks well (about 420 kb vs 350 kb of crude plus condensate).
Hi Freddy W,
From last months shaleprofile.com update. At month 7 the average 2016 well was about 340 kb/d and the average 2012 well was about 193 kb/d, so about 76% higher output at month 7, but this month may have fallen to 50%, one needs to be careful not to assume that overall EUR has also risen by a similar amount.
I note that you have neither said non implied as much, but those not familiar with the data might make such an assumption. Probably EUR has increased much less than 50%, perhaps 20% at most for the average 2016 well, too early to judge 2017 wells in my opinion.
Hi Dennis,
Yes maybe I should have been clearer. I did not mean that EUR is 50% higher. I have attached the production profiles bellow. There 2017 is 40% higher than 2014 in both months 2 and 7. 2014 have had higher decline rates than earlier years. So the decline rate is high for 2016. But we only have complete data until month 7, so EUR is uncertain.
Hi Freddy W,
For those 2016 wells (from first two quarter of 2016), that we have complete data for (336 wells), the average output as of last month was only 12% higher in the first half of 2016 compared with 2015 (199 kb/d vs 177 kb/d average output in month 12 based on last month’s data from Enno Peters).
What we seem to see is higher output in the early months (first 12 to 24 months) and then similar output thereafter for the data we have so far, in fact we may see lower output in later months for the higher output wells as was the case for 2010 to 2012 compared to 2008 and 2009 after month 60.
The NDIC seems to assume that the shape of the well profile is fixed and that the well profile can be estimated based on the first 3 months of output.
Based on the history we have so far their assumption is incorrect.
This is how the NDIC comes up with well profiles of 800 kb or even 1000 kb, they are off by a factor of 3 for the average well. An estimate of 350 kb to 420 kb is far more reasonable and it is doubtful that many these wells will be producing after 45 years as the NDIC assumes. Probably more like 20 to 25 years at most with an economic cutoff of 5 to 10 b/d (depending on the oil price).
Yes I agree. Your estimate seems more realistic. I have not looked at the first 6 months, but the first 3 months you can see in the graph. Note that the first 3 months of 2016 is similar to 2015. So it may be better to look at months 4-6 to see what the curve may look like 6 months ahead.
The GOR increase shows signs of slowing down or reversing for many of the curves. I don´t know if it´s because of take away capacity as the directors cut mentions “The expansion of gas gathering from south of Lake Sakakawea” every months, or if it´s depletion related. GOR for 2016 continue to increase fast though.
FYI ALL, the way to make sense of these graphs is click them, that puts them alone on the screen. Then cntl Shift +, cntl Shift +. Zooms them. Freddy’s text is high rez and the cntl Shift + makes the colored lines readable with the text remaining readable.
Thanks Watcher.
I’m still looking at the increase in the production of NGLs compared to the increase in total liquids. Statistics Canada
Q2 Canadian Capex https://pbs.twimg.com/media/DJ1UpghW4AA6F0Z.jpg
Canadian capital spending for 2017 is estimated to be $30 billion and cash flow is estimated to be $17 billion. Investors gambling on higher oil prices…
2017-09-13 Financial Post – Peter Tertzakian (ARC Energy Research)
Spending More Than You Make, But Less So in 2018
Where does the money for drilling, completion and tying in new production come from? Answer: cash flow from operations; asset sales; plus outside sources of investment capital. Until recently, it’s been a lot of the latter.
Last year, in 2016, when oil prices were really low, the upstream Canadian oil and gas industry (excluding the oil sands) spent almost twice as much as it took in. This amplified spending in excess of cash generation was possible thanks to capital providers who believed in price recovery.
This year, 2017, is still torqued to outside investment. Capital spending (an estimated $30 billion) is expected to represent a reinvestment ratio of 1.7x in excess of cash flow (an estimated $17 billion).
http://business.financialpost.com/commodities/energy/investor-indifference-and-constrained-output-may-be-a-recipe-for-higher-oil-prices
http://www.zerohedge.com/news/2017-09-17/algeria-officially-launches-helicopter-money-amid-sliding-oil-revenue-budget-crisis
Well, well, well.
“On Sunday, Algeria’s prime minister unveiled a plan to plug the country’s budget deficit as the the OPEC member state looks to offset lower oil revenue by directly borrowing from the central bank, while avoiding international debt markets.”
Later on conventional thinking:
“The biggest risk, of course, is hyperinflation because without deep asset markets to “sterilize” the liquidity injections, the money will flood the local economy sending prices of goods and services sky high. It will also crush the Algerian Dinar. Combined with current import restrictions, “the central bank financing the fiscal deficit will stoke inflation and depreciate the currency,” Eurasia Group’s senior analyst for the Middle East and North Africa, Riccardo Fabiani, wrote in a recent report.
And then, from the comments:
Hyperinflation . . . “This has not happened in Japan, with their Central Bank buying nearly every asset it can find.”
Absolutely correct.
Nor, btw the US or EU.
[…] above graph, taken from the “OPEC August Crude Oil Production” post at the Peak Oil Barrel blog, shows total oil production, in thousands of barrels per day, for the 13 members of OPEC, for the […]
Houston (Platts)–15 Sep 2017 – Eagle Ford Shale’s big operators getting output back to pre-Harvey levels. Platts now estimates September Eagle Ford production at 1.273 million b/d of oil and 4.896 Bcf/d of natural gas.
https://www.platts.com/latest-news/oil/houston/eagle-ford-shales-big-operators-getting-output-21971820
US imports – there are millions of barrels more than average waiting offshore USA due to delays caused by the hurricanes
Chart on Twitter: https://pbs.twimg.com/media/DKAfK_aWAAEIeDw.jpg
Data from the free tanker tracking statistics website: http://TankerTrackers.com
“I just don’t see the promise of a resurgence in 2019 oil production that will surpass the 2015 peak in world oil production”
http://oilprice.com/Energy/Crude-Oil/Peak-Oil-Production-Is-Still-Years-Away.html
So Ron did oil production peak in 2015?
http://www.opec.org/opec_web/static_files_project/media/downloads/publications/MOMR_December_2015.pdf
http://www.opec.org/opec_web/static_files_project/media/downloads/publications/MOMR%20September%202017.pdf
Dpr is out. Eagle ford numbers look schocking, both new production/rig and alzo legacy decline. What is going on? Trend from before continues so does not seem harvey related
Maybe this will help. The July preliminary Texas RRC numbers are out. C and C equals 83,954,201 for the month. What’s that mean? Much ado has been made on the board of who is correct in projecting actual Texas production from the initial Texas production. The runners up are EIA and Dean. Time cures all, and if you look at October 2016 actual, RRC has 3,113k a day, while EIA has 3172. Of course, EIA cheats by constantly revising the numbers, but let’s take their 3172 number, because that is what we can use for June or July Texas production. October 2016 initial production showed 83,182,376. June 2017 initial production was 84,017,218, and July’s is 83,954,201. So, if we substitute 3172 in EIA figures for monthly production by state for June, we get 8823k for a probable US production. As July is basically unchanged, US production for July will show about the same. Meaning that EIA is over estimating production by about 600k a day. August production and September production will be down, because of the shut in of wells during Harvey. There is no surprise here, we are not completing what we did in years past, so the decline is bound to be there.
Probably the most significant numbers are the following total of oil well completions per month through August of each year per the RRC site:
2013. 13,062
2014. 17,767
2015. 11,723
2016. 6,166
2017. 3,917
I think it’s amazing that production is holding up this well.
Here are my workings so far, still working on it 🙂
Texas RRC crude & condensates production
I’m missing some initial numbers but the last 6 months is on the chart.
Unless the correction factor has increased in the last couple of months (I don’t see why it should), then Texas production is back down this month.
(I haven’t done any statistical work on the correction factor, picked 500kb/d because it looked about right)
When production is the approximately the same as Oct 2016, you don’t need correction factors. Use final numbers for oct. no brainer.
Looks about right, though. Looked at it wrong, at first.
Hi GuyM,
We don’t have the final numbers for Oct 2016 yet, also you need to make sure you look at the initial output report for Oct 2016 which would have been made in Dec 2016.
Hi GuyM,
The RRC numbers are also revised each month, if you check back on the RRC estimate for Oct 2016 in April 2018, you will find that the estimate will be higher than what is reported in Sept 2017. After about 24 months there is very little change, but it takes about 24 months for all the data to come in at the RRC. The EIA also uses the “pending file” from the RRC which I don’t have access to, basically when the pending file is used the data is pretty much complete after 12 months.
Saudis May Raise Domestic Gasoline Prices by 80%
Removing energy subsidies is politically sensitive in the six-nation Gulf Cooperation Council, where many nationals have grown accustomed to generous state benefits and handouts. The slump in revenue from oil exports have left governments with few options as they grapple with rising budget deficits.
The budget deficit is from extra spending done to keep the populace happy.
Reducing subsidies (I think there is a definition problem here with the word subsidy) and thus raising the price (to somehow address the deficit) will anger the populace.
Why not do nothing? This story is silly.
Subsidies don’t cost the KSA govt signif money. The oil comes out of their own ground. They don’t have to buy it from anyone. It can be priced at whatever it costs to extract and refine and they have the lowest extraction costs in the world. If they actually priced gasoline at their costs it would be way way under international prices. If they punch the price lower than their own costs, it ain’t by much, and international levels are irrelevant.
Silly.
EIA’s Drilling Productivity Report for Eagle Ford, from Oct-2016 the rig count has more than doubled and the production per rig has decreased by a third (-34% to Oct-2017)
The EIA doesn’t give a reason. It could be anything, not enough sweet spots, the return of older slower rigs. Less completions per rig due to low oil price or drilling just to hold leases. The EIA doesn’t split out the production per rig number into parts. And it is just a model, apart from the number of rigs and the oil price I’m not sure what real data is in it.
Production per rig, chart on Twitter: https://pbs.twimg.com/media/DKEV3MLUQAAbG4c.jpg
Productivity per rig drop is because there is a delay between drilling and completion, nothing more. It is not a very useful number, in fact it actually tends to give the opposite impression of how things are going.
Not only useless information, but suspect in many areas of how they gather the information of legacy declines, number of wells drilled, etc. Finger painting by government employees.
Apart from floating storage this is where most of the worlds excess oil inventory is, containing oil that is either for sale or resale.
Updated chart for Saudi Arabian inventories on Twitter: https://pbs.twimg.com/media/DKBTGwxW0AA1IZf.jpg
IEA floating storage, chart on Twitter: https://pbs.twimg.com/media/DJl4bPWUIAAmzKI.jpg
Good info. Thanks.
Just been looking at the number of the so called stripper wells in Texas, although I don’t know anything about them
The EIA drilling report came out yesterday. A huge drop in Eagle Ford production reduced the combined Eagle Ford, Permian and Bakken production from new wells (blue line in below chart), despite a still staggering growth of 96% based on total production. However, the legacy decline rate has been 97% (red line in below chart) based on total production, erasing the huge production increase from new wells to a negative net growth (yellow bars in below chart).
The exponentially increasing depletion rate of currently 97% (red line in below chart) reflects a serious challenge to the business model of shale companies. Companies need the cash flow from existing wells for investing in new production. The high depletion rate makes it increasingly difficult for shale companies to create growth, especially when the depletion rate increases at accelerating speed.
The much reduced growth of US production paves now the way for higher oil and gas prices. As oil prices will be low for a while due to global surplus capacity and substitution of oil demand, the chances for much higher gas prices over the next few months are very high.
UK’S OIL INDUSTRY ‘ENTERING FINAL DECADE OF PRODUCTION’
“The North Sea oil industry is entering its final decade of production, according to new academic research that rejects Alex Salmond’s claims during the 2014 Scottish independence referendum campaign of an impending second boom. An Edinburgh University study of output from offshore fields estimated that only around 10 per cent of the UK’s original recoverable oil and gas remains untapped. It also concluded that fracking will be barely economically feasible in the UK, especially in Scotland, because of a lack of sites with suitable geology. The researchers warned that the UK will soon have to import all the oil and gas it needs.”
http://www.telegraph.co.uk/news/2017/09/19/uks-oil-industry-entering-final-decade-production/
Meanwhile, the Trump administration is laying the groundwork to open the Alaska National Wildlife Refuge to oil and gas drilling. The Washington Post reports the Interior Department is modifying a 1980s regulation to allow for exploratory drilling and seismic surveys in the nearly 20 million-acre reserve.
https://www.democracynow.org/2017/9/19/headlines/trump_admin_moves_to_open_alaskan_refuge_to_oil_and_gas_drilling
I am unhappy about this. All I can hope is that oil companies won’t pursue it because of costs and risks.
They’ll do the surveys and explore.
And find nothing. That would be cool. All the contortions through the years to prevent exploration, when if it had simply been allowed there would have been no problem.
The Titanic has left the dock.
Yeah – all this gushing about billions to pay down the national debt – chump change.
https://naturalresources.house.gov/anwr/
And doesn’t ANYBODY in Congress or the national press remember KIC-1?
https://www.adn.com/business-economy/energy/2017/07/22/anwr-well-drilled-on-a-private-native-inholding-has-held-its-secret-for-decades-as-interest-in-the-coastal-plain-has-grown-and-subsided/
As hard as it is to find new oil, with the oil companies, the state and the native peoples all wanting a big find, if KIC-1 showed anything, why didn’t we hear a peep during the YEARS of $100/bbl oil?
I’m thinking “dry hole”, kinda like Mukluk.
http://www.upi.com/Archives/1984/01/20/Sohio-abandons-15-billion-Mukluk-well/8135443422800/
Pandora’s box has opened another notch. Someone had to be stupid enough to try this.
The UK should prove to be an interesting case study of Peak Oil. I have a theory that the economic revival beginning during the Thatcher years, that was experienced in the UK, had less to do with Thatcher and her Tory policies and far more to do with the rise of North Sea oil. Despite the decline of North Sea production, the UK seems to have been able to avoid deep recession so far but, how much longer.
IMO the UK economy will not be able to withstand the shock of going from earning money from oil exports to having “to import all the oil and gas it needs”, unless they manage a rapid and almost complete transition away from fossil fuels, to alternative energy sources for electricity generation, transport and heating.
I can’t find the original report, but my guess is that headline is misleading. The R/P or oil is about 11 and for gas about 9, but there will still be both flowing in ten, even twenty five years. However the industry is fading away.
George – Story Source(s)
THE SCOTTISH AND UK OIL INDUSTRIES ARE ENTERING THEIR FINAL DECADE OF PRODUCTION, RESEARCH SUGGESTS.
https://www.sciencedaily.com/releases/2017/09/170919123118.htm
http://www.ed.ac.uk/news/2017/uk-oil-and-gas-reserves-may-last-only-a-decade
Doug -thanks, Sunnnv posted a link to the actual paper. Most of the paper is about shale, and very little about production, in fact it’s almost a throwaway line about what is remaining with no detailed analysis, and it actually says 10 to 20 years. It’s by a geologist rather than a production engineer. It’s been blown a bit out of proportion – but maybe that’s a good thing compared to the other side where there’s always several billion barrels still to be found, and next year too, if only enough investment is made and taxes are cut low enough.
Professor Thompson’s article “Can fracking, for gas and oil, power the Scottish economy?”
can be found on page 18 of:
http://edinburghgeolsoc.org/eg_pdfs/edinburgh-geologist-62.pdf
Hi home page is:
http://www.geos.ed.ac.uk/homes/thompson
His blog’s Sep 2017 entry has a bit more info on the fracking and only a decade left of UK oil and gas.
Unsurprising rebuttal from UKOG (the trade body), there’s likely to be another from UKOGA (the government authority soon).
OGUK challenges scientists’ gloomy North Sea prediction
https://www.energyvoice.com/oilandgas/north-sea/151038/oguk-challenges-scientists-gloomy-north-sea-prediction/
“There are currently oilfields in Scottish waters whose lifespan estimates are still measured in decades, like Mariner and the Quad 204 complex.
“And should Hurricane’s 2019 production trial of its Lancaster discovery turn out to be a success and west of Shetland basement resources are demonstrated to be economically viable, then future potential developments like Lancaster and the contiguous Halifax well could be producing 40 to 50 years from now, the carbon agenda permitting of course.”
George. Is any of this economic at current oil prices?
Are capital markets for this production as open and those for US shale?
Mariner and Quad 204 (which is Glen Lyon replacement for Schiehallion) were started in the high price years and Mariner is due next year and Glen Lyon is ramping up. So it might have been a question of minimising loses that they weren’t cancelled. The UK industry lost money in 2015, just about broke even last year – but only through a lot of cuts. The Hurricane development is really an extended well test on a rented FPSO (FID last month), to extend the life the test would have to go well and they’s need a newer vessel I think, but they are betting on that to be able to get back what they’ve so far spent. There isn’t much else – maybe Rosebank, but that looks like requiring a lot of wells.
Hi George
The Liberator oil field is likely to have a FDP filed soon assuming funding issues are resolved.
Thanks – I think that’s a pretty small field though – maybe less than 10 mmbbls – and a tie back that would come and go in less than ten years (not sure what would be the best hub for it though, I think it would have to be Beatrice, which I think is going to be converted to a wind farm, so maybe Captain). I’m waiting for some info. on the Dana western isles development start-up, that has all the makings of a company bankrupting disaster.
George
As detailed in the Company’s Admission Document found at https://i3.energy/, i3’s core asset is the Liberator oil discovery located in the Outer Moray Firth within the UK North Sea. The Company’s independent reserve auditor, Gaffney, Cline & Associates (“GCA”), attribute 9.4 MMboe of 2C Contingent Resources to i3’s 100% operated interest in Licence P.1987 in Block 13/23d (the “Liberator Licence Area” or “LLA”), with the wider Liberator Field Cluster (“LFC”) containing 16.1 MMboe. Under the assumptions outlined in GCA’s Competent Persons Report, the LLA and LFC have before-tax NPV10 values of US$ 249 million and US$ 311 million respectively, with the LLA’s 1C Low Case having an NPV10 break-even using a constant US$ 23 per barrel Brent oil assumption.
And most recently.
The MV Poseidon (operated by MG3) conducted site surveys across two areas close to the Liberator field, identified by i3 as development drill centres for expected future production operations. The survey acquired seismic, sonar, soils strengths and environmental sample data to assess drilling hazards and provide accurate soils data for construction activities on the field and associated in-field pipeline route.
Part of the data was collected over the neighbouring Blake Field production manifold under agreements and cooperation with the Blake Field Operator, Repsol Sinopec Resources UK Limited, and its field partner Idemitsu UK Ltd.
This detailed site information will be used in preparation of the Environmental Statement required for final Field Development Plan (“FDP”) submission and consideration for approval by the UK Oil & Gas Authority and to assist in the designing of the two development wells and associated tie-ins to be installed on the field. The Company anticipates the publication of the Environmental Statement for the Liberator development for public consultation shortly and is focused on submitting its FDP in the coming months
Ford is idling their NA car plants for 1-3 weeks depending on the model. Truck and SUV plants- full steam ahead (CNBC).
The Chicken Tax SUV subsidy strikes!
https://en.m.wikipedia.org/wiki/Chicken_tax
IEA World Energy Investment 2017, executive summary is available online: http://www.iea.org/bookshop/759-World_Energy_Investment_2017
Not much new for those who follow the industry. Upstream investment declined substantially in 2015 and 2016 (44% for the two years combined) but has been increasing modestly this year. Global costs are expected to decline but cost of US onshore (i.e. tight oil) is increasing by approx. 16% in 2017. The industry has increased its leverage (i.e. more debt) and direct investment to short cycle projects. I guess this is a gentle way of saying that not much exploration is done at the moment, the industry expects (or needs) higher prices but will be less agile if/when that happens.
US crude imports still below average after the hurricanes while exports seem to be back up to normal. Products imports/exports seem to be back up to normal too.
U.S. Petroleum Balance Sheet, Week Ending 9/15/2017
Crude Oil Inventories, up: 4.6
Gasoline Inventories, down: -2.1
Distillates Inventories, down: -5.6
Propane Inventories, down: -1.4
Chart summary on Twitter by Saxo Bank: https://pbs.twimg.com/media/DKLK_6BXUAA1n0d.jpg
Crude oil imports last week 7,368 whereas last year 4 week was average 8,089 kb/day
U.S. imports of crude oil from Mexico fall to lowest on record: EIA Data
But spr also down 1.4 mmb. Is this harvey related or the extra sales?
I’ve not been following that closely but yes it seems to be due to Harvey
DOE Says 3.96 million barrels of SPR crude delivered after Harvey
As you might expect, the refineries that are still shut down after Harvey are lowering the crude oil import figures…
Texas Ports, crude imports, chart on Twitter, Clipper Data: https://pbs.twimg.com/media/DKLaIwkUMAAALhX.jpg
Seasonally strong demand is drawing crude oil from traders storage around the world. The story doesn’t give any numbers.
2017-09-20 Companies said to be selling crude from Saldanha Bay in Africa – Bloomberg
Crude demand is now seasonally outstripping supply, tightening the physical market for some crude varieties to levels not seen in the last two years and encouraging traders to sell their stored oil.
Although largely unknown outside the oil trading industry, Saldanha Bay is one of the world’s largest crude storage facilities, with a capacity to hold 45 million barrels in just six gigantic, partially-buried concrete tanks.
https://www.bloomberg.com/news/articles/2017-09-20/oil-traders-empty-key-crude-storage-hub-as-global-demand-booms
The Fujairah Oil Terminal onshore oil storage facility. If you had not heard of it before, there is an about us page (The data is on the Platts website) http://www.fot.ae/index.php?action=about-us
I’ve been trying to see if the EIA weight their forecast models on the price of oil. The drillers themselves look at the futures prices for hedging and decision making. I’ve not noticed anything so far.
In the July STEO (between May & Sept on the chart, July isn’t shown) they decreased their estimate for the future price of oil into 2018 . But as you can see by September they still haven’t decreased their production estimates by much.
Argus – Venezuela scraping by on dwindling gasoline supply – 20 Sep 2017
The CRP refining complex, which includes the 635,000 b/d Amuay refinery and nearby 305,000 b/d Cardon refinery, currently produces barely 70,000 b/d of 91 RON gasoline because key processing units are off line. These units, which include catalytic crackers and distillation plants, have been crippled by equipment breakdowns and crude supply shortages, a PdV downstream executive at the complex told Argus.
The CRP’s current gasoline output covers about 41pc of estimated local demand of 170,000 b/d, down from a peak of 260,000 b/d in 2013, before oil prices collapsed the following year, according to an internal PdV document seen by Argus.
The 146,000 b/d El Palito refinery in Carabobo state and the 190,000 b/d Puerto La Cruz refinery in Anzoategui state currently are not producing any gasoline because of persistent equipment problems, crude supply shortages and delayed imports of essential components,
(free to read) http://www.argusmedia.com/news/article/?id=1538382
The IEA is comfirming that they calculate world inventories from a supply/demand calculation. And they also comfirm that they assume that refinery data from around the world is reliable enough to use.
production + net imports – refinery runs = +- inventory change
IEA 20 September 2017
The following commentary expands on the analysis we provided in the September issue of the Oil Market Report, where we took a close look at our “miscellaneous to balance”
http://www.iea.org/newsroom/news/2017/september/commentary-looking-for-balance-in-the-oil-market.html
US GoM Refineries
As of September 19, IHS Markit estimates that 15 of the 20 affected refineries are at or near normal operating rates. Four of the other five are actively in the process of restarting and ramping up runs.
IHS Markit PDF File: https://tinyurl.com/yatwdwut
There was a fire at Valero’s Port Arthur plant on Tuesday which might slow things a bit.
Crude oil vs NGLs
I’ve now included China (NBS, LPG) and The Russian Federation (JODI Data, LPG) in the list of countries that provide separate crude oil & NGLs production data. Since 2013, total liquids production has increased +7.77 million b/day, crude oil +5.01 million b/day, NGLS +2.76 million b/day and so NGLs account for 35% of the overall total liquids increase.
Crude oil vs NGLs
I think NGLs are exempted from OPEC cuts. Not sure if/how much this affect the trend.
OPEC NGLs production made a new high in July – I didn’t even notice that 🙂
I had been wondering what was in total liquids supply, as both the IEA and EIA use this measure of supply, and so now I know.
I don’t scroll much on tablets. So somewhere up above there was talk of condensate and why GOR in the Bakken meant or didn’t mean something . . . for reported oil production.
Condensate has definition problems. When used casually it usually means liquid that flows from an OIL well, though the proper term for that liquid would be lease condensate. Condensate from gas wells is generally NGLs and not liquid at room temp/pressure.
But Lease Condensate is liquid at room temp/pressure. Nat Gas from a crude oil well, creating or associated with a flow of NGLs AND lease condensate, will essentially mean a flow of liquid-at-roomtemp with API 45-75 added in with the crude oil liquid. That’s definition for lease condensate. API 45-75. It won’t have hardly any diesel or kerosene in it.
Lots of potential for fuzzing up pricing. There seems to be a glib wave of the hand and a “the higher the API, the easier it is to refine so it’s more valuable.” But this can’t be so if a refiner has diesel and kerosene customers to serve.
The Bakken API number is higher than previous claims, per Statoil’s February assay. This is all getting no attention.
No, I’m afraid you have that completely wrong. Lease condensate comes from a gas well, as the pressure is let off some liquid drops out (it’s a complicated process and can be due to the gas cooling as it expands and a phenomenon called retrograde condensation – it depends where the starting and finishing points are in relation to the phase envelope). That is condensate (mostly pentanes with some heavier, and lighter stuff absorbed). The gas left over goes to a gas plant and NGLs are removed (C2, C3 and C4). Associated gas from an oil well also goes to a gas plant and NGLs get removed from it as well, there may be some drop out from the gas in the pipeline which arrives at the gas plant – that is also called condensate, but it is not lease condensate as it is metered separately (i.e. it is part of the gas a far as the lease owner is concerned).
Lease condensate
When most people talk about condensates they are referring to lease condensates, so defined because they are produced at the lease level from oil or gas wells. These condensates can be produced along with significant volumes of natural gas and are typically recovered at atmospheric temperatures and pressures from the wellhead gas production. These “raw” condensates come out of the ground as mixtures of various hydrocarbon compounds including NGLs, pentanes (C5s, so called because they have five carbons in the molecules), C6s (hexanes), and depending on the condensate, a menagerie of heavier hydrocarbons in the C7, C8 and even heavier range.
A lease condensate has an API gravity ranging between 45 to 75 degrees. Those with a high API contain lots of NGLs (including ethane, propane and butane) and not many of the heavier hydrocarbons. These condensates are clear or translucent in color. The condensates with a lower API gravity down at the 45 degree level look more like crude oil (black or near black) and have much higher concentrations of the heavier C7, C8 and heavier compounds.
The WestTexas guy posted a graph some time ago showing relative concentration of middle distillates as a function of API degree number. The amount crashes around API 42. Looking for link . . . .
Someone can find his post if they like. I stored the chart and am uploading it to imgur.
https://imgur.com/a/IdYcw
All that is correct – but to a first approximation all the condensate comes from gas wells and none from oil wells.
Interviewed this morning, Harold Hamm calls EIA STEO projections flat out wrong. US will be lucky to achieve 9.35 million b/day by December.
https://www.bloomberg.com/news/articles/2017-09-21/shale-billionaire-hamm-slams-exaggerated-u-s-oil-projections
Hi all,
A
A new guest post by Ian Schindler is up
http://peakoilbarrel.com/an-improved-empirical-model-for-oil-prices/
Also a new Open Thread is up.
http://peakoilbarrel.com/open-thread-non-petroleum-sept-21-2017/