A Guest post by Ian Schindler (Schinzy)
This is an update to the post An Empirical Model For Oil Prices and Some Implications in which we discussed a model for oil prices as a function of 3 years of production, that is oil price in year t was estimated by production in year t, the discrete first derivative of production in year t, and the discrete second derivative in year t. We subsequently published a paper titled Oil Extraction, Economic Growth, and Oil Price Dynamics using the same model. This article contains most of our intuition on how peak oil will effect oil prices. We believe in fact that peak oil is about extraction prices rising faster than market prices and hence lower profitability for the oil industry.
Before going on, we note that all available data is very approximate. Jean Laherrère has exhaustively documented incoherence in extraction data from all standard sources [1]. We use a single price of oil provided by BP, but there is a large spectrum of prices for oil of different densities, chemistry, and provenance [2]. For this reason we do not search a perfect fit but rather try to understand the dynamics creating oil demand.
Inspired by work of Gail Tverberg and Rune Likvern on interest rates and oil prices, we added interest rates to the independent variables. Without interest rates, we had an adjusted R squared of .55.
We used extraction and price data from BP. The interest rate is the average yearly rate of the U.S. Federal Reserve. The justification for using this rate is that we believe that the U. S. dollar is the currency of oil markets and the U.S. Fed rate is the effective rate for the oil business.
The model is identical with the model discussed in An Empirical Model For Oil Prices and Some Implications with the exception that we have replaced the constant with the interest rate. Specifically our model is
log(P(t)) = a* I(t) + b*Q(t) + c*DQ(t) + d*DDQ(t)
or equivalently
P(t) = exp( a* I(t) + b* Q(t) + c* DQ(t) + d* DDQ(t)),
where P(t) is the price in year t, I(t) is the federal funds or interest rate in year t, Q(t) is the quantity extracted in year t, DQ(t) = Q(t)-Q(t-1), DDQ(t) = Q(t)-2Q(t-1) + Q(t-2) and the constants a, b, c, and d are estimated by linear regression.
The values of the regression coefficients are a = 1, b= .05, c=-.14, and d=.07. The largest coefficient is that of the interest rate, but of course interest rate numbers are small compared to production numbers. Thus once again, we find that the largest contribution comes from the first discrete derivative. R-squared adjusted is .9872, that is to say as high as can be expected with this quality data.
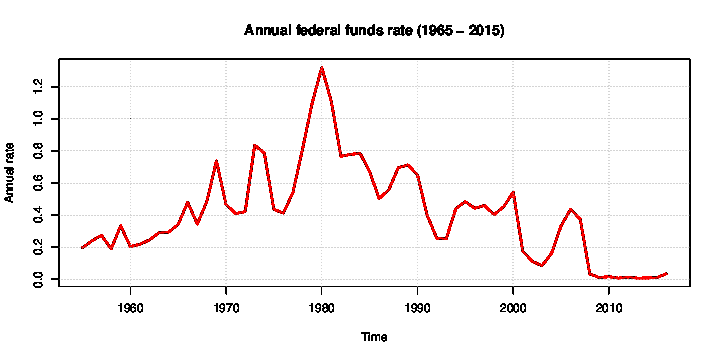
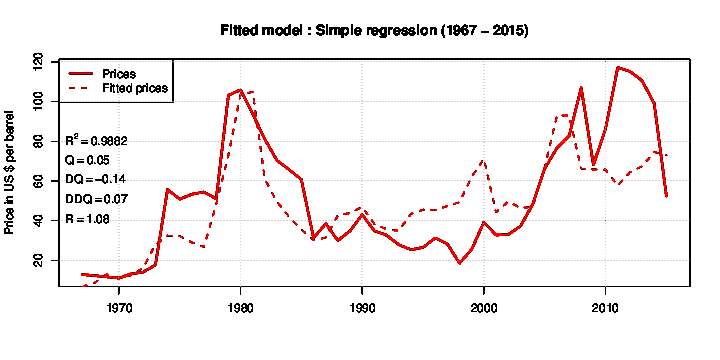
Below are charts of price versus the rate of extraction from 1965 to 2015, the federal funds rate versus the year, and the real and fitted price versus the year.
We have some ideas on what this model is saying, but we would rather say nothing for the time being and leave the interpretation for the comments section.
Bibliography
1
Laherrère J.
Fiabilité des données énergétiques.
Club de Nice treizième Forum annuel (2014).
2
Jean Laherrère.
Tentitives d’explication du prix du pétrole et du gaz.
ASPO France, 2015. http://aspofrance.viabloga.com/files/JL_Nice2015long.pdf
278 responses to “An Improved Empirical Model For Oil Prices”
Hi Shintzy,
What are the t-stat values for the coefficients (a,b,c, and d)?
Nice work.
Have you tried real GDP as an independent variable? Often demand for energy correlates pretty well with aggregate demand so I would think real GDP should have some influence on price from the demand side. Using Q and the first and second derivative of Q might reflect the supply side, but prices are often affected by supply and demand. Also note that a low interest rate environment usually reflects slow growing GDP, though in this case it would only reflect US conditions rather than the World.
Here is the R output:
Call:
lm(formula = log(Price67) ~ Quantity67 + DQuantity67 + DDQuantity67 +
Rate67 – DRate67 – DDRate67 + 0)
Residuals:
Min 1Q Median 3Q Max
-0.98077 -0.22987 -0.01129 0.34466 0.71260
Coefficients:
Estimate Std. Error t value Pr(>|t|)
Quantity67 0.05049 0.00150 33.656 < 2e-16 ***
DQuantity67 -0.13696 0.03974 -3.446 0.00124 **
DDQuantity67 0.06726 0.03395 1.981 0.05370 .
Rate67 1.08209 0.17062 6.342 9.68e-08 ***
—
Signif. codes: 0 ‘***’ 0.001 ‘**’ 0.01 ‘*’ 0.05 ‘.’ 0.1 ‘ ’ 1
Residual standard error: 0.4309 on 45 degrees of freedom
Multiple R-squared: 0.9882, Adjusted R-squared: 0.9872
F-statistic: 942.8 on 4 and 45 DF, p-value: < 2.2e-16
With respect to the GDP question, Nicolas Meilhan used the previous model (without interest rates) with WorldDP and got a nice fit (see http://leseconoclastes.fr/2016/06/pib-petrole-de-loeuf-de-poule/).
Hi Schintzy,
Based on those stats, I would drop the DD part of the model as all the other variables are significant at the 95% confidence level. Including DD may just lead to an overfit, with more model complexity, but little improvement to the overall fit.
An interesting exercise would be to use both real GDP and interest rates, but drop DD from the model. You may find that GDP is better than interest rates for an oil price model. The best way to test this hypothesis is to include both in your model and let the t-stats guide you.
Hi Dennis,
Yes, the DD part is a bit weak. I talked it over with Aude (who is a statistician). She said after trying without the DD part that she would keep it. But she said it was a judgment call that not everyone would share. I don’t remember what happened without the DD.
As to GDP, you are probably right, it would give a better fit. But I don’t think the model would be as useful (estimating GDP is too difficult). We will now start studying interest rates to try an anticipate what will happen next.
Hi Schintzy,
I think US interest rates are a poor input into the model. Better to find a better proxy for international interest rates in my opinion, perhaps LIBOR would fit the bill or an average of LIBOR, Fed Funds and some measure of Chinese and Indian interest rates would reflect World rates better, or these could be weighted on the basis of European, Asian, and North American Oil Demand or real GDP.
You need a good underlying theory, statistics by themselves are not enough.
What I think this says is that price this year is mostly determined by last year’s supply. This shouldn’t really be surprising as it’s basic psychology. Since this is a purely supply driven model, apart from interest rate, it will fall apart when demand shifts substantially due to elasticity of demand — and sure enough, your weak fit comes at times when demand shifted a lot.
Is there anything to be taken from how the model breaks down since 2008, I’d expect R squared to be really high before then and actually a negative fit afterwards? That period corresponds to quantitive easing and ZIRP, but also to China filling their reserve, increases in NGL/Condensate in the total liquid mix, flip-flop OPEC policies, and a lot of unconventional oil coming on line: oil sands projects and ultra-deepwater, which have development times over 5 years (i.e. outside the time delay in the equation); and LTO which seems to respond more to investor sentiment than directly to a price signal.
Speaking of quantitative easing, this week of course, we heard the FED announce The Great Unwind — the elimination of the accumulated bonds on their balance sheet.
The mechanism is educational, primarily because it was never really clear that the FED had been purchasing bonds to maintain a balance sheet size as bonds on that balance sheet matured. They’ve been doing that since I think late 2014.
Now the plan is to allow a small number of bonds to mature and not be replaced with a new purchase. The balance sheet is presently over four trillion dollars which is about 20% of GDP and the plan is to reduce that to 2 trillion dollars over a five-year period. Note that prior to quantitative easing the balance sheet was about 600 billion dollars. Their plan is not to go back to where they were. The plan is to get the balance sheet to 2 trillion dollars. There is no announced path for returning the balance sheet to where it was. That is true even if you play percent of GDP games.
The one thing that is not discussed generally is mechanism. Yes, as Treasury bonds mature, Treasury has to send cash to the Federal Reserve and the Federal Reserve erases it. There hasn’t been an equivalent description for how that is done with mortgage-backed securities which are also being reverse QE’d. One might also ask where they were finding new mortgage-backed securities to purchase to offset the maturities that took place prior to this announcement.
Oh, and let’s not forget that up until this announcement the entire balance sheet’s contingent of Treasury bonds has been paying interest to the US Treasury. Yes I have the direction correct. All of those bonds that the FED bought with money created from nothingness are debt — Treasury borrowed that money from the Fed and they pay interest to the Fed. The Fed has been returning that money to Treasury and Treasury declares it essentially as revenue.
This is all why there’s not much point in worrying too very much about how money affects what comes out of the ground. What comes out of the ground will be what has to come out of the ground to keep people from starving.
Exactly. Before giving my conjecture, let me first say that I was very
surprised by two things. First how good the fit was. I was hoping to get R
squared to go from .55 to about .8. The second was that I thought the
coefficient of the interest rate would be negative. I thought low interest
rates raised prices and high interest rates lowered them. But in general we
have low interest rates when the economy is sluggish and the price of oil low and high interest rates
when inflation is heating up and the price of oil is high, which explains the positive coefficient on
interest rates.
This brings me to my conjecture: interest rates were too low during
quantitative easing and ZIRP which resulted in oil prices that were too
high, and poor choices by investors who poured money into dubious
investments. We are now suffering from the result of those poor investment
decisions which are resulting in low oil prices. The deflationary forces of
poor investments is stronger than the inflationary tendencies of low current
interest rates.
Prices were too high 2011-14, 2015-17 they have been too low?
What is the “correct price”?
Hi Shallow Sands,
Probably $75 to $85/b once storage levels get back to normal levels.
Dennis. $75-$85 would be great for producers in the lower 48.
Don’t think that will happen until shale production is in decline.
Shale will not be profitable until it is primarily stripper production, or maybe production is no more than 35 BOPD per well average across all basins. Of course, most wells will then be owned by private companies. This is already happening in the Bakken.
Hi shallow sand,
The US is a small player on the World stage as far as oil output goes, or at least not large enough to act as the swing producer as Texas did through about 1970. At current price levels demand will continue to be above supply until oil stocks fall to “appropriate levels.” (I am not going to guess when this occurs because this is impossible to predict accurately.) It may be difficult to turn this around quickly even if OPEC, Russia, et al end their cuts. I believe the end of the cuts will only be enough to fill the supply/demand gap temporarily, but demand will continue to grow, eventually this will push oil prices up.
Whether LTO output starts to decline before or after this rise in oil prices will not matter, there is not more than 2 Mb/d of growth likely in US LTO output (a max of about 6.5 Mb/d), I don’t think 2 Mb/d of US output will fill the gap between supply and demand, so even without a decline in US LTO oil prices will rise. About the only thing that may stop this is another Global Financial crisis, I believe the chances of GFC2 are low (less than 10% probability of occurring before 2030), what happens beyond that depends in large part on how quickly plugin vehicles and autonomous vehicles are adopted. My WAG is the chances of GFC2 after 2030 increase to 33% or higher.
Dennis. Am I making this up, or are their predictions that US C & C will go North of 12 million BOPD in the future?
I know the future is hard to predict, but if futures markets are flat low $50s WTI for ten years anticipating 12+ million BOPD from US, I’d say that is some big time complacency.
It took 1,600 “oil” rigs and $100 oil to get US to 9.6 million. Mostly sub $50 WTI has resulted in at best a plateau. I am skeptical of EIA weekly at 9.5 million BOPD, monthly EIA next week will be big news either way.
EIA does not predict the future very well. Just like me. My guess is different from EIA but I think US output might rise about 1.5 Mb/d to about 10.5 Mb/d by 2022.
Lol. In a perfect world, probably that for a while. The world is far from perfect. A spike is coming, as probably many already agree. It will go up too high, and producers will pile on until it gets back to the same situation as now. Although, it probably will never see $28, again. At least that has been the story for the last 100 years.
The only reason it has stayed this low for so long, is because some of the shale producers said they can be profitable at $40. They should have said that we can forestall bankruptcy at $40, but it will take $60 to $70 oil for some increased production and profitability. So, EIA and traders took them at their word, and have been anticipating a major increase in production. Eventually, the world will wake up to the fact that US oil is decreasing at this price. Kinda mucks up everyone’s expectation, and the spike will ensue.
It’s the classic paradox of official forecasts, especially for commodities: if you say production will be high and prices low, then investment will drop and production will be low and prices will be high. If you predict low production and high prices, then investment will be high, and production will be high and prices will be low.
The official forecasters know about this problem, as well as the opposite problem of forecasts being self fulfilling, e.g., economic growth forecasts.
That’s a reason for skepticism about official forecasts.
Hi GuyM,
Prices have stayed this low because storage levels at the World level are not estimated very well, maybe by next May things will be clearer.
In the past 12 months to August 2017, US LTO has risen by about 630 kb/d from 4120 kb/d to 4750 kb/d. See tight oil estimates at link below
https://www.eia.gov/petroleum/data.php#crude
US output estimates (monthly data) is only available through June 2017 with output from July 2016 to June 2017 rising from 8678 kb/d to 9097 kb/d (419 kb/d increase). Over that same period LTO output increased from 4170 kb/d to 4590 kb/d (420 kb/d), so if the data is accurate all of the US increase in the July 2016 to June 2017 period is due to LTO output increase. It looks as if there will be another 160 kb/d increase in the July and August period unless there are declines from elsewhere in the US oil industry.
The spot price of Brent crude has moved pretty strongly lately, up about $5/b or 10% to about $55/b. Maybe the drop in OPEC output combined with increased demand estimates by the IEA.
With summer driving season ending in the Northern hemisphere we may have to wait until next spring for a significant change in oil prices or maybe even fall of 2018.
LTO is dropping from a high since April, which wasn’t very high. Initial production reported by RRC July 2017 is 83,954,201. The initial production by RRC reported Oct 2016 was 83,182, 373. The RRC now say Oct 2016 production was 3,113,000 daily, and EIA has revised their figures to 3,172,000 daily. Does that really look like LTO has increased over 600k since last year? Really??
August and September are likely to be really lower due to Harvey. Unless the last quarter has a gusher performance, US production will not likely be over 9 million a day by year end.
Hi Guym,
Just reporting EIA estimates which are much better than RRC data for the past 12 months.
We don’t have great data for TX.
I do agree the shale management talk was idiotic and seems to have subsided some.
I recall EOG in early 2016 stating they could make strong returns on “premium locations” at $30 WTI. What BS!!
I plugged in $30 WTI into their recently released 12/31/2015 statement of future cash flows from their 10K. Guess what? NO FUTURE CASH FLOWS. Even after they had slashed estimates of future development costs a load.
The changes in costs in the PV10 calculations from 2014 to 2015 were ridiculous. Yet no one questioned or even comented, or really even noticed.
XOM, CVX and OXY all lost money on US upstream in both 2015 and 2016. That is just plain crazy, and shows just how much the not so bright shale management talked down the oil price.
I fully agree the market overshot, and I think it will take a while before we get back to a sane price, because I fully believe shale management just cannot help but brag and make their top 5% wells seem like the norm.
That’s it, in a nutshell. Yeah, it subsided some. EOG now says they can make strong returns at $40 oil. LOL.
You’re right of course. I am being vague hoping to get away with half baked
ideas. I will try to be more precise, but recall that this is a conjecture
and it might be skating on very thin ice.
I think one has to separate what one might call “the real economy” from what
one might call the “financial economy”. The real economy is the amount of
goods and services available, the financial economy is how money is
distributed. I am influenced by Ray
Dalio’s How the
economic machine works and Steven
Keen’s economic analysis. Briefly when debt expands, so does the financial economy. When debt contracts so does the financial economy. To make my conjecture more
precise, I would say that a “good” interest rate should make a good “fit” of
the financial economy to the real economy. Interest rates which are too low
cause an increase in debt and a rise in prices. I think the current low
price environment is due to the fact that aggregate debt is no longer
rising. Bankruptcies cause aggregate debt to decrease.
Note that I have neither defined “good” interest rate nor good “fit”. The
reason for this is that I don’t know exactly what I mean. What I will say
is that I expect oil prices to remain low (below $65 a barrel) until
production declines year on year.
I’ll take $55-65 WTI. Ironically the price has stubbornly stayed below that level for all but two of the last 33 months.
Report on study by Wood-Mac (very expensive to buy I expect):
PERMIAN COULD TOP OUT IN 2021 UNLESS TECH OVERCOMES GEOLOGY, WOOD MAC SAYS
http://www.chron.com/business/energy/article/Permian-could-top-out-in-2021-unless-tech-12214742.php
I think we’ll see the effect much earlier in Bakken and EF, as has been pointed out here by several commenters previously (and for free).
Hi George,
I agree that this will happen earlier for the Eagle Ford, for the Bakken I think 2020 is a good guess for a secondary peak at around 1200 to 1300 kb/d if oil prices rise to $85/b or more by that time.
With reports like this, seems like investment money and loans will be increasing hard to find. Will this be the beginning of the end of LTO? Less money to drill because of declining production, which means even less money to drill. A death spiral coming?
Bakken rigs below 50 today.
Hi George,
The Bakken will need higher oil prices, if they remain under $55/b, then you will be correct and Bakken output may continue on a plateau about where it has been the past 6 months. Eventually oil prices will rise, date unknown.
Thank you Shintzy for this update.
What I see historically is the cyclical fluctuations of the resource cycle (“pork cycle”). The market price is sometimes higher and sometimes lower than the marginal production cost. I find your previous conclusion “price considerations from the model speed the rate of decline in extraction” to be very interesting.
Going forward, there are lots of issues that make the dynamic uncertain (the issue of reserve replacement, lack of investment in new production capacity, uncertain central bank policies, economic growth, inflation, debt, etc.). As you know, the oil price and production both declined in the early 1980. Low/no spare capacity makes me expect high volatility in coming years if/when global stocks have declined a bit more. However, I’m hesitant that the average price will be high due to lack of affordability.
You’re welcome.
I agree with your statement. There was a break in the dynamics of oil prices at about 1970. I think the pre1970 dynamics were that of the growth period. From 1970 to the present is what I would call the stagflation period. I think the dynamics will again change in the contraction period.
Hi Schintzy,
Supply and demand considerations suggest a shortage of oil will lead to increasing prices, regardless of “affordability”, as has always been the case in a market economy, when something becomes more expensive people will economize on the use of that product (buy cars and SUVs with better efficiency, combine trips, car pool, us public transport) and find substitutes (EVs, bikes, walking, moving to a more urban setting or closer to work).
As prices rise we may also see an increase in the rate of extraction from producing reserves along with more rapid development of proved undeveloped reserves, this might only keep us on a plateau for a few years (2020-2025) before output starts to decline, the longer the plateau, the steeper the decline on the backside. By 2025-2030 oil will be very expensive unless the transition to plugin vehicles (and autonomous vehicles) occurs much more rapidly than I envision.
Here is a link to my dream vehicle http://mypodride.com/. Just bought a new pedelec a few months ago. Difficult to justify a new vehicle purchase.
Vehicle inspired by the Jeremy Clarkson School of Design.
Would be interesting to see what the impact of adding another piece of data to the model – the strength of the US dollar relative to a basket of global currencies. Seems to me that in the past 25 years, the model over estimates the price as the dollar is strengthening and underestimates the price when the dollar is weakening. Thanks for posting – very interesting stuff.
http://www.prnewswire.com/news-releases/anadarko-announces-25-billion-share-repurchase-program-300523151.html
Anadarko were one of the few larger oil companies (maybe with Statoil) that had been maintaining offshore exploration and development, but looks like they might be giving up on that. Share repurchase is not much different from extended liquidation looked back on from far enough in the future.
ANADARKO ANNOUNCES $2.5 BILLION SHARE-REPURCHASE PROGRAM
We believe this is a very attractive use of our cash given the value of our assets and the highly accretive nature of this program,” said Al Walker, Anadarko Chairman, President and CEO. “At the current share price, this represents approximately 10 percent of the company’s outstanding common shares, and we will initially target $1 billion of share repurchases prior to year-end 2017.
“Share repurchase is not much different from extended liquidation looked back on from far enough in the future.”
Nah. Old school thinking somewhat. If that were true, paying dividends would also be extended liquidation. Just a return of cash to the shareholders.
But, also old school thinking is that when a company buys back shares, it’s saying it can’t find anything else to do with the cash that would generate return on equity for the shareholders, so it will give the money to the shareholders to go seek their own returns. Nothing good about this, in the old school.
In the new school, it reduces share count and that underpins the earnings per share number a CEO can report to the board, especially when contract renewal is imminent. EPS puffery also may more closely align correlations with whatever index they want to point at.
The one thing that is curious is, as noted, a reduction of exploration. Executive bonuses seem to be production based, not earnings based.
The oil industry is as old school as anywhere you will ever find.
One thing interesting, Anadarko has been posting negative EPS. So, share buybacks will boost loss per share.
I thought when you were losing $$ the game was to issue more shares to decrease the negative EPS?
Per Morningstar, Anadarko EPS 2014 -3.47 per share, 2015 -13.18 per share, 2016 -5.90 per share, 1h 2017 -1.37 per share.
Won’t share buybacks only make the losses look worse? Appears this company is heavily bleeding. Over $15 billion of long term debt. BOEPD for 1st 6 mo. of 2017 avg. 731K, 1st 6 mo. 2016 avg. 809K, Q2 2017 avg. BOEPD 631K, Q2 2016 avg. 792K.
The cash appears to be from asset sales. So why not use it to pay down debt? I guess share buybacks is what Wall Street wants, shares were up 7.2% on the news per Seeking Alpha. Apparently Wall Street is pleased Anadarko will not, “merely drill for growth’s sake or M & A at any price.”
EPS is pretty meaningless to be honest.
What financial metric is meaningful for upstream E & P?
Quarter to quarter EPS can be skewed and even annual can be a mess due to impairments.
However, I contend if one totals 3+years of upstream EPS, there is something meaningful there.
Anadarko’s CEO is the one who told investors not to give them anymore money because more money raises production which ruined prices https://www.wsj.com/articles/wall-street-cash-pumps-up-oil-production-even-as-prices-sag-1499419801. They’re buying shares with borrowed money because they don’t want to drill and don’t know what else to do with the money. It’s a classic prisoner’s dilemma.
The obvious exit from the dilemma for Anadarko, of course, is to diversify — get out of the oil industry and buy something else — but I’ve realized that “oilmen” just *won’t do it* no matter *what*.
George,
From a 2014 article on the EIA site:
Most industry insiders expect the definition to revolve around API gravity, a standard measure of density with higher readings produced by lighter grades. Condensate is the lightest of the light.
However, deciding where to draw that line is likely to be a contentious process.
DEFINE ULTRA LIGHT
Refiner Phillips 66 and midstream giant Plains All American have said condensate is oil with an API gravity of 45 or above. Meanwhile, Marathon Petroleum Corp’s top executive said in a recent interview he believed condensate should have an API gravity of 60 and above.
Without a universal standard, production data vary wildly. The EIA’s own figures suggest that anywhere from 8 percent to 16 percent of U.S. crude oil production is condensate – a difference of more than half a million barrels a day.
Okay, US production 2014 was 8-9 mbpd. That “difference of more than half a million bpd” is low. 16% of 9 mbpd is 1.44 mbpd. 8% is over 700K bpd.
This is condensate from oil wells. Freddy shows Bakken wells GOR is climbing. It seems likely the 8-16% is, too. Well over 1 mbpd of the reported US 9ish mbpd is condensate. Note none of this is that reported from gas wells — apparently by standard in that gas wells liquids aren’t added(?)
But even if they are, that doesn’t matter. 1/9th and climbing of US production has nearly no diesel or kerosene.
One probably should wonder if Marathon’s executive bonus phrasing for production excludes condensate.
Everywhere I have ever worked defines condensate by where it is measured, not by it’s API. Liquids coming off of a gas well at the production facility is lease condensate. C2, C3, C4 coming from gas plant is NGL. Liquid coming from an oil well is crude. Everything else is gas, except I’m not entirely sure where they put the small amount of C5+ that comes off the gas stream in a gas plant (I think it’s counted as NGL). I don’t see how any other arrangement could work for royalties and when there are co-owners. The API thing doesn’t really matter much at the moment.
Actually back in 2014 in the USA there may have been bigger arguments about definition of condensate because condensate could be exported and crude couldn’t, so they may have tried to get a definition based on API for that use, but that went away when the export ban was lifted, I don’t think it’s a big deal anywhere else. I don’t see what the problem is with not having some cuts in a relatively small portion of world production, pretty well every where oil is getting heavier. What you are calling an oil well I think would be classed as gas/condensate and I tend to call gas for short. A typical condensate to gas ratio for a wet gas is 20 bbls/mmscf (a lot of shale gas is richer I think, below 10 is often considered dry and there’s plenty of that too). The US produces about 80bcfd, which would give 1.6 mmbpd – a bit higher than the actual numbers. It doesn’t come from oil wells.
The EIA article I quoted above was indeed talking about what could be exported and what could not. But that’s not what prompted the issue.
It’s shale. The Eagle Ford’s initial drilling were oil wells that were flowing high API liquids and it was called condensate. The geography down there even has lines on maps called “the condensate region”. The quantities were high. If the GOR from a shale well is climbing, as Freddy’s data shows, then almost certainly as we call that “associated gas”, high API liquids become associated with the gas, and it’s condensate, coming from a shale oil well. Not a gas well. I suppose if the GOR for shale wells gets up to 90% or something maybe you reclassify the well, but that wasn’t what it was on day 1.
In fact, now that I think of it, the “reclassification” thing became an issue in the shale fields. The companies resisted doing so. Oil wells were much easier to finance than gas wells. They didn’t want to report more and more wells becoming gas wells when they pitched for more loans.
I recall a blurb from the WestTexas guy Jeffrey that said “oil was getting heavier worldwide . . . until shale. Now it’s getting lighter”.
There may be areas between the oil and gas region for EF which have mixed liquid/gas in the reservoir – I’d call them gas/condensate or maybe an oil rim (in conventional wells the oil would be produced first but I guess you can’t do that in fracked wells – it all come together), but if you want to call them just oil then that’s OK too. I doubt if they are a big part of overall US production though. But overall why does any of this matter, there’s no shortage of gasoline or diesel, the stocks are still above average and there’s plenty of refining capacity, if there is more light stuff it might just mean less cracking is required in the refineries.
There is a very simple historical relationship between oil prices and interest rates, up to very roughly 10 years ago: increases in oil prices either caused inflation, or were associated with commodity price increases during high points in the business cycle. The Federal Reserve raised interest rates to combat that inflation. So, high oil prices both caused and were incidentally correlated with inflation and the resulting high interest rates.
There is also one event which causes an important confounding of oil prices and interest rates: the choice by the Volcker Fed to dramatically raise interest rates around about 1979. That was partly in response to high oil prices, but perhaps more importantly it was a major change in policy, in which the Fed chose to change inflationary expectations which had been building for about 15 years, during the Vietnam war and the loose money policies of the Burns Fed. That meant sky high interest rates for 3-4 years, which happened to coincide with a period of high oil prices.
Recently the Fed has decided to pretty much ignore oil-related inflation – that’s why it focuses on the “core” rate, which excludes energy and food. So, now we see much less correlation between oil prices and interest rates.
Yes, there is a big difference between how the Fed handled things in the 1980’s and 2010-2015. That’s why I’m speculating that interest rates were too low during QE http://peakoilbarrel.com/an-improved-empirical-model-for-oil-prices/#comment-615613. I think the Fed also ignored high asset prices. I think that much of the money injected into the economy went to people with money who used it to bid up asset prices.
“there is a big difference between how the Fed handled things in the 1980’s and 2010-2015”
Schinzy, clearly you won’t understand the difference between a bengal tiger exhibit and a petting zoo.
“In the late 1970s, in America, prices were rising fast. In other words, inflation was running rampant, usually thought to be the result of the oil crisis of that era, government overspending, and the self-fulfilling prophecy of higher prices leading to higher wages leading to higher prices. The Fed was resolved to stop inflation. So, Chairman Paul Volcker (who is pictured above) kept raising rates in 1980 and ’81, eventually bringing both the economy and inflation to a standstill.
Let’s take a step back for a moment. In general, over the long haul, interest rates are determined by the market. Think of a market interest rate as the sum of three separate factors: waiting, repayment risk, and inflation.
First, waiting — also known as the time value of money. Imagine an inflation-free environment, such as today’s. Which would you take: a thousand dollars today or a thousand dollars, guaranteed, a year from now? Unless you’re a very unusual person, it’s the thousand right now, so you can do something with the money. If you forgo the money, you generally need to be paid something for doing so, for waiting — in recent history, around 2 percent a year.
Second is the risk of not being paid back. This is why folks with low FICO scores have to pay such high rates of interest. This obviously varies enormously. But the U.S. government has generally been thought to pay the “risk-free” rate: 0 percent for risk.
The rest of the interest rate is inflation. If money is losing value and you lend it, you’re going to expect to be reimbursed for the loss.”
http://www.pbs.org/newshour/making-sense/what-led-to-the-high-interest/
“What are the Federal Reserve’s objectives in conducting monetary policy?
The Congress established the statutory objectives for monetary policy–maximum employment, stable prices, and moderate long-term interest rates–in the Federal Reserve Act.”
https://www.federalreserve.gov/faqs/money_12848.htm
I used to believe stories like that. Then I started thinking about the end of economic growth and I started wondering about negative interest rates.
One of the reasons Kenneth Rogoff advocates a cashless society in The Curse of Cash is because he thinks negative interest rates will be necessary to get us out of the next financial crisis.
In A History of Interest Rates, Homer and Sylla look at 5000 years of interest rates. The general pattern is that interest rates follow a U curve: they start high and then decrease, at the apex of the civilization they are at their lowest level and then they begin to rise.
I’m not sure the standard story will fit our future economy.
“I’m not sure the standard story will fit our future economy”
Why ? Do you think the fundamental rules of economics has changed in the last 10 years ? What next, Trump changing the laws of physics with fake news ?
“Homer and Sylla look at 5000 years of interest rates”
Oh please spare me, as if the interest rates of the Rome Empire are reverent today. Please let me buy your fish net and I will pay you back next year with my silver coins. Plus a couple of sea bass for good measure. Really.
But I have to admit, if the retarded right wing Conservative Republicans who don’t believe in Keynesian economics completely control congress in the future. America will turn into a sewer pit. It’s called fiscal policy, why wouldn’t the government build infrastructure at a zero interest rate and generate demand ? Oh, I forgot, their retarded.
“Then I started thinking about the end of economic growth”
Bud, you are living in the fastest technology growth in human history. It’s efficiency are holding back inflation and job growth. You need to turn off your Tverberg and see if you can enroll late into a Fall basic econ level course.
I told you. I used to believe their stories. I don’t anymore.
I made 13% per year investing in high tech between 1986 and 2002. No margin, no options, just straight stock picking. Sold everything in 2009. Absolutely no regrets. I’m becoming more efficient and less dependent.
There is a brutal law in science: if your theory is not compatible with empirical data, it’s wrong. Richard Feynman used to add:
“And it doesn’t matter who you are, nor how smart you are.”
What I can tell you is that the nascent trend in economics is towards empirical studies because of inconsistencies between neoclassical economic theory and empirical evidence.
Well for a guy who likes to buy during economic expansion and sell during a recession. You must be a fantastic picker to return 13%, because your timing sucks. After getting my head beat in during 08 with my refinery stocks. I’m up 10 fold since December of 08. See ya, wouldn’t wanna be ya.
*******
Substitute good
“A substitute good is one good that be can be used instead of another. In consumer theory, substitute goods or substitutes are products that a consumer perceives as similar or comparable, so that having more of one product makes them desire less of the other product. Substitutable producer goods would include: petroleum and natural gas (used for heating or electricity). The degree to which a good has a perfect substitute depends on how specifically the good is defined.”
https://en.wikipedia.org/wiki/Substitute_good
The world is evolving my friend. In 15 years, technology is only going to be producing electric cars and in 35 years, 95% of our new transportation network will be electric powered by renewable’s.
You Snooze, You Lose
*******
Every reason to drive electric
An impressive EPA-estimated 238 miles of range†. A beautifully sculpted exterior and spacious interior. With thousands of excited owners and millions of miles driven, Bolt EV has completely reinvented what an electric vehicle can be.
http://www.chevrolet.com/bolt-ev-electric-vehicle
Actually I don’t drive. I’m a French resident and don’t have a French drivers license. 4000 Km on a bicycle every year (I’m almost 62). I did cave and buy a pedelec last year to go to the tennis club. I’m glad to have the motor on the way back home after a hard match.
I’m sure they are nice, but 238 miles wouldn’t even make it to my vacation place in Texas.
Well, sure. What are the chances that any vehicle, ICE or EV, can go anywhere you might possibly want to go without refilling?
So, you stop for lunch for 40 minutes and recharge. No big deal.
Most of the time you just charge overnight in your garage, and never have to go the gas station. A big time saver.
Ok, pull in to Denny’s to eat, and plug in where?? Stop overnight at the La Quinta and plug in where? Ok, they have some La Quintas with ev charging, but not in all locations. It just doesn’t have the convenience factor, yet.
EVs don’t have to replace ICEs yet to have an impact. Most families have two or more vehicles. Have the EV for shorter trips and an ICE or hybrid for longer ones.
Yeah, a quick search suggests that there are about 160k gas stations in the US, and about 16k EV charging stations. But…that doesn’t include the 100M garages with power outlets.
So…
Have you actually looked to see how many EV chargers there are on the route to your vacation place??
And, what about the convenience of never having to go to the gas station when you’re not taking long distance trips? How often do you drive more than 200 miles in a day? For most people, that’s relatively rare. The rest of the time: no more stopping for gas.
HB is right – economic history based on agrarian economies isn’t relevant to modern industrial economies.
That’s a fundamental that many people (Tverberg, Diamond, Tainter, etc) just don’t get. That may be because they don’t have deep technical backgrounds, and don’t really understand the difference between biological energy and modern renewables.
Regarding analyses of the collapse of civilizations: pre-modern civilizations were primarily agricultural, and had very, very low growth rates. So, ag problems were key, and empires with high growth rates were essentially ponzi schemes, looting their neighbors until they reached a limit and collapsed.
Rome was an agricultural Ponzi scheme, as agricultural empires always were: when the underlying economic growth rate is .01% per year, an empire can only grow temporarily by stealing from it’s always expanding borders… and then collapse.
Any analysis of the growth and decline of pre-modern civilizations has very, very limited application to modern times.
I see a lot of similarities. I certainly don’t believe in infinite economic growth. Nor do I believe that our economic system will guide us to make the “best” choices when we start hitting serious resource limits. I’m interested in characterizing the end of the growth cycle in energy production. What effect will it have on the economy and our capitalist system?
“I certainly don’t believe in infinite economic growth”
We build machines to do our work for us. We’re human, that’s what we do !
and we’re dam good at it
Actually I can tell you what modern economies share with ancient agrarian economies. Equations (5.2), (5.7), (5.8), (5.9), and (5.10) from Oil
Extraction, Economic Growth, and Oil Price Dynamics. You will not find these in any economics 101 text book. But here is a bold prediction: in 15 years, you will.
We’ve been human for quite some time now. Building machines to do our work seems to be a recent characteristic. Like since fossil fuel became utilized. Before that we trained animals, and slaves, to do our work for us. Food was the fuel and slaves were the machines.
Are you by chance one of those ‘The Singularity- rapture for the nerds’ types?
“Building machines to do our work seems to be a recent characteristic”
“and slaves were the machines”
Well Einstein, I can’t figure out by your comment if you are supporting my statement or disagreeing with it. I was thinking the word “machine” in my comment as being inter changeable with the word tool. I really wasn’t thinking at the time about slavery. But I would say that works too. I’m sure back in the day, the master race thought of them as a machine or work animal.
Man invent the wheel some 5500 years ago. It’s what we do.
Machine- an apparatus using or applying mechanical power and having several parts, each with a definite function and together performing a particular task
characterizing the end of the growth cycle in energy production.
And what do you think about the transition from fossil fuels to renewables?
Hi Schintzy,
Well there are other energy sources besides fossil fuel (nuclear, wind, solar, hydro, geothermal, tidal, wave) and continuing improvements in the efficient use of energy.
Also for thermal energy (including internal combustion engines) average work per unit energy is about 33% with the rest being waste heat. As the World converts to electrical energy (produced by non-thermal means) energy losses fall to 10% or so, so total exergy (work energy) needs are only about one third of current energy needs and can be fulfilled with wind, solar, hydro, geothermal, wave, and tidal with maybe a small amount of nuclear backup (10% or less).
This is a conservative scenario, for more optimistic visions see Tony Seba.
For population see Wolfgang Lutz (peak in 2070 at 10 billion, with decline thereafter).
It’s not a Fed thing. Interest rates are even lower elsewhere. They didn’t wait to see what the Fed did to move their rates. Germany’s 10 yr is presently 0.4%. It was negative recently. That’s lower than the US rates.
Japan’s economy is far, far worse than the US. Their debt to GDP is enormous. 250%. The US is 100%. (Germany 60%). Japan’s deficit is 4.5% of GDP. US about 4%. Japan’s risk of default MUST be higher than the US because of these measures, but their 10 yr rate is 0% or negative. The US is at 2.2%.
Money ceased to have analytic meaning when QE began. It exposed the reality of whimsical creation.
Only oil matters. Money will never cause death of 60% of global population. How can it when it can be created as required? Oil scarcity CAN cause global population evisceration. And will. Soon.
“Money ceased to have analytic meaning when QE began. It exposed the reality of whimsical creation.”
Feel free to deposit any or all of your money into my bank account, if you have any.
Put your money where mouth is
Schinzy, a small suggestion: make the starting date for the X axis the same for both charts, maybe 1955 (I assume the parenthesis that shows a starting date of 1965 is a typo). It will be easier to compare them.
Whoops, yes it’s a typo. Used the wrong variable to make the graph.
Shale oil entrepreneur Harold Hamm is back doing interviews on the business networks again. Now he is speaking out against how the oil prices are low due to the EIA.
Shale Billionaire Hamm Slams ‘Exaggerated’ U.S. Oil Projections
https://www.bloomberg.com/news/articles/2017-09-21/shale-billionaire-hamm-slams-exaggerated-u-s-oil-projections
Billionaire oilman Harold Hamm says the government was way too optimistic with its prediction of more than 1 million new barrels a day in U.S. production, and the snafu is “distorting” global crude prices.
This year’s rise is likely to be closer to about 500,000 barrels, far off an initial forecast by the U.S. Energy Information Administration, according to Hamm, the chairman of Continental Resources Inc. and a pioneer in the shale industry.
The EIA projection is “just flat wrong,” failing to take into account a new discipline among U.S. drillers, Hamm said in an interview Thursday on Bloomberg TV. “We have capability of producing a whole lot, but you have to get a return on investment,” he said, adding, “that’s where people have been this last quarter and this year.”
The government scenario has contributed to worries about an oversupply that puts U.S. oil at a steep discount to international crude, according to Hamm. “It’s distorting,” he said. “When we’re lagging the Brent world price by $6 a barrel, that’s not putting America first, that’s putting America last. And that’s the result of this exaggerated amount that EIA has out there.”
Once it’s clear the EIA is off base, prices could rise to $60 a barrel from around $50 now, Hamm said.
The EIA is making these projections because knuckleheads in the C suite at US shale companies went hog wild at the first sign of oil price improvement and made these growth projections for their individual companies, and the EIA just totaled them up.
Every Shale CEO bashes OPEC. OPEC tried to give shale a break by cutting production, and shale absolutely blew it, just like shale absolutely blew it in late 2014 by not pretty much shutting down. Instead, shale has lied about profitability for 3 years, and the world E & P industry has paid the price.
Too bad Oilpro shut down. Lots of non-US E & P Industry folks posted there. They absolutely could not stand US shale and the US shale CEO smack talk. Hundreds of thousands out of work, because of shale smack talk and Wall Street encouragement of same, which crashed oil prices below $30.
Shale better come through. No one seems to be taking serious the possibility of a supply shock if it cannot.
When shale clearly peaks, what is to keep OPEC and Russia from suddenly making a big cut, driving prices past $200 and crashing Western economies? Why wouldn’t they afterthe hubris of US shale CEO’s, the Wall Street guys who pull their strings, and the US business media who report everything they say as gospel?
I’d guess a lot of the non-US E&P people complaining about LTO would by from offshore, and I think that side has been just as much to blame for boom and bust mentality with rose tinted specs. (see below the UK investment which went nuts when oil went above $100 and now they have nothing much left). I’d question with the jobs are going to come back offshore even with a big price rise. As I keep pointing out, there have to be discoveries before development, and there have to be lease sales before that. We’re not seeing either, and though exploration is down compared with 2011 to 2014, there’s still a significant amount going on, but wildcat, frontier success rates are what have fallen the most (even with the best seismic methods and computer models we have ever had).
Shallow, I too miss the hell out of Oilpro. That community could debate the unconventional shale phenomena without bias and with a clear understanding of how it has completely changed the world oil order.
American’s, on the other hand, simply enjoy cheap gasoline; they don’t care how they get it, what it costs, who ultimately pays for it or that it will not last forever. The American public, and the politicians that govern it, have been lied to and completely deceived about shale oil and shale gas abundance. It is a matter of American nationalistic pride to believe what one reads on the internet and to otherwise be stupid about our hydrocarbon future.
I suggested to you several years ago that OPEC and the rest of the world’s producing oil countries were not dumb; they read shale oil K’s and Q’s and have the same access to SEC filings we do. They know the shale oil phenomena is failing financially and that in the process America is drilling the snot out of its last remaining, bottom of the barrel oil resources. OPEC’s production cuts in late 2016, in my opinion, were an effort to give the US shale oil industry just enough rope to eventually hang itself. It has done just that; in the past 24 months it has bankrupted out on another $50B, borrowed yet another $50B and is now back over $300B of upstream long term debt with no current ability to pay that back. Hope (for higher oil prices) is not a plan. The Bakken and the Eagle Ford have peaked and now well productivity in the Permian is starting to fade. In a few more years the rest of the world will have the US right back it its teet and will dictate what the price of oil well be. I think in the next 12-18 months we are going to see big reserve impairments in the US, again, and a pretty big shale oil company will end up the toilet, bankrupt. They’ll be a bunch of fist pumping going around the world when that happens.
Harold Hamm is whiner; he has always blamed OPEC for lower oil prices, demanded that OPEC cut more production, he needs more pipelines, fewer regulations (where are those, by the way?), needs to be able to export his oil, warned OTHER shale oil companies in the Permian not to overproduce and drive the price of HIS oil down, the sun is always in his eyes…now its the EIA’s fault. He, like the rest of America’s shale oil industry, is desperate for attention and desperate for help. Once again, Shallow, you are spot on.
Mike. It might be worth mentioning here the recent judgment a small OK producer won against Devon Energy.
Apparently one of Devon’s high volume fracs destroyed one of the the conventional producers’ wells.
When I read about these frac hits, I really worry that US is not properly managing these shale oil resources.
From some reading it appears frac hits are a big deal in PB, and that just a few years in, PB shale could wind up unperformimg due to reservoir damage from these massive fracs.
What do you (or others) think?
I read it, too. Made me wonder how that would affect the Permian conventional production.
Mike
The latest from Alaska.
The Icewine#2 well was shut-in on 10th July to allow for imbibition and pressure build up to occur within the HRZ shale. Flow testing re-commenced on 31st August at 10:26 (AK time), and was suspended on 18th September (AK time).
The Joint Venture having assessed the current rate of fluid recovery and, despite several encouraging trends, made the decision to shut-in for the Winter period due to logistical reasons associated with ongoing testing in Arctic conditions. The main issue is that of freezing of the borehole fluid, predominantly fresh water from the frac, over the ~1,300ft permafrost zone due to the low rates of fluid flow observed towards the end of the current test phase. Additionally, winterized equipment deemed suitable for executing efficient artificial lift of the frac fluid is currently unavailable. The forward plan is to optimise and re-initiate the flow testing, utilising artificial lift, in April/May 2018 when weather conditions are more favourable.
Regarding the encouraging trends observed, a summary is included below:
Decrease in C1 (most recent average <91% vs 93% previously) and increase in C2+ components as a percentage of the gas flow, potentially trending towards the interpreted phase of hydrocarbon in the reservoir
Increase in the gas / water ratio such that as the water flow rate has decreased over time, the gas rate has remained relatively constant. It is still interpreted that additional fluid is required to be lifted off the formation before effective connectivity to the reservoir can be achieved with representative flowback.
The Icewine#2 well is located on the North Slope of Alaska (ADL 392301). 88 Energy Ltd (via its wholly owned subsidiary, Accumulate Energy Alaska, Inc) has a 77.55% working interest in the well. The well was stimulated in two stages over a gross 128 foot vertical interval in the HRZ shale formation, from 10,957-11,085ft TVD, using a slickwater treatment comprising 27,837 barrels of fluid and 1,034,838 pounds of proppant.
The well was initially flowed back on a 6/64 inch choke and was reduced to a 4/64 inch choke after 26 hours to maintain pressure. Approximately 370 barrels of frac fluid had been recovered as at 1730 on 3rd September (AK time) at an average rate of 100 barrels per day. The choke was subsequently stepped up to 8/64 inch at 1800 10th September (AK time) as the overall declining pressure gradient versus time improved, indicating potential pressure support. The choke was gradually increased to 10/64 and then 12/64 in order to lower the bottom hole pressure significantly below the reservoir pressure to increase the draw down on the formation. Consequently, the well head pressure fell below that required to support flow through the separator (~35psi) and the well stopped flowing naturally on 18th September 1630 (AK time), as expected, and was shut in. To date, the cumulative amount of stimulation fluid produced from both testing periods is 5,533 barrels, 19.9% of fluids injected.
Since the shut-in, significant pressure build up has already occurred, with current wellhead pressure over 739psi. This is consistent with the interpreted overpressure of the HRZ and is an encouraging sign.
A total of 16.57mcf of gas was measured as production since the 9th September, with an average flow rate of 1.79mcf per day. Results to date are consistent with several other early stage unconventional plays that have subsequently been proven successful; however, it is too early to tell the significance of these results for the HRZ play. As previously advised, the Joint Venture is of the view that greater than 30% of the frac fluid needs to lifted from the formation before gaining connectivity with the reservoir and achieving representative flowback.
pls keep posting these reports.
We’re also semi focused on what happens with the Caelus thing.
With the danger of making guesstimates from too few of examples, I will do so, anyway. There is no doubt in my mind that there is a buildup of DUCs, but where and why? EOG says they completed most of their DUCs, and they are drilling where we own in the Eagle Ford. They sold a small section of our property to a smaller outfit, which has drilled two wells there, and a multitude of wells close to it. None have been completed since the first of the year. Their drilling is funded by a third party. I think the buildup of DUCs may be primarily from the smaller operators. If I were them, I’d wait, also. At this point, I am happy that EOG has slowed down drilling on ours, too. EOG has reached the production point they hyped about, although net income is nothing to write home about.
After a stable plateau for the first six months Mexico’s production dropped in July and another big drop of 56 kbpd in August (down to 1930 from 2144 last year, or 10%). Some of it is maintenance, but the major turnarounds were meant to be finished in early August. Total liquids were down 75 kbpd from July to 2196 (10.8% y-o-y).
TRANSOCEAN RETIRES SIX RIGS, LOSES CONTRACT ON ANOTHER
http://www.chron.com/business/energy/article/Transocean-retires-six-rigs-loses-contract-on-12220763.php
George, you appear much more knowledgeable than most on non-opec liquid production. Do you have a guesstimate on when global inventories will normalize, and if we can expect a shortage after that point? I think they have already “normalized”, based on number of days in inventory.
I seriously doubt if I’m more knowledgeable than most on anything, however, my guess, which I haven’t changed in two years now, is that the second half of 2018 will see significant changes in the supply balance. That is when the train of projects started in the high price years passes the station. There are a few projects that have been delayed and carried over to late 2018 and into 2019 (Angola FPSOs and Big Foot on GoM) but the last two significant developments are Egina in Nigeria and the Khurais expansion in Saudi. After that there are odd projects each year (though some large like Tengiz). I think the crash is likely to be bigger than I previously thought because 1) the countries that could have been approving some developments to come on line in 2020 and later – Iran, Iraq and Brazil – have done pretty much nothing at all recently, 2) discoveries have declined so low now that there are very few projects that could be turned around quickly, 3) a lot of the deep water drilling rigs have been stacked and a lot of the big project development teams have been disbanded, and 4) the US LTO can’t seem to make money and might be running out of sweet spots.
That’s all on the supply side, I don’t know what is likely to happen on demand, but I don’t see any evidence yet of renewables having a big impact, but we might be due for a recession which would balance supply drops for a time I’d expect.
IEA and OPEC, and some companies, have also been indicating a likely supply shortfall becasue of under investment but they seem to be looking at 2020, and I haven’t been able to work out where they think the new supply would come from in 2019 unless it is projects still ramping up. I also think there’s a bit of hysteresis in the stocks – i.e. they have to fall below average before panic sets in, and release of strategic reserves might ameliorate things for a time.
Hi George Kaplan,
You are too humble. You definitely know more than many (or perhaps most) of us.
Yes, far too humble. It was my wild guess, based on all I have read. However, your mind has the capacity for far more details, and you can put it all together. I realize there is always the unexpected surprise, so nothing is written in stone. Thanks, a bunch!
On the demand side, it’s electric cars which have an impact on oil (renewables have an impact on coal & gas).
Mid-2018 would be a fascinating time for an oil supply shock because the electric car investment cycle is just getting going. At current capital investment rates electric cars won’t have a huge effect on oil demand for several more years (not until circa 2025), but an oil supply shock in mid-2018 would pump *hundreds of billions* more into capital investments in electric cars, which would take 2 to 3 years to pay off in increased production.
I agree, with one quibble: probably about 10% of oil is still used to produce electricity: grid power in KSA, Hawaii, Jamaica, Alaska etc.; industrial, commercial and residential backup power in China, India, S. America, Iraq, Afghanistan, Pakistan, etc.; and vehicle “house” power for pretty much all the vehicles in the world.
Solar is much, much cheaper than oil for power, and it will displace most of this eventually. PV is standard on RVs in Australia – I should think that commercial fleet vehicle buyers will eventually demand PV as a standard item. Hawaii is moving aggressively to utility PV – why KSA has been so slow is a really good question…
Jesus, the amount of money being burned in the oil and gas industry still astonishes me. I can think of a lot of industries where $1.4 billion could have built something *useful*.
Looks like ConocoPhillips is divesting its OK resource acreage and production. Wonder if this decision has anything to do with earthquakes and/or the adverse frac hit judgment against Devon Energy?
Take a look at the Oklahoma Energy Producers Alliance website. Frac hits are a big enough problem in OK that it appears this new trade group was formed to protect the interests of the small business conventional producers, whose wells are being destroyed by the horizontal well monster fracs in places like Kingfisher Co., OK.
Just updated this chart if anyone is interested. US ending stocks (weekly), the sum total of crude oil & oil products is 17 million barrels below last years low in October 2016.
Also, crude oil inventories often bottom in September but products inventories tend to see a low at the start of November
Chart on Twitter https://pbs.twimg.com/media/DKbNL2UW0AAmZJq.jpg
Don’t suppose you’ve kept a local record? Do they announce revisions? You can expect some when price doesn’t conform.
EIA revisions – I don’t think they revise the weekly inventory numbers?
I had a quick look at the weekly vs monthly crude oil ending stocks, just out of curiosity…
This is a better match. Monthly inventories are called ending stocks and the match looks better if the monthly data is shown on the last week of the month (nearest the end of the month).
Inventory numbers don’t get revised unless they find a mistake. They would likely use inventory numbers as part of the correction process for production numbers though.
Not gonna see diesel or kerosene shortage while 16% of domestic flow is condensate with none in it, and 84% has it. Plus the 60% of consumption imports with right and proper middle distillate yield.
But, that 16% is growing via shale GOR.
What we need is some Gulf capex. That stuff assays like Louisiana Sweet, plenty of middle distillates.
Schinzy – have you ever tried the model round the other way – i.e. predict a change os supply based on the oil price in the preceding years. From my perspective that is how the oil industry works, big projects are decided 5 years in advance, tie backs and brownfield one or wo years and LTO maybe six months to a year. The price then depends more on the difference between supply increment and demand increment.
Is there a factor for idiot statements we can throw in? Examples are: OPEC is establishing a cut in production, massive amounts of oil can be produced from the Permian at $40 a barrel, costs of deep sea drilling can now compete with the Permian costs, the US will be producing 10 million barrels a day by the end of 2018 at $50 oil price, well productivity can be measured by taking prior months production and using an estimate of current wells drilled. That kinda stuff. Come to think of it, it would pretty much resemble today’s price.
Given that production has increased as price declined, there’s no evidence of price relevance.
It would be from the price over several years previously, not just this year’s price.
Over 3 since mid 2014 when crash arrived.
Production rises.
Here is how this plays out. Folks who are deeply signed on to the theory of supply and demand or money deciding things regarding production wait and observe and declare that their truism applies in the long run. Then some event occurs that moves the price or moves production where they think it should be and the declaration is made that the long-run has arrived and they had it right.
Now, this situation might exist for one day or one week and then return to violating the presumed truisms, but because they got that one day they can lean back and not question themselves. Essentially, it’s been 3 years but the long run is defined as whatever period of time is required to get a desired result.
This happens in lots and lots of things. There is a veritable parade of analysts waving their hands over their heads right now about valuation of the US stock market. Valuation is P/E. One day someone will start a war. Prices will get smashed. And all of those guys will stand up and point at the valuation curves and announce that they were right. Valuations were too high.
Yes I said 5 if you read above – that’s how long major projects need to come on line, and once they are started they aren’t cancelled so they don’t respond to price signals anymore.
Hi Watcher,
World C+C output has been relatively flat since 2015, previously it had been rising from 75 Mb/d to 80 Mb/d over the previous 5 or 6 years (2010 to 2015).
There is also a well known lag between production decisions and changes in output in the oil industry. The thing about “truisms” is that they are often accurate. In some cases, a good theory can explain why they are wrong (heavy objects fall faster or the Earth is fixed at the “center” of the cosmos.)
See
https://www.eia.gov/totalenergy/data/browser/index.php?tbl=T11.01B#/?f=M&start=200001
Slight variation.
LTO planning would derive from what loans they can get, not what the price is, though you might imagine that the lenders decide based on price. No real evidence of that, though. Quite the contrary.
I haven’t. In fact that was the original goal: get a price from production, then get future production from the price. Then compute the future price and on into the future. But the last three years have rendered the task quite difficult. My strong suspicion is that when prices are low, producers push short term production has hard as they can and reduce longterm investment. I had not anticipated that investors also put their money in short term projects while dumping longterm projects (money has continued to flow into LTO but not so much into offshore). I had also not anticipated that bankruptcies actually increase investment flows into the business because investors think they can profit from the mistake of the previous investor. In short, I was amazed at the propensity of the financial sector to finance wells that probably won’t pay out. Makes me think I should try to figure out what will happen without a model. I’m wondering if LTO might be the anti-swing producer: surprising on the high side when prices are low, and surprising on the low side when prices are high.
For the time being I would like to understand the Fed rate better. Will the current model continue? Or will relationships change?
Well, you have to distinguish between short-term and long-term price expectations. Investment in LTO continues largely because investors expect higher prices in the long-term.
See my comment above about the paradox of official forecasts…
Nick, I think that I disagree with your statement. It seems to me to be akin to a farmer who expects corn prices to be depressed for at least 5 years and then to rise in the long-term. So he currently plants as much corn as he possibly can?
Yes, absolutely, if he can sell it for more than the marginal cost of planting. It’s worth it, even if it doesn’t cover the fixed cost of owning the farm, paying the mortgage, etc. It means being able to keep the farm and live another day. Debt may rise, but if prices rise sharply in 5 years and he can pay off the new debt at that point, it’s a success.
Now, medium-term may be a better way to put it, as I think most investors are hoping for a price rise well before 5 years out.
So what happens next?
Suppose, as I suspect, that prices stay below $65/barrel until 2020, then production suddenly falls and the price spikes to $100/barrel. LTO will have given disappointing returns to investors for over 5 years. Do investors jump in? Or not? Some may have run out of money to invest. LTO producers won’t be able to pull in new money via bankruptcy, creditors will cry foul. Their ability to attract new capital will depend on their debt load and their production. If new money comes in, will it go to LTO or to offshore?
News agencies frequently say OPEC wasn’t able to kill LTO by increasing production. They neglect to mention that OPEC with the help of LTO may have killed offshore which accounts for about 1/3 of world production.
Do investors jump in? Or not? Some may have run out of money to invest.
There’s always more investment capital for an attractive return.
LTO producers won’t be able to pull in new money via bankruptcy, creditors will cry foul.
I’m not sure what you mean. By the nature of the process, in general creditors won’t be able to stop bankruptcy.
This is precisely the situation that bankruptcy was designed for: to allow the elimination of old, bad investments to allow businesses to proceed with new (hopefully) good ones.
When it comes to LTO, there always seems to be money for an unattractive return. A lot of people have lost a lot of money.
There’s a lot of investors with a lot money out there, willing to make risky investments in hope of a good return. For a lot of investors, the US seems much safer than a lot of other spots. Heck, many of them are willing to park their money in the US for a zero return.
Why care about the Fed? Wouldn’t shale drillers borrow from Sumitomo or Barclays if they had a lower rate?
Because the Fed fixes the official dollar rate which is the oil currency.
Schinzy,
you may have read this:
http://bilbo.economicoutlook.net/blog/?p=35685
how do you think a “beautiful deleveraging” will work in the USA …….and how would they control import inflation from China ?
rgds
simon
Hadn’t read it. Have to think about it. In general deleveraging smothers the financial economy.
2017-09-25 UAE energy minister tells CNBC it’s too soon to talk about the impact of Kurdistan Referendum on oil market.
2017-09-25 Iraq oil exports via Turkey said to be normal as Kurds vote – Bloomberg
2017-09-24 BAGHDAD (Reuters) – Iraq on Sunday urged foreign countries to stop importing crude directly from its autonomous Kurdistan region and to restrict oil trading to the central government.
The call, published in statement from Prime Minister Haider al-Abadi’s office, came in retaliation for the Kurdistan Regional Government’s plan to hold a referendum on independence on Monday.
http://uk.reuters.com/article/uk-mideast-crisis-kurd-referendum-oil/iraqi-government-asks-foreign-countries-to-stop-oil-trade-with-kurdistan-idUKKCN1BZ0XV
2017-09-25 Flows of Iraq’s Kurdistan crude oil via Turkey’s port of Ceyhan remain normal as of Monday morning – shipping source – Reuters
Turkish president Erdogan is threatening Kurdish oil exports over the referendum, saying Ankara “controls the taps”. (Erdogan was speaking live on television). – Financial Times
Iraq may sue KRG over oil exports pending independence vote, official tells @PlattsOil
https://www.platts.com/latest-news/oil/singapore/appec-iraq-may-sue-krg-over-oil-exports-pending-27874544
Perhaps I’m simple minded. There are days I’m pretty sure of it myself, and at least a couple of regulars here who are dead sure of it, lol.
So far as my thinking goes, I don’t believe that it is POSSIBLE to explain the price of oil in recent years in terms that make ECONOMIC sense. A political explanation is called for.
Consider:
Every drop of oil that is produced necessarily must be SOLD, or put into storage FOR sale later, with the very minor exception of whatever amounts go into emergency stocks per national security measures in various countries.
I have YET to run across a single good article that indicates HOW MUCH storage capacity there is in the entire world,how much is being built, has been built, over the last few years, might be built in the near future, OR HOW MUCH SPARE STORAGE capacity exists.
So this lack of information creates some minor difficulty for me in thinking about the price of oil. Nevertheless it is a MINOR difficulty, because it’s obvious that the VAST majority of oil produced IS used up short term, with the typical barrel from the well being burnt within a matter of a few months or a year at the most.
Now let us just forget about why oil is produced, and in what quantity, for a few minutes, and come back to this part of the bigger question later.
Every barrel MUST be sold, eventually, unless somebody is dumping some on the ground someplace the way farmers dump milk once in a long while, or that I have dumped apples and peaches to get rid of them, because they were ALREADY produced, but the market price was to low to cover the expense of marketing them.
( It cost me a dollar to put apples in a card board box, and another dollar to ship them to a local market in small quantities, such as fifty bushels, and a dollar to five dollars , in larger quantities, to more distant markets, etc,and yes at times the wholesale delivered price has been less than boxes plus shipping.So over the road bank and into a gully they went, because they cannot be stored long term. We used to be able to ship to a juice plant, but imported juice has forced the price paid at the nearest plant below the cost of hauling our juice apples there in bulk, loose in a dump truck, more years than not over the last decade. )
Now to the point.
The most elementary possible interpretation of supply and demand tells us that every barrel produced MUST BE SOLD. EVERY barrel ( other than ones going into strategic reserves and so not really intended for sale) I repeat, MUST be sold, regardless of what it cost to produce it, transport it, process it, and eventually sell it. EVERY BARREL.
So if X barrels a day are produced, then on AVERAGE, X barrels MUST BE SOLD.
Now here are a couple more elementary level observations that cannot be refuted, so far as I can see. ONE, oil is free to travel, for practical purposes, from where it is produced to where it can be sold, with a few minor exceptions such as when a particular country may be embargoed by Uncle Sam throwing his weight around, etc. And even then, one man’s oil is as good as another man’s and embargoed oil has a way of finding a market, at a discount, displacing other oil not embargoed, etc.
So the consumers of the world, ranging from national governments and entities such as the Defense Department, right on down thru the giant chemical companies, air lines, trucking companies, farmers, and finally Joe Sixpack who wants twenty gallons a week,all the way to the Asian working man who wants only a liter a week for his scooter or kerosene stove or lamp, are free to seek out the lowest price possible, and they do so.
Basically what this means is that after allowing for taxes being different in different places, and the cost of shipping, currency manipulation, etc, the price of oil, in general terms, is the pretty much the SAME , WORLD WIDE.
This is so simple a concept that even a hillbilly farmer can understand it. If corn is selling in Roanoke Virginia for five bucks, and it’s selling in Nebraska for three fifty, and the cost of shipping from Nebraska to Roanoke is less than a buck fifty, Nebraska farmers ship to Roanoke. This concept is basically described by the term “hub” or market price, with every body knowing what the relevant LOCAL discount or premium is in relation to the hub price.
All the oil produced HAS TO BE SOLD, on a DAILY BASIS. Daily production MUST match daily consumption, on average , over any extended period of time. The consumers of the world will pay JUST ENOUGH to clear the daily supply on a daily basis, making room for tomorrow’s deliveries. NOT A FARTHING, a centavo, a penny MORE. But on the other hand, they can’t pay any LESS, or they won’t be able to buy any oil, lol.
I am eager to hear any sensible refutation of these remarks in respect to the CURRENT price of oil. Of course we all understand that the actual daily wholesale price will oscillate around the AVERAGE price, which is the “real price”, depending on various economic happenings, political happenings, natural disasters, etc. These oscillations may take place over a period of days to months.
If I’m wrong, I want to know NOW, rather than later.
If I’m right, so far, and we want to know why the price of oil is WHAT IT IS, then we need to be looking at the possible reasons the world’s producers ACTUALLY PRODUCE the QUANTITIES they produce, other than the usual profit motive.
OFM,
In some sense, you have hit the reason I thought these variables could give me the price of oil. I started from the premise that oil is the blood of the economy, or at least was during the 20th century. What does that mean? It means that to understand economic growth in the 20th century, you must understand the feedback cycle that produced more oil: why did producers produce as much as they did? That means you have to understand oil prices. But if oil produces the economy, then oil must in some way produce its own price. So I spent a long time in front of a graph produced by Jean Laherrère that looked like this: price vs quantities. It finally hit me that the derivative of production was key to getting the price. I discussed it with Aude who immediately agreed with me on seeing the graph and she came up with the regression that fit the data. The fit was as good as could be expected. Interest rates are a key factor in investment choices so I told Aude to add them to the mix, yielding the above fit. Now I hope to link interest rates to some other factor relating to the oil industry, perhaps marginal returns? This will give the key to understanding the subset of the economy powered by oil. So my reading is that though your question seems to be insurmountably complicated, somehow the answer is all contained in production data and the official Fed rate. Understanding this will lead to understanding what will happen to the oil fueled economy once the feedback cycle goes into reverse and production begins to fall.
“It finally hit me that the derivative of production was key to getting the price” would it be possible (and meaningful) to plot the growth rate of production vs. price? Perhaps with different time lags?
I’ve never studied it myself but yes population growth, GDP per capita, spare supply capacity and energy efficiency are all factors that have been in the news, might be worth a try 🙂
Same idea as George’s above.
I was thinking over my response to George and now I disagree with myself. I think it’s a good idea. I’ll talk to Aude about it.
One other thing I was thinking would be to look at non-OPEC and OPEC separately, or maybe consider OPEC as total capacity rather then just production. Non-OPEC kind of responds continuously to price signals, although with some pretty complicated lags, whereas OPEC can suddenly jump all over the place depending on what policy they decide on for the month.
Hi George
This article echoes your view.
https://www.energyvoice.com/oilandgas/151504/oil-trader-trafigura-heralds-end-lower-longer-crude-era/?utm_source=Sailthru&utm_medium=email&utm_campaign=EV%20Daily%20Newsletter%202017-09-26&utm_term=Energy%20Voice%20-%20Newsletter
Sorry George for copying you idea. My screen is rubish and it’s hard for me to see if there are new posts or not.
No problem – I’m not sure there are too many wholly original ideas anyway (great minds think alike and fools seldom differ etc.), and still fewer people who read all of every comment on any blog comment section.
Hi Schinzy,
Thank you for your reply.
It encourages me that you take my comments seriously, at least in this particular case.
I’m not an economist, or a statistician, or a professional in any field that would help me to any extent to understand the price of oil, except in one sense. I’m an old time generalist, a person of the sort sometimes referred to as a Renaissance Man, a person interested in everything.
The basic courses I took in economics didn’t extend so far as statistical analysis of the sort you do.
But one thing I have never forgotten is that when a student questioned the conventional understanding of supply and demand and PRICE, the professor said of course we economists aren’t idiots, we know that countless variable factors distort cause supply, consumption, and price to vary over time in ways that are extremely difficult to predict. We know that people and businesses aren’t always rational, and that in reality both producers and consumers sometimes behave irrationally for years and years, and that the profit motive is not always the primary motive for a producer.
Being a generalist, I pay attention to countless things that are simply overlooked by specialists, who in my estimation are all too often totally blinded by the trees which surround them, to the point that they don’t even REALIZE THE FOREST EXISTS.
I’ll sum up MY beliefs as to why the price of oil is what it is in a few sentences.
The price on AVERAGE cannot be higher than the price that clears the supply day after day, the price the consumers of the world will pay for the quantity coming to market day after day. That’s the upper limit. It can and does of course vary quite a bit depending on the aggregate purchasing power of the world’s consumers, both short term and long term.
Geology only really matters in determining the price of oil over longer time frames, and only when it limits production to an extent sufficient to reduce supply below the X number of barrels people want at Y dollars per barrel. If geology keeps the industry from producing that specific X barrels, then the price goes to Y PLUS, as high as necessary for enough buyers to drop out or cut back so as to stabilize or at least CAP the price, bringing the supply back into equilibrium with price.
Geology was PARTLY responsible for the big run up in the price of oil to over a hundred bucks, but that wasn’t really the primary factor behind this rise in prices, in my opinion. The oil was there, but the industry simply couldn’t get it out of the ground FAST ENOUGH, even though everybody was pumping flat out or close to flat out, with a few minor exceptions maybe adding up to a million or two barrels a day, as far as I can tell. Demand outran supply, with the higher price putting demand back into balance with supply. Eventually production rose high enough that the oil started backing up in storage, and combined with the economy adapting to higher prices plus maybe slowing down overall, the result was that the price crashed.
Now OF COURSE there are tons of things happening ALL THE TIME that cause supply, demand, and price to orbit around some theoretical magical point at which everything is stable and changes slowly or not at all.
An apple grower has more insight into these things orbiting a theoretical stable point than ninety nine point nine percent of the pundits who write about the price of oil, so help me Sky Daddy.
I KNOW as a grower that decisions made TODAY result in new production five to ten years down the road. I KNOW that the market can change abruptly, depending on political decisions made in various government offices in various countries, making my fortune, or wiping me out. I KNOW that people’s tastes may change, and that they may prefer and be able to afford more of other kinds of fruit, and so buy a LOT less apples. I KNOW that SOME growers are not necessarily primarily motivated by profit and loss in the short to medium term, but equally by a desire to WIPE ME OUT, and then sell to my former customers, thus EVENTUALLY making big profits.
Now let’s apply these insights to the OIL industry. First off, while in the last analysis the oil business is as brutally competitive as any industry, since oil is a commodity that moves freely in world markets, the PRIMARY consideration of the DOMINANT producers is NOT NECESSARILY PROFIT, at least not in the short to medium term.
If anybody anywhere, as a group, ought to be fully aware of this fact, it’s the members of this forum, but I SELDOM see it acknowledged, and for long stretches at a time, I’m the only person here who points out that oil price wars are economic and political war using oil as a weapon, and this use is getting pretty damned close to having the same effect as actual bullets and guns in some cases, with countries such as Venezuela caught in the cross fire, like an innocent kid in a riot or battle, with the people of Venezuela being written off and ignored as so called ” collateral damage”, in a very real sense.
We all seem to recognize that the managers of big INDEPENDENT oil companies are trying to run businesses that are NECESSARILY probably the world’s toughest, in terms of being able to make big changes in the short term in order to react to short term price movements and in terms of making investments TODAY that may or may not pay off ten years or more down the road, etc.
What we FORGET, as a general rule, at least as evidenced by the lead articles and the comments, is that the oil industry is dominated not by independent companies where the name of the game is the BOTTOM LINE, but rather by national oil companies managed in the LAST ANALYSIS by politicians who understand that they need to make a profit on their oil, over the long term, YES INDEED.
But in the SHORT TO MEDIUM TERM, their primary consideration is to remain in power, meaning both personally and nationally. They want their countries to be SECURE, economically, and militarily as well. The Russian oligarchs and Putin and company have no desire to live as exiles, they LIKE it in Russia, where they can do as they please. Ditto the thousands of royal princes and princesses of the House of Saud. Vacations yes, in London,Paris, yes, live there under different laws, NO in most cases. The elites are GODS at home, in practical terms, in such place as Russia and Saudia Arabia.
The biggest thing they apparently have in common is that they hate and fear each others guts.
They have demonstrated that they are perfectly willing and able to wage war, economic and political,almost up to the point of actual COMBAT.They have been and ARE selling oil DIRT CHEAP in order to maintain their market positions, and to do as much harm to their enemies, real or perceived, as possible in the process.
Then there’s the obvious fact that while it’s not good to sell at low prices that result in extremely low profits or actual losses when all costs are factored in, it’s NECESSARY to sell, in the case of most producers, so long as selling results in short and or medium term cash flow, because the vast majority of producers, independent or government owned, are DEPENDENT on that cash flow for their day to day SURVIVAL.
Note that I haven’t even MENTIONED all the additional considerations a politician must deal with, in a country that owns it’s oil industry, such as political infighting, the need to keep the people and the workers in the oil industry happy, keeping close friends and allies happy, etc etc.
And allow me to mention once again that the time lags involved in the oil industry are among the longest of any industry, and that HISTORY which we tend to think of as CURRENT EVENTS is moving so fast that the theoretical balanced market is simply a fiction these days in terms of oil.
Many industries have over expanded, and are contracting, others are growing like crabgrass in hot wet weather. The market can be in damned near perfect balance in terms of super market retailing of food, because a supermarket can be opened or closed in a matter of a few months. It’s a matter of a few YEARS in the oil biz, and circumstances have been changing faster than the industry has been able to react, even if it were dominated by RATIONAL managers, rather than politicians. I’m not saying politicians aren’t rational, at the intellectual and personal level, but rather than they base their policies on considerations other than profit and loss to a HUGE extent.
Well as usual I’m running off at the keyboard, but the BOTTOM LINE is that the price of oil, in the last analysis , over the last few years, has been determined MOSTLY by historical accident and by political considerations at the EXECUTIVE level in a few countries such as Saudi Arabia and Russia, rather than the usual factors such as profit and loss, etc, which dominate in the opinion of the typical analyst or pundit.
Geology has played a major role RECENTLY in that Yankee tight oil showed up as a wild card in the game, and nobody much really expected it to play a big role until AFTER it ramped up.
Sometimes the politicians create history, proactively, but most of the time they are reacting to it.
And Schinzy, you are DEAD right that oil in a very real sense creates its own market.
Serious thinkers realized the nature of this particular truth in more general or abstract terms a thousand years ago, at least, and probably well before that, but their thoughts may not have survived from further back .
“The river shapes its bed. And the bed shapes its river. ”
This is paraphrased, I can’t remember the original source, but it’s an old oriental quote.
Geology has to do a lot with oil prices – the run up in price the last 40 years is mostly due to geology.
Why? The original oil was the kind of very conventional land based oil. Once discovered, the most costly thing was the infrastructure to transport it away.
This came to a limit in the 70s. After this, more and more expensive projects where necessary.
Off shore oil, deep sea oil, small spots on land, arctic oil and last fracking oil. And old fields with injections, infill, pressure control.
All things with big investments – much more than “we build an oil terminal for supertankers and drill a few holes”.
And so the market gets more and more unstable – these big investments have to pay out, even when done by a state. And you have bigger and bigger planning time lags, so the classical pork cycle can get investors in the false moment.
US fracking oil adds to the chaos – it’s expensive, but fast rampup – but not able to replace deep sea oil due to it’s pure size.
Old cheap fields are in decline, or not longer cheap as the chinese giants on secondary or tertiary recovery enhancements. So more and more expensive technology with long planing horizonts comes to a short paced market, together with the political chaos describes by you.
And geology gets more complicated, so the long project times you describe will get longer.
I, without a mathematically model, expect a chaotic market in the future until oil gets (hopeful) phased out and put in the steam engine age.
Low oil prices make high oil prices, and high ones low. The demand is very inelastic on the short term, trucks have to drive and people have to drive to work (and the aunt wants the chrismas visit). Only mid way demand gets flexible, a japanese car instead a SUV next or a house nearer at the job. Or a company reduces work travelling.
Many 3rd world countries have regulated gas prices – so a price spike don’t reduce demand here on the short term. That makes things even more scary when something happens on the political scale.
Venezuela dropping to 0 while the Lybian civil war flames up again – and there isn’t 3 MB/D spare capacity left. Nobody besides SA perhaps does frenetic infill drilling for capacity he don’t need and use. Or develops fields and put them on idle.
Venezuela is the best example of low oil prices making high one – the production will halt sooner or later.
Not so sure on Venezuela —-
Senators have pressed the Trump Administration to review the chances of Russia’s Rosneft acquiring Venezuela’s PDVSA and its US business, Citgo. Marco Rubio and Bob Menendez believe a change in the ownership of Citgo’s assets would constitute a security risk.
And with the completion of the Chinese Heavy Oil Refinery next year, dependence on US refinery operations will be eliminated for the most part.
With 4 billion in bond payments due, thing are going to get even more interesting.
It will be more of an all out civil war – rebels would interrupt the oil pipelines by any means, to topple the government faster. I think the country is short before revolution.
Very few right wing revolutionaries.
The French, Russian, Mexican, Chinese were all from the Left.
You can make a case for Spain and Franco’s Fascist take over as coming from the Right, but those were paid North African Mercenaries who did the fighting.
Italy and Germany were semi political takeovers from the Right, with corporate and church interests.
Right Wing Death Squads from Colombia are a possibility.
Right wing revolutionaries are actually fairly common, but they never *call* themselves revolutionaries. Something to do with the nature of right-wing politics.
I more or less agree with what you say except for the part about investments that have to pay out.
I put it this way: peak oil is about extraction price increasing faster than market price. Extraction price rises because of geology. When the price of oil is high, it causes the economy to adjust in a way that will lower market prices.
I think I sense an implication that high oil prices will necessarily slow down the economy. I’d disagree. High oil prices COULD act as a brake on economies, but it’s complex.
First, most analyses are really looking at oil importers, not the world economy. High oil prices will shift income from Maine to Texas, from Greece to KSA, from the US to Russia, etc. That will cause slower growth in Maine, Greece and the US and higher growth in Texas, KSA and Russia, and it might not affect the world economy at all. OTOH, it could cause disruptions, if the rise was fast and high enough.
Remember, the Fed is no longer worrying about oil-induced inflation. So, the chain of effect from oil prices to inflation to higher interest rates to recession is now broken.
Second, responses from consumers and importers will vary depending on their perception of the problem. If they see the rise in prices as temporary, they may do relatively little but pay the piper. But, if they see the rise as part of a larger problem with oil & FF, they may shift away from oil to substitutes like EVs. That shift is underway right now, but it’s slow. It could accelerate very quickly, depending on politics and perceptions. And, that would greatly reduce the long-term impact (and duration) of high oil prices.
All empirical data points to the derivative of the economy with respect to oil production to be positive. Suppose oil supply decreases by 10%. Let us make the assumption that this decrease causes the price of oil to double. Let us also assume that this causes the economy to contract by 2%. Applying Equation (5.7) of Oil Extraction, Economic Growth, and Oil Price Dynamics we find that the cost share of oil must increase by 84%. Let us put the original cost share of oil at 5%. Then after the drop in production, the cost share of oil will rise to 9.2%. This means that the non oil sector of the economy must contract by 6.4%. In my opinion, the transition will be quite painful provoking bankruptcies and lost jobs.
The dynamic production function equations are quite informative and apply to all economies: past, present, and future.
Well, we have a number of questions to address, but first of all, here’s an important one: are we talking about the US, or are we talking about the world???
If the price of oil doubles, then the amount of oil money sent from the US to Canada (and other exporters) will double. The US economy will be hurt, but the Canadian economy (and KSA, Russia, etc.) will be helped. The world economy may not change at all.
Let me put it in different words: an increase in oil prices means a transfer of income, but the overall income stays the same.
In the short term, that will mean that oil exporters will accumulate assets, like T-bills, and oil importers will have more debt. In the longer term, oil exporters will start to buy more (other) stuff from oil exporters, and the trade balance will normalize. Right now, the process is going in reverse, with KSA running a deficit and spending down it’s assets.
So. Are we talking just the US, or the world??
Let me say it in another way:
If the price of oil rises, that doesn’t mean it’s *cost* rises (very fast short term increases in the cost of finding and extracting oil are unlikely). So, if it’s cost doesn’t rise, that means that oil’s share of the economy has not risen. It only means that the owners of oil wells now have a larger claim on other people’s income.
Now, if we have 10% less oil, that means we have to consume 10% less oil. That means someone has to use less. Does that mean less freight getting delivered, or fewer people getting to work? Probably not. It probably means truck and ships moving a little slower (MPG drops quickly with speed), and some people carpooling to work or using the family Corolla instead of the family SUV.
So, one more time: are we talking about just the US, or the whole world??
“I think I sense an implication that high oil prices will necessarily slow down the economy. I’d disagree.”
Hi Nick, in early 2015 after the drop in the price of oil. It actually slowed the American economy down for a while. Which caught a lot of analysts of guard. The oil industry was cutting capex and laying off faster than the stimulus from lower energy costs could off set.
Also, the rise in oil price ten years ago stimulated the American economy with the capex investment increasing American production.
It’s never simple, I agree with you.
Yeah, the capex multiplier is a powerful thing.
Hi Uenspiegel,
“Geology has to do a lot with oil prices – the run up in price the last 40 years is mostly due to geology.”
I agree with this remark.
I should have made it clear that I meant geology didn’t have a hell of a lot to do with the last big run up in prices when oil went from twenty or thiryish to over a hundred. The oil was there,production was being maintained, but production wasn’t increasing at a fast enough rate ( my interpretation of the facts ) to keep the price from climbing right on up there.
Eventually, though, the producers did catch up, and raised production high enough that they created a glut, relative to hundred dollar oil.
That’s my mistake, from being half asleep and running off at the keyboard and not putting a long comment aside and reading it two or three times before posting it. My bad. My hours are sometimes VERY irregular, depending on the home front domestic situation.
Actually I don’t have any argument at all with any part of your comment.
We’re basically saying the same thing, reaching similar conclusions from somewhat different but not really conflicting observations of various facts.
“I, without a mathematically model, expect a chaotic market in the future until oil gets (hopeful) phased out and put in the steam engine age.”
This is my explanation,in your words, in broad terms, for why the price of oil has varied so much, especially over the last decade or two.
I expect this price roller coaster to continue to run, lol, as you do.
In the broadest terms, geology determines the cost of production, and in the broadest terms, production MUST be paid for, or it declines, and as the old easy oil depletes, more expensive oil must take it’s place, and the price MUST go up, on average to maintain production.
We could go on all day, talking about higher cost producers being either in the red or the black, and trying to hold on when in the red to get back into the black, and so forth, and lots of other relatively minor considerations, such as currency manipulations, natural disasters, etc.
These things don’t matter much in terms of the big picture over time as I see things.
OFM,
First of all, let me tell you that I take what you say very seriously and read what you have to say with interest unless you run on too long. But I always find your posts entertaining, even when I give up on one of your heartfelt run on rants, I do so with a smile. I work in a university and so I am insulated from life in the real world by which I mean life in which people actually produce things and exchange them for money to make a living. That is a big reason for which I read this blog. My best insights are simply translating what real world people say into a university vocabulary (such as an equation). I also hear exactly where you are coming from because my brother in law also grows apples and your points of view are similar, lol.
Now let me say that what models are good for, is to simplify and get to the core of the problem. Models keep you from being distracted by peripheral events that seem relevant but actually are consequences of core elements. Models also help make assertions precise. If someone says what do you mean? You plug numbers into your model and see what comes out. Then you can say:
“That’s what I mean.”
I appreciate the value of models, for precisely the reasons you outline.
The big problem with models, which is of course perfectly obvious to an academic such as yourself, is that if your assumptions fail to hold, it’s good data in but garbage out.
Laymen just don’t seem to be able to appreciate this obvious fact.
The reason oil price models have performed so poorly over the last few decades, in my own opinion, is that the political, economic, geologic, technological and other factors have been changing so much and so fast that nobody has been able to estimate them correctly.
The state of the world is tending toward chaos.
And my opinion, for what it’s worth, is that things are going to grow ever more chaotic in coming years.
How’s the race between depletion and electrified personal transportation going to work out ? Who knows ? There are reasons to believe anything you want to believe in this case………….
Kurdish referendum gets 93.29% yes in 2.82k votes counted
http://www.rudaw.net/english
ERBIL, Kurdistan Region – The Kurdish Prime Minister Nechirvan Barzani has said that Erbil has never been a threat to Turkey, and will remain to not be so, adding that Ankara should also understand that they have no better friends in the region than the Kurdistan Region.
http://www.rudaw.net/english/kurdistan/250920171
This is a bit boring and so don’t read it unless you are really keen (& not read it before etc)…
The relationship between stocks (stock market) and oil prices
Ben S. Bernanke – February 19th, 2016 – The Brookings Institution
As we mentioned earlier, the positive correlation of stocks and oil might arise because both are responding to underlying shifts in global demand. For a simple test of that hypothesis, we apply a decomposition suggested by James Hamilton, a macroeconomist and expert in oil markets at the University of California-San Diego. In a post from the end of 2014, Hamilton proposed estimating an equation relating changes in oil prices to changes in copper prices, changes in the ten-year Treasury interest rate, and changes in the dollar, then using the value of the oil price predicted by that equation to measure the effect of demand shifts on the oil market. [2] The premise is that commodity prices, long-term interest rates, and the dollar are likely to respond to investors’ perceptions of global and US demand, and not so much to changes in oil supply. For example, when a change in the price of oil is accompanied by a similar change in the price of copper, this method concludes that both are responding primarily to a common global demand factor. While this decomposition is not perfect, it seems reasonable to a first approximation.
https://www.brookings.edu/blog/ben-bernanke/2016/02/19/the-relationship-between-stocks-and-oil-prices/
Regression of log changes in oil prices against log changes in copper prices, log changes in the dollar, and raw changes in the ten-year Treasury yield.
updated chart on twitter https://pbs.twimg.com/media/DKoWoyPXoAA7_k_.jpg
WTI vs DBB ETF holds futures for three equally weighted metals — aluminum, copper and zinc
Someone ask Bernanke how his relationship holds up when the Swiss National Bank buys equities on the basis of no valuation judgement whatsoever. Followed by the European Central Bank and followed by the Bank of Japan.
Ive not had time to look at this yet, it sounds good but Texas isn’t included…
EIA – Today In Energy – September 26th, 2017
The National Oil and Gas Gateway is the first publicly available website with oil and natural gas well-level data from multiple states. The website was created as a collaborative initiative among the U.S. Energy Information Administration; the Groundwater Protection Council (GWPC) and its member states; and the U.S. Department of Energy’s Office of Oil and Natural Gas, part of the Office of Fossil Energy.
Well-level data in the Gateway are updated monthly by the participating states. Ten oil- and natural gas-producing states are currently submitting monthly data to the Gateway: Alabama, Arkansas, Colorado, Kentucky, Mississippi, Nebraska, New York, Oklahoma, Utah, and West Virginia.
https://www.eia.gov/todayinenergy/detail.php?id=33072
I wonder how long it will take the Trump administration to realize it exists and sabotage it and shut it down.
Not as long as it’s going to take you to realize Trump is President because of people like you.
Dims shoulda gone with Bernie. If they had they’d be in the White House.
Oh another Bernie purest with a gun and no foot
Truth hurts. If you want to win then pick a winner. HRC lost. Deal with it.
It’s your foot, you don’t hear me complaining “poor me, I don’t have a job”
And you don’t hear me making the same complaint either. I’m not sure what you’re on about, is DT vs HRC supposed to be impacting my career? My job is not impacted by who the resident of the White House is.
If the Dims had gone with Bernie then the Dims would be in the WH. But they went with HRC, and they’re not in the WH. It’s hard to win when you field a loser.
While I generally view reformist politics only valid on the micro level, and minimally at that, there is no doubt the Bernie would currently be in the White House if the Dim establishment would not of sabotaged him.
But the current neoliberal Dims have more in common with Trump than Sanders, so we can see the result.
On a Macro level, Trump is probably the ideal choice, as he is bringing the delusions into view, and faster.
The Dims are just a slower death.
Glad to see you’re still around HB.
Of course the flip side of your argument is that Trump is president because people like you supported HRC, who was the most unpopular D , in terms of her overall approval rating with the voting public, to ever get the D nomination, which she got as a classical insider politician, via machine politics.
I will go off to the great recycling center in the sky, or at least the small one on top of the hill where my folks are usually buried, firmly convinced that virtually any OTHER nationally known big D Democrat, including my guy Bernie, although he calls himself a socialist, would have mopped the floor with Trump, who likewise was the most distrusted and disliked person, electorate wide, to ever get the nomination of the R party.
You won’t ever face up to it, but HRC managed to lose to the least trusted, most disliked R ever to run. Ya have to be a real stinker to lose to the worst the opposition has ever offered.
George Clooney came out the other day and said it straight up, she simply failed to inspire anybody.She couldn’t set a pile of gasoline soaked rags on fire with a blow torch.
So tell us true, HB.
What do you think of Comey going after Trump to the point he got fired for it, with the result being that now Mueller is going after him with an even more investigative powers ?
Do you still believe federal investigations involving breaches or suspected breaches of national security regulations are only directed at women and Democrats?
“she simply failed to inspire anybody”
Your an idiot and a fool. She got 3 million more votes than Bernie and Trump each. Your blind self righteous hate runs deep. You post the same corrosive fake information like Javier.
I’m not going to post any more politics in this thread, that’s what the other one is for.
See you there, HB.
The Kirkuk-Ceyhan pipeline runs from northern Iraq to the port of Ceyhan in Turkey, and is the main route by which light sour Kirkuk crude leaves the Kurdish region.
We can see from our ClipperData that over 500,000 b/day of Kirkuk crude has been loaded in Ceyhan so far this year, after being delivered via the Kirkuk-Ceyhan pipeline. The crude then heads to destinations predominantly in the Mediterranean:
ClipperData – September 26th: http://blog.clipperdata.com/changing-iraqi-crude-flows
Russia’s Gazprom Neft, which operates the Badra field in southern Iraq, said the 1.78 million barrels dispatched to the United States on the New Solution tanker represents the largest maritime shipment ever to a foreign country from its Iraqi subsidiary.
Interesting—-
USA barrels at anchor. There are still approx 28 million barrels above average (anchorages + ports), waiting for refineries to return to their normal rate of crude intake.
Schinzy – I’ve been reading through your paper a few times over the past couple of days, both sober and a bit more mellow, which I think always gives a different perspective. I’ve read and generally agreed with a lot of the references and it does a great job of bringing all the threads together in a coherent and mathematically based way (not that my opinion means much one way or the other). A couple of quotes have really stuck:
The paper concentrates on oil, but mentions food, and gas and coal (or energy in general I guess). There are extremely strong correlations between all these. They tend to go up and down together, in particular I’ve noticed how deflated FAO index and oil are linked (see below). Do you think that effect would actually tend to mean the impact of oil decline would actually be higher than you predict, or is that already implicit in the correlations you use (at least for a growing economy). I can see a decoupling where food price can increase despite oil price declines, but not so much the other way.
I think the short-term thinking you quote will mean all consideration of climate change is likely to take a back seat at the first sign of major hardships, and the first thing anybody with the possibility (e.g. USA, UK) will do is turn back to coal. Do you have any thoughts on that?
Also I think a decline period is likely to be much more volatile than growth, and I’ve been trying (unsuccessfully so far) to see if your correlations would be able to catch that – it’s like you’d need third and fourth derivatives.
You seem to go with an expectation of a production decline after 2020, is that just based on Rystad reports or have you made your own evaluation as well? There are reports coming out now suggesting quite significant shortfalls by 2019, and I think the way discoveries and investment decisions have been so low over the last two years tends to support that (and also possibly a steep decline).
One complementary book I read at about the same time as Secular Cycles was Sex and War by Malcolm Potts: it kind of looks at things when they really go wrong a lead to war. The essentials of fuel and energy really only go towards maintaining reproductive rights in a community, once things decline to the extent that those rights are threatened then it can go bad fast – e.g. when things get bad enough communities will always (100%) move, even if it means fighting and a high risk of death, I think that is what we are now seeing with mass migration, and it’s still early days.
I’m going to read it a couple more times, things take a bit of time to get through these days but I think there’s more stuff there to clarify things, or maybe raise questions (also only one, I think fairly dismissive, mention of GDP in the whole paper, which is quite refreshing).
George,
Thank you for taking the time to read our paper. Somehow I can’t get my
answer to stick, each time I paste the answer disappears into cyberspace.
Trying again.
Concerning oil supply projections, I make none myself. Your supply forecasts
seem to make very good sense and from my vantage point seem as good as any.
The IEA has said that “supply will have trouble meeting demand in 2020”
without really saying what that means. I think Aleklett and someone, maybe
Campbell recently estimated peak oil at 2016. I am becoming cautious. In
2008 I was talking about 2012 from reading the oildrum. In 2012 I talked
about 2016, now I’m seeing 2020. Dennis puts it at 2023. We will see.
I completely agree with you when you say climate, and more generally,
environmental considerations will take a back seat in times of scarcity. One
thing I expect is poorly plugged wells. Nevertheless I do not see much of a
future in either coal or nuclear energy. There are three reasons for this:
First, coal has been giving symptoms of peaking before oil. Coal production
was down 3% in 2015 and 6% in 2016. US coal production is down around 40%
since 2010. In 2015, according to Wood Mac, 2/3 of the world’s coal mines
were unprofitable. Three of the top 4 US coal producers are in bankruptcy
proceedings.
The second is the structure of electricity markets. For the time being the
wholesale price of electricity is computed from the marginal price of
production. This gives an enormous advantage to renewable generation for
which the marginal cost of generation is essentially zero. The more
renewable generation there is, the lower the wholesale price is. This in
turn means that no one is making money on the wholesale market, so that
private investors will not put down any money unless they have some sort of
market guarantee. Large power plant construction will not go forward without
public support
(see https://www.theguardian.com/world/2017/jul/05/g20-public-finance-for-fossil-fuels-is-four-times-more-than-renewables.
On the other hand, I know lots of people putting in renewable energy.
The third is that the trend of coal and nuclear power is more expensive
while the trend in renewables is less expensive, and I think these trends
will continue. Because of these trends it makes no sense to build coal or
nuclear power plants which have a life expectancy of at least 40 years when
they might not be competitive in 15 years. Let me add that I think the trend
will continue because of technology breakthroughs in electricity storage.
Flywheels are already half the cost of chemical batteries over 20 years when
they are applicable. A French engineer is advertising dividing this cost by
10 in 5 years
(http://www.energiestro.fr/technologie/.
Heat pumped electrical storage
also looks promising.
With respect to volatility, I think you are right to expect higher
volatility and that it doesn’t appear in the model. My WAG is that the
higher volatility comes from the financial economy and that there will be
some sort of coupling of our model with the financial models of Steve Keen
which do produce volatility. But I have not yet looked at his models closely
so this remains a WAG.
As to which shortage will bite first the hardest, I think you’re spot on
noting that food prices follow oil prices. What will happen? Solutions are
not unique. Lessons from the 20th century: N. Korea and Cuba saw their oil
supplies halved almost over night with the fall of the Soviet Union. In N.
Korea, 3 to 5% of the population starved to death. In Cuba, the country very
much against its will changed agricultural policy and turned to local
production of food using eco-agricultural techniques. It partially reversed
these policies when more oil started flowing again. Japan joined WW II very
much in order to secure resources for its development. The Soviet Union
collapsed. Because of these examples I support
the transition town network.
George,
I’ve tried to answer this quite a few times but don’t see my answer after reloading the page many times. Now the software is preventing me from posting the reply because it says the reply has already been posted. I may have to wait for the next post to answer.
Thanks for the reply – both in the spam cue, I think because you have so many links in them – I clicked ‘not spam’ but not sure what is supposed to happen now – it’s gone from the spam cue but hasn’t appeared here. I’ll leave the other one alone – I can read it direct in wordpress, but others might be interested so try removing the hyperlinks – put a space in or remove http or whatever people do, any interested can just copy and paste.
Hi George,
After you take something out of “spam”, it goes to pending, then you must approve it once again and it will appear, at least that is how it is supposed to work.
MARKET SHOULD PREPARE MORE FOR OIL SQUEEZE THAN OPEC SUPPLY GAIN, CITIGROUP SAYS
http://www.worldoil.com/news/2017/9/26/market-should-prepare-more-for-oil-squeeze-than-opec-supply-gain-citigroup-says
IEA OMR September Public Edition available:
https://www.iea.org/oilmarketreport/omrpublic/currentreport/
IEA Oil Market Report, OECD gasoline and distillates inventories
Crude oil, on Twitter: https://pbs.twimg.com/media/DKvJMjKWkAA4pPw.jpg
Energy News – I think you should consider putting your data for stock levels from different sources in a single post – maybe highlight what is known, and is consistent, and what isn’t, and also where the trends might be pointing.
EIA twip this week had crude down 1.8 mmbbls, gasoline up 1.1 and diesel down 0.8 (down 1.5 overall. The two products are no pretty much in the middle of the five year range. Crude is at the top of range – did they release any strategic reserve? If so it seems a bit of a waste of time (which is a tautology for anything Trump does – or maybe it’s the best you can hope for with him).
US have strategic crude oil stocks, not products. A couple of million barrels of crude was released as a result of Harvey. This was because a handful of refineries were functioning but they were short on crude (pipeline issues or crude onboard tankers that could not unload due to the weather). Refineries lend oil so the SPR should be restored with an equal amount. Not sure if they will do that this time or just pay for the oil instead and leave the SPR at a lower level, since US intend to sell part of it.
Yeah the SPR release after Harvey is finishing now, it reached 5 million bs…
Bloomberg reporter – The Department Of Energy has almost delivered the 5 million barrels of SPR crude that were requested after Harvey. Mostly to Marathon who got 3 million b. Valero got 1 million b
I’m waiting for the EIA’s monthly crude storage number before I update any more charts.
As you know there are a lot of unkowns, like the commercial storage tanks that don’t publish data.
For example I’ve not seen data for these – The Caribbean is said to have 100-million-barrel storage tank capacity.
https://www.reuters.com/article/storm-maria-terminals/update-2-caribbean-oil-terminals-make-preparations-ahead-of-hurricane-maria-idUSL2N1M018L
Also waiting for news on China’s SPR, seems to be every 6 months and so the next release should be late October.
2017-04-28 Reuters – China strategic oil reserves rise to 33.25 mln t by mid-2016 -govt
http://www.reuters.com/article/china-oil-reserves-idUSB9N1HS080
The IEA and others assume that China’s refinery figures are right. And therefore conclude that China is filling its inventories & SPR, very quickly.
China buys so much oil that they need to delay the release of their SPR data to prevent spectulators from front running their buying. But why do they delay the SPR data only to give the game away with the refinery data?
And so how do we know that the refinery figures are right, especially as they have so many small independent refineries (the so called tea pots)?
China has said that they are building their SPR and filling it but whenever they give an update the number is always far less than what you would expect just by looking at the refinery data. I expect the truth is somewhere in the middle.
2017-09-27 China commercial crude oil stocks down 3.4% on month in August, official Xinhua news agency.
Plus a chart from the data in the OPEC MOMR.
IEA August OMR, The implied Chinese crude stockbuild since 2015 has reached 550 mb at end-June 2017. The annual implied stock build (vs end-June 2016) was 350 mb (or nearly 1 mb/d).
Dallas Fed Energy Survey – September 27, 2017
Business activity continued to increase in the third quarter, but at a slower pace, according to oil and gas executives responding to the Dallas Fed Energy Survey. The business activity index—the survey’s broadest measure of conditions facing Eleventh District energy firms—fell from 37.3 in the second quarter to 27.3 in the third but remained positive for the sixth quarter in a row.
https://www.dallasfed.org/research/surveys/des/2017/1703.aspx
Chart on Twitter: https://pbs.twimg.com/media/DKvOX-5XoAAp-VB.jpg
EIA Petroleum Status Report
US crude exports reached a new record high of 1.491 million b/day
US gasoline imports rose to 1.04 million b/day last week, up from 0.687 million b/day, main driver for the gasoline build
Saxo Bank do a good summary, chart on Twitter: https://pbs.twimg.com/media/DKvN27KW0AAyQK4.jpg
RIO DE JANEIRO, Sept 27 (Reuters) – Only one block in Brazil’s prized offshore Santos basin received a bid in the country’s 14th oil round on Wednesday, a sign low global oil prices may have reduced the allure of potential new crude and gas investments in Latin America’s largest economy.
Karoon Gas Australia Ltd won the block with a signing bonus worth 20 million reais ($6.3 million), but the remaining 75 blocks in the basin received no bids, oil industry watchdog ANP said. Officials expected to sell up to 40 percent of the blocks, raising 500 million reais ($157 million).
http://www.reuters.com/article/brazil-oil-auction/update-2-brazils-prized-santos-basin-receives-single-bid-in-oil-auction-idUSL2N1M80O5
A lot more interest in the other basins though, especially Campos. It can’t be just oil price that is against Santos, maybe it’s similar to the mirror province in Angola, Kwamza, and it’s turning out to be a bust.
Hi George
Two more dry holes in the Barents sea.
http://www.worldoil.com/news/2017/9/28/lundin-petroleum-completes-drilling-of-boerselv-exploration-well
http://www.worldoil.com/news/2017/9/27/eni-norge-drills-dry-hole-near-goliat-field-in-the-barents-sea
I think this year has killed off a few of the promising frontier basins now – Kwanza in Angola – bust, deep water offshore Canada – mostly bust, Barents – mostly bust, Santos – looks bust, ultra deep US GoM – mostly played out or uncommercial, offshore Colombia – looks bust for oil, couple of West Africa areas – dry holes, offshore Ireland – half way to bust, UK North Sea – very poor lease sale, also one other lease sale (maybe Oman?) I think didn’t do very well from memory.
Yep not lookin good for new regional plays. However one small success in the North sea although it’s gas.
http://www.worldoil.com/news/2017/9/27/hansa-hydrocarbons-confirms-important-discovery-offshore-the-netherlands
I had a look at the USGS assessment for undiscovered oil from 2012 – the Santos basin is the largest single contributor (P50 54 Gb), and the Western Central Coastal, which includes Kwanza as a big chunk, the second (P50 43 Gb), so losing most of those puts about a 20% hole in the numbers (apart from the fact that at current rates it’s going to take about 200 years to find what the USGS reckons is out there).
One area I’m encouraged by is the Sureste Basin, in shallow water offshore Mexico – with both Eni and Talos making 1 bbo or bigger discoveries (Talos estimates 1.4-2 bbo OOIP and Eni about 1.4 bbo OOIP after multiple wells ). I heard that the Talos discovery was a test of a single structure within a lease block with numerous additional untested structures.
In both cases, oil quality is 28-30 degree API and reservoir depths are not too deep – 14000-15000′ or so. Being in shallow water, these projects could be brought on line within a few years.
Any idea of likely recovery %?
Good question. Based just on the press releases – a couple thoughts. Since the fields are in shallow water, they should be able to afford to drill “a lot” of wells – whatever that means- but maybe the wells can have an average drainage area of 200-300 acres, and, if needed they should be able to justify water injection. Just these parameters alone make one think they should be able to achieve a better RF than if they were in deep water.
Oil quality, from the press releases, as mentioned above is pretty good. At least in the Talos case, the reservoir unit itself is quite thick – a 1100′ gross pay interval with about 660′ net pay – quite impressive. Don’t know the depositional environment of the Miocene reservoirs, or the structural complexity, or whether the reservoir unit is a “bright spot” – which would greatly enhance their ability to characterize the reservoir in terms of how extensive or well connected they expect it to be – but, if it is fairly well connected, given the other things I’ve mentioned above, and reasonable water saturations (say no more than 20-25%), and reasonable residual oil saturations (say 25-30%, though I’m not quite as confident in this estimate) – I would not be surprised to see R.F.s in the 35-45% range.
Great answer SouthLaGeo dood.
I have looked at several assays for GoM flow and I don’t think I’ve found any yet that didn’t look essentially like Louisiana Light, which has good diesel content.
Of your whole comment the 200-300 acres number is the most interesting. That must be typical for conventional (calling offshore to be conventional, vs shale). That acre number would be with somewhat standard millidarcy total of permeability.
Good stuff.
http://www.reuters.com/article/us-brazil-oil-auction/exxon-mobil-bets-on-brazil-buys-10-oil-blocks-in-auction-idUSKCN1C22UY
Regarding the above – In hindsight, I question my 200-300 acre well spacing – they could probably justify a somewhat denser well spacing than that, and regarding the perms – the Talos press release says the “rock properties appear to be of excellent quality” – which, I take to mean say 25-30% porosity or better and hundreds of millidarcies of perm. Given all the parameters described so far, I would not be surprised to see flow rates of thousands of barrels per day, at least from the Talos discovery.
This works out as 20% more barrels per day per well in 2017 over 2016. (2016 = 294 b/day per well)(2017 = 355 b/day per well).
US – update through May 2017 – by Enno Peters
In the first 5 months of this year, the ~2300 wells that have been brought online this year contributed more new oil production than the ~2750 wells that were put on production in the same period last year (816 kbo/d vs 809 kbo/d based on preliminary data). This improvement in well productivity has been an important explanation behind the rising output from shale wells in 2017 so far.
https://shaleprofile.com/index.php/2017/09/25/us-update-through-may-2017/
Way too glib a presumption of supply shortage in the 2020 time frame. If you’re not bringing new production online and the global decline rate is call it 5% then each year from now until 2020 we should see a loss of about four and a half million barrels per day off of supply and * 3 years that’s 13 million barrels per day supply reduction and there is no way countries can feed themselves with that quick level of scarcity.
When one says “supply shortage” the consequence of significance is not higher prices; the consequence is unfilled orders.
That would be without investing – but there is investing. But is it enough?
As you see on your ballpark numbers, US shale oil can’t fill these gaps in any way – most oil has to come from other sources. Much from much less funky, as secondary recovery of old fields, and finding small additional pockets in well known big fields, on and offshore.
https://cc.talkpoint.com/wolf001/092817a_as/?entity=2_DQQGOH4
Core Labs….
EIA US July crude oil production (914) up 141kb/day to 9,238kb/day from 9,097kb/day in June
Weekly average for July was 9,417 kb/day. And so the gap monthly-weekly = -179 kb/day
Month/Month changes, US crude production: US +141k, Gulf of Mexico +127k, Texas +21k, North Dakota +14k, Alaska -40k
EIA’s latest STEO had July at 9.239kb/day, and IEA’s estimate was: July 9.266kb/day
https://www.eia.gov/petroleum/production/#oil-tab
Chart of monthly vs weekly by Saxo Bank, Twitter: https://pbs.twimg.com/media/DK6t01NWAAA-HfT.jpg
Alberta July crude oil production (without NGLs) up +202kb/day M/M to 3,198kb/day, increase due to bitumen (both upgraded+non-upgraded)
Chart of total on Twitter https://pbs.twimg.com/media/DK6dnrfXUAEG1Pe.jpg
Subtotals
Now there is a point. I haven’t looked into what we might call the equivalent of refinery gain in the upgrade process of oil sands.
The output certainly is less dense and therefore should be greater in volume.
Probably meaningless though. The input to the upgrader is likely not measured for any government reporting. Suncor might care as part of some sort of efficiency measurement but barrels per day reporting externally? Probably not. Who would care?
Speaking of which I recommend the wiki for DeAsphalter.
I’ve been looking at various parts of the production jigsaw puzzle, not seen anything really insightful so far. I guess that the EIA’s STEO production forecast is based mostly on the rig count. The low price of oil and DUCs add extra uncertainty to forecasts because the decision to complete wells can be deferred.
World demand estimate from the IEA’s Oil Market Report, updated September. Includes everything, biofuels & NGLs.
On twitter, https://pbs.twimg.com/media/DLCkJA7XkAAVPJS.jpg
The backlog of crude waiting offshore USA has increased again in the past week. I guess it’s going to take a while for the refineries to catch up.
TankerTrackers http://tankertrackers.com
Chart on Twitter https://pbs.twimg.com/media/DLC6UimWAAEvsTq.jpg
It is not included in EIA’s data about imports, right? So when this backlog is worked through, US oil stocks will increase significantly. Or is it included? Hmm.
I don’t remember the rules for accounting for imports. But I have no doubt that it will have to added to the oil stocks figures. Obviously the big oil traders know all about the backlog from Genscape & ClipperData etc. (I’m not an oil trader).
This looks like it…
When a shipment reaches the United States, the importer of record will file entry documents for the goods with the port director at the goods’ port of entry. Imported goods are not legally entered until after the shipment has arrived within the port of entry, delivery of the merchandise has been authorized by CBP, and estimated duties have been paid. It is the importer of record’s responsibility to arrange for examination and release of the goods.
U.S. Customs and Border Protection – A Guide for Commercial Importers – page 11 https://www.cbp.gov/sites/default/files/documents/Importing%20into%20the%20U.S.pdf
Not sure how much flexibility there is but I know that shippers sometimes wait to fill in the papers and unload because of tax issues.
Energy News – That’s about 30 million barrels of oil in one month. I think that EIA included this oil, because otherwise, we would have big drop in weekly reported inventories.
Yes I was wondering why gasoline inventories didn’t fall more than they did. They only fell -9.4 million barrels over the 4 weeks of September. Also distillates fell only -9.7 over the last 4 weeks.
I assume crude inventories didn’t fall because of the refinery outages. Crude inventories are up +13.2 over the last 4 weeks. But I don’t have a detailed explanation.
If I really wanted to know what was happening day to day, I would subscribe to one of the information services. But I’m only really interested in long term trends.
As I’ve said before, maybe I’m the resident idiot, as some regulars no doubt believe is the case, but I simply can’t accept all this talk about this, that, and the other factor such as rig count, or inventory levels, or discoveries, or anything that is necessarily discussed on the grand scale, the WORLD WIDE scale, in respect to the price of oil, as talk that gets down to the REAL roots of the question…………. why is the price of oil what in IS, and why has it been so volatile in recent years?
The REAL answers are to be found in a serious discussion of the REASONS various countries produce as much as they do, and these reasons do NOT NECESSARILY include the profit motive anywhere near the top of the list.
I’ve got things to do outside, but I’ll come back to this later this evening.
The EIA seem to have updated their inventories page? The link that I was using is now only major products
https://www.eia.gov/dnav/pet/pet_stoc_typ_d_nus_SAE_mbbl_m.htm
This is the inventories chart that I keep updating as it highlights where the biggest storage is, the USA & Saudi Arabia. These are the countries with reliable data, mostly OECD. USA is without NGLs.
The IEA’s OECD inventories for July, still very high…
INVESTORS PUSH U.S. SHALE FIRMS TO SEPARATE EXECUTIVE PAY FROM DRILLING
http://www.reuters.com/article/us-usa-oil-compensation/investors-push-u-s-shale-firms-to-separate-executive-pay-from-drilling-idUSKCN1C42RZ
FYI I just received the following email. I thought some of you just might be interested. Ron.
Dr. Nafeez Ahmed
7:02 AM
to peakoildiscuss.
https://link.springer.com/article/10.1007/s12182-017-0187-9
i’m writing up a story about this important paper that has just been published. if anyone has any comments on this paper and its implications for the Chinese economy, that would be very helpful.
The research has been funded entirely, it seems by the Chinese government through a range of state-backed research foundations.
Many thanks
Nafeez
—
Dr. Nafeez Mosaddeq Ahmed MA DPhil (Sussex) FFAS
http://www.nafeezahmed.com
bestselling author
investigative journalist
international security scholar
‘System Shift’ columnist, VICE
Columnist, Middle East Eye
Crowdfunded investigations, INSURGE intelligence
(Formerly @ The Guardian, ‘Earth insight’ blog)
Winner, Project Censored Award 2015 for Outstanding Investigative Journalism
Featured in Evening Standard’s 2014 and 2015 most globally influential Londoners
Visiting Research Fellow, Faculty of Science and Technology, Global Sustainability Institute, Anglia Ruskin University
Foundation Fellow, Muslim Faculty for Advanced Studies (MFAS)
New novel, ZERO POINT, a science fiction thriller
Documentary feature film, THE CRISIS OF CIVILIZATION
Academic research
@nafeezahmed
http://www.facebook/DrNafeezAhmed
http://www.linkedin.com/in/nafeezahmed
From the article, (first link above). Bold mine.
Abstract
This paper reviews China’s future fossil fuel supply from the perspectives of physical output and net energy output. Comprehensive analyses of physical output of fossil fuels suggest that China’s total oil production will likely reach its peak, at about 230 Mt/year (or 9.6 EJ/year), in 2018; its total gas production will peak at around 350 Bcm/year (or 13.6 EJ/year) in 2040, while coal production will peak at about 4400 Mt/year (or 91.9 EJ/year) around 2020 or so. In terms of the forecast production of these fuels, there are significant differences among current studies. These differences can be mainly explained by different ultimately recoverable resources assumptions, the nature of the models used, and differences in the historical production data. Due to the future constraints on fossil fuels production, a large gap is projected to grow between domestic supply and demand, which will need to be met by increasing imports. Net energy analyses show that both coal and oil and gas production show a steady declining trend of EROI (energy return on investment) due to the depletion of shallow-buried coal resources and conventional oil and gas resources, which is generally consistent with the approaching peaks of physical production of fossil fuels. The peaks of fossil fuels production, coupled with the decline in EROI ratios, are likely to challenge the sustainable development of Chinese society unless new abundant energy resources with high EROI values can be found.
That dood is quite the self promoter.
On a monthly basis the oil peaked in mid 2015, and it’s declining at about 7% per year since then. It seems unlikely it will reverse enough that 2018 will exceed 2015 yearly production.
There have been very few recent oil discoveries, though quite a lot of gas. Unconventional oil hasn’t worked out too successfully. They run a lot of rigs (I think 800 or so from memory – I’ve only seen it in OPEC statistical review) and presumably a good proportion have been for exploration, They’ve used EOR on their big fields for a few years – that with a lot of in-fill drilling in the high price years probably means they have got as much acceleration and increased recovery out of their mature fields as they are going to get, so another price rise might not make much difference.
I think they probably have more gas than previously thought, but haven’t looked in detail. Don’t know anything about coal except they have been very active in gasification (in-situ or at surface) and a breakthrough there could mean a big change in the available reserves if they have a lot of deep stuff (which I don’t know).
Chinese downtown diving, plus music.
https://www.youtube.com/watch?v=9a7g8z-vpb4
China is lowering the cost of imported oil with more efficient mega refineries and deep-water ports. Less smog too.
Bloomberg – New Chinese independent processors building mega refineries – 1 October 2017
One of the version 2.0 plants is a $24 billion refinery on Zhoushan island in Zhejiang province, expected to refine 20 million metric tons a year, or about 400,000 barrels per day, when it’s completed in 2018.
While crude imports by teapots in Shandong have been plagued by shipping and logistical challenges because of shallow ports and the lack of pipeline infrastructure that has led to vessel pile-ups, the newcomers have the advantage of access to deep-water ports. That would benefit them by reducing freight costs as they can ship cargoes on larger vessels.
https://www.bloomberg.com/news/articles/2017-10-01/oil-market-stars-risk-being-dimmed-by-giant-version-2-0-in-china
Some months ago, I did a profile of likely oil targets along the Chinese east coast when the war begins. That island presents nothing new. Not far south of Shanghai. Really vulnerable.
They did pack some refineries and import ports up north on the Yellow Sea coast, with proximity to South Korea likely a deterrent to attack.
This one is just hanging out there.
ExxonMobil Dethroned As Top Energy Company
http://peakoil.com/business/exxonmobil-dethroned-as-top-energy-company
But the Russian gas giant’s ability to weather sanctions, regulatory threats from the EU, low oil and gas prices, and the rise of competition from new supplies of LNG is impressive.
Looked at what EIA posted for “final” numbers for Texas for July. 3474. Now, July 2016 had higher numbers for initial production than July 2017. Much higher with condensate, though I can’t find the original condensate number, but they were running over 9 million at the time. Texas final number for July 2016, at this point, is 3110. EIA has 3161 for July 2016. I don’t need to do a lot of mathematical computations by looking backwards. Just using EIA numbers for 2016, its over by about 313,000. Undoubtedly more. Substituting, that puts US production at 8,925,000. Even though we had the shutdowns Aug and Sep for Harvey, EIA has production on the latest weekly at 9,547,000. Does seem a might high, and that doesn’t count a questionable increase in the GOM on the EIA July “final” numbers.
If the production is that far off, what else on the weekly report is way off? Total inputs, imports, exports, inventory draws?
At first, my thought was, why are they doing this? Then the more I thought of it, there is no nefarious intention. Any organization who uses their calculation to come up with “drilling productivity”, can’t have both oars in the water. Or, as a popular movie reiterates: “stupid is, as stupid does”.
Hi Guym,
The EIA estimates (tight oil estimate) about a 510 kb/d increase in US tight oil production from July 2016 to July 2017, about 411 kb/d was from the Permian Basin (Texas and New Mexico). See
https://www.eia.gov/petroleum/data.php#crude
Click on “Tight Oil Production Estimates”.
I was thinking that the EIA’s monthly Supply and Disposition numbers are more accurate that the weeklies. But even the monthly figures have an adjustment factor and it spiked up to +558 kb/day in July. So far, it seems that only the inventory figures are reliable.
https://www.eia.gov/dnav/pet/hist/LeafHandler.ashx?n=PET&s=MCRUA_NUS_2&f=M
Inventory numbers are not a count of oil. They are a mathematical calculation of what had to be used, based upon baseless numbers. One could base an argument, that because production was really lower, more should be deducted from inventory each week. Some have made that claim. I just think all of the numbers are highly suspect. It is materially in error, and all of the numbers should be questioned. It really appears to me that US production is closer to 8,900,000 barrels a day versus 9,200,000 a day.
You would imagine that Customs must know how much oil is traded per month. And that refineries must know how much oil they use. But even looking at the monthly data it’s difficult to know what is accurate and what isn’t.
If you calculate monthly production using the equation but without the adjustment you get the blue line on the chart
Refinery Input = Production + Imports – Exports + Inventory Change + Adjustment
Analysts version on Twitter: https://pbs.twimg.com/media/DLIILKvVoAE_dMS.jpg
The EIA did make some changes but looking at weekly vs monthly it is still the export/import numbers that show the largest revisions. Although also wondering how accurate the monthly data is.
MarketWatch – Aug 31, 2016 – Oil market cheers EIA changes to weekly statistics
On Wednesday, the EIA’s Today in Energy report said the agency is now publishing its weekly petroleum export and consumption estimates based on “near-real-time export data” provided by U.S. Customs and Border Protection. It was previously using weekly export estimates based on monthly official export data published by the U.S. Census Bureau about six weeks following the end of each reporting month.
“Exports should be more accurate, and ‘net imports’ should be better, but still with uncertainty,” said Michael Lynch, president of president of Strategic Energy & Economic Research.
http://www.marketwatch.com/story/oil-market-cheers-eia-changes-to-weekly-statistics-2016-08-31
(I meant to type differences rather than revisions in the post above)
If the monthly data is accurate (?) then compared to the weeklies the USA is exporting more and importing slightly less than reported in the weeklies.
Monthly vs Weekly Trade Volumes, the average difference from Jan-2016 to Jul-2017
Exports: Monthly – Weekly = +124 kb/day (average over 19 months since Jan-2016)
Imports: Monthly – Weekly = -33 kb/day
Net Imports: Monthly – Weekly = -157 kb/day
The same exercise for refinery input
U.S. Refinery & Blender Net Input
Monthly vs Weekly, the average difference from Jan-2016 to Jul-2017
Monthly – Weekly = -32 kb/day (average over 19 months since Jan-2016)
If you just look at January, for the last 4 years, the January weeklies underestimate the demand drop every year
Monthly – Weekly = -189 kb/day (average over last 4 Januarys)
Monthly vs Weekly, the average difference from Feb-2016 to Jul-2017 (without Jan-2017)
Monthly – Weekly = -7 kb/day (average over 17 months since Feb-2016, without Jan-2017)
Rystad Energy – October 03, 2017
Mature, offshore oil fields now decline at a rate of -8% per year, whereas the same fields declined by only -5% in 2014. And as a consequence, one million barrels of oil have been removed from production balances.
https://www.rystadenergy.com/NewsEvents/PressReleases/mature-fields-declining-faster
Goodness! They expect US shale production to triple within five years! You read an informed article that mostly gets your interest, then they start speaking in unknown tongues. Bet the guy’s head did a 360 degree turn while he was saying this. He’s been snorting the same stuff as the EIA people are.
Even if the oil companies would lay out the HUGE capex necessary for this to happen, they should be shot by shareholders. Look how badly they got burned the last time. They were drilling wells with first year’s production at 70k, and happy with it, at the time, because oil was at $100. At $30 oil, they sucked wind when those wells pumped. There is a definite limitation on the number of locations that can spew out over 200k barrels the first year. Even in the highly touted Permian. Realistically, to continue at a certain level of capex from year to year, you have to expect that your current wells completed will return your capex for the next year. Plus, those wells have to produce more than the capex, to allow for additional drilling. Due to current limitations on borrowing, it’s not likely to get too much better than that. Where is the capex to come from, and who is the CEO who going to jump out of the airplane first? EOG had net profit of about 1% on their gross income. So, theoretically, they may be able to add 1% more wells if the net income was all cash flow. How long does that take to triple production?
Goodness II
“Many investors have begun to place a premium on operational sustainability instead of growth. These investors prefer that companies are able to sustain operations and generate free cash flow, rather than spend beyond their means to keep growing.”
Clear graphs of Cash Burn magnitudes per Co in various Market Caps.
Sure is Crowded on the Left of Negative Free Cash Flow. – Run Away ?
——————————-
tri·age
trēˈäZH/
noun: triage
1. (in medical use) the assignment of degrees of urgency to wounds or illnesses to decide the order of treatment of a large number of patients or casualties.
——————–
http://www.zerohedge.com/news/2017-10-02/sustainability-or-growth-eps-face-difficult-decision
I think there are a few things happening. For offshore there is an effect from moving to deeper fields, these tend to be higher pressure and have higher initial production for a given bore size but also much higher decline rates. There has been more smaller fields tied in and these often only use a single production line with no injection support – hence they start declining immediately with no plateau. Horizontal wells also may play a role (onshore and offshore) as they can maintain high rates for longer but then drop off precipitously once the water interface gets to the drainage volume for the well. Cut backs on infill drilling and planned maintenance are probably big parts of the picture as well – those could be reversed if prices went high enough (but still might not be worth the expense on fields at end of life); the other causes not so much.
George
More North sea well results.
http://www.worldoil.com/news/2017/10/3/aker-bp-completes-drilling-of-appraisal-wildcat-wells-in-the-central-north-sea
Mexico’s National Hydrocarbons Commission (CNH) has issued a call for bids for the country’s Round 3, consisting of 35 shallow water areas in the Gulf of Mexico.
Round 3 includes 14 areas in Burgos, 13 area in Tampico-Misantla-Veracruz, and eight areas in Cuencas del Sureste.
http://www.oedigital.com/component/k2/item/16297-mexico-reveals-round-3
Production Growth results in Cash Burn
Lol. Yeah, and I gave an example of a company who had both growth and cash flow, EOG. Not a whole lot of growth, and a smidgen of cash flow. Not a great lineup of superheroes ready to stave off the coming shortage. Have to eat more than spinach to triple the shale production at $60 a barrel.
Welfare Kings? Study Finds Half of New Oil Production Unprofitable Without Government Handouts
A new study published in the peer-reviewed journal Nature Energy found that 50 percent of new oil production in America would be unprofitable if not for government subsidies. The study, performed by researchers at the Stockholm Environment Institute and Earth Track, Inc., found that, at prices of $50 per barrel, light oil produced by hydraulic fracturing (“fracking”) was heavily dependent on subsidies.
In fact, forty percent of the Permian basin in Texas would be economically unviable without subsidies, and for the home of Bakken crude production, Williston Basin, that number jumps to 59 percent, according to the researchers.
In addition, the study highlights what this additional fossil fuel production means for impacts to the climate:
“…continued subsidies for oil investment could produce oil (and associated gas) that, once burned, will yield CO2 emissions equivalent to nearly 1 percent of the remaining global carbon budget for all sectors of all economies.”
At current oil prices, perhaps the most effective “keep it in the ground” strategy might be to stop subsidizing oil production.
But what happens with these subsidies when the price of oil is over $100 per barrel, as it was several years ago? The authors of the study report that, under such a scenario, government subsidies are simply “transfer payments” to oil investors. The oil would be profitable without the subsidies, which become, at that point, simply free cash for investors.
While this study provides valuable insight into how subsidies affect oil production and the climate, it notes that its conclusions are not unique. The authors point out: “As others have found regardless of the oil price, the majority of taxpayer resources provided to the industry end up as company profits.”
Also in this article:
US Taxpayers Subsidizing Oil Exports to China
What are the subsidies specifically?
Without specifically stating what the subsidies are, the article is not credible in my opinion.
In fact, the only thing I can think of that could be characterized as a subsidy would be the expensing of intangible drilling costs. Instead of writing off the costs of drilling and fracking the well over a period of years, it can all be deducted in the year the expense is incurrred. Is that the “subsidy”?
The only other “subsidy” out there is percentage depletion, which applies only to the first 1,000 BOEPD of a company’s production. So this just helps the small producers, it is not very significant for a company like EOG, with over half a million BOEPD.
I have owned working interests in oil wells since 1997. I have never received a check from the Federal or state government. I pay federal and state income taxes on the income (when there is any), pay ad valorem taxes and pay annual well fees. When the oil price was $25 per barrel, that is what I got. When it was $100 per barrel, that is what I got.
I also own farm land. I get a direct subsidy check from the Federal government and have every year since I bought the first farm 28 years ago. There was a time when grain prices were very low, I received an LDP payment, which in effect set a minimum price for my grain, well above the market price.
Let’s keep things accurate here. If there are subsidies the shale jerks are getting, spell them out.
I think the more accurate article to be written would be that the vast majority of US shale is unprofitable, period, at oil prices from Thanksgivimg, 2014 to date.
SS – Good Post. Anti-anything, including oil, lets people use perjorative terms that are not anywhere near accurate because the media will let them get away with it.
It is like writing an article claiming that the government provides huge subsidies that only benefit rich doctors, hospitals and greedy medical companies because it let’s taxpayer’s deduct medical expenses on their income tax returns. Also, it let’s all workers exclude from their taxable income the amount that the company pays for their medical insurance. Maybe taxpayers should have to capitalize medical expenses and amortize them over their remaining life expectancy, as well as pay taxes on the medical insurance that their company pays for them. The union workers that get as much as $15,000 or more in annual medical benefits would love that.
On the other hand, what if these people were to get their way and change the tax laws so that oil companies had to capitalize all drilling costs? In that event, I would be confident that the price of oil would double in a year since most drillers would, without a doubt, have negative cash flow.
PS: Besides intangible drilling costs, usually these types also include the use of LIFO inventory that every company can use. Also, the refiners get to use the manufacturing tax credit that any manufacturing company can use.
Envirodoods usually are referring to the Oil Depletion Allowance when they talk oil subsidy.
Wiki says 15%, don’t see anything about a first 1000 bpd restraint. Actually it says 15% for “oil shale” not shale oil. Generic oil and gas wells, 14%.
Watcher.
Percentage depletion applies to first 1000 BOEPD per taxpayer only. It is also limited such that it cannot be taken in the event the well is operating at a loss. Trust me, we have many wells that have not qualified for percentage depletion in 2015-2017 tax years.
There has to be an allocation of G & A made on a well by well or lease by lease basis with regard to percentage depletion.
I think a review of some shale 1120 income tax returns would be very telling for the 2015 and 2016 tax years.
Watcher – SS is right. And I assure you that when the envirodoods complain about subsidies to the oil industry they are not primarily complaining about percentage depletion that the small producers benefit from.
Hi Shallow Sands,
One subsidy to the oil industry in general is a fuel tax that is too low.
This results in an inability to properly fund roads and bridges without using general government funds. For many years the federal and state fuel taxes provided funds to maintain roads and bridges. The failure to raise taxes on fuel at the Federal level since 1993 is a subsidy to the oil industry. The price of gasoline was $1.11/gallon in 1993 and the tax was raised to 18.4 cents per gallon, if we assume the average state tax at that time was 25 cents per gallon then the pre-tax cost was 75.6 cents per gallon and the federal tax was 18.4/75.6 or 24.6%. This % should be the minimum that the Federal fuel tax should be, so at current pre tax cost of about $2/gallon (about 50 cents per gallon of average federal and state and local taxes) the federal tax should be 49.2 cents per gallon to match the rate in 1993.
Dennis.
Seems like you are having to stretch pretty far to come up with a “subsidy” for oil companies, that being that a tax is “not high enough” on gasoline.
How much are electric vehicles paying to fund road and bridges? Oh yes, I forgot that electric automakers are getting payments directly from the federal government and electric car buyers are getting large tax rebates from the federal government.
To me, a subsidy is either a direct payment from the government, or a tax deduction or credit that is specifically carved out for an industry.
I am not aware of any direct payments being made to US oil producers from the federal government, or any state government. At least I know I have not received one from 1997 to present.
The specific tax deductions I am aware of for oil producers is IDC expensing and percentage depletion. Percentage depletion is very limited, it is basically an attempt to keep the over one million stripper wells in the US pumping. Maybe it should be eliminated, we can debate that, but it a “tax break” that is of limited value to “big oil”.
IDC expensing cannot be used by integrated companies, such as ExxonMobil and Chevron, to the extent independent producers can.
Of course I am getting this from an oil industry sponsored website, but IDC’s are just like tax deductions available to many other industries. Farmers pay for seed and fertilizer and deduct those in the year incurred. Bakeries deduct the cost of sugar, flower and eggs in the year incurred, tech companies are able to deduct quite a bit of R & D in the year incurred.
When oil was high, I paid a crap load of Federal and state income taxes at the highest personal marginal rates. However, I did get a “break” in that I received a percentage depletion deduction equal to 15% of gross oil sold, and, in years we drilled wells, was able to expense in the year incurred the cost of drilling and competing the well, plus some other intangible expenses. The pumping unit, rods, tubing, downhole pump, and other equipment went on a depreciation schedule, and is being depreciated over a period of years.
You may not have heard of Section 179 expensing, but every business for several years was able to expense equipment purchases, most recently up to $500,000 annually.
My point is no one is bailing me or any other small producer out. We are a greatly disfavored group, and likely will be. Probably why I should liquidate.
However, I am not convinced that we are quite to the end of the oil age. Absent some government intervention, I see is setting up for at least one more supply crunch superspike, which is being brought on by oil prices that have been way too low for the past three years. I may be dead wrong, and clearly would be happier had I sold in 2013. However, I looked at the numbers close and did not see any way the price could stay so low for so long, but it has. So I was already wrong and could be again.
I just get very tired of this “oil is subsidized” crap. Other than percentage depletion, my personal experience is that oil is not subsidized. It is clearly not like the new factory in town that gets the ten year real estate tax abatement, the farmer who gets a direct check from the federal government, or green energy which gets all of the above.
Maybe the big boys, like XOM, are getting big breaks that I am not?
Sorry for the typo errors. Autocorrect is not so great sometimes
I too have grown very weary of the ‘oil is subsidized’ garbage. I have seen it used for decades by the anti-corporate types angry with Exxon, or Chevron, for earning 8% on total operational revenue, as if that is sinful, now it seems the ploy is to use it as a means of limiting hydrocarbon production, increasing the price of oil beyond the means of every American, and controlling climate change.
The Permian Basin has never made enough “profit” to pay federal corporate taxes and IDC is only applicable as a means of reducing taxable income. As everyone points out depletion allowance is totally irrelevant. What else? There is nothing else. Non integrated E&P’s pay more taxes than any other industry in America; from production taxes, to property taxes, to sales taxes to franchise and corporate income taxes; it never ends. Even royalty is a form of tax. I am lucky to keep 20% of every dollar I earn and have to use that to stay in business. And for the record, the oil industry in Texas pays for its own orphaned wells and to fix and/or rebuild roads it damages.
Low fuel taxes favorably affect every man and woman in America, even fossil fuel hypocrites. It is not a subsidy to the oil industry. Dennis, you should abandon all façade now and rename all this the Anti-Oil Blog. Its more clear than ever that is the intent. The few folks that know anything about the oil industry and still post here have my admiration.
Hi Mike,
I am only pointing to low fuel taxes. Do you believe fuel taxes are too high?
Royalty payments seem more like rent to me than a tax, unless one is going to claim that every payment in any form is a “tax”.
I agree the oil industry pays lots of taxes, I just think the people that use fuel should pay for the roads they drive on. The US pays less in fuel taxes by far than any other developed nation.
It would seem that fuel would be used more wisely if the tax rate were higher and it will ease the transition to alternatives, which will have to happen at some point, unless one believes that oil will never peak.
In any case, oil prices will rise and the transition will be forced by oil depletion.
In my mind, fuel taxes that are so low that other taxes (from real estate, excise taxes, and income tax) must be used to maintain roads and bridges is a form of subsidy to the oil industry as fuel taxes are supposed to be high enough to pay for maintenance of roads and bridges.
You are welcome to call it something other than a subsidy.
What would you like to name it?
my god you finally got it. few here are a oil man’s friend and I am puzzled why it took you and SS so long to figure that out. Both your comments and SS (above ) are fact based. Dennis has always been anti oil for “suspicious reason”(not fact based) along with his posse of ignorant know-it- alls who are mostly ideological and has been apparent to me from my first readings on this forum.
I think we are now seeing the results of running down/off those with actual knowledge by those whose oil and gas industry knowledge base ends with how to change the oil in their lawnmower ?
Hi Texas Tea,
How much do you think fuel taxes should be? Is zero too high? 🙂
I consider tax breaks the same as subsidies.
In one case the government pays, in the other you pay less to the government, if I get $1000 from the government and put it in my bank account the balance increases by $1000. If I owe the government $1000 in taxes an the tax law is changed so I can keep that $1000, then my bank balance is $1000 higher than before the tax law was changed.
In both cases I am $1000 richer. I call both a $1000 subsidy, we could call them government handouts instead.
SS – As a retired CPA that specialized in taxes, I am impressed. Probably too late in life for you, but I believe that you could do what I did. It is rare for me to run into people in the general public who can articulate anything intelligent about taxes.
With respect to Dennis, I 100% agree with Dennis with his paragraph concerning low fuel taxes [especially living in Oklahoma where the state fuel taxes are about half of many states, but the roads are, well, shitty]. However, his allegation that low fuel taxes are a “subsidy” to the oil industry is probably the worst use of the “subsidy” reference that I have ever come across.
Maybe, in order to top his statement, I could say that food stamps are a “subsidy” so that poor people will have more children who will vote for democrats . [To be clear, I am NOT being serious.]
Hi Clueless,
We can call it something other than a subsidy, it is a tax rate that is so low that it benefits the oil industry, because people purchase more than they would otherwise, increasing demand which increases prices.
What do you call an action by the government which causes an increase in the flow of funds to an economic actor?
The definition of subsidy is below:
sub·si·dy
[ˈsəbsədē]
NOUN
a sum of money granted by the government or a public body to assist an industry or business so that the price of a commodity or service may remain low or competitive:
“a farm subsidy” · [more]
a sum of money granted to support an arts organization or other undertaking held to be in the public interest.
a grant or contribution of money.
Dennis. Ok, I follow you. I still do not think it is akin to direct government payments or tax deductions/credits, both of which can be measured precisely in $$ and cents.
Oil supply and demand and oil prices themselves are very complicated and I do not necessarily agree that a somewhat higher federal motor fuel tax would result in any significant demand destruction and/or reduction in oil prices. I know you think oil prices are all a function of supply and demand and can mathematically be predicted, but as we have seen these last few years, correlations are not strong. There was less oil sitting in US commercial inventories in January, 1999 when we sold oil for $8 than in January, 2013 when we sold oil for $90 per barrel.
Hi Shallow Sand,
So you would not be opposed to say a $1/gallon Federal tax on gasoline?
If you are opposed, can you explain why?
As it will not affect demand in any way (or that seems to be your argument), your business won’t be affected, and you can buy an EV so you wont have to pay the higher fuel cost. 🙂
I think the tax revenue is pretty easy to figure, it would be the tax per gallon times the number of gallons sold. Tax breaks can only be measured precisely after the fact as they can affect supply and demand in unexpected ways, just like a gasoline tax.
Nothing in the future can be measured precisely, for things that have already happened we can estimate pretty well (though every measurement has some degree of error, even the oil in the tank is probably not known to the milligram or ounce).
Hi Shallow,
I would consider the byproduct waste of burning oil being pumped into the air a social subsidy or cost that is not realized by the oil industry. Children with asthma and adults with lung cancer are a cost of air pollution. Global warming is also a cost to society that is not being realized by the fossil fuel industry. Not all subsidies are in direct dollar costs.
Ok. I do agree oil is a cause of air pollution. However, it is not the only cause.
I would note that, per the US EPA, new car CO2 emissions per mile are at a record low, and have been falling pretty much consistently since 1975.
Who should pay these costs? That is a good one to debate. How should we measure this? Should just the oil companies pay, or should the consumers pay?
If just the oil companies pay, aren’t the consumers being subsidized? Can windmills and solar panels be made without petroleum? How about computers, cell phones, etc?
Right now I am seeing many combines, tractors pulling grain carts, grain trucks and semi trucks harvesting grain and hauling it to grain elevators. That grain will be consumed by humans or by animals that mostly will then be consumed by humans. Should those who eat the food pay for the pollution caused during harvest? If just the oil companies do, aren’t the rest in the chain being subsidized?
How much fossil fuel pollution results from the production and then the driving of one Tesla Model S? Who should pay for that? Ever see a lithium strip mine and the huge excavators and dump trucks in those?
I know my little rant here is a hackneyed thing that has been only done one million plus times in the past. However, the denial here does make me pause at times. Each person on here bitching about oil while typing their gripes on technological devices made of petroleum products, in their homes made of petroleum products, with cars in the garages made of petroleum products and 99%+ that run on gasoline or diesel.
Consumers should pay the taxes, though in practice there’s no difference between taxing the seller or the buyer – either way, the tax is passed through to the buyer.
All consumers should pay the taxes. In the case of EVs or computers, the manufacturers would be the consumers of plastic parts or fuel supplies, and they’d pass the cost through to the buyers.
The taxes would properly allocate the real costs of oil & fossil fuels, and incentivize consumers and manufacturers to use a more optimal allocation of resources to minimize overall costs.
Hi Shallow sand,
I only mentioned fuel taxes, the consumer pays these. My only complaint is that fuel taxes are supposed to cover road maintenance and they do not. I agree with Nick that pollution cost should be paid by consumers, though any cost is passed through to consumers so it makes no difference really, though consumers don’t have lobbyists and large corporations do, so taxes on consumers are easier to accomplish.
I also mentioned that EVs should be taxed at registration, the EV tax credits will expire under current law.
Does a Federal fuel tax at the 1993 percentage rate (about 25% of pre-tax cost) seem unreasonable? I assume you know the Federal fuel tax (flat 18.4 cents per gallon) has been fixed for 24 years. If there was a fuel tax based on fixed percentage of pre-tax cost of fuel, what do you believe it should be?
On falling CO2 per mile, this fell until the 90s, but fuel economy standards were stuck from 1985 to 2005 so there was a flat section in the 1992 to 2005 period where there was little or no progress on CO2 emissions per mile driven in the US over that period. The current administration is trying to roll back as much environmental protection as possible, so we may go backwards from here.
A final point is that oil and natural gas are limited and we should try to use them efficiently. Higher prices help to accomplish that while society gradually transitions to alternative forms of energy.
Hi Shallow Sand,
I consider a subsidy as any action by the government that increases the income of an economic actor. So a tax break is a subsidy in my book.
You can call it taxes that are lower than they should be, if that floats your boat.
Yep, EVs (a very small number of current vehicles), need to be taxed in some way to pay for roads, this could be based on the weight of the vehicle and odometer readings determined each year when a vehicle is registered. Note that the subsidies for electric vehicles are limited in number, for each manufacturer after 200,000 vehicles are sold the subsidy phases out after 15 months (full credit for one quarter, then 50% for 6 months, 25% for 6 months, then zero). So the EV sales credit for larger manufacturers such as Tesla (about 146,500 cars sold through Sept 2017) will be done by the end of 2019.
Generally a government subsidy is considered a sum of money granted to an economic actor by the government.
Lets say the government gives you $1000, you agree that is a subsidy.
Let’s say you owe the government $1000 and the government decides you can keep your $1000, you call that a tax break (I guess).
I don’t think there is a big difference, either way you have $1000 more in your bank account.
Would you agree?
I agree, but I think correlation between gasoline taxes and oil company profits, while rational in theory, in real life is very tenuous.
The government sends me a check for $1,000 or I get a tax credit for $1,000, easy to measure.
Very tough to tell if that higher gas tax in the US reduced the price of WTI.
Hi Shallow sand,
I also pay income tax at high marginal rates, generally I don’t think those with high income should pay lower marginal rates. You mentioned elsewhere that higher fuel taxes would not reduce oil prices, I generally think of this as higher prices reducing the quantity that consumers demand. All else being equal, the price received by the producer might fall it would depend on elasticity of supply and demand in the short and long run. Generally higher prices associated with higher fuel taxes would reduce both supply and demand to a lower level than with lower taxes/prices.
Dennis,
I agree that fuel taxes are way too low. I wouldn’t describe that as a subsidy for oil, though. Instead, I’d describe that as combination of two problems.
First, the use of general funds to build and maintain roads & bridges is a subsidy for transportation in general, both passenger and freight (mostly freight, as heavy trucks do most of the damage). Really, what we need is a tax for vehicles, based on their weight and miles traveled.
2nd, the oil industry benefits from two indirect subsidies: provision of security (military & local police, on the scale of $trillions), and pollution (NOx, SOx, mercury, particulates, CO2, etc.,). They may be indirect, but they’re very, very real. If someone disagrees, they should ask KSA how valuable our military protection is, and look at the payments made by KSA and other countries to the US after Gulf War I, which gave the US a positive balance of payments for the first time in decades.
Finally, of course, the simple thing is just to raise the fuel tax sharply, and use the money to pay for road work, pollution control and the military. We can worry about EV road use when they become a large part of road traffic.
A graduated system of adding about $0.20 per year per gallon of fuel for the next ten years would probably be more acceptable and give a heads up to industry and car buyers to change over to EV’s soon.
Taxes should also be levied against other fossil fuels.
US crude oil exports reach a new record: 1,984 kb/day – EIA
EIA pdf file: http://ir.eia.gov/wpsr/overview.pdf
Good chart summary of this weeks report by Saxo Bank on Twitter
https://pbs.twimg.com/media/DLTRVEzW4AAuVmI.jpg
Hi all,
New posts are up
http://peakoilbarrel.com/call-for-reviewers/
and
http://peakoilbarrel.com/open-thread-non-petroleum-oct-4-2017/
Probably getting far afield here on the oil blog, but the EPA calculator of EV CO2 emissions per mile is pretty interesting.
In my part of the world, the grams emitted per mile for a Tesla EV is not much lower than for an ICE.
Is the EPA data accurate? Are we being hammered into EV’s even though they do not reduce CO2 emissions materially?
Ok, the fueleconomy. gov calculator for my area ( mixture of coal, natural gas and some renewable for electricity generation) gives 160 g/mile for a Tesla S 60 kWh pack. 200 g/mile average across the US Average ICE car gives off 430 g/mile.
If you are in Los Angeles that would drop to 120 g/mile. Dallas is about 200 g/mile.
However, since the calculation goes back to source energy, multiply the average ICE car by about 1.6 since to produce the gasoline coal, electricity and natural gas were used to process it. Really is about 690 g/mile for an ICE gasoline powered car that gets about 25 mpg average when the other fuels are added.
So even not using PV power on your roof the EV’s are far lower producers of carbon pollution than ICE cars and definitely way better than pick-up trucks.
Not surprisingly the Nissan Leaf and Chevy Bolt are more efficient than the Tesla (140 and 130 g/mile for my area).
As the mix of natural gas and renewables increase in the power stream the EV results only get better.
No, that data is misleading.
First, average CO2 numbers don’t tell the story, as EVs are easy to charge at times when wind, solar, hydro and nuclear power are strongest. 2nd, the grid’s CO2 composition will only go down. 3rd, oil has many external costs other than CO2, such as military costs, supply problems and “criteria” pollutants (NOX, sulfur, particulates, etc).
We talk a lot about the “purity” of EVs in our lifestyle in the developed countries, and not much about the problems that happen from lithium production in the underdeveloped countries that supply the fat and happy developed countries. Like child labor, and misuse of a scarce water supply. Actually, the “developed” countries are more concerned with keeping the costs of lithium production down. Which is counterintuitive to the “purity” of EVs.
What the heck do you mean by “purity” of EVs? I’ve never heard anything like that.
Mercedes uses it to describe the perfect car. In this case it was used to describe how it relates to the ecology.
Well, ethical mining is definitely a good thing.
I haven’t heard of any special problems with lithium mining.
Try googling, I found a bunch for South America, and for cobalt mining in the Congo. Mining and drilling are essentially the same thing. Extraction of minerals. Then you have to dispose of any residue or used product after the fact. In mining (mainly evaporation) for lithium, you do have some residue that is potentially dangerous, that has to find a disposal place. In combustion you have gases, in the other, you have potentially poisonous substances in junk shipped to Africa. Back in 2013, a study found that only 10% of the cellphones were re-cycled, the rest disappeared. Electronics labeled as used where shipped to Africa, ostensibly for resale. They wound up in dumps. The economics of recycling lithium batteries is questionable. So, where will they go? In my opinion, EV vs combustion does not have a clear winner. Except which one gets used up first. Plus, you can really add wind, solar, nuclear, and ocean current turbines to the problem list. Each one has a major problem. We are just using up the ecology, any way we go.
Nate is now a tropical storm over Nicaragua and moving north fast, likely to hit somewhere between the Florida panhandle and New Orleans on Sunday. May disrupt some GoM production, though the indications at the moment are it won’t strengthen much.
https://www.metoffice.gov.uk/public/weather/storm-tracker/#?tab=map&stormId=16L&stormName=NATE
Oranges are really going to start to be scarce.
Whoops, Nate just shifted track to New Orleans.