All data below is based on the latest OPEC Monthly Oil Market Report.
All data is through April 2017 and is in thousand barrels per day.

Looking at the above chart it seems obvious what most OPEC nations were doing. They announced in the summer of 2016 that there would likely be quota cuts beginning in 2017. And those cuts would be a percentage of their current production. So everyone began making heroic attempts to increase production by the end of 2016. So now, after everyone who felt that they should cut, has cut, they are right back to the level that they were at before the cuts were proposed.
I wrote the above paragraph last month. I see no reason to change a word of it now.
Secondary sources has OPEC production down 18,200 barrels per day in April, but that was after their March production had been revised down by 179,000 bpd. So basically OPEC production was down 197,000 bpd from what was reported last month.
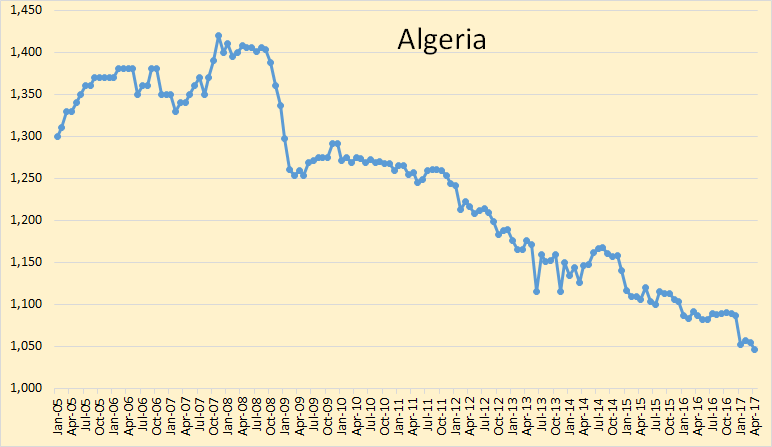
Not much is happening in Algeria. They peaked almost 10 years ago and have been in slow decline ever since.
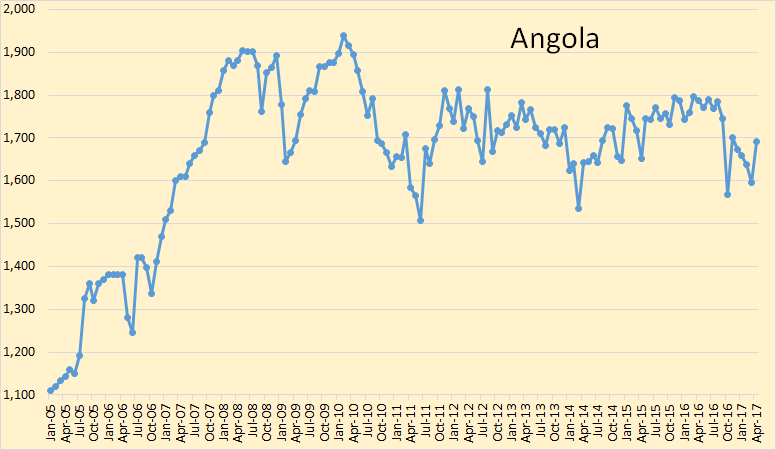
Angola peaked in 2010 but have been holding pretty steady since.
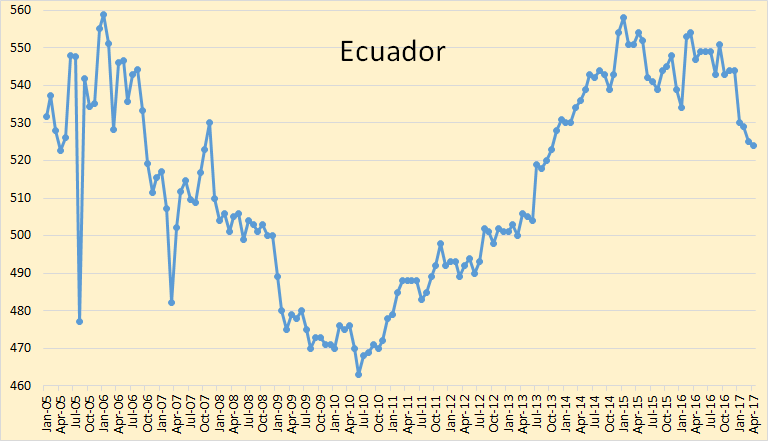
Ecuador peaked in 2015. They will be in a slow decline from now on.
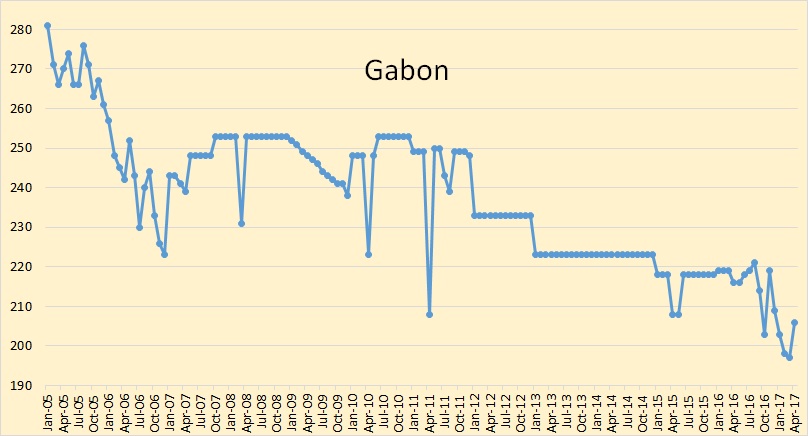
Any change in Gabon crude oil production is too small to make much difference.
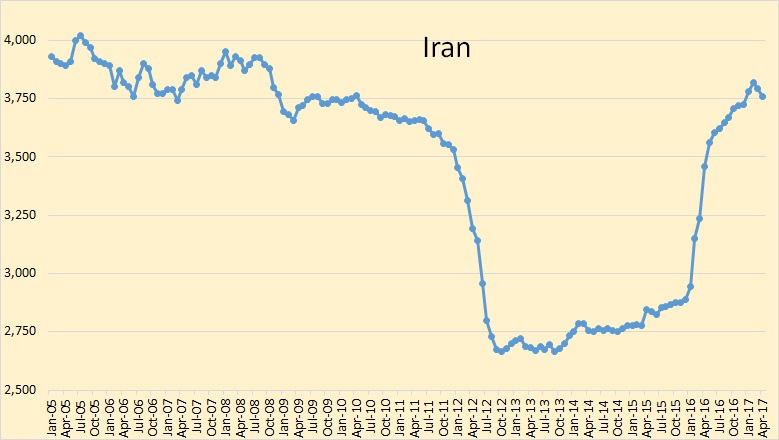
Iran’s recovery from sanctions has apparently peaked. I expect a slow decline from here.
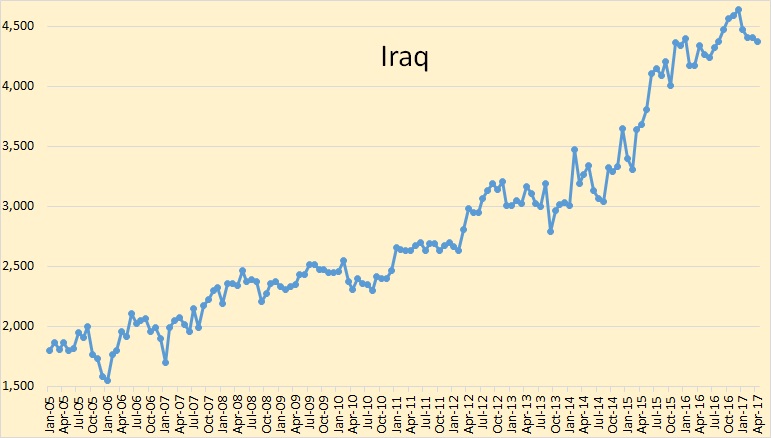
Iraq is down 269,000 barrels per day since their December peak
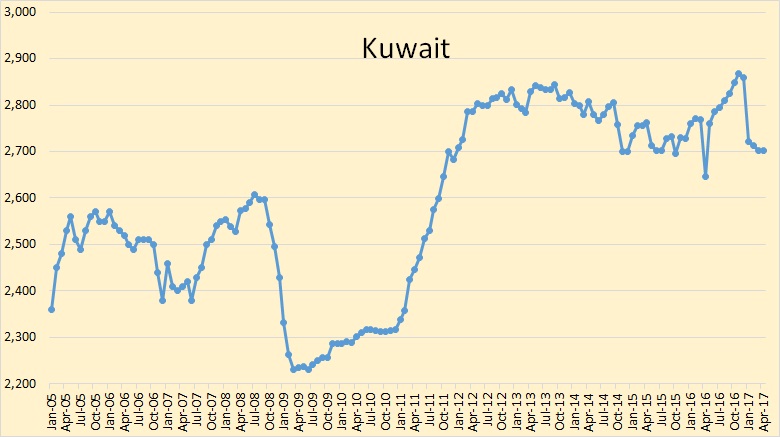
Kuwait is down 166,000 bpd from their November peak. That is about 5.8%.
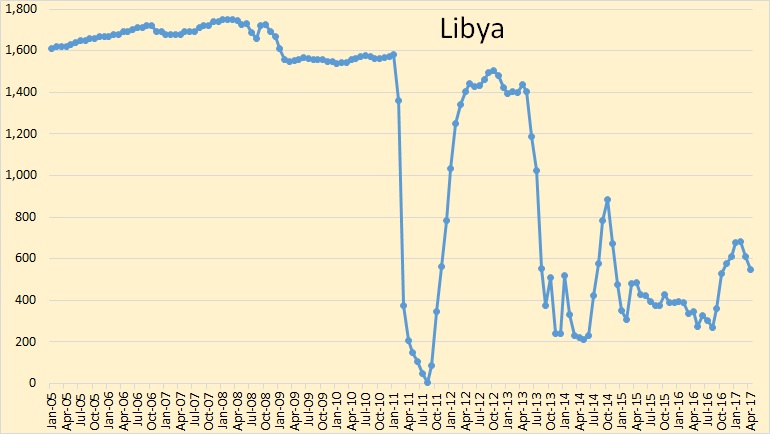
Libya still has problems, and will likely continue to have problems.
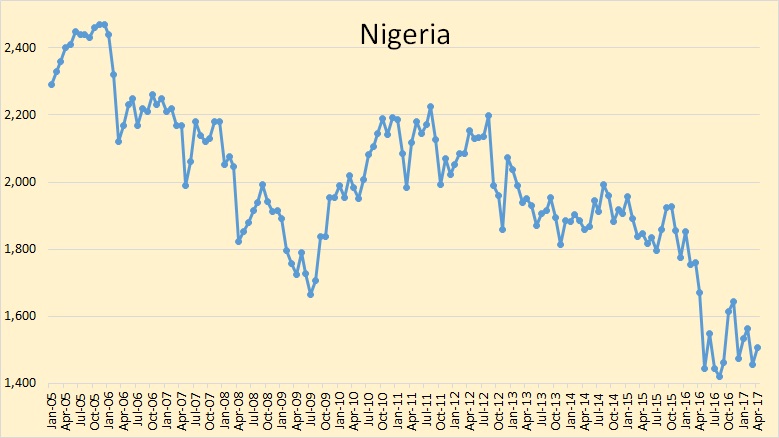
Nigeria and Libya are exempt from quota cuts because of rebel problems. Don’t look for those problems to clear up any way soon.
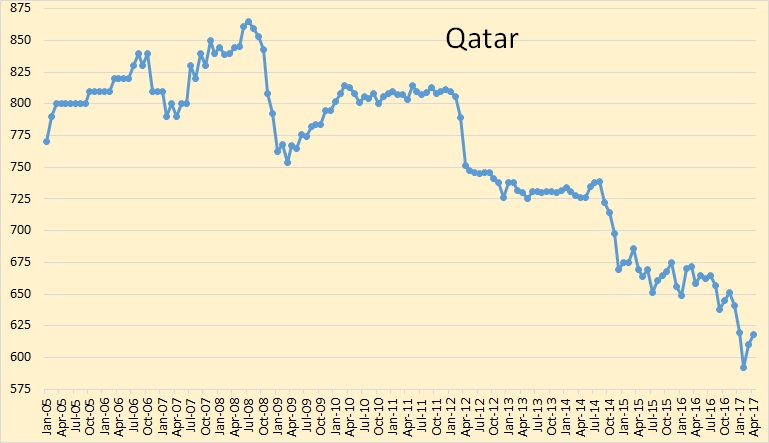
Qatar has been in decline since 2008. Her decline will continue albeit at a very slow pace.
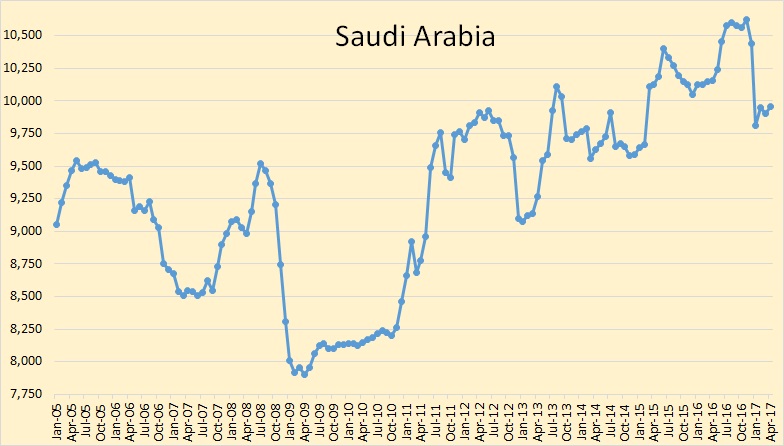
Saudi Arabia cut in January, then stopped cutting. I think this is where we will be for some time unless there is a real shake up in OPEC.
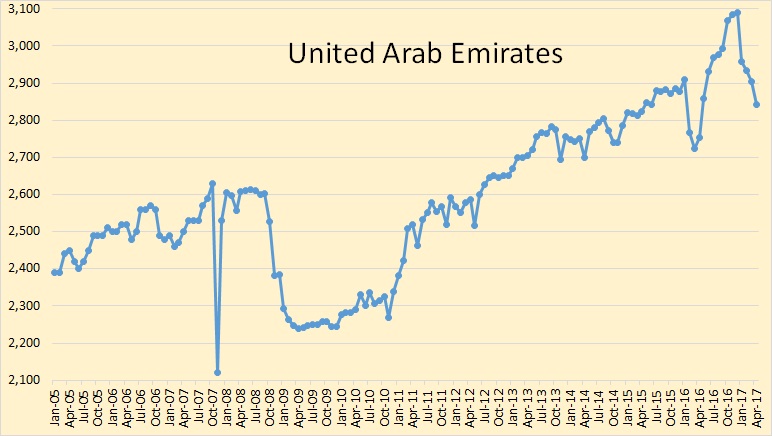
The UAE is down almost 248,000 bpd since December. This is the largest percentage cut in OPEC. I don’t think it is all voluntary.
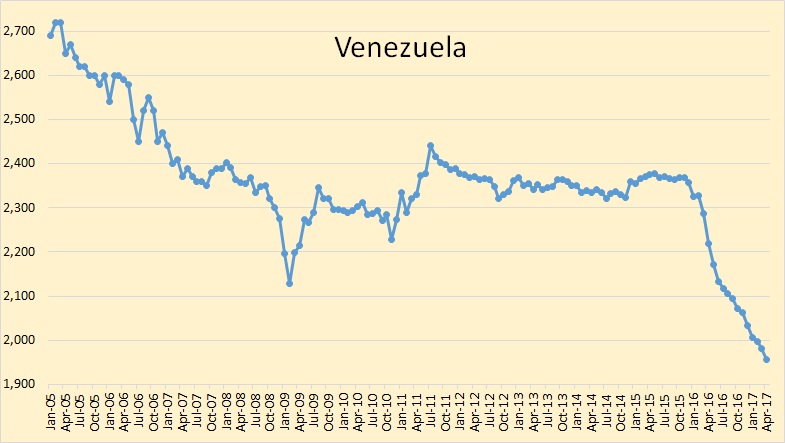
Venezuela’s problems will continue. They are now below two million barrels per day. They are at 1,956,000 bpd. Last March their production was 2,286,000 bpd. They have dropped 402,000 bpd, or 17% since December of 2015.
Eyeballing the chart, it looks like World oil production, total liquids, is down about two million barrels per day since peaking in November 2016. OPEC crude production is down 1.64 million barrels per day since November so Non-OPEC liquids, plus OPEC NGLs, would be down just about half a million bpd since then.
FILM REVIEW: To the Ends of the Earth Foresees a World Beyond Oil and Coal
The Coal, Hard Facts
Some stark factoids: Today, 85% of our power comes from hydrocarbons—oil, coal, natural gas. The average US family of four consumes 100 barrels of oil a year. The energy in a gallon of gas offers the equivalent of 490 hours of human labor. It takes seven calories of fossil fuel energy to produce a single calorie of food. (Of course, this depends on what food you’re talking about and how far it has traveled.)
The globalized world runs on cheap fossil energy—by some estimates 32 billion barrels a year. It is cheap oil and mechanization that has made our economic growth—unprecedented in human history—possible. But we’re running out of oil. Back in 1956, Shell geoscientist M. K. Hubbard predicted that U.S. oil discoveries would peak sometime between 1965 and 1970. He was right. The USA’s “peak oil” moment came in 1970.
An earlier “peak oil” event struck in the 19th century, an era during which tens of thousands of whalers risked (and oftimes lost) their lives hunting whales to secure the oil needed to keep lamps lit in streets and homes.
Ironically, with today’s coal and oil reserves in serious decline, whales are once again at risk. With nearly 90 billion barrels of untapped oil believed to lie below Arctic waters, oil company ships are testing the seabeds with seismic guns. The noise from sonic testing (after a nuclear blast, the second loudest human-made sound) can deafen, kill, and disturb sea creatures over a range of 3,000 km. Whales, dolphins, porpoises and narwhales are all at risk.
There is a lot more in this article than just the “Coal Hard Facts” listed above. There is also a 2.5 minute video trailer of the film.
171 responses to “OPEC April Production Data”
Kuwait looks as though it is continuing its decline trend from around mid 2013.
Agree with the assessment of the UAE.
I wonder if Iran could increase production with investment in new fields. I am unsure of how much more is out there for them.
Iran should have big reserves, as Iraque. It’s the question if they get double digit billion investment money from oil companies, despite the not so stable political situation.
They have about 150 billion barrels of revoverable reserves:
https://en.wikipedia.org/wiki/Oil_reserves_in_Iran
This number is debatable – but I think enhanced revovery technology on theses fields will be more efficient than drilling a non-sweetspot in Bakken.
Lots more Oil then these overhyped fracking fields in the USA – they will continue to produce oil when Bakken and Permian drilling is on the outer sector and their sweet spots riddled with 100thousands of wells.
More than 30% of Iranian recoverable reserves are very old. On the other side the new oilfields are off shore or at the river wetlands. Two years ago I’d written the article about Iranian oil, but it is in Russian: http://khurshudov.ru/2015/08/03/%D1%81%D0%BB%D0%BE%D0%B6%D0%BD%D0%B0%D1%8F-%D0%BD%D0%B5%D1%84%D1%82%D1%8C-%D0%B8%D1%80%D0%B0%D0%BD%D0%B0/
In return I propose to have a look at my new article, it continues the last year discussion about ExxonMobil: http://en.angi.ru/news/858-Alexander%20Khurshudov%3A%20No%20indulgences%20for%20the%20sufferer%20Exxon/
Exxon is not unique in my view – all oil majors face a similar situation that tier 1 onshore reservoirs are off-limits (owned by either NOC’s or Russian Co’s). At the end of your article, you mentioned that “Russia is going to decrease oil production for years to come”. Do you have a feel as to which Russian companies are poised to lower drilling rates: Rosneft would be an obvious candidate, but what can we expect from Gazpromneft & Novatec on this front.
Saudi Arabia and Russia, the world’s top two oil producers, agreed on Monday on the need to extend output cuts for a further nine months until March 2018 to rein in a global crude glut, pushing up prices.
http://www.reuters.com/article/us-opec-saudi-russia-idUSKCN18B06K
At present oil producers are concerned with too much oil rather than too little.
I expect this will change drastically by Sept 2018 (at least).
OPEC expects US LTO will increase about 600 kb/d in 2017 relative to 2016 average levels and only expects demand will grow by 1.27 Mb/d (170 kb/d less than in 2016). If we assume the average cut by OPEC and select non-OPEC nations is about 1.5 Mb/d in 2017 and also assume only US output grows in non-OPEC (aside from those nations cutting with OPEC) then the net World supply/demand balance will be about -2 Mb/d or about 720 Mb drawn from World stocks. We may see the lack of investment starting in 2015 begin to bite around the time OPEC brings supply back online, by 2018 it might not be enough to balance the market and we may see oil prices start to spike by 2019 to the $90/b range.
Your analysis seems reasonable if you use EIA projections. I certainly would not.
If I look at the number of permits in Texas, I might just buy the EIA hype. Last year to April, we had 1987 permits for oil. This year through April we have 3740. However, I look at the completions to date, and it tells me a different story. Completions through April last year for oil were 3593. Oil completions through April of this year were 1976. I think it would take some kind of magic, at this point in time, to reach that 600k average over last year. I don’t think we will catch up with the numbers currently reported by EIA by the end of the year. Remember, there was about a nine month lag between drilling and completions the last time frac crews were scarce. It took two years to get two to three months behind drilling, as I remember. Then again, my brain ain’t what it used to be.
And now OPEC expects the US to add 950,000 barrels a day by year end. Seriously?
It should be getting to the point over the next couple of years where prediction based on extending the trend doesn’t work anymore in Bakken and EF. Some of the operators will be running out of core acreage, or maybe already have as there have been some sales from big producers, and we’ll get to see how the wells actually perform as they mature, which so far has been pretty much an assumption (and I think probably optimistic) .
Hi George,
Yes we will see. So far the well profiles I have used have been too pessimistic, if oil prices increase proved reserves plus cumulative output for the ND Bakken/Three Forks are likely to be at least 5.6 Gb. At the end of 2015 there were at least 4 Gb pf proved reserves in the ND Bakken/Three Forks (80% of 5 Gb with the rest in Montana) and 1.6 Gb of cumulative output. You believe the USGS April 2013 Bakken/Three Forks assessment was too optimistic (mean TRR estimate was about 9.5 b for North Dakota Bakken/Three Forks).
Scenario below assumes wells are shut in at 15 b/d with EUR of about 275 kb for the average 2015-2016 well. With about 27,000 total wells completed (no more wells completed after 2028), Economically recoverable resources are about 6.8 Gb from 1951-2050 and peak output is 1230 kb/d in 2022 with an assumed maximum completion rate of 150 wells per month from 2021 to 2022. In the scenario below note that the model underestimates actual output from May 2015 to March 2017, so the scenario may be too pessimistic, though no doubt most here will believe the opposite 🙂
Dennis – obviously whatever I wrote about the USGS didn’t make sense or you wouldn’t keep raising it so I’ll try for one last time. The USGS was for undiscovered oil in 2012. Since then wildcat wells have dropped to zero, while their success rate fell to 50% – then, no more wildcats. Therefore the USGS report is irrelevant. What matters is what oil the companies had on their books as discovered developed or undeveloped. I don’t think you know what that was, I certainly don’t, but it certainly isn’t the number the USGS had.
Hi George,
I take proved reserves at the end of 2012, add cumulative production, then add the USGS undiscovered oil to arrive at a TRR estimate, the proved reserves would equal the sum of the developed and undeveloped reserves on the books.
See https://www.eia.gov/dnav/pet/hist/LeafHandler.ashx?n=PET&s=RCRR01SND_1&f=A
In 2012 in North Dakota proved reserves were 3761 MMb and in 2006 they were 412 MMb, I assume most of the increase from 2006 to 2012 was Bakken/Three Forks reserves, so I estimate 3761-412=3300 MMb of Bakken/TF proved reserves, cumulative production at the end of 2012 was about 600 MMb for a total of 3.9 Gb, of the 7.4 Gb of mean undiscovered TRR about 78.5% was expected to be in North Dakota or 5.8 Gb, so the mean TRR is 9.7 Gb, if we assume that 2P=1P (probable reserves were zero at the end of 2012).
Presentation on USGS Bakken assessment at link below
https://www.dropbox.com/s/evwtxgsuisewczk/2013_Bakken_ThreeForks_Assessment.pdf?dl=0
Hi George,
Another consideration is that at the end of 2014 proved reserves were about 5.6 Gb and cumulative production was 1.2 Gb, suggesting a minimum of 6.8 Gb, if we assume 1P reserves are equal to 2P reserves.
If we make the conservative estimate that 2P reserves=1.3 times 1P reserves, then 2P reserves plus cumulative output would be 8.5 Gb at the end of 2014. For the UK North Sea a typical 2P/1P ratio is about 1.6 (average over the life of the field from 1973-2014). So I have arbitrarily estimated 50% of the probable reserves in a conventional oil reservoir.
See
https://www.gov.uk/government/uploads/system/uploads/attachment_data/file/441395/Appendix_2_Historic_UK_Oil_and_Gas_Reserves_and_Production_2015.pdf
Hi George,
One final note on the Bakken, even if there are no more discoveries by drilling wildcats does not mean that there will be no increase in reserve estimates over time, especially if oil prices increase due to depletion. Perhaps the mean estimate by the USGS was too high, the F95 estimate was about 7.3 Gb (assuming probable reserves are zero), a very conservative estimate of 2P reserves (2P/1P=1.25) gets us to around 8 Gb, which seems pretty reasonable. The 6.8 Gb scenario is quite conservative and requires no probable reserves to be produced, only proved reserves booked at the end of 2014, plus oil produced through Dec 2014.
George
Tullow oil appear to be having a degree of exploration success on the 13T block northern Kenya.
You know, I used to work with an exploration team in that area in the 1980’s. It was a lot of fun, we spent time driving around, looking for lions and zebras, chatting with the natives, and dickering for their spears
Hi GuyM,
OPEC expects average US liquids output in 2017 to be about 800 kb/d higher than average 2016 output, note that they include all liquids in their estimate (C+C+NGL+processing gain). I agree this may be optimistic. The EIA and IEA estimates are lower.
Hi GuyM,
I was mistaken about the IEA estimate it has been revised this month and is about the same as the OPEC estimate. The Drilling Productivity report has Permian, Bakken, Eagle Ford, and Niobrara output up about 500 kb/d from the last 6 month average of 2016 to June 2017. The EIA tight oil estimate only increases by about 140 kb/d through March 2017 relative to the final 6 month average of 2016. Probably about a 560 kb/d increase from Jan to December is a reasonable estimate for the US LTO increase relative to the final 6 month average of 2016.
Comparing yearly average output in 2016 and 2017 assuming a linear increase of US LTO of 47 kb/d each month from April to Dec 2017, US LTO yearly average output would increase by 260 kb/d from 2016 to 2017 under the assumed scenario. There might also be an increase in average Gulf of Mexico output of 150 kb/d from 2016 to 2017 for a total average annual US increase of 410 kb/d from 2016 to 2017. If we assume the rest of non-OPEC (not including those joining OPEC in cutting output) is flat from 2016 to 2017 and demand rises by 1.3 Mb/d and that OPEC cuts are extended to the end of 2017, then the supply/demand balance will be 2.69 Mb/d lower in 2017 than in 2016. In 2016 supply was about 1.6 Mb/d higher than demand and in 2017 supply may be lower than demand by about 1.1 Mb/d, this implies a stock draw of about 400 Mb in 2017.
Total World commercial stocks are about 500 Mb above the 5 year average assuming World stocks are proportional to OECD stocks, so we may remain about 100 Mb above the 5 year average at the end of 2017. We don’t really know what World stock levels are, the best data is the OECD stock level (and Art Berman has questioned how good that data is, at least the US data).
This may be why Saudi Arabia and Russia are considering extending the cuts into 2018.
Many assumptions here, all which could be wrong, so this estimate is very speculative.
I will buy a 400k increase. My estimate of 300k is just as speculative.
Hi Guy M,
Hey we could take the average and call it 350 kb/d, but clearly all guesses about the future are simply WAGs.
Hi GuyM,
We don’t know the ratio of vertical well completions to horizontal well completions. So perhaps many of the completions last year were vertical wells and this year they are mostly horizontal well completions. Judging from rig counts the focus lately has been on horizontal wells which produce far larger quantities of oil than the vertical wells in the Permian LTO plays.
Yes, if you do a search, it was only 300 less this year than last year. They are still drilling verticals. About 630 since the first of the year. Doesn’t change my perspective. Those 630 are in the total I gave earlier.
Hi Guy,
Interesting because the EIA estimate through March is an increase of only 80 kb/d from Nov 2016 to March 2017 in the Permian basin, so it is not a big increase, but enough wells are being drilled to increase output at least through March.
Based on Enno Peter’s data, it looks like the average well is becoming more productive in the Permian basin. Maybe each average well now has a longer lateral, more sand, more frack stages, etc. These wells will be more expensive to complete, but they also have significantly higher EUR.
For example the average 2Q2015 Permian well produced 69 kbo in the first 8 months of production, but the average 2Q2016 well produced 94 kbo in its first 8 months (a 36% increase over the second quarter of 2015). Oh and I would focus on completions in the Permian basin, Eagle Ford will probably tread water.
For the Permian it is 1841 new drill oil completions in the Permian from Jan through April in 2016 and only 1096 for Jan-April 2017. Even if we add in an assumed better EUR in 2017 (which looking more closely at Enno’s data is not evident) of 36% (true for 2015 to 2016 but maybe not from 2016 to 2017) it still looks like production should be declining rather than increasing over the Dec to April period based on the reported completion rate.
In short I agree, the EIA data might be faulty for Texas.
As always we will have to wait and see.
I forgot about those vertical wells, if we assume all of them are in the Permian basin and deduct these from the totals (as they do not produce nearly as much, about one fifth the output of a horizontal well on average) so 630 from this years and 930 from last years to get 466 horizontal wells in 2017 vs 911 in 2017.
This actually strengthens your initial argument, there are 95% fewer horizontal oil well completions in 2017 and 68% fewer oil well completions (horizontal and vertical) in 2017 from Jan through April.
Hi Dennis,
“For example the average 2Q2015 Permian well produced 69 kbo in the first 8 months of production, but the average 2Q2016 well produced 94 kbo in its first 8 months (a 36% increase over the second quarter of 2015). Oh and I would focus on completions in the Permian basin, Eagle Ford will probably tread water”
How many wells were the average consisting of in 2015 vs 2016? I’m guessing more wells in 2015?
And if that is the case could it be that at least part of this increase on paper is not due to wells actually getting more productive but rather operators are getting more selective in what they completed and put in production in 2016 vs 2015?
Simply a forced cherry picking that on paper now shows increased production for the average well?
Hi Baggen,
That may be part of the story, but I have also read that they have been moving to longer laterals, more frack stages and more proppant which will also increase average output per well, there may also be high grading (focusing on the core areas). The number of wells was 629 in 2Q2015 and 517 in 2Q2016, so yes, 18% fewer wells in the second quarter of 2016 compared to the same quarter in 2015.
Hi GuyM,
The scenario uses OPEC estimates which may well be too optimistic by about 200 kb/d for US output. Note that the EIA, IEA, and OPEC all have different estimates of the future, which of course is not known with any degree of certainty.
Also note that many predictions of future output have proved too pessimistic. Many here expected output would fall much faster than has proven to be the case (including me). Currently World output remains too high relative to stock levels and demand, when stocks fall, oil prices are likely to rise and output may rise a bit once that occurs.
I agree that output is unlikely to rise as much as the EIA expects as LTO output is likely to peak by 2023 at no more than 6.5 Mb/d, maybe 2 Mb/d above the previous peak and then will decline steeply. Total US LTO economically recoverable resources from all LTO plays is likely to be less than 40 Gb or less than half the EIA reference case through 2050. This scenario for US LTO assumes oil prices rise to $120/b (in 2016$) by 2027.
Hi GuyM,
Using RRC data and the Texas output estimates of Dean Fantazzini (which are also based on historical RRC data), I took the percentage of Texas statewide C+C produced in districts 7C, 8, and 8A (Permian Basin) and multiplied by Dean’s estimate to estimate Permian output. From July 2015 to February 2017 the average annual rate of increase has been about 143 kb/d per year. I expect this rate will eventually increase due to the higher rig count in the Permian basin (with a lag of production of 5 months behind the rig count increase), your guess of 300 kb/d for the year sounds about right for Texas (mostly Permian).
It will be very interesting to see what happens when opec is asked to “lift the cut”, due to dropping inventories…
IEA monthly report is out today I think: might have some interesting stock numbers.
“in 1Q17 the oil market was almost balanced with a global stock build of 0.1 mb/d. For OECD countries, stocks grew by 0.3 mb/d for 1Q17 as a whole, nearly offset by observed falls in floating stocks and in other centres. In March, total OECD stocks did fall by about 1 mb/d.
It has taken some time for stocks to reflect lower supply when volumes produced before output cuts by OPEC and eleven non-OPEC countries took effect are still being absorbed by the market. In 1Q17, we might not have seen a resounding return to deficits but this Report confirms our recent message that re-balancing is essentially here and, in the short term at least, is accelerating.
…
OECD commercial stocks decreased for a second straight month in March, by 32.9 mb (1.1 mb/d), to 3 025 mb. Product stocks fell sharply on lower refinery output and increased exports. For 1Q17 as a whole, OECD stocks were up 24.1 mb (0.3 mb/d) due to a large build in January. Preliminary data suggests OECD stocks increased in April.”
https://www.iea.org/oilmarketreport/omrpublic/
Since 2007 I’ve been waiting for the peak to happen. All the forecasters had it wrong, but as Colin Campbell said, it’s not the date that matters but the vision of the long decline that follows. I believe we are at that point now.
Edit: Back in 2007 Jean Laherrere was forecasting a peak right about now.
I don’t care about the date, either. To me it’s more important that alternative plans be made.
I think the low prices, plus a lack of discoveries, has pushed the majors over the edge. They see the future.
Hi Boomer II,
The exact date does not matter, just that it occurs and it is finally believed by the main stream that we must use oil more efficiently and transition to alternative means of transportation. Only high oil prices (over $100/b in 2016$) coupled with flat or declining oil output will finally make people realize that peak oil is not some problem to solve in the distant future.
The date is relevant because a transition takes time, so whether it will happen in 2020 or 2040 changes the policies necessary.
So if you mean the “exact date” as in Sept 15, 2015, I agree. The rough timing of the peak (of the 12 month centered moving average of World crude plus condensate output), as in 2020-2025 vs 2035-2040 will be important (I consider the second as the “date” of the peak.
So I guess it depends on how one defines “date”, when talking about predictions of future events.
It’ll be interesting to see if Saudi can hold current rates early next year. They previously had shown declines around 5% per year, if the cuts are covering that up then they would have reached current production rates in about January from the previous peak – a bit longer now they have cut back a bit. Spring will also be the time Khurais expansion is due so they’d be able to increase flow again. Russia might be in a similar situation – they have projects ramping up but nothing new starting that was as big as in 2016 and 2017, and there have been reports that they had been using a lot of in-fill drilling in older fields, which must loose efficacy at some point.
Iran and Iraq look like early stages of natural decline as well, maybe at around 5 to 8%, which would give them about 20 to 30 Gb developed reserve each. Iraq does have new developments for West Qurna that should be on line sometime in the next 12 months.
Nigeria might increase another 150 kbpd with Bonga coming back on line fully and maybe better onshore availability, but longer term they must be fighting decline in the offshore – they had about 900 kbpd nameplate added in 2006 to 2009, but only 300 kbpd since. Bonga in 2005 and a couple of smaller FPSOs were due to be decommissioned around 2019 to 2022 based on original plans. They only have Egina at 200 kbpd in mid 2018 and some smaller in projects in the works.
I think Angola can hold plateau to 2021 but not more. I couldn’t find any field data but tried to roughly match production based on nameplate capacity and year of start, as below. I optimize plateau time, decline rate and availability (assuming all the same for all deep projects) to match OPEC production rates. Not a great fit but it did give short plateaus and high decline at 12% per year, as expected. I ended up with relatively high availability so I think I may have missed one field from about 2006, which would have have matched the peak there better and allowed lower production from the other fields.
They have nothing in construction after Kaombo, and probably now nothing that could come on before 2022, so would not likely be at plateau before 2024. A lot of the prospects, like Chissonga, looked quite challenging even in 2013, (some in pre salt and ultra deep) and there was no discussion of near term FIDs that I saw with the 2016 results presentations. Like Nigeria, Angola has been trying to get more from their developments through changing rules on taxes and local content, and have as many or more corruption issues, so may not be very attractive at the moment, and they almost certainly need the technology and knowhow from the majors to develop these fields.
Platts – Analysts question latest North Dakota crude breakeven price – 15 May 2017
North Dakota’s breakeven price for crude production averaged $24/b in the first quarter of 2017, with the breakeven in the state’s most active county averaging $21/b, according to estimates from the state’s Department of Mineral Resources.
The breakeven price puts the Bakken Shale play in economic competition with nearly any play in the world, including Saudi Arabia, but analysts caution that the latest data out of North Dakota may not be telling the whole story of what drillers are seeing there.
“These numbers don’t make that much sense to me,” said Graham Walker, an oil market analyst with Petrologica. “It’s very much an art, these breakeven prices. There are so many factors you can include or not include.”
Walker said that, when calculating their breakeven prices, North Dakota officials may be including only sanctioned wells, or only wells that are successfully completed and put on production while ignoring unsuccessful attempts. Rather than a point where wells make money, the state’s breakeven price may be a threshold that needs to be maintained before a well is shut in.
Article continues on Platts…
https://www.platts.com/latest-news/oil/washington/analysts-question-latest-north-dakota-crude-breakeven-21737015
EIA gasoline demand vs price – scatter plot, weekly data from January 2007
Not looked at this before. There are a few things but what I noticed first was that you don’t see gasoline demand above 9.5 million b/day when price is above $3.5 per gallon (I guess they used retail price data).
(The decimal point is missing on chart, the 2nd 3 is actually 3.5).
Twitter chart: https://pbs.twimg.com/media/C_6qa6ZVYAArefV.jpg
Institution of Mechanical Engineers – Batteries get a boost- 03 May 2017 – Tanya Blake
Academics and companies are racing to make the next big breakthrough in battery technology.
https://www.imeche.org/news/news-article/batteries-get-a-boost
The “Goodenough”- battery with triple capacity and cheaper raw materials in the same time will be a game changer that really kills of oil – it means a tesla like car could have a range of 800 miles, or a less range car will get really cheap and light.
When I look at my pedelec, 40 miles range with a 2.5 KG battery pack(it’s updated to the latest current technique) this will be a tiny pack of 800g to go 40 miles, or 120 miles out of the old pack.
When they are cheap (sodium / glass, density doesn’t matter that much here) you can also realize cheap storage for excess energy, putting preasure on conventional energy sources.
Or you could rework an old oil tanker, fill it completly up with batteries. Drive it to a solar farm in Australia, fill it up and then dock it up in Shanghai to empty it into the grid. This kind of density would enable this.
This will end the oil wars – because the asian countries will fast implement this technique, instead of building expensive air carrier strike fleets to secure their oil routes to the gulf. Every country with sunny deserts can then compete at creating energy, not just the few with the right geology. And with sodium / glass nobody needs to shoot out about scare raw material mines.
Let’s see, if this goes this direction peak oil will be in these years, through demand destruction.
When we bioengineer mules to run non stop at 50 kmph for 100 km, with an efficiency of 35 km per kg of hay, we will outperform any battery you can put in the market.
The Goodenough battery is not as good as Al Capp’s Shmoo. https://en.wikipedia.org/wiki/Shmoo
The “Goodenough”- battery. I was wondering if this will lead to an affordable power station scale battery backup for wind & solar?
North Dakota Directors Cut – The drop in the DUC count hasn’t been matched by an increase in completions, perhaps a reporting timing issue?
The numbers of wells is at a new all-time high at: 13,632. A big drop in inactive wells: -312.
Another chart, direct link: https://s3.postimg.org/ayq70ycar/2017-05-12_ND_Directors_Cut.png
What’s breakeven price?
I’ve not seen reliable numbers for full cycle breakeven prices, something that includes debt repayment, land prices and exploration etc. EOG made a small profit when oil prices were over $100.
Breakeven = the money the oil company spends (cost) per barrel oil produced
http://www.investopedia.com/terms/b/breakevenpoint.asp
Maybe they mean the price the operator needs to cover OPEX. That terminology is new to me. What really counts in hard times is cash flow neutrality meaning we cover all costs and have a bit to pay dividends, but the capital recovery isn’t there.
Hi Fernando,
They might be using something like your cash flow neutrality plus dividends, though I am not sure if the non-majors pay much in dividends, so it might be just the price needed for neutral cash flow, I doubt 25/b would do it though so your first guess sounds better, just the price needed to cover OPEX possibly.
I have seen some presentations where royalties and taxes were excluded from the breakeven calculations. The term is pretty useless it seems, the way it is being used.
“Analysts question latest North Dakota crude breakeven price
……………………………………..
“These numbers don’t make that much sense to me,” said Graham Walker, an oil market analyst with Petrologica. “It’s very much an art, these breakeven prices. There are so many factors you can include or not include.”
Totally agree.
I think the only reliable data from NDIC is production numbers.
Dpr is out. Interesting (if not surprising) is that the new production per rig is plateuing/dropping. So much about the msgic efficiency gains by the industry
EIA DPR – Production per rig – 2 things that I’ve heard, but not sure if true…
1. The newer rigs that have higher horse power for drilling faster are said to be expensive and I guess that some of the rigs coming back are the older slower rigs.
2. I’ve not seen any good statistics on sweet spots, some people are suggesting that some of the returning rigs are drilling in less productive rocks?
Production per rig in the Permian in barrels per day according to EIA DPR
Chart on twitter: https://pbs.twimg.com/media/C_5BWOZWAAAjc5B.jpg
I think one of the reasons is that 2 different data sets with different time sensitivities are being compared here
Baked well availability went up slightly for March, mostly back to levels in October and November for the main counties except Williams – may be due to shut down for completion work rather than weather now.
Genscape – North Dakota Crude-by-Rail Loadings Plummet with DAPL Startup Imminent – May 15th
Once the Bakken Pipeline system is operational in June, the local refinery and pipeline takeaway capacity will surpass Bakken production in North Dakota and Montana, thereby eliminating the need for crude shipments by rail from the region, Genscape data shows. Bakken production in May is forecast by Genscape to average 1.039mn bpd, while pipeline and local refinery capacity is 878,000 bpd. In June, once DAPL comes online, pipeline and refinery capacity will jump to 1.348mn bpd
http://www.genscape.com/blog/north-dakota-crude-rail-loadings-plummet-dapl-startup-imminent
Reports are coming out that DAPL oil has already started flowing to Illinois as of this past Sunday.
Yeah I thought it was working…
The Dakota Access pipeline is “mechanically complete and line fill operations are set to conclude mid-May,” a company spokeswoman said May 9. The Bakken Pipeline system is set to begin service on June 1, the spokeswoman added.
http://www.genscape.com/blog/north-dakota-crude-rail-loadings-plummet-dapl-startup-imminent
I believe Venezuela will take a harder production hit in May. At this time I’m getting news that some towns are in full revolt against Maduro’s dictatorship, saw photos of a police station taken out with a Molotov cocktail, some road blockades with burning vehicles, getting reports of people being shot by regime forces, Maduro issued a decree declaring himself absolute ruler, and there’s chatter passing around oil pipeline maps. A few minutes ago Miguel Pizarro, a heavily tattooed former communist who represents Petare in the National Assembly said there was no need to fear, and that the battle was just starting. Petare is the largest barrio or favela in Caracas, and it has turned anti government. Something is going to happen soon.
It is cheap oil and mechanization that has made our economic growth—unprecedented in human history—possible.
It’s true that Fossil Fuels (FF) powered the Industrial Revolution (IR). The IR started without FF, and FF wasn’t essential to that process continuing, but FF greatly accelerated the IR, and there’s no question that FF was the primary source of extrasomatic energy for most of the period of the IR. But, that’s not my argument.
I’m arguing about the word “cheap”. Coal wasn’t cheap. It was affordable, but it required quite a lot of work to dig up, transport and turn into something useful: early mines required a lot of work; coal trains were an enormous pain, and required a lot of labor; and early coal powered engines were inefficient and blew up often (rail passenger was very dangerous, more than contemporary car travel).
Contemporary wind, solar and even nuclear, even in the worst settings, are far cheaper than pre-WWII coal powered transportation.
hydro power, nuclear, wind and solar all took longer to become affordable than digging up coal. So coal powered the Industrial Revolution.
But…contemporary hydro, nuclear, and wind are all cheaper than coal, both pre-WWII coal and contemporary coal (especially if you include the cost of basic pollution controls for sulfur, mercury, etc). Solar is cheaper than coal in most places, and much cheaper if you include all of the pollution costs of coal (even excluding CO2). They’re all perfectly affordable.
So, to say that “cheap” fossil fuels powered the Industrial Revolution is incorrect. They were affordable. They were cheaper than horse power. But, by contemporary standards, they were very far from cheap.
IR was entirely due to FF after it was kicked started by water mills. The alternatives to FF such as wind, solar are unsustainable without FF. The energy generated by so called ‘renewables’ was under 4kWh/day per person in the US in 2014. The average American uses 250kWh/day of energy. Not sure where the energy will come from to renew the ‘renewables’.
There’s always nuclear.
Nuclear is also unsustainable without FF. However ‘renewables’ and nuclear is valuable because they leverage FF energy. For example, if a ‘renewable’ or nuclear source of energy has an eroei of 10 then the FF used to manufacture them has been levered up so you get 10 times back. I.e. Renewables and nuclear are FF extenders. They will delay but not ultimately stop our energy descent back to an agrarian society by the end of this Century.
Renewables and nuclear are FF extenders.
I’m puzzled by this. Oil has no magical powers that can’t be replaced by other kinds of motive power. A Prius or a Leaf takes you to work just as well as a Tahoe. A Tesla gets you there rather faster than it’s competition.
Here’s some comments on this kind of thinking:
Oil is a miraculous compound.
This is very puzzling. It’s a kind of odd worship, almost a fetishizing.
Oil is polluting, expensive and tends to start wars and incite terrorism.
The only people for whom oil is miraculous are those who sell it.
It is the highest energy density substance on Earth after radioactive material
That’s just…..goofy. Lots of things are higher energy density: hydrogen, aluminum, etc., etc. Oil can be pretty convenient. period. full stop.
Oil has some advantages, and some disadvantages. It’s disadvantages are becoming clearer and clearer.
For instance, the British Royal Navy converted from coal to oil just before WWII because they could steam 20% faster. In war, that’s everything. But, in freight, it’s nothing.
To win the war, they sold their souls to the devil. They became dependent on Iranian oil, produced by British Petroleum, and became enmeshed in Middle East wars for the next 100 years and beyond.
and it has not always been available.
It’s always been in the ground, just as the sun has always been there. Humanity just figured out how to use it, that’s all. And now, we’re figuring out how to use better things, like EVs powered by clean sources.
Using oil and gas as petrochemical feedstock will always be energetically favourable over the alternatives
No. That assumes fuel has to be liquid. Solar electricity is far cheaper and more efficient than any fossil fuel.
Liquid fuels are convenient, but look at the Chevy Volt: it uses about 10% as much liquid fuel as the average US vehicle. At that scale, the cost per liter is just not that important. If synthetic fuel costs $2 per liter, it will be no big deal.
Sorry, but your US lifestyle is so over the top – I think cutting back there a lot won’t even dent it really.
When I visited USA I could only shake my head in disbelief. For example hotel rooms with single glas windows – in a country where there is 100 F in summer (when I was there) and 0 in Winter (when a collegue was there). That’s pure heating or cooling out of the window (literally ), and it’s not even comfortable since you sit alway in a draft.
Or, a friend of mine build a home here in almost american plywood style – but well isolated(outside plywood – 15 cm rock wool – inside plywood, good windows). He heats it in the winter with a small gas therm for the whole house, not using much gas.
And there is no draft, even in the middle of winter.
Coal or oil for technical purpose (reduction of iron ore, chemical raw materials) is available for the next centuries – and I don’t think it is a problem to synthesize it in a few 100 years, either with space solar or fusion energy.
I don’t comment the cars, because this crazyness is spreading here, too. To much parking lots blocked because someone squeezes his mummy tank in there. I was driving with a medium size japanese car in the USA, 4000 miles cross country from the middle to the west. No need for a bigger car, or a pickup truck. You perhaps need a pickup truck when you own a farm
Yes, that’s what I think. We waste so much energy that we could back significantly without sacrificing quality of life.
Coal or oil for technical purpose (reduction of iron ore, chemical raw materials)
Smelting of iron ore doesn’t need coal – renewable hydrogen would do just fine. It would be a little more expensive, but affordable. Coal is only needed for smelting ore into iron – most US steel comes from recycled scrap, using just electricity (which can be wind, solar, nuclear, etc).
Petrochemicals can use hydrocarbons from any source. Coal for centuries (as it’s not burned) but hydrogen can come from lot’s of places, and obviously we have as much carbon as we need…
My company has an office in Michigan that I visit occasionally. The big meeting room there is so cold that everyone wears a winter coat to meetings — even in the middle of summer. Sadly, you can’t open the windows.
Generally, the office is freezing. Several girls there have made knitting fingerless gloves a hobby. They meet and share tips about how to do it, and you see them wearing them all the time.
To set the temperature, you have to call the janitor. He comes with a ladder and removes some ceiling tiles and uses a monkey wrench to turn some valve settings or something. Doesn’t really help though, the problem has persisted for years.
I suspect America could live much better with a lot less energy consumption.
I suspect America could live much better with a lot less energy consumption.
I think most Americans are completely oblivious to their energy consumption.
Case in point: This a something that really irritates me, btw… I often see people at the local supermarket standing in front of those refrigerators with glass doors holding the door open while they make their selection.
The whole idea of having a glass door is so you can see through it and not have to open the door until you have made your selection. Not to mention that, holding the door open fogs it up, so the next person can’t see through it even if they wanted to! Just curious, am I the only person who is bugged by this kind of behavior?
You are not alone. The world is full of people who are gobbled up with the dumbaxx.
How about sitting in their car to eat lunch with the engine running? Or leaving the engine running to cool a parked vehicle in the shopping center parking lot while shopping? The examples are endless, many of them milennials, which surprises me.
But, human population is the elephant in the room. Everything else is just elephant dung.
Jim
Yep that 0.17 gallon per hour will make a lot of difference a the end of the day. We sit in traffic jams too.
Meanwhile millions of people leave their TV’s, computers, wall buds, house lights on all day long. No need to mention the video game heads playing hours a day sucking up that coal and nat gas through their high power systems.
Or maybe we should talk about the person cooking dinner inside in the summer heat with the air conditioner cranked high to keep the house cool.
How about that ice maker on the fridge. Bet people don’t realize it nails them for over $500 in energy costs over the lifetime of the fridge. Buying that big side by side fridge with the bells and whistles over a similar top freezer without the extras will cost a person about an extra $1500 in energy over the life of the fridge with another $1000 up front for purchase.
There is no end to the glamour and glitz and the energy blitz. Live high today, who knows about tomorrow?
Yep, it’s called freedom.
While the average ICE will use 1.4 gallons per day and the average EV will use 10 kwh per day, the average house uses 30 kwh per day plus over $2000 in annual heating costs for oil or propane in the north. Don’t know what the air conditioning costs are in the south, but the must be significant.
Maybe we need to work on our houses and buildings, since cars are proceeding toward higher efficiency and alternative energy already.
Is it possible that energy conserved results in faster population growth? If so, conservation might result in an even greater catastrophe when collapse comes, that is, a greater die-off.
Tom Wayburn
P.S. I am still looking for net energy data for world petroleum production, that is, ERoEI* as defined at http://eroei.blogspot.com/
Not likely. Family planning and energy conservation are both the result of education and affluence (if you have extra money, you can invest in insulation, electronic thermostats, better HVAC, etc., etc.).
So, energy conservation will tend to happen along with reduced population growth.
Not that population growth is the primary thing we need to pay attention to. Which can we change faster and more easily: fertility and population size, or our thermostat setting and our vehicles?
—————————–
Let me put this another way: why do people have children? Is it because they want to, and more resources allows them to?
Well, it turns out that’s not the case. In fact, most people want to have fewer children….well, most women, anyway. Even in the US, about 50% of pregnancies are unplanned. Everywhere in the world, women are forced to have children they do not want because of tradition, and fear of being neglected in old age. As women gain education, careers, and independence, and as societies create safety nets for the elderly, women eagerly stop having children.
So much so that in many developed countries the primary goal of governments is to encourage women to have more children (which tends not to work – they’re not dumb).
I know a guy who lives in St. Paul. He told me sometimes he comes home in the middle of the summer to find his wife huddled in front of the (gas) fire in the living room because the air conditioning is turned up so high. True story.
Some March GoM data out. Looks like Stones is finally getting going – up to 25 kbpd oil. I think they expect 50 kboed for phase I, which would be a bout 40 kpbd oil (streamday, which might be 36 to 38 average). They have been cutting about 10% water from the start, I doubt if that was in the original plan for well design.
On the other hand in Lucius at least one lease, and maybe two, is/are getting seriously hit with water breakthrough, I don’t know if they have cost effective options to deal with this. The field is supposed to be about 300mmbbls – I don’t know the split or who many wells are planned but they’ve only produced 15mmbbls from each of the effected leases so far. In general the deeper the wells (and Stones I think is one of the deepest, but Lucius pretty deep) the bigger the impact of water and the more expensive it is to deal with.
George, Thanks for the charts above. Pretty insightful about Lucius – so that is production per OCS block. The high water cut is most severely impacting the blue lease, which also currently has the lowest oil production – so that lease may be about to water out, unless they have another well they can drill on that lease. The water cut for the red lease may have stabilized, or even gone down. The green lease is still making all oil – hasn’t seen any water production yet. I’ll do a little homework on Lucius and report back tomorrow.
A significant portion of the value the Lucius platform brings is that is can act as a production host for a number of nearby tiebacks. In addition to production from Lucius, it is also handling production from Exxon’s Hadrian field (which I believe is mainly a gas field) and will be host for LLOG’s Buckskin and a potential host for Anadarko’s Phobos.
Geo, what’s the depositional environment for the sands? Are they near shore or deeper water? I mention it because in Venezuela I’ve seen very deep Eocene and Paleocene sands produce water for a while and then clean up. That water was brackish, and it’s a pretty complicated story.
Fernando,
All of the deepwater GOM reservoirs we have been talking about were deposited in a deepwater setting – either channels or sheets (fan lobes), or some hybrid. Almost all of the deepwater Miocene and Wilcox (Paleocene-Eocene) reservoirs are subsalt, and are not associated with an amplitude anomaly – meaning one cannot use amplitudes as a tool to predict sand presence. Fortunately, in most cases, the sands are extensive enough, at least at a field level, that you can be fairly confident in sand presence.
(This is not the case with the early GOM deepwater fields. Those were just off the shelf edge, outboard of salt, and usually amplitude associated.)
I’m surprised at how quickly some of the wells cut water and how fast the cut can rise. One well on Dantzler went to about 50% in 13 months from start-up (it was off line in March), and both leases in Cardamon are looking like the bad one in Lucius, with consequential rapid decline (it also seems to have a lot of gas and condensate production so must be quite a complicated set up). One lease on Caesar, with a single well, hit 45% in about five months and died away. It seems to be coming back after a year or so off line so they might have done some kind of work-over. I wonder how much of this was expected or suspected during design?
I see Wood Group has got the Anchor and Tigris conceptual and pre-FEED designs). At the moment they might be last significant new builds for GoM without new discoveries (even Vito seems to have gone quiet). At the same time Wood laid off 170 – not very encouraging.
I tried to find any record of production from the Hadrian North leases to Lucius, as the Anadarko presentation shows them tied in, but could’t. They didn’t even appear in the list of BOEM qualified fields (I’ll have another look though). I know Hadrian South is gas, and is tied in and about at plateau, but I had the feeling from the time ExxonMobil had the lease that Hadrian North was actually heavier oil, but don’t remember why. The Lucius lease that cut a lot of water has only one well at the moment, the others have two (the middle one) and four.
To follow up a bit more on Lucius – cumulative oil production through March is about 55 mmbo, and the reservoirs are not that deep for the deepwater GOM – +/- 20,000.
I had a go at projecting GoM production bottom-up, based on current developed fields and undeveloped discoveries, as below. Obviously this looks nothing like EIA are projecting. The numbers in brackets show nominal nameplate capacity in kbpd (for oil only, although now companies usually quote boe if they are exporting the gas). A lot of the capacities and start up times are guesses but I checked overall production against reported figures and where there is data it is reasonably close. Where no numbers have been given it’s likely that I am too high, as some of those will be cancelled or downgraded. For existing on-line fields I used 18% decline for mature fields and 12%, after a short plateau) for new fields. These are lower than the 20 to 25% that would be assumed from recent Schlumberger depletion numbers, so allow for some reserve growth (but I suspect the declines here are still too shallow for both). For new fields I guessed start-up data and period, plateau period and decline rate, dependent on field size and tie-back versus new facilities. Almost all the details are wrong but the average may be closer, although I think likely too high having seen how fast these deep-water wells can decline. Overall the fields give 7.5 to 8 Gb more production, dependent on end-of-life cut off flow, apart from all the other assumptions. Any new discoveries would be additional, though there don’t look to be many more at the moment. Any known corrections welcome.
George,
This is pretty impressive. Is shelf production included in this?
Current GOM cumulative production – deepwater plus shelf is about 21 Gb.
The additional 7.5-8 Gb you project goes beyond 2030? correct?
That would bring GOM total production to about 29 Gb or so.
The low-mid-high range I projected in my post last September was 30-37-47.
Both the mid and high cases assumed some new discoveries. You do not include those in your projections.
Based on this initial analysis, I would say we are quite well aligned on total production from existing fields, and projects that have been sanctioned, or are most likely to be sanctioned.
I like how you can support the ramp up in production in the 2024-2025 time frame with projects.
8 Gb assumes the declines run out forever, I assumed 0.5 Gb to allow for end of life shut off. There should be some discoveries, but it looks like most are going to be 25 to 50 mumbles and tie backs, and may be cancelled by my assumptions on reserve growth for existing fields. The shelf is included in mature fields but I included a “shallow field” addition this year with a 4 kbpd plateau for the next 10 years (that might cover some small condensate production in deep water as well.
That is fantastic, George. If you use expected completions in the Permian vs. the well count, one could estimate that GOM decline would possibly offset any Permian increase into sometime in 2018. At current activity levels. Make a great post, and article.
GM, thanks – I’ll update the chart if I get better and new data, but other than that there is nothing I can add that isn’t in the brief description above, so I don’t think it would make much more than an occasional comment, (except, looking again, I like the almost linear final run down – that is pretty typical as smaller fields are added with falling frequency to a larger, mature exponential decline).
Us weekly production crude oil – 0.097%……
All fossil-fuel vehicles will vanish in 8 years in twin ‘death spiral’ for big oil and big autos, says study that’s shocking the industries | Financial Post
Hi Boomer,
Thanks. I thought Seba was too optimistic by 20 years, but …
http://oilprice.com/Alternative-Energy/Renewable-Energy/Is-This-The-Beginning-Of-The-End-For-Gasoline-In-Asias-Largest-Markets.html
As the rise of electric cars looms ever larger on the horizon for India and China, far-reaching implications for the global oil market are impending. Oil and auto executives are well aware of the coming change, warning refiners to prepare for a future where gasoline is not their primary source of revenue.
The shift away from fossil fuels is coming in swiftly, catalyzed by new policies in India and China, where governments are trying to combat some of the world’s highest levels of pollution by slashing oil imports. Both nations have expressed a desire to put themselves at the forefront of the rapidly expanding electric car market.
China released a “road map” this month stating their plan to replace at least one-fifth of new car sales with alternative fuel vehicles by 2025. India proposed to take more extreme actions, creating strategies to electrify all vehicles in the country by 2032, as reported to Reuters.
It isn’t one thing that will change gasoline consumption. It’s a collection of factors hitting at the same time: Improved EV technology. Car ride networks. India and China seeing economic opportunity. Out of control pollution in those countries. China looking for a way to exert influence in developing countries. A desire to be less dependent on oil countries. Etc.
http://www.bizjournals.com/denver/news/2017/05/16/denver-energy-company-nixes-north-dakota-asset.html
Every month I post on my facebook feed, and in those groups involved with fighting Enbridge Energy Partners and their 5 pipelines here in Wisconsin, that it’s “X___ months until the Fracking Bust.”
Latest post will be June 1, “91 months until the Fracking Bust.” By this I mean the point where it will be so obvious that the major fracked oil and gas fields are in actual decline, regardless of the EIA latest hype or the number of drilling rigs being deployed and other supposedly forward-looking numbers.
So, the point where it’s obvious that fracked natural gas, and oil, together have hit their peak and are in permanent decline.
Does anyone think this timing is overly pessimistic, on my part? The 91 months puts the Bust as January, 2025. By then, the amazingly huge Permian find should have been pretty well drilled to perfection, eh? And a huge swath of western Wisconsin, southeast Minnesota, and northeast Iowa farmland should have been reduced to desert-like gravel pits after the frac-sand has been cleaned, washed, and trainloaded-out for the big fracking fields.
B.G.
Middle Wisconsin
Hi BG,
No, in my opinion 2025 is too optimistic, my guess would be 2020-2025 with 2022.5 as my best guess for a US peak in LTO output, 2025 may be a good guess for when the decline becomes very steep and will be hard for even a cornucopian to ignore.
GOM guys. Curious.
When a project on some lease is developed, at what point is an assay done? Not the API degree and sulphur content thing, the % refinery yield for various components, diesel, kerosene, naptha etc.
And more to the point, how far away would the next drilling require a different assay? More particularly, is the whole GOM roughly the same constituent yield? How far away must one go to see signif variance?
Analysis is done as early as possible from initial test wells onwards, until there’s no more useful data to get. There are various, specific tools designed to take downhole samples and ensure the sample integrity is maintained as it is bought to the surface. Sample analysis is how CoreLabs make a lot of their money. Analysis is often by gas chromatography and mass spectrometry. It can be of various complexity (and cost) down to looking for the smallest concentration of biomarkers, which are residual, only slightly degraded components which are obvious products of living cells (one of the problems with abiotic oil theory). Oil from a given basin or even sometimes between neighbouring fault blocks is not all the same, it’s composition depends on the source of the hydrocarbons and the subsequent geological history (e.g. range of pressures and temperature, how it migrated, whether lighter components could escape etc.)
So . . . a diesel rich lease’s flow could be signif different from a lease’s flow only 40 miles away?
Have stayed focused on assays since a report some yrs ago that a barrel of Libyan oil of given API degs has 2X the diesel as an identical API deg barrel of KSA oil. And a report that the global annual oil consumption growth is concentrated in middle distillates.
April figures for China and Columbia show them both just about hanging onto a plateau this year, or in slight decline.
Venezuela’s Oil Production On The Brink Of Collapse
Desperation is spreading in Venezuela as violent protests continue to paralyze the country, further damaging the country’s shattered economy. Venezuela’s already-decrepit oil industry is deteriorating by the day, and an outright implosion is no longer out of the question.
Huge Snip
The possibility of all hell breaking loose is not zero. The WSJ reports that Venezuelan security forces are at their breaking point. Young, underpaid members of the national police are often not given food or water while on duty, and are asked to constantly beat back rapidly escalating protests in scorching heat, around the clock. Also, police and soldiers are not immune to the food shortages and economic collapse that the rest of the country is suffering through. The loyalty of the security services to the President no longer appears rock solid.
PDVSA and the national government avoided a debt default a few weeks ago, but with obligations looming later this year and a dwindling pile of cash with which to draw upon, the problem is not going away.
As far as the oil sector goes, the best case scenario for Venezuela is steady, if rapid, decline in production – a loss of 200,000 to 300,000 bpd this year. But the darker scenario is a much more sudden disruption if the country implodes. There is no way of knowing if this will happen, but analysts are growing increasingly concerned about the possibility. “Oil production continues its downward drift due to service provider cuts, power shortages, inability to obtain imports and irregular salary payments,” Helima Croft, commodities strategist at RBC Capital Markets, wrote in a recent report. “The oil question is whether current conditions could set the stage for the type of industrial action that cut exports by nearly 80 percent in the early 2000s.”
I’d guess things are complicated further by the need to use the Venezuela upgraders to process about 650 kbps (might be wrong) of XH oil. Without them the oil couldn’t be further refined, and they need big turn arounds for maintenance every 3 to 5 years (another guess). Without the right knowhow and technology they may be easier to fail and harder then to recover that onshore wells – of course they may be the reason for oil production declining so much recently. I also wonder what happens to all the waste residue from them, it would likely be very high in Vanadium.
I think things will collapse in Venezuela by this fall. The country has debt payments of around $5BB in October and November and only $10BB in reserves which are dwindling as the country imports food and now more and more gasoline and production declines. 3/4 of the reserves are in gold and it wouldn’t surprise me if some of that gold is already pledged against loans or tied up in some type of swap.
China is funding lots of things there. Debt payments mean nothing. And btw, Ven debt is miniscule for a country that size.
Only 50% of GDP (even with shrinkage). (The US is over 100% of GDP, with growth).
Wall Street considers Venezuela debt payments to be “suicidal” because they have the audacity to actually make those payments. WS wants them to roll it over and compound it and submit themselves to big banks — and become Greece with oil reserves.
Local governments are lining up in favor of “public safety, health and the environment” rather than gas and oil industry interests. This is the result of the Firestone explosion and is a new development.
Political fallout of deadly Firestone explosion turns up heat on Hickenlooper – The Denver Post: “Colorado Front Range cities and counties, 13 state lawmakers and 1,539 residents on Tuesday blitzed Gov. John Hickenlooper with letters urging him to accept an appeals court ruling requiring state protection of public safety, health and the environment as a precondition before allowing oil and gas drilling.”
Just a quick note on good enough which is very interesting. “However, the solid-glass electrolytes can operate at -20°C, which would make this type of battery perform well in a car even in very cold weather. ” Automotive grade is -40C, not good enough yet.
Low temperatures are a problem for all vehicles. On the other hand, there are solutions. These solutions also happen to be useful for charging EVs…
“Block heaters are frequently used in regions with cold winters such as the northern United States, Canada, Russia and Scandinavia. In colder climates, block heaters are often standard equipment in new vehicles. In extremely cold climates, electrical outlets are sometimes found in public or private parking lots, especially in multi-storey car parks. ”
https://en.wikipedia.org/wiki/Block_heater
I have seen them in middle Sweden.
Every parking slot at the street had an electric plug in front of it, always a double for 2 slots. They have been secured with locks.
Texas output for March is online on the statewide query. Looks flat to me.
Hi Ron,
Thank you for the nice charts. If I tried to convert even one of my many Peak Oil Denialist friends, I would use EIA data, which is not likely to be biased in my favor. Obviously, despite technological “improvements” and possibly because of them, the fraction of gross world production remaining after the energy costs of obtaining the petroleum have been subtracted (including the support of stakeholders) has been diminishing; therefore, I would very much like to have a chart of net world oil production over the years since 1980. For what it’s worth I computed what the net production would look like under various conjectured linear rates of diminution. I will now post the MS Excel work sheet for two imaginary rates at
http://eroei.net/guessnetprod.jpg . If requested, I will supply labels.
The EIA drilling report for May has been published this week. It reveals more and more the point I have been making over the last years about the structural weakness of shale production. I can now deliver more numbers behind my view that the US will undergo an extreme drought of energy supplies – especially in natural gas – over the next years.
Below chart depicts the frenzy new production run in the Permian (2.5 mill bbl per day annualized – blue line). However, as the legacy decline rate increases exponentionally (red line) as well, the net production growth (yellow bars right hand scale) did not yield more than 1 mill bbl per day and actually declined over the last two months.
As the legacy decline accelerates now faster than new production growth, Permian net production will decline again by the end of this year – despite ferocious production from new wells. Despite running much faster, the Red Queen is actually moving backwards soon. This trend exists also for shale gas as Marcellus and Utica net production came virtually to a standstill, despite frantic production growth from new wells.
As the proportion of wells older than 1 year is now over 90%, the legacy decline becomes more and more dominant for the net production. At the beginning of the shale boom, when only a few wells were older than one year, legacy decline did not play a big role. This made shale production much more attractive as it is today and will be less in the future.
This reminds me to the ancient Greek parable of the hare and the turtle. Who will win an eternal race between the hare and the turtle? Although common sense would say the hare – it is of course the turtle. At the beginning the hare (new production – blue line) speeds ahead, yet over time the turtle (legacy decline – red line) catches up due to its enormous breath (increasing number of existing wells) and outruns the hare on the long run.
It is fascinating how Greeks understood already 2000 years ago how basic patterns in nature work. This analogy can be also used for investments. What is true today may change totally over time. As US debt stands today at a very high level, new debt (the hare) does very little contribute to economic growth as most of the new debt is used to serve existing debt (the turtle). The US government issues roughly USD 7 trillion of new debt per year. USD 6 trillion is going straight to serve existing debt. Just USD 1 trillion is going into the economy for new projects and consumption. It is therefore unrealistic, that the US economy is going back to 4% annual growth like it has been during the Reagan times when existing debt was very low. As the turtle (existing debt) wins the race, the US, Japan and Europe will sink deeper and deeper into depression of economic quicksand. There is very little chance of higher inflation and runaway economic growth.
Mr. Leopold
Glad to see you posting again. I hope all is well with you.
Setting aside your observations regarding US debt (about which my pessimism may exceed yours), I would – as is customary – take a strong contrary stance regarding output from the shales, especially natgas from the Appalachian Basin.
Using Enno Peter’s excellent site, shaleprofile.com, one can quickly see not only the enormous increase in output from, literally, 1/3 the wells, the flattening of the decline curve in newer wells is also viewable.
When one sees the overall Basin’s output falter, one should correlate that to the exceptionally low recent realized prices of the producers.
With the introduction in a few months – weeks in the case of Rover’s Phase 1 – of the Leach Xpress, Rover, and the Mariner East 2, Appalachian Basin output will be several billion cubic feet a day higher this time next year.
Garownteed, and I’ll even bet you a strong German stout on it.
The production output from wells in this area in the last 12 months has been nothing short of remarkable.
Some of these wells are approaching 5 Bcf cumulative in a few months’ time – a figure just a few years ago was thought only achievable by a few select wells over many decades online.
You may be interested to note the turnaround in first quarter 2017 cash flow for several of the AB operators.
Apparently hedging at $3.50 mmbtu works well for their bottom lines.
Not going to go into the vast export of NGLs from Texas and Marcus Hook which is both underway and set to accelerate dramatically, but whole fleets of specially designed and constructed ships are starting to ship liquefied ethane and propane globally.
Once again, best wishes, Mr. Leopold … but have no doubt, Cowboyistan is still in its early stages.
coffee,
Thanks for your reply and giving me the chance to present my arguements.
In below chart I have made the analysis for Marcellus, which is – after a huge breakdown in production two years ago – in a second wave. You can see that production from new wells (blue line) soars to soon record levels. However, so is the legacy rate (red line), which soars much faster than in the first wave, leaving virtually no net production growth (yellow bars – right hand scale). Despite soaring production from new wells, overall production in the Marcellus will decline sharply during this year due to the exponentially rising legacy rates.
During the first wave of production, Marcellus produced net 4 to 5 bcf/d, today it is practically zero at the same level of production from new wells. That is a huge difference and this gap opens up even further in the future. This means also a tripling of production costs, which will lead to a cash crunch for gas companies. The massive crash of the stock/natgas ratio is already a signal for this trend.
In my view shale production is on track to become one of the biggest industrial errors in history at huge consequences for the energy and finance sector.
Hang on there, Mr. Leopold.
While I myself do not get involved in any investment mode with all this shale stuff, I do track it a bit with occasional fine tuning type of attention.
The past few years, I’ve very closely followed Appalachian Basin operations to the point of long term monitoring of individual wells, pads, and sub regions in the tri state area.
Gotta tell ya, anyone who thinks the economics are going to decline with HH in the $3.50 range is apt to be very mistaken.
Case in point, the five wells on a single pad, the King from Cabot. Cumulative production is over 22 Bcf in a little over 7 months.
These wells are 7,000 foot deep. Don’t know the lateral length, but 8,000′ is becoming the norm.
So, if the wells cost $8 million each (less, according to Cabot) and generate – at $3/mmbtu – over $66 million gross revenue in a few months, the $40 million cost may reasonably be expected to be covered fairly quickly.
Mr. Leopold, this example is definitely NOT cherry picking as wells like the T Kropas are flowing 34/35 MMcfd just coming online.
You may want to glance at the recent stories about shipping liquefied ethane from Marcus Hook and Morgan’s Point.
The newly built Dragon fleet (8 ships) and the much larger (87,000 m3 – 48,000 ton) VLECs dedicated to supplying the new cracker in India, are just part of the massive investment in moving NGLs from the shales.
C’mon now, Mr. Leopold, there’s lottsa money moving around … we gotta help you grab some.
coffee,
I admire very much your detailed knowledge. However, the big numbers tell already, this is going into the wrong direction. Why can natgas shares not rise, despite a reasonable natgas price and monster projects?
The reason is the legacy rate. The rising legacy rate keeps cash flow from existing wells low. If the legacy rate decline is too high, companies have to stop drilling due to cash flow constraints. They will soon have to, even if the natgas price stays the same.
Below is another chart, this time it is Utica. It is a relative young play, which did not see any serious slowdown yet. You can see how the legacy rate (red line) explodes in an exponential fashion. This is what any momentum player would love to see. The gut feeling tells me this curve can only go to the moon.
There remains the question why legacy decline rates accelerate so fast. My interpretation is the the sheer depth of the wells create a high initial resevoir pressure, without actually containing that much hydrocarbons.
Mr. Leopold
Now … the Utica, a play I’ve been tracking since near the outset.
Not to be at all a smartass, but – displaying some of the variability involved …
Does your Utica chart include Utica wells from West Virginia? From the Deep as well as shallow Pennsylvania wells?
If, as I guess, it includes only the 1,562 Ohio Uticas, it would incorporate the oil/condensate/dry gas areas.
The 2016 oil production from Ohio plummeted from 5 + Billion barrel in 2015 to about 3 1/2 Billion, one DAY’S output from the combined Permian/EF.
It is becoming a gas play and I imagine the huge legacy decline you show is the associated gas from the oil/condensate wells.
Conversely, the 9,000 + foot deep dry gas wells in Belmont and Monroe counties, particularly, show 6/7 thousand psi Flowing Casing Pressure at the outset and flatline production at 15 to18+ MMcfd for many months.
Big difference in characteristics.
If your reference to high initial pressure concerns all those ‘eye popping’ high IPs from 2 years ago (Deep Utica)… that’s another story as the dozen or so results range from mediocre to spectacular.
This last factoid is a prime reason why I track the operator’s ongoing efforts in ‘cracking the code’ to the Deep Utica as well as determining its size.
coffee,
There seems to be another error in dimensions as you wrote:
…The 2016 oil production from Ohio plummeted from 5 + Billion barrel in 2015 to about 3 1/2 Billion……
5 billion barrels per year is the equivalent of 15 mill barrels per day – the whole US has never produced such an amount of oil. So, this is a complete mismatch of dimensions. Nevertheless, this is a good example how the whole discussion in the shale patch goes on : getting lost in details and missing completely the big picture. The analogy of the philosopher brought by Ves is a perfect description of the current situation.
Mr. Leopold
There are actually two errors in my numbers the ‘billion’ was to be ‘million’, but this new tablet freakin’ auto non-corrects every other word I type and I don’t catch all the errors.
Second, I posted from memory before checking, rare for me as timeframe was for 4th quarters, 2015/2016.
Proper statement should have been Ohio 4th quarter oil production 2016 was 3.6 Million barrels, down from 2015’s 6.4 Million.
Yearly total 2015 – 23 Million barrels oil.
Yearly total 2016 – 17.9 Million barrels.
Good luck in your investments, Mr. Leopold.
coffee,
Thanks for correcting your mistake. I fully understand this as I have also my issues with machines thinking they are smarter than myself
Coffee,
I have finally figure out where is the problem in your analysis. But this is the problem of the whole society not just yours. You take the problems very seriously. When you are using certain logic, given the premises, that logic looks perfect. Here is an example:
A great philosopher is aboard an airplane. He is sitting in his seat and thinking about great philosophical problems when suddenly announcement comes from the captain: ” I am sorry, there will be slight delay – engines number one is has cut out and we are now flying on three engines”.
Ten minutes later another announcement: ” I am afraid there will be further delay – engines two and three have cut and there is only number four left”
So the philosopher turns to the fellow sitting next to him and says “Gee, if the other one cuts out, we will be up here all night.”
When you are thinking along certain lines, the very direction of it makes certain things possible, but also at the same time absurd things are possible.
Look clearly at absurdity of shale, not only that shale has created absurd thing of still drilling bellow economical recovery costs in US market for 3 years, but banks & shale are trying outdo themselves in making even greater absurdity by drilling and exporting gas at financial loss on the world market!!!
Is anybody sane there??? Someone has to be sane in order to see this insanity.
Ves
There are many reasons why I refrain from delving deeply into the economics of this so called Shale Revolution.
However, whether the hundreds of billions of dollars pouring into this endeavor proves to be prudent, prescient, absurd, wasteful, or … fill in the blanks, I – a guy sitting in front of a computer screen – feel completely unqualified to pass judgement on the decisions of, literally, armies of professionals who continuously invest staggering amounts of resources to extract hydrocarbons from these unconventional plays.
What I DO feel I possess is a fair amount of knowledge regarding operational viability as well as general output potential. (Hint on the last … a Kardashian-Size Asston – KSA – will be extracted from the Uinta, Rogersville, Mancos, Turner, formations as well as the host of more familiar shales currently garnering headlines).
I’ll let the money guys deal with their area of expertise, and, superficially gauging 1 Qtr 2017 from many, an inflection point may have been reached.
… quick follow up after re reading your post re increasing costs for newer production.
No.
Pads in Pennsylvania cost between one and two million bucks per.
20 to 30 wells, easily, will be drilled on these already-in- place pads in the future, especially in the southwest.
LOE is much less with gas than oil.
Essentially, the lion’s share of the infrastructure investment has already been invested.
Edit my first post … T Kropas flowing MMcfd, not Bcfd.
Marcellus is Mighty, but not that mighty.
coffee,
We will see how this works out over the next few months.
As far as I can remember you have said last year, that we will see a flood of new and cheap supply due to new pipelines. This did not happen as we have still an overall decline in US gas supply and gas prices increased year over year substantially.
For my part I have placed my bets.
Re pipelines, by the end of this year, takeaway from the Appalachian Basin will increase significantly … a veritable flood, I’m tellin’ ya.
Hang on to your life vest, Mr. Leopold.
coffee,
I fully agree that there is a massive wave of new gas production in the US. Just 10 bcf/d are coming online this year in the Marcellus/Utica region alone. This is the euqivalent of the production of Qatar.
However, this time the new production is eaten up by the legacy decline, which stands in the Marcellus/Utica region at 9.5 bcf/d (7 bcf/d for Marcellus and 2.5 bcf/d for Utica) leaving the net production growth at a mere 0.5 bcf/d.
Furthermore, the legacy decline grows now much faster than the new production, which reduces companies cash flow leading to a very likely production decline during the fall.
In the Utica region, the decline rate is now 2.5 bcf/d out of a total production of a little bit more than 4 bcf/d leaving a decline rate of 70 % of total production. If this continues Utica has to redrill its full production every year which equals a 100% decline rate per year.
As one would have expected the decline rate as % of total production would stabilize at some point, it is still soaring. This has been the big surprise of the last months. This is what I have foreseen all the years. And this not a vision anymore, the numbers of the drilling report prove it.
Mr. Leopold, you opinions regarding the role Appalachian Basin decline has in its ability to fund America’s energy future are quite similar to those of Art Berman’s and our old friend on POB, Jeffrey Brown: http://oilpro.com/post/31246/strong-natural-gas-prices-and-tight-supply-2017.
The commenter you’ve addressed is clearly, and admittedly, ignoring economics and the role that debt plays in the financial condition of the company(s) engaged in shale gas development. The shale gas industry has had some horrifically disastrous years prior to 1Q2017 and one quarter of small profits (but little to NO deleveraging of legacy debt), of course, hardly indicates a momentous beginning to financial success. Its important to note, I believe, the references made to how you, Mr. Leopold, can benefit from the “mountains of money moving around” the App Basin and to your “investments,” which I believe gives us great insight into the commenters motives.
Ves’s analogy is spot on. The shale industry, oil and gas, has done a masterful job of self promoting its abundance agenda. Many people have fallen for it, hook, line and sinker. To not believe in, and support the shale revolution in America is, well, un-American. Those folks, a nest of whom live on Seeking Alpha, ignore market fundamentals, decline rates, costs, the complete lack of profitability and how new wells must bare the financial burden of legacy debt. They instead focus on monster IP’s, monster fracs and monster EUR’s, which have now been proven to be grossly exaggerated. Bigger is always better, when one ignores economics. I hear, often, and am always stunned by the narrative…people do not drill wells to intentionally lose money nor do people loan money to companies with they believe they will never be paid back. I find this remarkably naïve.
The only reason to cheerlead for the shale industry is for short term financial gains that may, or may not occur, by buying stocks in a public company of your choice. Over producing our nations last remaining, reasonably affordable, natural resources is a mistake and the middle finger to our children and their energy future. Exporting our remaining resources, as the commenter also makes reference to, is the worse of all mistakes. People that promote that are only looking after their own personal short term financial gain and will mysteriously all be MIA in another decade when America’s resources are gone and we are totally at the mercy, once again, on imports from foreign sources.
Mike,
Thanks for your comments and feedback.
I am fully aware of the benefits of a vast and cheap energy source for the US economy. However, it must be real. Otherwise the consequences can be desastruous (see Enron).
How can we check in a simple measurement if this is real or not? The key is in my view the production cost (finding and lifting as well as transportation). This is in fact no easy task as the drilling cost alone does not tell how long the oil of a certain well can be produced.
This is the trick the shale industry and Wall Street uses to tell people about low drilling cost of shale by quietly assuming that the drilled oil lasts as long as any conventional oil and gas well. However, conventional oil and gas wells last ten years and more (implying a 5 -10% yearly decline rate). The drilling costs are then discounted over the life of the well.
Now the shale wells have a much shorter life, thus the drilling costs are much higher when discounted over the shorter life span and lower amount of produced oil or gas.
As long as shale well decline rates were in the region of a 20-30% decline rate per year, as it were at the beginning of the boom, this did not that much matter and has been ignored in the short term as this would come up as an issue anyway on the long term.
However, the decline rates were not stable and soared towards just recently 70% based on total production (see below chart for the Permian).
In other words, all the costs for drilling and finding as well as for acreage have to be discounted now for just 1.5 years, which makes shale now extremely expensive versus conventional drilling.
As Wall Street and its consultants have quietly assumed that decline rates stay stable over the long run, the below chart – as innocent as it looks like – should trigger a huge panic in the boardrooms of Wall Street banks.
Mike you sound more like a collectivist then a oil and gas explorationist. Since when do folks like you tell other private property owners what they can sell and to whom they can sell and at what price they can sell their private property.
your argument reads like this: I can not compete with those more enlighten, more experience and better financed then me so I think I will use my time on earth to complain. The ends justify the means argument you advance, is classic socialism, mixed with your version of “patiotisim” all to advance what you see to be in your best interest.
quite pathetic actually??
maybe this will cheer you up
http://oilprice.com/Energy/Energy-General/This-Could-Be-Oils-Last-Trip-Into-The-40s14117.html
TT, my long, arduous career producing oil and natural gas is about over. I have made all the money that my family, and my employees families will ever need; I don’t need to “compete” with anyone and I most certainly do not need to “finance” what is left of my career away by borrowing money to drill lousy shale oil or shale gas wells.
Now I care about the long term energy future of my country and the life my children and grandchildren might have in a world where hydrocarbons are scarce, and expensive. Conservation is critical to that future and for your education, countless times over my industry’s history, regulatory entities concerned about conservation, and waste, have told producers what they can and cannot do with other peoples “private property.” That is precisely what needs to happen again, NOW !
I actually think that me-first people like yourself are a threat to America’s energy future and I hardly consider that patriotic. Quite the opposite, in fact. Otherwise your personal insults are exactly what I would expect from someone like yourself; I consider the source, and the venue, and ignore them.
Very interesting discussion here between Mike and TT. I agree wholeheartedly with Mike on this. To allow export of a critical resource that is in short supply (we import energy to the tune of billions/yr, and it is depleting) and so crucial to the nations economic health, just to benefit a small sector of the population is truly absurd. Mike said it well- ‘me first’ over the common good. I guess you can tell who I voted for- the majority vote.
TT- what is wrong with being a collectivist. In this discussion it means being conservative with the nations resources, being thoughtful with longterm energy/economic planning, putting country over individual. These are good values. Like keeping someone else from shitting in your water. Collective policies protect water. You like to drink clean water? You like people to respect your property line. Collectively, we have rules to enforce that. Good stuff.
A man with your sensibilities obviously needs to be heavily regulated. I’m sure you can’t see that, but its crystal clear from about 2 feet away, all the way out to about 3000 miles.
heinrich,
I would like to publish a short article on my site (SRSrocco Report) using your work and some of your charts on the huge increase in the Legacy Decline rates. That is if you don’t mind.
Would you mind contacting me at [email protected]. I think this is very good information to share with my readers. I am finding out that more and more of my followers are reading more of my energy articles.
thanks,
steve
Steve,
Thanks for your offer.
As I have now a lot of data confirming my opinion about the situation in the shale industry, I think it is time to go to the public.
I will be contacting you soon.
Looking forward to reading your article.
What exactly does “legacy” mean in this chart?
alimbiquated,
The term ‘legacy’ describes the decline of production.
Just to give a simple example:
A field produces 2 mill barrels per day at the beginning of the year. If the legacy decline is 1 mill barrels per day, the field produces just 1 mill barrels per day at the end of the year. The legacy decline rate is then 50%.
Although this is a very simplified model as it excludes any new production and any change of the decline rate over the course of the year, it hopefully gives you some insight into this model.
So Legacy is output from wells more than a year old?
No, that is not correct. Legacy decline is the decline of all old wells even though they may only be one month old. An example:
If a field produced 1,000,000 barrels per day last month and this month wells producing 100,000 barrels per day were brought on line then you would think that the field should be producing 1,100,000 barrels per day this month. But if you had a decline of 50,000 barrels per day from all the old wells, (legacy decline), that would cut your increase in half. You would now be producing 1,050,000 barrels per day.
So though you had a gain of 100,000 barrels per day from all new wells your legacy decline cut that in half and now you only have a gain of 50,000 barrels per day.
If a field is increasing in production every month then it can be said that it is not in decline. But every field still has legacy decline regardless of whether its total production is increasing or decreasing.
FWIW Art Berman has a piece on shale gas in Forbes:
Strong Natural Gas Prices And Tight Supply In 2017
https://www.forbes.com/sites/arthurberman/2017/05/16/strong-natural-gas-prices-and-tight-supply-in-2017/3/#be981cf6b828
Ian
For the operators sake, I hope they can get higher prices, but Mr. Berman’s piece curiously (to me) both omits some pertinent info and mischaracterizes other stuff.
The Rover pipeline is scheduled, by early July, to be complete to Defiance, Ohio in what is described as Phase 1. Phase 1 will deliver 2.8 Bcfd, with the remaining .7 Bcfd heading up to the Dawn hub by November.
There have been some recent delays in construction, but the builder claims to be on schedule.
The Leach Xpress, also under construction, will transport 1.5 Bcfd to Da Guf in a few months.
Having potentially huge impact, the Mariner East 2 will be complete this fall and will ship 275,000 barrels a day of NGLs to Marcus Hook for export.
This is a staggering figure that gets very little attention.
Furthermore, the 20 inch ME2 is having a 16 incher, called the ME2X, placed alongside to potentially ship another 200,000 barrels or so.
The future price of natgas is influenced by numerous factors, obviously, but the prodigious nature of Appalachian Basin hydrocarbon potential, along with the continuing build out of infrastructure, should not be underestimated.
Perhaps not exactly 100% on topic, additional media coverage needed, what a dog eat dog hydrocarbon world – BTW – forget not – big doggie gets the whole bone while the weaker shall perish.
“Judging by Duterte’s comments, China’s resolution protocol is simple: it’s either our way – which means you stay out of it completely – or war. ”
http://www.zerohedge.com/news/2017-05-20/we-will-go-war-we-will-fight-you-chinas-xi-threatens-duterte-if-philippines-drills-o
But can you believe what Duterte says? Maybe the conversation didn’t really happen quite like this.
Oil seems to start a lot of wars.
If only there were an energy source that was received daily by *every* country, that was cheap and abundant.
Oh, wait…
Yes, as a general rule, unevenly distributed resources lead to conflicts. It is true of people and of animals.
For example, wolves roam in packs because their kills are so large. You only need one or two wolves to make the kill, but you need a pack to gobble up the meat before the ravens get it. Coyotes have smaller kills compared to their body size, so they run in smaller packs. So wolf packs exist to protect large, fairly rare kills against ravens.
The same is true of lions. Cats aren’t very sociable, but in Africa there are huge herds and lots of predators and scavengers competing to control big kills. So lions have prides to defends against hyenas etc. Leopards and cheetahs make smaller kills, and remain solitary.
Of course this is temporal, not spatial distribution, but the argument is the same.
A spatial example is provided by the speckled wood butterfly. These insects live in forest canopies but mate in patches of sunlight on the forest floor. Since the spots are rare, the males fight for them.
Oil wars may seem glorious to the people that fight them, but they are a lot like the fluttery fights between horny speckled wood butterflies. It is a tale told by an idiot, filled with sound and fury, and signifying nothing.
Also, when it comes to ants
“We intuitively expect that solitary foraging will occur in species that collect small, randomly dispersed, and quickly replenished resources, whereas we expect raiding and nomadism to occur in species that utilize spatiotemporally unpredictable and depletable resources”.
https://www.ncbi.nlm.nih.gov/pmc/articles/PMC4267257/
Notice no one threatens war if an adjacent country announces a battery factory? No one would care.
I suspect Japan and Germany would have been enormously grateful to have had battery factories before the start of WWII. It might have helped prevent their hopeless and enormously destructive wars with the US and the USSR.
Tiger II tank engine. 690 Horsepower.
Japanese G3M bombers, twin engine, 1000+ horsepower each.
God, what a wacko.
You should really read up a bit more on the effect of fuel shortages on Japan and Germany, both domestically and on their war effort.
Many of those Tiger 2 tanks were abandoned in the middle of battles because they ran out of fuel.
Tanks, and most importantly domestic vehicles (both civilian, and military support equipment) could have used far less fuel had they been hybridized and electrified.
And, of course, the need for fuel was part of the reason why Germany attacked the USSR, and Japan attacked the US. Both of these were hopeless wars, started out of desperation. Japan especially knew they couldn’t beat the US, and yet felt they had no choice but to respond to the US oil embargo (or give up their imperial ambitions…).
The US military is actively developing hybrid tanks and vehicles. And, of course, WWII “diesel” submarines were electric vehicles, only recharged at the surface by their Diesel engines. Better batteries would have made an enormous difference for them.
To bad the Germans and Japanese didn’t listen to you. They would have gone bankrupt building batteries wind generators and solar panels before the war ever got going.
Our planet and species could benefit a great deal with more of your kind advising the our militaries.
What does, “…kind advising the our militaries.”, mean?
Have you read any histories of WWII?
Or, if you want something shorter, you could read the section about WWII in “The Prize: The Epic Quest for Oil, Money, and Power”, the Pulitzer winning history of the oil industry by Yergin.
https://en.wikipedia.org/wiki/The_Prize:_The_Epic_Quest_for_Oil,_Money,_and_Power
I’m no expert on WWII history but I don’t remember any of the forces winning any major victory by relying on solar wind and batteries as the main source of energy. If I’m wrong feel welcome to point the instance out to me.
Yes, and that’s exactly the point. Germany and Japan were badly hurt by their lack of liquid fuel (oil and synthetic oil from coal). On the other hand, they had plenty of wind and sun, and if they had replaced most of their oil consumption with electric transportation, they would have been in much, much better shape.
And, that’s the point for the future: countries which develop their domestic renewable energy resources will be far, far better off. Which is precisely why Germany, the US and China are focusing their industrial future on wind, solar and EVs.
Of course WW2 happened at a time of relatively-abundant FF energy, less Westernization/industrialization and less human population numbers, etc., as well as when the formative ‘American empire’ was not yet at its oil peak. We are certainly in different contexts now, with different ‘geographic’ patterns.
That said, I wouldn’t put it past some past notions of ‘post-peak resource wars’ being upended…
Also, the current contexts may very well push the world into something more along the lines of reducing-energy cooperation and collaboration, etc., over activities more in keeping with increasing-energy competition. Naturally, this won’t necessarily happen, if it does, without a whole lot of ape-like grunts, hoots/hollers, chest-thumping, diplomatic teeth-bearing smilies, and threateningly-firm hand-shakies along the way– at least insofar as how and where the domestic social unrest and food calorie intake levels, etc., permit this.
Azerbaijan production for April was up from March but continues general decline (8% y-o-y). The second chart below is from BP development planning for Azeri-Chirug-Gunushi complex which makes up most of the oil production. The phase II development was later than shown and the peak lower but the decline rate is probably about as shown, just three or so years later (the rest of production from old SOCAR operated fields might be going faster). There is no more oil there, but a couple of bug gas developments – Shah Deniz due 2019/2020 and Absheron (I think) which is not yet under construction – there was a recent item that they had secured some loan or other funding for it.
Azeri “light” is listed with API 35-36.
On this same page, an eyebrow raiser. Bakken has always self promoted itself as API 39.
Listed here as 43.3. Feb 2017.
https://www.statoil.com/en/what-we-do/crude-oil-and-condensate-assays.html
Just a reminder from Jeffrey’s chart on constituent content as a function of API degrees, at API 42 middle distillates crash from 20+%(sub API 40) to 5ish%.
The Bakken at 43.3 likely has damn near no diesel. If it ever did, as of Feb it doesn’t. Without diesel, food doesn’t get planted.
The world runs on diesel.
The Diesel Engine makes out contemporary society possible.
Nah. Diesel is slightly denser, so it’s slightly more convenient, but gasoline works just fine. Heck, NGLs like propane work too, even though they’re another step down in density.
Electric motors, of course, provide much more torque, which is why locomotives use electric motors paired with diesel generators.
Nick So how come we don’t see more propane and Natural Gas trucks? The only ones I know of is the propane delivery trucks. They have relatively short runs and when they return they need to fill up the big tank anyway so not such a big deal. Why dont you mention that it requires at least a 30% bigger engine to produce the same hp? Big difference between possibility and feasability.
Uhmmm….that’s the first thing I said: there are differences in density and convenience.
Diesel is better for some things, but it’s not essential.
New USGS estimate of technically recoverable resources in the Spraberry formation of the Midland Basin, Permian Basin Province, Texas:
4.2 billion barrels of oil,
3.1 trillion cubic feet of gas,
and 311 million barrels of natural gas liquids.
The estimate includes undiscovered continuous resources (LTO) in the two assessment units:
Middle Spraberry Continuous Oil Trend and Lower Spraberry Continuous Oil Trend.
F95–F5 estimates range from 1,873 to 7,635 MMB for oil;
from 1,080 to 6,200 BCF for natural gas;
and from 100 to 652 MMB for NGL
The Spraberry was last assessed in 2007 based on historical production from vertical wells. The 2007 estimate was for 500 million barrels. Since 2007, multiple intervals within the Spraberry have been targeted with horizontal drilling.
https://pubs.er.usgs.gov/publication/fs20173029
Last year, USGS assessment found the Wolfcamp formation in the Midland subbasin holds 20 billion barrels of technically recoverable oil and 16 trillion cubic feet of natural gas.
USGS is now conducting a continuous assessment of the Delaware subbasin, with some results expected in 2018.
http://www.mrt.com/business/oil/article/USGS-assessment-puts-Spraberry-resources-at-4-2-11156810.php
Alex, thanks for posting, as always.
So, there was over an eightfold increase (from 500 million to 4.2 billion) in the Spraberry assessment in ten years’ time.
This huge proportional increse is in line with the bump in the Barnett, the Mancos, the Haynesville/Bossier re-assessments.
I am glad you pointed out the distinction between the recent Wolfcamp assessment being only the Midland Basin portion, as a common perspective seems to be that it is the entire Permian.
It should be very enlightening when the Delaware Basin portion of the Wolfcamp is published next year.
The four wells from EOG on the Whirling Wind pad are located way up in Lea county.
Targeting the Upper Wolfcamp, these four wells, in their first month online, produced over 420,000 barrels of oil, over half billion cubic feet of gas, and almost 100,000 barrels of NGLs.
That type of production should impact the USGS.
When they get around to the newest Marcellus and Utica assessments, people will be shocked.
coffeeguyzz,
Just my guess: the sum of USGS estimates for the Permian LTO plays could be around 40 billion barrels of technically recoverable oil (certainly, not a new Saudi Arabia).
One big question – which part of this oil is economically recoverable at various oil price scenarios.
Spraberry and Midland Wolfcamp are already near 24 billion … sooo … mebbee quite a bit higher?
Delaware Wolfcamp assessment should be interesting.
Saudi Arabia’s export figures for crude+condensates in March. 3 different tanker trackers suggest that KSA’s exports were higher in March than reported in JODI Data (JODI, March: 7,232 kb/day).
At Genscape we make it 8.05 million b/day for Mar and 8.063 for Apr; or a total of 249.4 for Mar and 241.9 million bbls April.
Chart on Twitter: https://pbs.twimg.com/media/DAcxQiFXsAAQzKp.jpg
From this tweet: https://twitter.com/NeryEnergy/status/866716531585167360
Reuters 7.75 million b/day exported in March
The data dilemma: Big differences in Saudi crude export numbers: Russell
http://in.reuters.com/article/column-russell-idINL4N1IO20D
Reuters chart on Twitter: https://pbs.twimg.com/media/DAaWmnXVYAErxnW.jpg
TankerTrackers.com has 7.55 mb/day for March & 7.8 mb/day for April.
Tweet: https://twitter.com/Samir_Madani/status/866692827467698177
Website (free): http://tankertrackers.com/#/
http://oilprice.com/Energy/Crude-Oil/The-Lowest-Shale-Breakeven-Costs-Are-Here.html
The validity of the concept of private property is questionable. I am not interested in arguing at this time.
pot meet kettle
http://www.zerohedge.com/news/2017-05-22/solar-company-lied-investors-boost-its-ipo-price
Questionable reporting is why I am inclined not to take any corporate PR at face value. You’ve got to dig further.
It can be a solar company, it can be a gas and oil company, it can be a Silicon Valley company. Be skeptical of all of them.
And for that reason, telling us what corporate gas and oil companies are telling investors doesn’t really mean much here.
Hah! If that’s the best anti-solar propaganda zero hedge can come up with, they are scraping the bottom of the barrel.
TT’ articles tend not to be very illuminating. They are cherry-picked and often don’t even make his point unless the goal is to get more investors into gas and oil. They tend to tout great discoveries and mass amounts of gas and oil, stories which will help keep the price of gas and oil low — not so good if you are in the industry.
That’s why I am skeptical. For the same reason I question anything posted here from a company trying to keep its investors happy and attract more of them. Investor PR should always be treated skeptically, and that includes the data coming from companies that are trying to make themselves look as good as possible.
Boomer II,
Precisely why I don’t bother to read tt’s posts. Just investment advertising, nothing but drivel.
Jim
Yes, I used to be a business writer. You have to look beyond what corporate PR departments are feeding you, but most business writers don’t. They just republish press releases without question. Enron was a prime example of a company that was glowingly covered until Fortune did an in-depth negative report and things started to fall apart after that.
I’ve watched the penny stock boom and bust. Several real estate boom and busts. The dotcom boom and bust. IPO booms and busts. TT’s comments are reminiscent of all of those sales pitches.
Jodi March data is out for those interested:
https://www.jodidata.org/oil/
Saudi stocks are still falling at about 8% y-o-y, which is slightly lower than the 10 to 12% seen about 6 months ago. (p.s. just noticed Energy News post above – this would have been better as comment there).
Below is an attempt at a bottom-up projection of global oil production going forward, based on current producing and identified projects. It assumes 4% decline in existing fields, but allows for some plateau on half of OPEC production. The Aramco gave numbers of 5%, and 10% assuming no in fill drilling. Other numbers have ranged from 3% up to 7%. The new projects added are shown by country and include about conventional oil and some gas projects with significant condensate streams. Existing production is based on OPEC OMR but does not include processing gains.
Total production, assuming the declines continue on, is 810 Gb. The thin slivers added for each country show new production and highlights how much effort will be required to compensate for the declines. Really the only countries that can be identified clearly are Brazil (with about 15 new FPSOs) and Canada (which includes all proposed oil sands projects listed in the most recent Alberta assessments). Big additions from LTO are not included, and nor are any developments in Iraq and Iran that have not been announced. Total amount added is 150 Gb. Other flows not shown would be NGLs (I don’t know exactly how OPEC counts these if at all), condensate from small gas developments, storage rundown, ramp up from last year’s start-ups (and, my mistake, new production this year of about 600 kbpd), OPEC spare capacity (if any), and of course any new discoveries or existing discoveries declared commercial. I’ve assumed quite a lot of additions for Venezuela, but that could go either way.
For start-up times on non-approved projects I just had a guess and front loaded everything starting in about 2022 (depending on project size). In fact it would now be almost impossible for the industry to ramp up and handle the developments as show, and even if they did, without additional discoveries, they would increase capacity in order to do only one or two projects and then would have to downsize again. By the curves shown 4 to 5 mmbpd would need to be added in 2022 to 2024, which I think is more than has ever been achieved, and since the maximum in 2014/2015 there has been significant downsizing, and most of the projects considered here will be more complex than those developed previously.
I assumed reserves fitted about P = 135*R^0.9 (P is average production in kbpd and R is 2P reserves in Gb), and fitted a 1 to 2 year ramp-up, a 0 to 10 year plateau, and run down to match the reserves. Oil sands have longer plateaus and slower run downs. Export rates are from ‘Energy Export Databrowser’ one flat and one with 1% growth – the area above the lines shows the net amount available for export. Assuming that ‘demand’ (to maintain a putative BAU) grows at 1.3% per year, there is an available export short fall of 5% in 2019/2020, 25% in 2022/2023, 50% in 2027 to 2029 and no net exports in 2036 to 2040 (the growth in producers internal use has a big effect then). Those numbers would be pushed out depending on what unaccounted for new production gets added.
George,
Wow! What a dismal picture that graph paints for oil optimists, and a grim confirmation for those who understand the slow motion train wreck of peak oil. Gonna make believers out of some who can’t imagine peak oil, just around the corner.
Decline is relentless. Probably the only variable that might change that trend is drastic changes in demand, but in the absence of a comparable substitute for oil RIGHT NOW that trend is what we will live (and die) with. Interesting times ahead.
Thanks very much for this important piece of work. I don’t recall seeing this thorough bottom up analysis before. Well done!
Jim
in the absence of a comparable substitute for oil RIGHT NOW
Fortunately, we have a better substitute, in the form of EVs. It’s not identical, but it’s cheaper, provides better performance, etc.
Dream on. It isn’t about your cherished electric cars.
It’s about system energy inputs declining. Until you get that concept, you are pretty much clueless.
system energy inputs
What “system” are you talking about? Oil is primarily used for transportation (passenger, freight, etc). We can power transportation without oil.
Hi George,
Very nice. About a 2100 Gb URR for C+C (1260 Gb cumulative output through the end of 2016 plus 810 Gb in your scenario for 2070 Gb and I am rounding to two significant digits).
Note that Laherrere estimates about 2700 Gb for the C+C URR, see
http://aspofrance.viabloga.com/files/JL_Hubbertlineraization24May.pdf
pages 55-60 covers his World estimate and notice Figure 99 on pp 55-56 where he has two estimates for World C+C-XH(extra heavy oil less than 10 degrees API)of 2200 Gb and 2500 Gb, he chooses the lower estimate, I would argue that technology and reserve growth makes the 2500 Gb estimate more reasonable. Rising oil prices after the peak in 2022/23 will eventually lead to more sanctioned projects unless the optimistic estimates of Tony Seba are correct, in which case less oil will be consumed than I expect and a 2100 Gb URR estimate will be correct due to lack of demand for oil.
Hi George,
According to BP in 2015 there were about 1100 in proved conventional C+C reserves and there has been 1233 of C+C production to the end of 2015 (I estimated NGL reserves and deducted those from the total), this would imply a URR of 2300 Gb of oil with API weight >10 degrees, a very conservative estimate of extra heavy oil would be a URR of 300 Gb, so about 2600 Gb URR minimum (assumes no reserve growth and no new discoveries).
New post on Texas output is up.
http://peakoilbarrel.com/texas-update-may-2017/
Also new open thread
http://peakoilbarrel.com/open-thread-non-petroleum-may-23-2017/