A Guest Post by George Kaplan
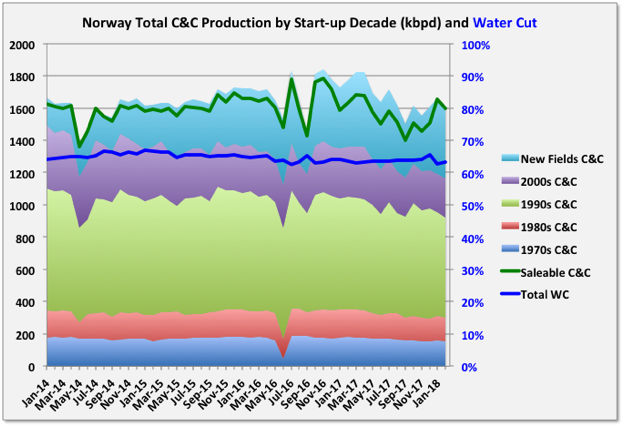
Average annual Norwegian wellhead C&C production dropped 1.5% in 2017, from 1709 kbpd (625 mmbbls total) to 1682 kbpd (614 mmbbls total). Wellhead gas (which includes fuel gas, flaring and gas injection) rose 2.6% from 2805 kboed to 2878 kboed. Exit rates were down 9% for oil andt 4% for gas, some of which was due to the Forties pipeline failure in December, but the decline appears to have continued in the first quarter of 2018.
Three small projects, Flyndre, Sindre and Birding, and two larger ones Gina Krog and Maria, came online. Sindre appears already to be exhausted. Flyndre is shared with UK and is declining fast. Gina Krog, discovered in 1974, is a tie back via a wellhead platform to Sleipner with nominal nameplate capacity of 60 kboed (split about evenly between oil and gas), and Maria is an oil tie-back to the Kristin semi-sub, but with water injection supplied from Heidrun, with 40 kbpd nameplate and is still ramping up after first production in December.
Norway C&C
The data shown in the charts is through February, but the NPD figures for this year have not been as complete or unequivocal as usual, so should be considered accordingly. A number of fields have no reported wellhead figures for January or February, though they do have sales reported (to fill the gaps I have prorated from these numbers based on previous complete monthly data). Additionally it looks for some reason that the sales figures for 2017 have all been doubled and the numbers for NGL are being switched from reporting in Te/d to m3/d, so there’s a bit of uncertainty.
Troll
Troll, started in 1990, is by far the largest gas producer but also, currently, the largest oil producer, at around 150 kbpd, which has been kept steady for several years. The oil comes from a thin oil rim, produced from long, horizontal wells that are being continually drilled. The oil has to be produced before the gas cap can be blown down. R/P for the oil is about two and a half years, and the contract for Troll Phase 3, the gas reserves over the oil rim, was awarded this January with production expected in the second half of 2021. This would suggest the oil production will be kept high, and then start to drop quickly through 2020. Troll gas current reserves are almost half depleted and with an R/P of over twenty years, but the approved production rate has recently been increased to make up for declines in other fields, and this may continue.
The original development plan by Shell for Troll was to ignore the oil as they did not think it could be developed economically, mainly because it would have required hundreds of vertical wells; this was rejected by the Norwegian Petroleum Directorate. Short horizontal wells had previously been drilled in USSR (actually in the 1930s), Australia and Alaska but in the late 1980s extensive, and expensive, development for long reach, accurately placed horizontals, drilled from offshore floating rigs, was conducted by Norsk Hydro with NPD input. In the early 90s I remember Norwegian news outlets complaining that they perceived this as a waste of tax-payers money, but the effort has certainly paid off since. A similar large oil rim resource, Frigg, was not produced in an earlier gas development and was lost; by contrast Troll Oil will produce almost two billion barrels.
Statfjord
Statfjord, started in 1979, is still a large producer, at about 25 kbpd, many years after its original decommissioning date, although there are signs now of decline, which is likely to be terminal. It straddles the UK-Norway border and about 15% is owned by the UK through the local Statoil subsidiary. Interestingly at one time, by maritime law, the UK could have claimed all of the Norwegian Trench, which includes Statfjord and several other of the largest Norwegian fields, but instead agreed to a border based on the meridian line between the two countries. I think the UK oil and gas authority had been reporting UK Statfjord production as total rather than the UK share, maybe by wishful thinking, which has skewed some numbers and has only been corrected in the last few months.
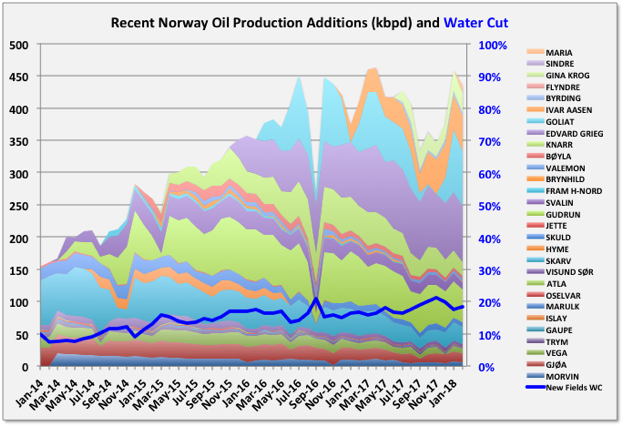
The irregularity in Goliat production shows up in the curves for recent additions, but there is a clear trend for quite early and rapid decline, even among the larger developments.
Norway Natural Gas
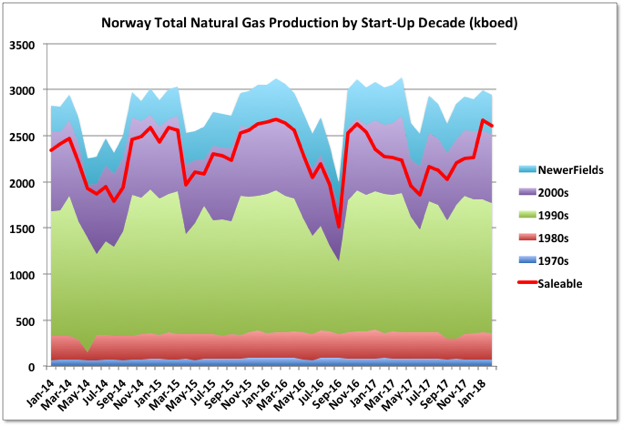
Gas production for 2017 was generally maintained constant, partly through increased production from Troll, which compensated for declines elsewhere.
The second biggest gas producer, after Troll, is Ormen Lange, which supplies the UK exclusively, last year at about 1.6 bcfd, which represented about 19% of UK usage. It is in decline, arrested slightly in 2017 by the addition of on-shore compression. There are also considerations for subsea compression. R/P is about seven years so production is likely to peter out sometime in the late 20s.
Norway Reserves
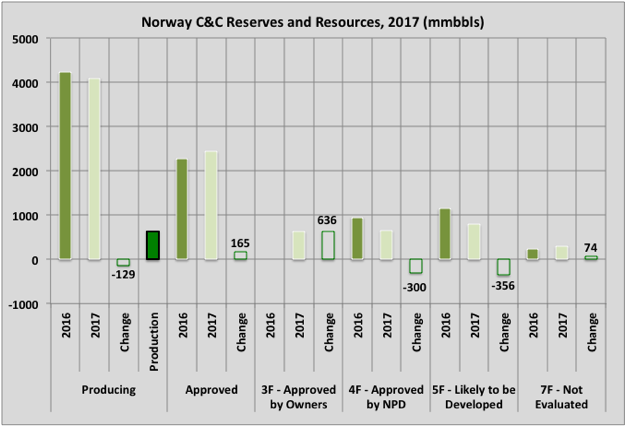
Oil reserve growth more than compensated for production in 2017, with the biggest gains coming from Snorre (157 mmbbls), where a redevelopment plan has been approved; Yme (70 mmbbls), similarly following a new redevelopment plan after structural failures in the platform meant a previous attempt was aborted; Johan Sverdrup (109 mmbbls), following further reservoir appraisal; Heidrun (46 mmbbls), another redevelopment; Valhal (46 mmbbls), from addition of the Valhal West Flank development; and Skarv (190 mmboe total, but mostly gas), due to the incorporation of the reserves for Aerfugl discovery into the Skarv base. Most of the large, mature oil producers like Troll, Ekofisk, Oseberg etc. declined in line with net production.
In addition three projects moved to 3F status, which means development has been approved by the partners but hasn’t quite reached FID, but these are effectively reserves rather than resources and added 665 mmboe for Johan Castberg (by far the largest contributor), Fenja (mainly a gas field) and Skogul combined. There were some small additional discoveries or resource growth, but generally the other resource categories declined as projects moved to categories showing greater maturity towards production.
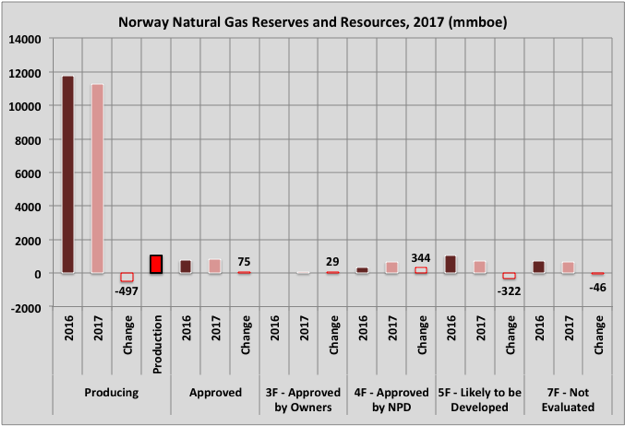
Natural Gas reserves declined overall. The biggest gain was from the Aerfugl project associated with Skarv, mentioned above. A number of projects moved to approved categories but there were few new additions from discoveries or growth during appraisal. Valemon had its reserves downgraded by almost a third. Lavrans (gas condensate) and Ivory (dry gas) showed some resource growth, and recently Statoil has announced plans for development of Nøkken through Gullfaks and Askeladden as part of Snøhvit, which will move resource numbers into the reserve category (both are dry gas).
Norway Production Projections
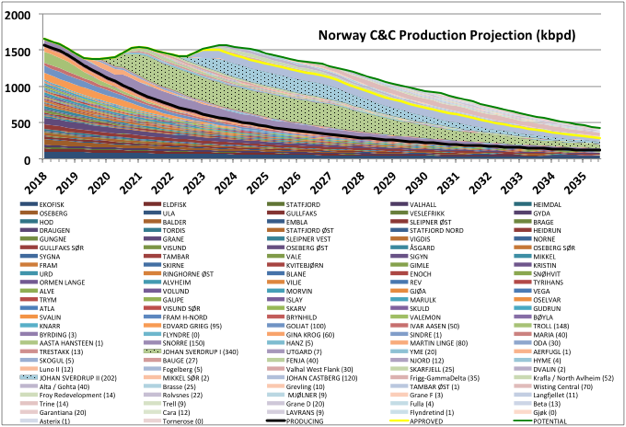
The NPD publishes individual field reserve and resource estimates so it’s guessing decline curves should be reasonably close. Start-up times and nameplate capacities are usually known for new developments, but it’s less certain what length of plateau will be seen (UK fields are better for this because the Environmental Statements that are required before approval include predicted production profiles, though usually P10 cases only). Most new projects, especially smaller ones, and especially if there is no pressure support, ramp up in a few months and then immediately start to decline. But even the largest future project, Johan Sverdrup, is heavily front loaded for production.
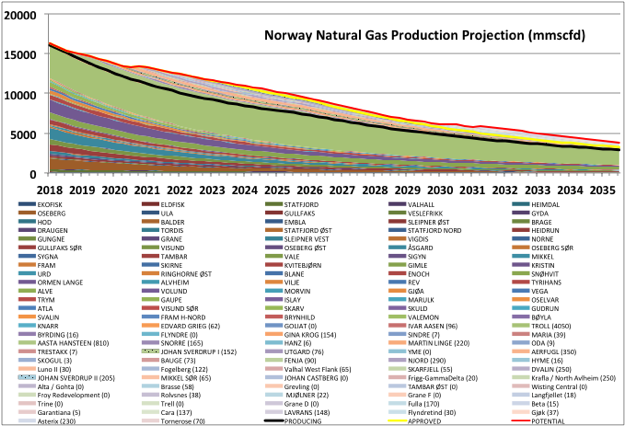
The charts below include all fields on line, in development or thought by the NPD as likely to be developed. No estimate for new discoveries is included; these have been fairly low but pretty steady over recent years so there will certainly be some additions. My guesses indicate a decline in production in the near term for both oil and gas, I’m not sure the NPD would concur with this as they have indicted an overall rise by 2023, so maybe they are assuming a number of short cycle new discoveries, or acceleration of production as oil and gas prices rise.
The biggest unknown for the oil profile is probably the timing of some of the big redevelopment projects that have been approved or still in appraisal (i.e. Snorre, Norne, Heidrun, Osegerb, Frøy). For gas the largest unknown might be how the Troll production is increased to compensate for other declines, I’ve assumed its current production is maintained for about 10 years, followed by natural decline, but production could be accelerated, which would shorten the plateau and increase the decline rate. There are more turnarounds scheduled for this year than last, but then fewer in 2019 and 2020, which may smooth out the near term decline a bit.
Oil production is dominated by the two Johan Sverdrup projects: phase I ramping up from 2019 and phase II starting in 2023 (both shown stippled). There is relatively little remaining oil resource to be approved, and less still for gas (partly this is because a number of the newer projects are in the Barents Sea and the associated gas is re-injected rather than produced, there may be gas blow down developed later, but it would need a combined industry effort).
NGL is included in the gas figures; I’m not sure why I used scf rather than boe but too late now. One other possible issue is how re-injected gas is handled, I think I have removed or delayed this on the relevant projects, but have missed one project for sure and maybe others. Other than that the figures would represent wellhead figures, i.e. including flaring and any fuel gas use. For the new developments the numbers in parentheses against the name shows the nominal nameplate capacity used in the profiles. The definite missing injection gas is for the Snorre redevelopment. This is a marginal development in a highly compartmentalised reservoir. It requires a lot of additional wells plus imported gas for injection. I do not have data for the rates or timing of injection and subsequent blow down so have just omitted it.
Off Topic Finish
Yew trees are the oldest in UK and can live over two thousand years. They are often found in churchyards, but have had longer significance with pagan religions, and usually the church was built around the tree, which marked an existing sacred place. They can regenerate themselves after extensive damage or pruning and even from dressed beams used in construction, and can appear to move by growing new trunks from fallen branches, so are associated with immortality. They can look kind of scary. As a youngster I used to play near this one, though I don’t remember it having railings then.

You provide an amazing detail to overall presentation. Thanks, again’
Yep, Thanks!
Will the blue leave the gray? http://ir.eia.gov/ngs/ngs.html
Interesting contrast to the Permian.
The cold temperatures have significantly impacted the injection status.
Rover may jump from 1.7 to 3.2 MMcfd in the coming months if the requested approvals and construction come to fruition in the near future. The injections should then increase a bunch.
The shape of the blue (injection) line will be very instructive as to the responsiveness of the upstream and midstream sectors.
” They can regenerate themselves after extensive damage or pruning ”
The latest thought on why many trees, shrubs and even small plants can recover from major damage is the large number of elephant types and other large herbivores in the past. If a plant could not sustain being stripped, crushed, stomped on or chopped to the roots it probably would not have survived the large animals that constantly roamed the land for millions of years.
And with the loss of these large herbivores, came massive wildfires as the trees spread with no one to prune and eat them.
After mastodons and mammoths, a transformed landscape
https://www.sciencedaily.com/releases/2009/11/091119141029.htm
https://www.visitscotland.com/info/towns-villages/fortingall-yew-p249411
Between 3000 to 9000 years old.
IEA Oil Market Report: 13th April 2018 – available to non-subscribers
Download pdf file from here: https://www.iea.org/oilmarketreport/omrpublic/currentreport/
Chart of OECD gasoline inventories up to February: https://pbs.twimg.com/media/DbzHmepX4AAB8w4.jpg
IEA is probably overstating demand, some. That’s because they have the non-OPEC production about 60 to 70% too high. Plus, they are not counting OPEC drops from Venezuela of probably, at least another 400k, maybe more. In case any are not following Venezuela’s drop, it will more than cover the OPEC part of the “cut”. Prices will rise towards the second half, choking back demand, some.
2019 will look similar, even wth reduced demand, and an increase in the Permian the second half. Assuming their numbers are close to reality, which I have serious doubts of. The additional output from the US, OPEC, and maybe Canada will mainly go towards the shortages that occurred in 2017 and 2018. Plus we have declines, and whatever additional demand that may happen. Russia will not rush forward to lower prices, neither will the Sauds, although there will be a lot of jaws moving. They want their 100+ oil price.
It’s like swimming against a strong current, and not realizing it. No doubt, Dean has guessed, as I have, that the EIA weeklies are somewhere over 400k overstated. Yes, they are just “estimates”, but that is what the rest of the world is using.
Baker Hughes weekly US rig count
oil +5 to 825
natural gas +3 to 195
Permian -1
Williston +3
Cana Woodford +9
Canada oil & gas -8 to 85
http://phx.corporate-ir.net/phoenix.zhtml?c=79687&p=irol-reportsother
Oklahoma +9, Permian -1, probably the start of a new trend, for awhile. Expect more from the Bakken, Eagle Ford and Okla, and a little less from the Permian. Although, not too much from the Permian, as they continue to expand DUCs. ConocoPhillips, and EOG are reportedly responsible for a recent increase in DUCs in the Permian. Read an article that stated local refineries are able to increase profits, while requiring bigger discounts. Just “bidness”.
The Midland discount has increased
WTI Midland (Argus) vs. WTI Financial Futures Settlements
Chart https://pbs.twimg.com/media/Dbz0F0-WsAEPKaF.jpg
CME Group http://www.cmegroup.com/trading/energy/crude-oil/wts-argus-vs-wti-calendar-spread-swap-futures_quotes_settlements_futures.html#tradeDate=04/26/2018
EIA – Monthly Energy Review (April 26, 2018)
https://www.eia.gov/totalenergy/data/monthly/
Enno Peters has a new projection on LTO, his projection assumes no more wells are completed.
See
https://shaleprofile.com/index.php/2018/04/23/projecting-us-shale-oil-production-after-july-2017-2/
I did a rough projection for US LTO output which assumes new well EUR starts to decrease in Jan 2019 and remains constant (for US average new LTO well) from July 2017 to Dec 2018). An estimate for the average new well EUR in July 2017 was 283 kb and new well EUR decreases at an annual rate of 6.4% per year starting in Jan 2019 (this is simply a guess that is used in the model).
For those assumptions about 1280 new wells per month is the model estimate for US LTO to be close to reported EIA tight oil output in Feb 2018 (5410 kb/d). The model assumes wells continue to be added at 1280 new wells per month until April 2024 and then gradually decrease to zero by 2030. The model estimates about 80,700 LTO wells had been completed in the US from June 2006 to Feb 2018, and total wells completed from June 2006 to Jan 2030 is 232,000. Peak output is about 8000 kb/d in 2023 and output falls rapidly after 2025 reaching an annual rate of decline of 20%/year in late 2029 and falling to 4000 kb/d by the end of 2030. A world peak in C+C is quite likely between 2025 and 2029 as it will be difficult to make up for the rapid fall in US LTO output, LTO output only falls by about 500 kb/d between Jan 2023 and Dec 2025.
Model Economically recoverable resources (ERR) is 51 Gb from June 2006 to Dec 2045.
Eventual lack of sweetspots will be offset by the number of wells, so I really see that as a reasonable estimate. I do note that you are less inclined to shy away from a $150 price. Yes, that price seriously dents into demand. So what? We will be short, anyway. That 2.5 million increase in production will not solve the world’s supply problem. I think total production is more reasonable than any I have seen, so far.
Guym,
Thanks. I believe many will object that the scenario above is far too optimistic, for those there is a more “realistic” or perhaps “pessimistic” scenario below.
Reality may be somewhere between these two scenarios, but there are many factors which could make it higher or lower than these estimates due to lower or higher oil prices, high or low interest rates, wars, economic collapse or boom, and other factors too numerous to list (it’s infinite essentially).
On the $150/b real oil price (in 2016$), that is the top of my estimate and I believe you are correct that oil prices might go higher than this especially after peak output in 2025, perhaps it will approach $200/b.
My guess is that if $200/b occurs, it might slow the world economy (and demand for oil), in addition by 2025-2030 high oil prices and the transition to EVs which might occur (I believe this will happen faster than everyone thinks except maybe Tony Seba) might dampen demand for oil and keep oil prices in check, eventually oil prices may fall after 2030 as demand falls faster than supply and the transition to alternative transportation accelerates.
New ground being broken, so impossible to predict, other than higher. My guess is that there will be some ground between 100 and 150 that will cause supplies to rise due to decreases in demand. No doubt, in the gasoline/diesel area. Thus, lowering oil price. I see that fluctuating quite a bit. But, will jet fuel and heating oil fluctuate in the same proportion? Probably not. Shortage here, glut there. Basic oil inventories will probably not be in a “glut” area. Just slow downs in production, and refineries managing the spread. There will, at that time, also be an increase in alternate storage area, like floating or other areas, that are now pretty well depleted. That situation won’t happen near $100, because we’ve been there, done that.
Hello Dennis
I pre-apologize for this brash note, I just don’t have a lot of time but wanted to say this –
I don’t see how a transition to EV’s will help anything at all. Currently they can’t be produced at a quantity or a price anyone can pay (Tesla is a shining example of this, as it is massively hemorrhaging cash daily) and at any rate it’s a fool’s errand to mass produce them (or at least, it appears that way to me). Those EV’s weigh about the same as a current ICE vehicle, and consume the same amount of energy at about the same efficiency after the power transmission losses are factored in. The only difference is that the juice is coming from a power plant, and not a gas pump. Aside from that, there is no difference between an EV and an ICE. Perhaps the ability to dynamically brake an EV will help equivalent fuel consumption somewhat (20-30%), but at the cost of extra weight and complexity. It is worth noting that a number of commercial ICE vehicles now come with dynamic braking (I own one, a Toyota Highlander Hybrid), but these vehicles generally start in the $60k range and up.
Mike, boy did you ever mess up. You are trying to slay the sacred calf of the renewable cult. You just don’t do that man. This is a belief that cannot be compromised. Don’t try to confuse us with facts man, we know what we believe and that is that.
You are in for it man, you’re gonna to catch it now.
/sarc
Hi Ron
I surely messed up and am awaiting to be excoriated by the renewable cult in due course.
But…it’s hard to keep quiet when Ford just announced that they’re going to stop car production by 2020 and focus on trucks and SUV’s. To my way of thinking, that’s just about as far as it could possibly get from EV production. Not only are they NOT going to produce EVs, but in fact are going to do exactly the opposite and produce ever larger ICEs. My jaw is still on the ground after hearing of this.
Perhaps they are less than enthused about EVs after witnessing Elon’s ongoing travails.
Mike, read more about Fords plans here in this reuters article, They are planning 40 models hybrid or full electric by 2022. Most manufacturers are on the same path. Even though your assumptions and analysis are off-base, you will likely be wishing you had a level 2 charging setup in your garage by the the time you make another vehicle purchase, or else your choices will be limited. Times are changing, can you?
https://www.reuters.com/article/us-autoshow-detroit-ford-motor/ford-plans-11-billion-investment-40-electrified-vehicles-by-2022-idUSKBN1F30YZ
The US LTO reserves are about the last shot on cheap gas for big monster ICE vehicles.
Without any of this, we would already now sit on 100$+ oil permanently with a permanent global economy crisis. And mostly even more global unrest, since the new big economies China and India would gather more around the gulf states to fight for the oil.
Electric vehicles have already made a small dent in global oil demand. Not the few Teslas – the chinese town busses:
https://www.bloomberg.com/news/articles/2018-04-23/electric-buses-are-hurting-the-oil-industry
Since they drive all day long, and a diesel engine is not the best thing for city use with all this stop and go, every single bus lowers global oil demand much more than a car.
For electric vehicles: Powering them with coal power plants sets them to roundaout the same level as ICEs.
They make sense when more non-fosil energies are used to generate electricity. Be it solar / wind or some kind of fancy fusion plants in the future. This energy can’t be filled in a ICE car.
Generally an electric car is much more simple than an ICE car. The drive train has only a few rotating parts.
The problem at the moment are the battery and the small numbers (= high costs ).
Regenerative braking adds not much complexity – it’s just a twist to the loading electronic being powered from the motor and not the tap. Even my simple electric bicycle can do this, it has a simple reed contact in the brake that reverses the motor when only used gently before the mechanical brake shoes hit the tire. No more used up brake shoes.
I travel on an EV almost every day, it’s called a tram. Mostly it gets it’s power from natural gas, I seriously doubt that it’s saving the planet.
Mike Sutherland,
I also have owned several Toyota hybrids (2004, 2009, and 2015 Prius and a Camry Hybrid) all the Prius vehicles were in the 25 to 30k range when new and the Camry was about 30k.
Much of US electricity is from nuclear and renewables (close to 40%) and about 30% (and growing from natural gas).
A combined cycle natural gas plant has an efficiency of about 50 to 60%, line losses are about 10%, maybe another 10% loss in ac to dc conversion so 0.55*.9*.9= for a total of 44.5% efficiency, relative to typical ice efficiency of about 30% (possibly 36% for a non-plugin hybrid).
Over time fossil fuel will become expensive (all types, coal, natural gas, and oil) and natural gas and coal will gradually be replaced with nuclear and renewable power, EVs will become cheaper to own over time and will gradually replace ICEV, first with plugin hybrids and hybrids, and eventually with EVs.
When oil output peaks in 2025, oil prices may rise quite a bit (maybe to $200/b in 2018$ by 2030), natural gas and coal will also reach peak output by 2030 and their prices will rise as well while the price of wind and solar will fall and nuclear may become more competitive for base load (compared to coal and natural gas).
Tesla plans to start selling it’s lower priced (35k) Model 3 in Quarter 3 2018, and expects to be close to 5000 Model 3 vehicles produced per week by the end of June 2018. In 2019 between 250,000 and 500,000 Model 3s will be produced and Tesla expects to be profitable by Quarter 4 of 2018 and cash flow neutral by Quarter 3 2018. The current Model 3s being sold range from 50 to 60k (310 mile range), the lower price (35k) model will have a smaller battery and range of 220 miles.
They will sell these as fast as they can be produced, they hope to reach 10k per week production levels some time in 2019 (my guess is Q4). In 2020 they plan to start producing a small SUV (maybe the size of a RAV4) called the Model Y, it will be revealed (the prototype) in 2019. Likely large volumes of the Model Y will be produced (5000 per week) by quarter 3 of 2021.
EVs will simply be a step in the right direction to reduce dependence on fossil fuel which will peak and decline in use over the next few decades. Hybrids and plugin hybrids will be a transition step.
Alternative model with the major change being 1000 new wells per month added from March 2018 to 2024 (in more optimistic scenario it is 1280 new wells per month), a slightly lower rate of decrease in new well EUR (absolute value is proportional to number of new wells added each month). Peak is 6750 kb/d in early 2023, ERR=46 Gb, about 201,000 total US LTO wells June 2006 to Feb 2031. Field decline rate reaches 16%/year in 2031. Half of peak rate (3375 kb/d) also reached in 2031. Output falls by 250 kb/d from peak by Dec 2025.
The average number of wells added per month (estimated by the model) in 2017 is 1000 new wells per month.
Nah, too low, I think.
Guym,
The first model has US LTO increasing by 1400 kb/d in 2018 and the second, by roughly 650 kb/d, so I agree the second model is too low, but the first might be too high, at least for 2018 given pipeline and other constraints over the short term.
Medium model (1150 wells/month) below.
Agree, much too high for 2018. By 600 to 800k too high. The spike later, might be a little greater, with the decline steeper. Greed is what it is.
The “medium” model has about an 1000 kb/d increase over Dec 2017 (5255 kb/d) output in Dec 2018 (6260 kb/d).
That doesn’t seem too unreasonable given that by Feb 2018 US LTO output had risen to 5400 kb/d, a continued increase at the Dec to Feb rate would be a 900 kb/d increase by Dec 2018, so a bit high perhaps, given possible pipeline constraints. The medium scenario seems pretty reasonable.
Which LTO is that coming from? There is probably an increase in the Permian through Feb. How much, I don’t know. I am reasonably sure Texas production was almost flat from Dec to Feb. according to pending files. EIA monthly will be posted in two days to confirm or deny. Texas has a lot of other production, which may have declined to offset. I agree EIA monthlies are good, because they use so many third parties to get there. Using other data from EIA is pretty risky. Buda, Austin Chalk, and probably hundreds of more fields are LTO. I have no idea what EIA is using. Texas has its own definition on what is Permian output, and the measure is much lower than anyone else is using. It’s all much more confused than depicted. To top that off, you have multiple field drillings. Permian has been doing this forever. But I know you have Buda fords, because I have one. You also have Austin Chalk/Eagle Fords. How are these categorized in drillinginfo? I would think most of Texas production is classified as LTO, even if they are vertical. Texas may have gone up 100k by Feb.from Dec., or probably not that much. EIA weekly is easily off by 300k, maybe 400k. March 3 production per weeklies was 10,369, which is probably close to 300k over. The corrected Rystadt figures for April supports my estimate, as Energy News posted below.
Guym
I use tight oil estimates from EIA see following page then click on tight oil estimates excel link.
http://www.eia.gov/petroleum/data.php
Guym,
US LTO increased by about 1100 kb/d in 2017, even with the Permian pipeline constraints, higher oil prices may enable this level to be matched for the US as a whole in 2018.
The model is not bottom up, it takes average well profile for the US and assumes the capital will move to the areas where profits are greatest, whether it be Bakken, Eagle Ford, Permian, Niobrara, or Anadarko, the model cannot predict. Too many moving parts and too much work to do 4 or 5 different basins and I don’t have good well data for Anadarko.
The shape is hard to guess, could be a higher completion rate than I have assumed.
You think it might go higher than my high scenario at 8 Mb/d?
It could, if the price is right. As I said, they are only trying to estimate about five plays for oil. I know there are a few more that lay in the possible range, that are largely ignored now, as their profitability at $55 was pretty suspect. Not worth the exploration costs, when there is other available. They are already expanding the Austin Chalk in La., there are more potentials from Texas to Fla., but I guess we can leave off Fla There is enhanced recovery successful in the Eagle Ford that is productive, and they may get others to work. Pearsall could be an option, if they can figure out how to keep the fractures from clogging.. All of that will take awhile, so who knows what that does to the curve. Probably, just decrease the decline rate. I agree with Mike, that much production would be counterproductive to the US bests interests, but you are looking at free enterprise. If we could figure out a way to get Canadian oil to the refineries, we may be largely independent for North America. Right now, anything over 500k barrels will be hard to get out of the front door. It can’t be used internally, at this point. Like a man sitting down at a feast, our eyes are bigger than our stomachs.
CAPP (Canadian association of petroleum producers) in june 2017 forecasted about a 500 kb/d increase in Canadian C+C output in 2018. Doubtful Canada or LTO will be the answer. Canadian output increases will be offset by decline in Mexico of about 400 kb/d. It is doubtful that LTO will be more than 50 Gb in the US.
The TRR from USGS probably about 60 Gb at most. Oil prices will probably not reach levels where all of the 60 Gb is economically recoverable, so 50 Gb is more reasonable if oil in 2018$ remains under 250/b.
Correction, CAPP forecast is about a 300 kb/d increase in Canadian C+C in 2018 and only a 500 kb/d C+C increase over the 10 year period from 2021 to 2030 (from 4600 kb/d in 2020 to 5100 kb/d in 2030), output in 2018 is forecast to be 4435 kb/d.
Guym,
On the LTO being estimated on 5 oil plays, the USGS has only done estimates on Wolfcamp, Spraberry and Bakken, recently and Hughes has done an estimate on Eagle Ford, Wolfcamp and Spraberry is only a part of the Permian basin, there is also Anadarko, Niobrara, etc which we do not have updated USGS estimates on.
EIA estimates are probably too high (at about 82 Gb for US LTO) in my opinion. Note that the “data” I fit the model to from 2006 to 2017 is based on all US LTO output and well profile data based on data collected at shaleprofile.com (which does not include the Anadarko Basin).
Very optimistic scenario below which assumes a very high oil price scenario (oil price in 2018$ on right axis). Note that I doubt this will be correct, but in my view this is about as high as US LTO output will go if oil prices rise to $250/b in 2030.
The price scenario is similar to earlier scenarios up to $150/b in August 2021, but continues rising at a slower rate (where it was flat before) until reaching $250/b in Dec 2029, it then declines after Oct 2030. ERR=62 Gb, 320,000 completed wells, peak 8700 kb/d for US LTO output in winter 2024 (Jan/Feb).
For those that will say we don’t know the future, that is correct. This is a scenario based on a set of economic assumptions, a what if exercise.
clicking on chart will give a larger view.
Dennis with respect to your last post addressing me on the Open thread.
Quoting now, “We don’t know who you are, you could be a 12 year old in his/her bedroom.” if you believe that your analytical skills are about as good as Mike’s, that is to say, they are piss poor.
I told you guys 3 years ago to be watching for Oklahoma (I would have been 9 at that time?) , did you see the rig report today Dennis? why do you think rigs are increasing in Okla? You guys are a freakin joke you would not know a real oil man from a sweet potato! I actually risk my $$ and drill freakin wells and have been doing so for 35 years. You see and believe what you want to. There are some here who actually have very good skills and understanding the big picture, some have a much better worldly view than I do, I fully acknowledge that. That is one reason I read this blog. Mike and YOU do not.
Mike is a bully, he is a pretender. He shouts down those with different views, he puts down those who understand the changes that MY industry is undergoing. It started before i started posting, but when he attacked me, unlike you I take on all comers..head on. You prop him up because he supports your “left-wing ideas”.
Yea Dennis, I am twelve years living in my mother basement what a joke. MAGA
Texas Tea,
Mike Shellman owns his own oil company. We don’t know who you are, you hide behind a pseudonym and insult people.
If you are not 12, you act like it. Perhaps you are in the oil industry, or just read about it on the internet.
You prop him up because he supports your “left-wing ideas”.
You obviously haven’t read a thing Mike has written in the past two years, or if you have, you don’t remember any of it. The idea that Mike is a left-winger is just ridiculous. (For that matter, Dennis is barely left of centre.) The fact that Mike and Dennis agree on some things is the result of lengthy debate and compromise.
While I don’t always (alright, infrequently) agree with Mike on social issues, I do not question his positions on running a company or the oil business. His reputation speaks for itself (and I had the same opinion of Mike before I found out who he was as I did after). I am certain that his oily opinions are fact-based and pragmatic rather than ideological and self-serving.
You, however….
Yes, Mike is no left winger.
Thankfulky, Mike is smarter than those that just constantly spew right wing (or left wing, for that matter) dogma, without backing up positions with facts, and without at least considering the merits of competing positions.
Fox News and MSNBC have greatly harmed the political intelligence of our populace with the constant partisan harangue. More and more just shout insults, rather than trying to rationally debate.
Mike knows what he is talking about. I hate it that some keep trying to chase him away from here.
As for me, I hate it that US conventional producers have to thank Russia and OPEC for saving our bacon. Where would the oil price be without those cuts?
Heck, they shale guys should be thanking their lucky stars that Russia and OPEC have the financial discipline that they do not have.
Credit card nation. Shale is just another example of a populace that thinks it can borrow at will forever.
Okay, first let me say that I support Mike in this debate. The debate is not about politics but about the oil patch and shale oil in particular. Mike knows it is not the panacea so many in the oil market are trying to make it out to be. That is neither left wing nor right wing, just the fucking facts. That being said:
Fox News and MSNBC have greatly harmed the political intelligence of our populace with the constant partisan harangue. More and more just shout insults, rather than trying to rationally debate.
I am sorry but that is total bullshit! MSNBC is not the left wing equivalent of Fox News. MSNBC has just as many Republicans in its interviews as Democrats. Republicans on the staff at MSNBC include Steve Schmidt, the former campaign manager for John McCain, Bill Kristol, Dan Quail’s chief of staff and editor of The Weekly Standard, a very conservative publication. And there is former Republican Congressman Joe Scarborough who was a staunch Republican until Trump and his supporters turned him into an Independent.
Anyone who watches to MSNBC and the constant parade of interviews of senators and congressmen from both sides of the aisle knows damn well that they are not the left-wing equivalent of Fox news. And it is an insult to anyone who values fair reporting to say that they are.
Ron.
I have voted in every Democratic primary since I turned 18. The Democratic Party has went very far to the left since my first vote at age 18, although I probably have become more conservative as I have aged, I will admit.
Likewise, the Republican Party has went off its rocker, IMO. Tea Party fools who want to keep the government out of Medicare, etc.
I have witnessed people I have known for decades become warped politically, and I can only think these two organizations have been at the root of this. I’m fact, the ones I know very well I accuse of watching these channels too much, and some will agree they watch every night.
Now, where I live, the vast majority have been warped by Fox News. 70-80% Trump in the counties I live in. However, the Democrats haven’t helped themselves as they pretty much treat us rural folks as just a bunch of ignorant rubes.
However, there are left wing people here I know who have become so left wing they pretty much consider stripper well operators evil polluters who are trying to destroy the environment. They have the same view of those who work at a nearby oil refinery, which employs hundreds at very good wages and benefits, which is not common in rural areas.
There are Democratic politicians who want to shut down ALL domestic crude oil production. So what should I think about that?
OTOH Republican politicians are just fine with cutting taxes, but not government spending, among a host of other stupid policies. Republicans have bought into shale = oil independence for the next 100 year’s hook, line and sinker.
MSNBC is very biased. Maybe Fox is even more so, but both do a disservice IMO. Constant harangue.
Sorry for the mostly non oil rant, I’ll stop. However, I’ll leave you with this comment an older local Democratic Party precinct committeeman made to me recently, “Our Party has went so far that they’d happily have you buy a doobie at the gas station, but ban you from buying a Big Gulp.”
However, there are left wing people here I know who have become so left wing they pretty much consider stripper well operators evil polluters who are trying to destroy the environment.
You know, as long as I have been watching MSNBC, I have not heard one person squawking about stripper wells. Even other types of environmental pollution are seldom ever mentioned on that network. Such problems are largely ignored in favor of political debate between Republicans and Democrats.
MSNBC is very biased. Maybe Fox is even more so, but both do a disservice IMO. Constant harangue.
MSNBC is not a disservice. They do what they can to balance the news. And you are very, very mistaken about their message.
Someone has to call bullshit on Trump and his supporters in Congress. MSNBC is doing that but so are CNN and all the other networks, except FOX.
They, all of them except FOX is doing the US a great service by calling bullshit on Trump and his supporters. To say that they are doing a disservice is itself a disservice to truth. If they did not do it then who would. Trump says to hate the media. Trump says the free press is the enemy of the American people. And you, SS, are playing right into his hands by condemning those who try to stand up for a free press.
Anderson Cooper on CNN, is saying the exact same thing as all the evening commentators on MSNBC. Why are you not condemning Anderson Cooper? And have you ever watched “The View” on ABC? Hell, when it comes to badmouthing Trump, none of the folks on MSNBC could hold a light to those gals.
When networks or people try to tell the truth about that demigod we have in the White House, you should let them do it, not say they are doing a disservice to democracy. The exact opposite is true.
Ron. Come on.
MSNBC, Fox, CNN etc talking heads do not know the difference between stripper wells and unconventional shale wells, at least I’d wager the vast majority do not.
When I read about fracking bans in NY, Vermont and Maryland, all I see are flat out bans, practices of which have gone on for 60 plus years. The 500 barrel fracs we do have almost nothing in common with the mammoth stuff going on in the shale fields. You think more than a handful of these talking heads know that? Likewise, think anyone at Greenpeace or the Sierra Club differentiates. Even though those folks have benefitted from FF every day of their lives.
How about Obama, who I voted for twice. “We are going to end tax breaks for big oil!” Yet the breaks he wanted to eliminate were almost all those benefitting small producers, not ExxonMobil, Chevron etc. We can debate whether those should be eliminated, I have no problem with that. Why didn’t Obama say, “I want to eliminate tax breaks for small oil and gas producers?” Was he uniformed or lying? Many in MSNBC sound bite parroted Obama on that issue.
How about the Obama EPA wanting people like us and Mike to have to get an $80,000 camera and monitor our scant methane emissions on a regular basis. Stripper wells were going to be exempt, till the environmentalists persuaded the Obama Admistration to eliminate that exemption. Think your heroes on MSNBC see any nuance on that issue?
There are proposals made in oil producing states almost each year, which seek to ban ALL fracking. Why?
Yep, I am one of those strange people who actually falls right on some issues, left on some others. Some I have a very tough time with, hard to decide where I stand. There is a lot of gray in this world.
SS, all that oil and fracking stuff you are talking about, I have never heard of any of it ever mentioned on MSNBC. They just don’t talk about that stuff SS, and I think you know that. Methane cameras? I have never heard of them before. And I doubt that any of the talking heads on MSNBC have ever heard of them either.
SS, get real, this fracking stuff you are talking about has nothing to do with the subject under discussion. You said MSNBC was doing a disservice. You didn’t say to whom but I assume you meant a disservice to democracy. That is utterly waist deep bullshit.
You mean they are doing a disservice by not talking about fracking but talking about Trumps constant lies instead?
Trump, with his attacks on the free press, with his demonizing all media except Fox News, with his constant lying about Mexicans and other immigrants, with his pussy grabbing comments, that man is a danger to democracy.
I don’t give a shit if MSNBC, or CNN, or whomever never mention fracking, they have more important things to do in reporting on our demigod in the White House.
You need to get your priorities straight SS. Sure the welfare of small oil companies is important. But it is far more important to save our democracy from that fascist sonofabitch. MSNBC, CNN and all the other networks are doing a great service to their country by exposing that fucking moron for what he is. Fox News is doing the nation a great disservice by supporting him and spouting his lies.
I’d say NPR does a very good job. Same with networks, and Bloomberg. CNN did, till they went the entertainment route. Many newspapers do an excellent job. I’d say Trump would get plenty well covered without Fox and MSNBC.
Freedom of the press is extremely important. So don’t want any censured for sure, but wish some would do more reporting and less entertaining.
But we are getting far afield on the oil board. Sorry about that.
Shallow sand,
As I often say, most of us don’t know which way the bit turns, the places that have banned fracking are places that have never produced oil. I agree on the methane rules, seems random testing (unannounced) by the government for those small producers that cannot afford the equipment, with maybe paying a monitoring service to check levels quarterly. Seems there are all kinds of possible compromises. That’s the proper way to regulate in my view.
No doubt you could come up with a sensible plan, or you and Mike.
Call it sensible methane regulation and write your representative.
Dennis.
I’d suggest the Federal EPA work through the State EPA’s. Provide some funding through feds for them to buy cameras. Have State EPA’s work with operators to do an initial test of all facilities. Charge operator a reasonable user fee to help offset at least part of cost of cameras.
If there are high emission facilities at a danger level, shut in until remedied of course. If there are facilities slightly over threshold, work with operators by giving a time period to remedy and then re test.
During initial testing, have State EPA work with State regulatory body that inspects wells to do reporting, as those agencies already have well and other facilities all listed in a database. No need to set up yet another well and facility database. When the regulatory body in the states inspects a facility now, they complete a formreport. Just have them do the same with copy to State EPA and operator.
After initial testing is complete, spot monitoring on random basis would be fine. EPA would know of problem areas, would be more efficient on spot testing. I do think spot tests, unannounced is fine after the initial testing phase, but if there is a problem, there should be immediate contact with the operator and a mechanism for immediate review of test results. I’d fear the dreaded email, more than 30 days post test, with no cooperating on review of the test. No need for “gotcha” stuff. The goal should always be protecting the environment through cooperation, not “sticking it to an industry we ideologically don’t like.” Immediate contact with operator is critical. I have seen State EPA notified of issue and take many days to notify operator. Yes, is operators responsibility 24/7/365. However operator employees don’t always do job properly. Why not notify operator immediately so operator can immediately take emergency measures? Crazy the times we have heard of State EPA noting leak, filling out paperwork and taking days to notify operator, all the while the leak persists, doing more damage.
The final requirement, don’t just limit testing to oil and gas facilities. Test ALL facilities in all industries that could possibly emit methane. Why single out oil and gas facilities??? Shouldn’t the goal be to limit methane emissions, no matter the source? (The more tested, the more $$ to pay for cameras, BTW). What is the rationale for passing methane rules that apply ONLY to upstream oil and gas facilities? I’d wager there are other industries besides upstream oil and gas that emit methane.
There are more than one million onshore wells and facilities. A $10 per well user fee for wells under 15 BOPD and of $50 for wells over 15 BOPD, would pay for a lot of cameras, right off the bat.
I agree with Shallow Sand, all these TV channels are controlled by people with clear political agendas, and most of their content has talking heads delivering propaganda. Some of this propaganda is already packaged for delivery to any us audience. This implies that in some areas there’s a consensus of the elites to serve you the same homogenized purée.
This morning I tried to watch the news and it was so clear they were coordinated to put up propaganda, so I changed the setting and started watching my favorite YouTube channels.
By the way, I did notice that “shale” production is increasing, but a lot of it is extremely light. I suspect the NGL prices will be going down, because those LTOs have a really high NGL cut.
Fernando wrote: I agree with Shallow Sand, all these TV channels are controlled by people with clear political agendas,…
For starters, your are not agreeing with Shallow Sand. SS singled out Fox and MSNBC and said these two stations were doing a disservice to… I suppose democracy.
And I claim it is doing a disservice to the world to compare Fox to MSNBC. SS said the other stations are doing okay except for CNN who went the entertainment route. Of course, that is bullshit as well, while there is some entertainment on every network, CNN has no more entertainment than Fox or MSNBC and a whole lot less than the major networks, who are primarily entertainment stations.
This morning I tried to watch the news and it was so clear they were coordinated to put up propaganda,…
That is nothing more than a bullshit conspiracy theory. The networks are not coordinated to do anything because they do not coordinate with each other whatsoever. That sounds like nothing more than a Trump paranoid fake news conspiracy theory. Are you a Trumpite? You sure as hell sound like one.
Regarding methane emissions, even a cursory googling will show the amounts given off by agriculture – especially rice farming – cattle, (the forever infamous “fart catcher” from Argentina prompted some laughs), and natural emissions such as swamp gas, should clearly demonstrate the demonization of the hydrocarbon industry is a deliberate, targeted endeavor.
Quelle surprise.
Quick followup, opponents of hydroelectricity – dams – are starting to claim the massive amount of decaying vegetation beneath the flooded areas are emitting enormous amounts of methane.
Mebbee we needs ta git some monitors set up.
shallow sand,
Your suggestions sound reasonable. I agree methane emissions that have a chance of being abated, should likely be measured, but cattle farms, swamps, and landfills probably little can be done to reduce emissions.
Measuring and perhaps taxing those emissions at the same rate charged to all industries, makes sense. Though in the case of swamps, there’s no one to tax, so we’d have to remove swamps from consideration.
Clean air and water are more of a national than state consideration as air and water flows don’t always respect state boundaries. 🙂 So it’s not clear in this case that these matters should be left to the states.
There were several posters on measuring methane at last December’s AGU meeting. One poster was monitoring in Wyoming and I pointed out that the increases that they were seeing was likely due to fracking. They thought it was livestock but the rise didn’t make sense for that, as it was more than just methane.
In support of Rons assertion about relative media bias, this linked chart is a very good attempt to rank media sources on partisan bias and fact vs opinion. Study it up, and ask yourself- I am voluntarily brainwashing myself with garbage? Try something new, up near the top center.
http://www.allgeneralizationsarefalse.com/wp-content/uploads/2018/01/Media-Bias-Chart_Version-3.1_Watermark-min.jpg
I love it.
MSNBC in the center, (Opinion Fair Persuasion) and slightly to the left (Skews Liberal).
Fox news is in the lower right, (Hyper-Partisan Conservative) and (Nonsense damaging to public discourse).
I couldn’t agree more.
However the one furthest to the right and right on the bottom, the worst of the worst, is one of Trump’s favorite radio shows, Infowars. He was actually once a guest on that show during his campaign. Alex Jones, the MC of the show, once said the Sandy Hook school shooting was a hoax, a conspiracy perpetrated by the liberal media.
I guess you realize the “grader” can be biased, and can also be vaccinated to support a false storyline. Therefore its definition of left versus right and reality versus fake news can itself be off center?
There’s also the consideration that, in the US, there’s a need to grade in areas in which both the left and right could be wrong. For example, when Bush was lying about Iraq WMD we saw a fairly good alignment of all media on the prowar side (it was clear to me the guidance was so strong only a few oddballs like Obama and McClatchy news dared oppose the “consensus”. And I suppose by now you do agree the WMD story was a lie.
The same thing happens today in other areas, where most of these “news sources” seem to align to feed you propaganda. A propaganda so widespread and convincing that even these graders think it’s true.
Fernando, did you ever consider that you , too, are just another source of propaganda?
Shallow sand,
I agree there are some very left wing views in the Democratic party and there are some very right wing views in the Republican party. Consider the fact that very centrist Republicans such as Susan Collins have become an endangered species, she is the only one remaining.
There are some leftwing Democrats, but most in the Senate are pretty centrist.
The Republicans have moved much farther to the right than Democrats have moved to the left.
Reagan and HW Bush would ne considered RINOs in today’s Republican party.
Which party just passed a bugdet that will increase deficits while cutting taxes on the wealthy? If one is concerned with deficits current Republicans are not the answer.
Guess it depends on where you sit.
Flash News Alert! The MRT announces , surging exports of Permian LTO and LNG
finally bring peace to the Korean Peninsula Kim Jong Un and Moon Jae-In join Hans in friendship.
https://www.mrt.com/business/oil/article/Shale-revolution-will-help-US-navigate-challenges-12872089.php
Surging production of LTO\LNG is also credited with reducing regulation and saving the free market and capitalism.
Given time and unlimited exports of LTO/LNG experts agree that Iran, Russia, Syria and Israel will beat their swords into plowshares and the USA will withdraw all forces from the Arabian Peninsula and Persian Gulf.
In other news, the Permian Basin Board of Realtors admits that affordable housing does not exist in Midland, Texas.
https://www.mrt.com/news/article/PBBOR-Home-supply-drops-below-one-month-s-worth-12872098.php
Hi Reno,
Yes that’s correct, those with far right political views may believe the Republican party needs to move to the right. For many US citizens, there were a number of Republicans and Democrats in the US Senate that were centrists, willing to work with other centrists on the other side of the aisle, many of those Senators are gone, especially in the Republican party.
No doubt there are others who see it differently, but my views are relatively centrist, though I do lean more left than right.
‘There is nothing in the center of the road but dead armadillos and yellow lines”
-Hightower
The US political system was set up to force people to come to a compromise. Without more centrists to broker such deals, we get a government of inacti9on that we have seen for about the past 20 years or so.
If one prefers very little government action to solve societal problems, it’s a great system.
If one prefers safe roads and bridges, moving forward by government advancing technology through cutting edge research (think NASA in the sixties), not so much.
The fringe can be interesting, but most people don’t live there.
Another point for TT,
I have learned a lot from Mike’s comments.
From you I have learned very little.
If you are very knowledgable you hide it well. 🙂
A wise man pointed me to the following
http://energypost.eu/the-secret-of-the-great-american-fracking-bubble/
A good read in my opinion, excerpt below:
Of course, business media and conservative think tanks are still selling the story that the fracking industry has produced an economic and technical revolution.
In 2017 Investors Business Daily ran an opinion piece with the title, “The Shale Revolution Is A Made-In-America Success Story.”It was authored by Mark Perry of the American Enterprise Institute — a free market-focused think tank funded in part by the oil and gas industry.
How does the author measure success? Not via profits. The metric Perry uses to argue the success of the fracking industry is production volume. And it is true that the volumes of oil produced by fracking shale are increasing and currently at record levels.
But here is the catch — when you lose money on each barrel of oil you pump and sell — the more you pump, the more money you lose. While it is true that the industry has been successful at getting oil out of the ground, its companies have mostly lost money doing it.
However, much like with the U.S. housing boom, this false narrative persists that the fracking industry is a money-making, rather than money-losing, venture.
Another article in the series at link below:
https://www.desmogblog.com/2018/04/26/gop-tax-law-bails-out-fracking-companies-debt-eog-hamm
EOG Resources is one of the top companies in the fracking industry, and thanks to the new tax bill passed by Republicans and President Donald Trump at the end of last year, EOG had an exceptionally strong year compared to 2016.
In 2017, the company reported a net income of $2.6 billion. The previous year? A loss of $1.1 billion. That financial turnaround seems very impressive until you realize that $2.2 billion, or about 85 percent, of its 2017 income was the result of the new tax law. Without that gift from the GOP and Trump, EOG would have lost approximately $700 million between those two years. Instead they are $1.5 billion ahead of the game.
With numbers like these, it is easy to see how the Tax Cuts and Jobs Act of 2017 was a much-needed lifeline for the money-losing fracking industry. EOG is routinely touted as one of the best shale oil and gas companies. Yet the company still lost $700 million in the past two years. Or at least it would have if not for the tax bill.
An updated view on Russia and CIS from Rystad
2018-04-26 (Rystad Energy) Oil production in Russia and CIS has been steadily growing since 2008 reaching a level of 13.8 million bbl/d in 2017. This year, given the prolonged production cut agreed with OPEC, we expect oil output in Russia and CIS to decrease slightly to 13.7 million bbl/d. In 2019, the growth trend is anticipated to continue if the cut agreement is not prolonged.
https://www.rystadenergy.com/newsevents/news/newsletters/EandP/eandp-newsletter-april-2018/
As I read it, it’s about a 200k growth potential if cut is exited. Not quite an avalanche.
I heard they had connected the China pipeline and were shifting oil from the Primorsk tanker market to the East. A second pipeline will be ready soon, and this will help the eastern Siberia field developments. I suggested this move as a means to allow the gradual development of Eastern Siberia back in the 1990s when I lived in Moscow.
Something worth reading.
http://money.cnn.com/2018/04/27/news/companies/exxon-earnings-oil-production/index.html
The facts speak for themselves. The various companies that produce most of the world’s oil produce it from conventional oil fields, on shore or off, with the tar sands people just really getting into the game in a big way over the last decade or so.
I don’t personally think there’s enough cheaply recoverable tight oil around to offset the decline of conventional oil fields more than a few years at the most…… but otoh all I know is what I read here and at a few other sites devoted to energy.
My guess is that oil will be up quite a bit within a year or two. If I had ample cash handy, I would buy a couple of thousand gallons betting on it, but so long as I can get it later, the price really doesn’t matter all that much to me. I pass my costs along, like all other small businessmen.
I’m not altogether sure WHO the editors and writers at CNN speak for. They often impress me as cheerleaders for various industries rather than serious observers.
ExxonMobil payed $36 billion for XTO, a shale operator, in 2009 and have made other purchases since. So they are not late to the game. A lot of Chevron’s growth has come from big LNG projects. ConocoPhilips are becoming a one play independent and are using up or selling off their reserves so fast they might cease to exist in the early 2020s. ExxonMobil has bigger production than the others so they’d need a higher proportion of LTO to have the same effect. They tend to, or at least tended to when I had a bit to do with them, a slightly longer term view than the other operators, but it’s all relative and the next quarterly statement tended to dominate even for them. They also bet and lost on Russia, but have by far the biggest recent conventional exploration success in Guyana – the opposite of the past when they discovered more oil on Wall Street than anywhere else (which may be part of their current problems). It may also be they saw the issues with lack of new E&P prospects some years ago – they appointed someone with downstream experience to replace Tillerson and a lot of recent investment has been on that side.
Almost all “popular” MSM and industry publications now seem to comment on the noise and not the signal when it comes to oil, energy and actually pretty much anything. The Atlantic, The Economist and the like and some remaining heavyweight newspapers are the few that are worth looking at, and I’d say some independent film (not TV) documentaries – not sure if that has always been the case and I’ve just started to notice or there really has been some change.
George, I agree with you 100%.
The Economist is a great contraindicator.
Read commentary on Exxon’s report. It all contorted itself to align with the shale narrative. Chevron’s numbers didn’t come from that.
Pasted from Chevron’s report:
“Net oil-equivalent production of 733,000 barrels per day in first quarter 2018 was up 61,000 barrels per day from a year earlier. Production increases from shale and tight properties in the Permian Basin in Texas and New Mexico, and base business in the Gulf of Mexico, were partially offset by the impact of asset sales of 39,000 barrels per day and normal field declines.
The net liquids component of oil-equivalent production in first quarter 2018 increased 13 percent to 567,000 barrels per day, while net natural gas production decreased 1 percent to 993 million cubic feet per day.”
Curious wording. And not really delineating from GoM.
Here’s their international:
Net oil-equivalent production of 2.12 million barrels per day in first quarter 2018 was up 115,000 barrels per day from a year earlier. Production increases from major capital projects, primarily Gorgon and Wheatstone in Australia, were partially offset by production entitlement effects in several locations, normal field declines and the impact of asset sales of 22,000 barrels per day. The net liquids component of oil-equivalent production decreased 1 percent to 1.19 million barrels per day in the 2018 first quarter, while net natural gas production increased 17 percent to 5.60 billion cubic feet per day”
One hell of a lot more OE is coming from non American non shale than American shale.
Mexico has dropped around 35 kbpd each of the last two months. Last year they halted the decline a bit (dropping only about 80 kbpd total liquids compared to over 200 from 2015 to 2016) but might be paying the price now. Gas (bottom curve) looks to be going dow even faster. Pemex have stopped issuing figures by field so they have to be got from the cnih, which is a nice looking site but not so easy to download from.
Looks like roughly 200 kb/d annual decline rate for Mexican C+C from Jan 2016 to Dec 2017, estimate from reading chart and eyeballing a trend. Declines in China and Mexico may offset increases in Canada and Brazil, so that most of increased World output might be from the US. Canada may increase about 300 kb/d, Brazil about 200 kb/d, so if China’s output declines by 300 kb/d the net change for these 4 countries combined would be zero in 2018.
An update on Angola on Bloomberg, nothing really new. Kaombo Norte FPSO expected August, Kaombo Sul FPSO still under construction.
2018-04-27 (Bloomberg) Angola’s slide could be alleviated by the end of the year, with the start up of an oil field operated by Total SA. Kaombo field, delayed from 2017, will have a capacity of 230,000 bpd.
That might not come soon enough.
Although output from all oil fields diminishes over time as the pressure in their reservoirs falls, Angola’s deep-water operations are especially costly to maintain. Because of insufficient capital expenditure, the rate of decline from Angola’s deposits is more than double the global average, at 13% to 18%, Mallinson estimates (Energy Aspects Ltd).
“Most Angolan fields have struggled or entered into a steep decline phase after three years — it’s the nature of the geological characteristics of Angola’s offshore production,” he said.
The country’s struggles will only intensify in coming years, the International Energy Agency predicts. Since peaking at 1.9 MMbpd in 2008, Angola’s production has slumped to about 1.5 million, and will dwindle to just under 1.3 MMbpd in 2023, according to the agency.
http://www.worldoil.com/news/2018/4/27/opec-cuts-may-go-deeper-as-another-member-sees-output-slump
Angolan exports: https://pbs.twimg.com/media/Db0hbOhV0AAA9E5.jpg
2018-03-08 (Reuters) The Kaombo Norte FPSO vessel can pump 115,000 bbl/d, half the oil block’s eventual production. It’s expected to pump roughly 100,000 bbl/d by August.
Another FPSO, Kaombo Sul, is still in Singapore (also 115,000 bbl/d).
https://www.reuters.com/article/angola-oil-kaombo/update-2-angola-to-launch-big-oil-block-under-shadow-of-opec-cuts-idUSL5N1QQ66O
Angola’s OPEC cut level 1,673 kb/day
February 2018: 1,606 (secondary sources)
March 2018: 1,524
“Most Angolan fields have struggled or entered into a steep decline phase after three years — it’s the nature of the geological characteristics of Angola’s offshore production,” which is correct and the economically best way to exploit the fields, is completely different to: “Because of insufficient capital expenditure, the rate of decline from Angola’s deposits is more than double the global average, at 13% to 18%,”
Bloomberg needs some new bots.
Yeah most news articles are written like that, they try to include everything but don’t check to see if it makes overall sense. And they might not know how high the oil price needs to be for Angola’s offshore geology to be economic. I noticed China is restarting some wells…
2018-03-28 (Bloomberg) Sinopec is restarting wells at Shengli oilfield that it shut down during the 2015-16 price crash (Shengli is the 2nd largest oil field in China)
2016-09-13 (Bloomberg) “China’s crude output won’t see an apparent rebound unless Brent recovers to $60 a barrel level, as most of China’s aging oilfields can’t make a profit below this price,” Tian said.
Angola’s geology is economic, the point is it is most economic to deplete the oil fields quickly. Higher prices won’t change that – they may mean other fields can be developed, although I don’t think there are many discoveries waiting, but they will be developed the same way, with high decline rates.
There’s a software package to optimize field developments, it allows setting the plateau rate, which dictates the decline after plateau. I’ve found users neglect a lot the water and gas rate constraints, forget pipeline bottlenecks, and this creates a lot of problems. BP engineers have a tendency to over design facilities and have hellacious declines. I think Total is a bit better. I haven’t done work with Exxon in years, so I’m not sure where they’re at. These are the three largest Angola operators.
An update on Canada on Bloomberg, nothing really new. It really does seem that they ran Keystone at a lower pressure but with nearly the same flow rate by adding more diluent, at higher cost.
2018-04-27 (Bloomberg) Husky Energy Inc. on Thursday became the second big oil-sands producer to say that it throttled back first-quarter production in response to steeper discounts for Canadian crude. Those wider differentials stem from Alberta’s dearth of pipelines and railroads to haul crude to refiners. Rival oil-sands company Cenovus Energy Inc. halted all investments in new projects until the pipeline mess is resolved.
Output of bitumen and upgraded crude may grow 11% to 2.98 MMbpd this year, according to the Canadian Association of Petroleum Producers, boosted by megaprojects like Suncor Energy Inc.’s Fort Hills mine and an expansion at Canadian Natural Resources Ltd.’s Horizon mine.
But those supply gains will taper off to 2.5% next year and average less than 2% annually through 2030 as pipeline and regulatory hurdles curtail investments in the world’s third-largest oil reserves, CAPP said.
http://www.worldoil.com/news/2018/4/27/oil-sands-get-taste-of-slower-growth-ahead-as-logjams-hit-output
Bloomberg CAPP production growth chart: https://pbs.twimg.com/media/DbueNsBXkAENdGz.jpg
2018-04-27 (Reuters) TransCanada, Keystone running at near normal throughput. The restrictions “really did have a minor impact on our throughput and so consequently, I don’t anticipate seeing a tremendous increase in our throughput once it’s lifted, based on some of the changes we’ve made already,” said TransCanada’s head of liquids Paul Miller on a conference call.
https://www.reuters.com/article/us-transcanada-results/transcanada-profit-beats-keystone-running-near-normal-throughput-idUSKBN1HY1K7
Does that mean Canada peaks in 2018 – I think conventional oil (heavy and light) plus condensate is about the same quantity as bitumen and after Hebron finishes ramp-up it will likely be in decline (it’s noticeable that their drilling rigs haven’t really picked up this year.
I’ve not kept up-to-date with Canadian production, I’m still wondering how much fractured LTO is included in their light oil production figures. I’ve not seen it separated out. From places like the North Bakken area. So as you know the figures for conventional oil might not be conventional? I don’t know.
Rig Count for Saskatchewan + Manitoba – Baker Hughes (I’ve not seen any Horizontal rig numbers) https://pbs.twimg.com/media/Db3ZlwIW4AAOv2C.jpg
Energy news,
How do you define “conventional oil”, this term is used in very different ways.
Jean Laherrere, for example includes LTO as “conventional” oil, while the USGS separates oil into continuous oil (extra heavy from Canadian oil sands and Orinoco and LTO) and non continuous (from oil reservoirs) oil. Some might call the “non-continuous” oil “conventional” oil and consider both extra heavy oil (API gravity <=10) and LTO as non-conventional oil.
I think you may be using "conventional" in the USGS "non-continuous" sense, rather than simply oil that is not extra heavy.
Another difference is some like to include NGL as a part of "conventional" oil, others prefer to use only C+C "conventional" oil.
I just use the popular terms used in the news. And I tend to think of unconventional oil as being more costly to produce. I guess because LTO doesn’t flow unless the rocks are fractured and bitumen doesn’t flow because it’s a solid etc. I don’t know the actual historical reason for the terms conventional and unconventional oil.
As you know NGLs includes ethane, propane and butane which are compressed gases and not really liquid fuels. It’s only pentane and above that are liquids (also known as natural gasoline). I think that including gases in the crude oil category is a similar issue to measuring production in terms of boe, it’s confusing and I don’t understand why the IEA and others do it. If all NGPL’s went into refineries then I guess that it would be fair to include them in the total for crude oil but they don’t.
In the EIA’s monthly inventory figures they now separate out the gases from the natural gasoline but not in the weekly figures which still only include the categories for propane and NGPLs.
Conventional and unconventional and LTO are pretty confused terms. Permian is basically shale that has natural fractures in areas that has been drilled for many decades. Austin Chalk and Buda are the same since the 1920s. I am not sure, but I think the Bakken had some of that, too. Eagle Ford didn’t arrive until horizontal, but they have been drilling Pearsall gas for a long time. Actually the Eagle Ford is considered to be the source rock for the Austin Chalk and the Buda, so it has been produced as long as they have. So, even though those old wells were considered “conventional”, it’s the same LTO as the unconventional wells being drilled, now. It just was not called LTO then.
Tight oil has been produced for a while. Quantity was not significant before 2008 or so for liquids output.
The Permian was not significant before? They were drilling in the same fields with verticals for years. In large part, they relied on natural fractures to get the best production. However, they Fraced verticals to get the rest.They are still drilling verticals, and fracing them. Fracing on verticals has existed over 150 years. Production has amounted to about 30 billion barrels. Permian made up the majority of Texas production for many years, and has been in production over 100 years. Austin Chalk and Buda were mainstays of Texas production in other areas of Texas prior to the Eagle Ford. Over 5 billion barrels have been produced from East Texas, which is primarily the Woodbine/Eagle Ford area, long prior to unconventional drilling. That’s definitely LTO, although they did not call it that before you and I were born.
https://en.m.wikipedia.org/wiki/East_Texas_Oil_Field
Yes, Texas also had its Spindle Tops, and still has a fair amount of sands (even some in the Permian), but LTO has probably provided a majority of production.
Admittedly, they did lift the woodbine with water, but the source rock was the Eagle Ford. Austin Chalk is a Chalk, but the source rock is the Eagle Ford. Buda is a shale, but the source rock is the Eagle Ford.
Guym,
I use EIA to estimate tight oil output from the crude plus condensate production page (link below) not the DPR. Permian LTO output was about 190 kb/d in 2000 (12 month average) compared to 2000 kb/d in the most recent 12 months.
https://www.eia.gov/petroleum/data.php#crude
direct link to spreadsheet below
https://www.eia.gov/energyexplained/data/U.S.%20tight%20oil%20production.xlsx
I believe the EIA gets their data from drilling info who in turn use RRC data (including pending lease file data).
Much of Permian output before 2008 was produced from “conventional” reservoirs. For example RRC has Permian Basin output at about 718 kb/d in 2008, where EIA has all Permian (including New Mexico) LTO output in 2008 at 250 kb/d, so the majority at that time was “conventional” oil.
http://www.rrc.state.tx.us/media/41514/permianbasin_oil_perday.pdf
and
http://www.rrc.state.tx.us/media/41516/permianbasin_condensate_perday.pdf
Also RRC has 158,834 oil wells on schedule in the Permian Basin as of Jan 2018 (I do not know if pending leases are included as I don’t know exactly what “on schedule” means).
http://www.rrc.state.tx.us/media/43448/pb-area-201801-lg.jpg
Chart below can be enlarged by clicking on it.
Permian is not shale. It is used on TV and places like here as a catch all for West Texas Production. It has produced from carbonates and sands for the last 100 years. The shales are nothing more than the source rock for the conventional production found in these basins. Which should tell you all you need to know about the quality of rock. They have been well defined since they started drilling wells out there.
In my opinion, Conventional is producing from a trap. Rock that the oil/gas migrated into and was trapped ( four way closure, pinchout, etc). Unconventional is produced from the source rock like shales or even CBM earlier in the late 90’s. We have been fracking wells for a long long time. We have been producing wells from horizontal well bores for 30 years now (they were not fracked. essentially open hole completions). Unconventional combined the 2 (fracking and horizontal) because they were drilling shitty rock and needed to stimulate the production and open as much rock as possible.
I look at LTO as a description of the oil quality (light oil) and the type of rock (the T in LTO)
Some overlap between Conventional and Unconventional/LTO but very different rock and costs.
Almost no oil is produced.
It is extracted.
Common term is Oil and Gas Produers. Not Oil and gas Extractors. Producers, Production and Produced are the accepted and used terms when discussing Oil and Gas and the PRODUCT (oil and gas) that is PRODUCED from the well.
But if you want to use Extractors or extracted, go ahead.
I have absolutely no argument on your definitions. Now, all we have to do is convince the rest of the world that one third of the Permian needs to be classified as LO, instead of LTO. Or, part of the Buda. Austin Chalk, or other places need to be separated into LO and LTO categories. Because, some were drilled in natural fractures or traps in the source rock, and some drilled horizontally. It’s going into one category, for the public. The better overall definition would it’s all LO, but that’s not what is used the most. Unfortunately, dictionaries are changed daily based on common usage.
Guym,
Aren’t the majority of Austin chalk oil wells considered “tight” oil wells?
Reno Hightower,
Nice summary.
Thx.
The Permian Basin was a huge conventional oil producer for many years. But we produced the shallower carbonates, the Wolfcamp and similar tight rocks were left for much smaller developments. I believe those shallow carbonates can be co2 flooded practically forever but need a decent price.
http://www.beg.utexas.edu/index.php/research/programs/starr/unconventional-resources/wolfberry-spraberry
Interesting to look at the type of rocks we talk about.
Most were shallower, but. Which just adds to my confusion of the different plays. Ok, I really know jacks!!t. But it does appear somewhere in the neighborhood of 700 million was produced from the wolfberry wells. (5000 wells times 140k EUR) How much Sprayberry, and how much wolfcamp? I was reading were they were doing a fracture on about 3500 feet of the vertical to capture both.
Just looking at the pictures of the rocks, and using my limited knowledge of geology, and what I have it defined since childhood, the first two pictures depict sandstone. It looks like you could rub it, and get sand on your fingers. Sandstone generally has a little better porosity and permeability than shale. The second two, I would call shale. More muddish clay than sand. Some sand if you break it, but mostly shale.
Many articles describe it all as shale, but pictures speak better than words, sometimes. I realize it may look different based on samples, but I assume it is supposed to be representative. So, I guess in my own mind, I will depict anything above wolf as sandstone or sand, and wolf as shale. Both are sedimentary, but different compositions. Eagle Ford and Bakken rock pictures I find, look like shale. Only the Wolfcamp looks like shale in the Permian, so far in looking.
Fernando, you said if a decent price. Does that mean there could be more verticals like around 2013 and 14, when price was around $100? I note some, still, in the shallower fields. I find no less than 35 different fields in the Permian. Many are in the Guadalupian, which would represent shallower wells. I can find nothing on production by fields, as they always throw it together.
Agree NGL except c5 should not be included as oil
To Dennis re Austin Chalk.The majority of production is probably from tight oil, now. Not sure about the number. There was prolific drilling in the Austin Chalk since about 1950s. It also developed a bad name from unscrupulous developers, as you could drill in a lot of places and get a little oil. It needed natural fractures and traps to be productive in conventional drilling.
Know a little about this one from family members. It was the Austin that lead my grandfather, who was a driller, to keep the mineral rights we now own. He was sure that someday they would be able to get a larger quantity out of it than he was able to do. He was about two hundred feet off, and in the wrong field, but right idea. EOG drilled a pretty successful Eagle Ford right next to where he drilled. However, Texas American has started drilling in the Austin Chalk near us, so he might, yet, be fully vindicated.
If the area is naturally fractured, there has been some discussion and decisions on whether to use sand, or remain open hole. EOG is using sand, and I think most others are, too. There is still quite of bit of activity in it in Western Karnes, Eastern Atascosa, and LaSalle Counties. Big pick up in interest in La.
Buda is pretty much the same way, and, of course in the Permian, they have a much bigger field of source rock. Although, the more I read about the geology of the Permian, the more confused I become. I have serious doubts about continuing to plan 4 pad 33 well horizontals all over the place.
Was there a lot of conventional oil produced from Austin Chalk?
There was. Giddings field alone has produced about 500 MMBO and 5 TCFG.
It’s a widowmaker though. If you didn’t hit fractures back in the day, you were toast.
I think it averaged around 100k a day for many years. Buda, probably a lot more. Vertical wells just around Houston were reported at over 400k a day from Buda. Buda is reported to be more fractured. Looking it up on the RRC site is a nightmare. Field names change frequently over short distances.
Hi Timthetiny,
If that is most of the conventional produced in the Austin chalk, before the advent of horizontal fracked wells to increase output, it’s not really a huge amount. Total LTO output in the Austin Chalk from Jan 2000 to Feb 20118 was about 289 million barrels according to EIA estimates, so a small amount relative to output from the Giddings field.
As far as Giddings Austin Chalk output from 1993-2018, most is from Giddings 3 at 257 MMb cumulative with 141 MMb from 1993 to 1999, so about 116 MMb from 2000-2018, its possible this is included in the LTO reported from the EIA, most other Giddings wells that are labelled as Austin Chalk in RRC PDQ, have relatively low cumulative oil output from 1993-2018.
I wouldn’t think much LTO was produced prior to 2012 from Austin Chalk. Maybe some open hole attempts, but Austin Chalk encompasses the Eagle Ford, so Giddings is a small area in comparison. It stretches from the Eagle Ford across East Texas into Lousiana, where it has been drilled in the past, too. Hard to put numbers to.
http://www.dnr.louisiana.gov/assets/OMR/ACPforOMR.2018.pdf
Eia estimates appear different than this history of Austin Chalk. Conventional close to 948 million barrels.
https://austinchalkoilgas.com/
Add that to Louisiana, and you get well over a billion barrels. Note the charts, in that most of this production was pre-nonconventional. It’s an interesting hybrid, like some Buda. For several years prior to about 2015, they drilled horizontals, and fraced it without pressure and sand, because the area was naturally fractured. They do the same with verticals. So, is it animal or vegetable? LO or LTO?
Guym,
EIA estimate is 2000 to 2018 for LTO only.
The 948 million is since 1920.
Good overall on Austin Chalk over three states (2012).
https://pubs.usgs.gov/sir/2012/5159/SIR12-5159.pdf
Has several names.
Guym,
Thanks, from that paper.
The combined conventional resource mean totals for the Austin Chalk are 78 MMBO, 2.3 TCFG, and 257 MMBNGL. For continuous resources, the USGS estimated means of 879 MMBO, 1.3 TCFG, and 106 MMBNGL for the Austin Pearsall- Giddings Area Oil AU (Pearson and others, 2011).
So the total undiscovered oil resource is 879+78=957 MMBO for Austin Pearsall-Giddings Area.
Also there was this history:
Early drilling within the Austin Chalk focused on simple, vertical wells that drained oil and gas from the local fracture systems near the well. In the 1970s, hydraulic fracturing of the reservoir was initiated, which enhanced and connected these fracture systems to ultimately create a larger drainage area. A second advance in oil and gas production arrived in 1984, with the advent of horizontal drilling. First utilized in Pearsall and Giddings fields (fig. 4) to produce oil and gas from the Austin, this new technique allowed for the drainage of multiple vertical fracture systems, thus enhancing the ultimate recovery from a single well from three to five times that of a comparable vertical well (Haymond, 1991).
Again, most reports of using pressure and sand to Austin Chalk were post 2014. Prior to that, there were open hole horizontals. Are open hole horizontals LTO, or LO? The primary distinction Reno uses is in the cost, even if the same oil is being produced from the same rock.
Guym,
I would call it LTO if its from a tight reservoir, the “revolution” in LTO output happened when horizontal fracked wells became common starting around 2008 or so in North Dakota and then later (around 2011) in Texas (Eagle Ford first and later applied in the Permian more widely after 2013).
Though re-reading that quote from the USGS paper it seems to imply that the Austin chalk saw horizontal fracked wells as early as 1984, this fact has also been mentioned by Rockman over at peakoil.com in the past.
Don’t know if you folks are following recent goings on regarding the Austin Chalk.
Marathon yesterday announced 180,000 acres were just leased in Looeezeeannah AC.
Conoco Philips indicated almost a quarter million acres also just leased here.
EOG has 130,000 acres.
EOG announced last fall their Eagles Ranch 1 AC well was drilled to 16,700 vertical depth with high IP.
Tuscaloosa Marine Shale is in this area also.
Although the Sooner state may be entering the Dance in a big way shortly, the Chalk is putting on her make up.
Fracturing is done on vertical wells, too. I posted where they had 4000 foot verticals fracked into the wood berry (combination woodcamp/Sprayberry).It was done on the early horizontals with Austin Chalk, too. As, open hole. If we are saying that a fracture job constitutes LTO, then it negates what Reno is trying to differentiate. I understood him to mean, the more expensive frac job performed with combination of high pressure hydraulic fracturing with sand or polymers to keep the fractures open. Which is not open hole. Fracturing in its basic form, just means forcing liquid into the fractures to help open them. A mainstay with a lot of verticals. Then, on the other hand, I have no problem with your definition that if it comes from a “tight” formation, any oil out of it is LTO. Which was what I thought, before I was corrected.
CAPP (Canadian association of petroleum producers) in june 2017 forecasted about a 500 kb/d increase in Canadian C+C output in 2018
I am sure that’s where IEA is predicting most of the other 500k increase in production for 2018 will mostly come from. But is it?
It’s not a consistent flow, but compared to Jan 2017, it doesn’t look promising.
https://tradingeconomics.com/canada/crude-oil-production
These guys don’t have it forecasted for much of an increase, under 50k barrels by the end of the year. Don’t think I would trust this one. It has US production at 9.8 million at the end of the year. Even I am not that pessimistic.
I misread the CAPP forecast on my phone. It is about a 300 kb/d increase forecast for 2018, 2017 was forecast as 270 kb/d increase. From 2020 to 2030 they only expect another 500 kb/d increase over 10 years. Note that the National Energy Board (NEB) is currently forecasting a 300 kb/d increase in Canadian C+C for 2018.
Chart for CAPP 2017 forecast (June 2017) of Canadian C+C output from 2017 to 2030 below.
https://www.capp.ca/publications-and-statistics/publications/303440
I hadn’t noticed that Petrobras has been saving its pennies, it’s now Pemex that has the most debt
2018-04-16 (Bloomberg) With $84.5 billion in bonds outstanding, Pemex is the world’s most indebted oil major.
http://www.worldoil.com/news/2018/4/16/for-pemex-an-845-billion-question-in-leftist-lopez-obrador
2018-04-13 (Platts) interview with CEO of state-controlled Petrobras
Parente said. Petrobras aims to cut its net debt to $77 billion by the end of this year, from $100 billion at the end of 2015, on the back of cash flows and asset sales.
The company has an average interest rate on its debt instruments of just over 6%, and $20 billion of debt due for repayment in the next three years.
https://www.platts.com/latest-news/oil/london/interview—-election-turbulence-not-to-affect-26938609
Central banks – summary of current interest rates
Mexican interest rate Banxico: 7.500 %
Brazilian interest rate BACEN: 6.500 %
Surprising they haven’t rolled that debt over at 4%. No way they haven’t thought of it. 2% diff on that much money is serious stuff.
Chevron’s projection for it’s own Permian production https://pbs.twimg.com/media/Db3FtH8W0AAYfFt.jpg
Rystad Energy’s forecast for US production https://pbs.twimg.com/media/DbKZa86VAAAKLwd.jpg
Big correction for one month. Likely to go much lower. Though June 2018, it looks pretty reasonable, but then shoots up after that. Can’t figure that, unless they are predicting a huge price increase, which is possible. Bigger increases from other LTO plays. Or pipelines finishing a year ahead of schedule.
The Rystad estimate revision looks pretty reasonable.
You figure 11 million by the end of 2018? Under 10.2 to 11 in six months? Definitely possible, with the right price, but it does take some time to gear up. Ok, it’s hard to read the chart with an iPhone. Turning it sideways, it shows about 10.8 by Dec. Not as low as I think, but definitely within reason. Anyone’s guess after December, is as good as any.
I think it was about 10 at the end of 2017 so 1 Mb/d seems pretty reasonable. It might be 200 kb/d more or less than that.
That Chevron graph has a problem. It’s not consistent with their Q1 report of Permian plus GOM of 733K bpd oil equivalent. 567K of that is net liquids, they said. The graph is way diff.
I suspect the 733 kboepd number is from their entire North America business. Permian and deepwater are a big part of that, but that business also includes Canada, California (Kern River and others) and Marcellus.
Hi George.
Looks like the results from the Rabat Deep exploration well will be known any day now.
Nevermind it’s a duster.
https://www2.trustnet.com/Investments/Article.aspx?id=201804300700144781M
Dry, and poor quality rock. Another frontier play not looking so good.
Tight carbonates are not the end of the world (espiaclly if pre-fractured) and they did have some hydrocarbon indications, so the play might not be totally “dead”
They should have cored. Back in the 1980’s I worked delineating a large carbonate discovery, the cores were the key to understanding the field layout and in deciding where to start development.
2018-04-29 (Reuters) Oil reserves audit for Saudi Aramco finds proven reserves at least 270 bln bbl, slightly higher than company’s figures- industry sources
https://in.reuters.com/article/saudi-aramco-reserves/audit-finds-aramco-oil-reserves-slightly-higher-than-reported-sources-idINKBN1I00D2
Thanks Energy news,
That is surprising, my guess has been that the 260 Gb that is often reported as “proved” reserves was in fact proved plus probable reserves (2P reserves). If that report is correct, then my guess was clearly incorrect. I have read that IHS 2P estimates in 2011 were similar to BP estimates (excluding extra heavy oil in Canadian oil sands and Orinoco belt oil) for that year.
See section 3b of http://rsta.royalsocietypublishing.org/content/372/2006/20130179
That would be about 1263 Gb of 2P C+C+NGL “conventional” reserves (where unconventional is considered Canadian oil sands and Orinoco belt reserves in this case) in 2011.
So it still seems to me that OPEC and some other nations with large reserves (Russia perhaps) may be reporting 2P reserves as “proved” reserves. In reality it would be best if all reserves were reported as 2P reserves, as this is the “best guess” estimate, but alas this is not the case.
https://www.bloomberg.com/amp/gadfly/articles/2018-04-25/christmas-comes-early-for-permian-refiners
Christmas for Permian refineries.
New twist on OPEC supply cut and their (moving) target: https://www.bloomberg.com/gadfly/articles/2018-04-29/opec-ditches-its-rear-view-mirror-for-something-worse
First it was rebalancing stocks to 5y average (done), and then it was 10y average (within reach, perhaps late summer/autumn?). Now it is investment plans (no idea if they refer to $ or production capacity). The author notes that Saudi Arabia think that more investment is needed at the same time as drilling in Saudi Arabia is falling. However, he never poses the “why-questions”: Why is the target reformulated all the time so that OPEC countries have to continue with their cuts? Why is compliance rate so high (from a historical standpoint)? Why is drilling in Saudi Arabia falling when they claim that more drilling is needed?
Also from Bloomberg: https://www.bloomberg.com/news/articles/2018-04-30/oil-hedge-fund-manager-andurand-says-300-oil-not-impossible. Oil Hedge Fund Manager Says $300 Oil ‘Not Impossible’ Perhaps the price is true but I disagree with his view that triple-digit prices will have no effect on demand growth.
There is nothing surprising there from Sauds. They need the oil firmly north of $90. So does everyone else in the business to lay out huge amounts of capex.
Of course higher oil prices will affect demand, especially in the projected growth countries. It will spike, that will affect demand, and the price will decrease. I seriously doubt we will see oil in the $50 range, ever again, though.
Guym,
I agree, but I thought the same in 2013, so I am a little less confident now. I think at current price levels supply may not keep up with demand, but a few years with high prices (like 2010-2014) and we might be surprised how supply reacts, it will be interesting to watch.
Lol, I said I seriously doubt, which leaves some wiggle room. But costs to produce, are not likely to decrease.
Agreed, those will rise, I am just not sure if another glut is likely, I think not, but we will see. 🙂
An update on crude oil production in Mexico.
2018-04-30 (Platts) Mexico state oil company Pemex expects to close 2018 by producing 1.98 million b/d of crude oil, 140,000 b/d more than March’s reported production, allowing it to achieve its annual production goal of 1.951 million b/d, the company’s management said Friday during its first-quarter earnings call.
https://www.platts.com/latest-news/oil/houston/mexicos-pemex-expects-to-produce-198-million-26951535
Price predictions if we lose a couple million b/d of Iranian oil in the next few weeks?
How would they loose a couple of million? Heck, they are selling mostly to China.
EIA US crude production rises to 10,264 kb/day in February from 10,004 kb/day (revised up from 9,964 kb/day) in January
Texas 4,012
Gulf of Mexico 1,721
https://www.eia.gov/petroleum/production/#oil-tab
I projected exactly 4012 as my high for Texas, and that Texas was slightly understated for January on the last thread. The surprise is in the GOM. Rather than an expected slight decrease, it goes up about 90k barrels. Doubt that will last. Was it originally reported that high (GOM) last month?
GoM was as expected with Stampede starting and production lost from the Enchilada shut down starting to come back. There should be a bit more to come in March and April. Having said that though there are a lot of leases not reporting for February, including Stampede, so the EIA numbers include estimates, and will be revised.
After Stampede has all the pre-drilled wells online (I expect in April) it will a contest between some new in-fill wells, mostly Anadarko, and small tie backs, mostly LLOG, versus natural decline, any major planned turn arounds for later in the year, hurricane season and any further significant non-planned downtime, to see which way the production goes. This year monthly production has been down compared to last and March was the peak then.
BOEM numbers have only about a 60 kbpd rise for February to 1700, but based on the actual lease and well reports both EIA and BOEM seem to be estimating about 50 to 70 kbpd from somewhere that I can’t reconcile. The difference has been growing gradually since November, and there isn’t much missing data for Dec. or Jan. now. However number have been adjusted up to six months later for both organisations.
Wondering what this would do to prices, with concerns over Iran, not much. Brent futures chart below from
http://www.cmegroup.com/trading/energy/crude-oil/brent-crude-oil_quotes_globex.html
Brent has increased by about $16/b in the past 6 months from $57 to $73/b, maybe $89/b by Oct 30, 2018, if the trend continues.
I also noticed that the 4 week average output from the weekly output estimates for week ending March 2, 2018 matched the monthly estimate for Feb, 2018 pretty closely.
Output has increased for US C+C by 240 kb/d in the past two months, for a 1000 kb/d increase for 2018, only a 76 kb/d increase per month is needed on average over the next 10 months, less than the rate of increase in output of the past two months by 45 kb/d (if the output estimates for Dec 2017 and Feb 2018 are roughly correct). The 4 week estimate for the end of March (3/30/18) was 156 kb/d higher than the Feb 2018 monthly estimate, I doubt the 4 week average estimate is accurate, but we’ll find out in a month.
At this point, a 1000 kb/d increase in US C+C output in 2018 does not seem unreasonable, if the Feb 2018 EIA estimate for US C+C output is accurate (revisions are not uncommon).
EIA US monthly ending stocks of crude oil plus total oil products (without SPR): up +9 million barrels in February month/month
Last month was up +16 million barrels in January month/month
Without the compressed gases: ethane, propane or butane. These NGLs were down -14.4 million barrels in February month/month
Also without the SPR which was up +1.4 million barrels in February month/month
Interesting. It’s easy to get lost in US numbers, but we are producing a lot more oil this time of year than last. The world is not.
Hi Guym,
Based on IEA estimates from April 13, 2018
Global oil supply eased by 120 kb/d in March, to 97.8 mb/d, after OPEC and non-OPEC producers deepened their cuts to 2.4 mb/d. Output was nevertheless 1.4 mb/d higher than a year ago mainly due to higher US production.
https://www.iea.org/oilmarketreport/omrpublic/
From OPEC MOMR April 2018
World oil supply in March 2018 increased by 0.18 mb/d m-o-m, to average 98.15 mb/d, representing an increase of 2.15 mb/d y-o-y. Preliminary non-OPEC oil supply, including OPEC NGLs, was up by 0.38 mb/d m-o-m and rose by 2.12 mb/d y-o-y to average 66.20 mb/d.
So for March preliminary estimates suggest World oil output is up by 2.15 or 1.4 Mb/d year over year, the average of these estimate would be an increase of 1.8 Mb/d, unfortunately both the IEA and OPEC report in terms of all liquids, so it is possible that all of this increase (if the average estimate is accurate) is due to NGL, biofuels, and processing gain. I would agree that output may not have increased as much as demand, it will take a few more months before things are clear.
Using EIA C+C data for World output in Jan 2018 and comparing to one year earlier, output is up by 800 kb/d. Chart with EIA World C+C data from Jan 2015 to Jan 2018 shows a slope for linear trend of 0.99 kb/d per day or an annual rate of increase (multiply daily increase by 365) of 360 kb/d over the past two years.
Not enough to keep up with annual oil demand increase of about 1500 kb/d, we are short about 1150 kb/d if the trend of the past two years continues.
That 1150 shortage can be arrived at, also, by substituting some numbers into their estimates for 2018. 1.5 demand they are using seems less than most estimates, but not out of reason if prices stifle demand much. They have 1.3 million for US, and you appear content with 1 million. They project another .5 million from elsewhere like Canada and Brazil. Canada may get 300k per your post, and Brazil is going nowhere. So, 1.3 increase, or .5 million short to add to their .6 million shortage predicted, or 1.1 million short. I think more, because they expect 32.5 from OPEC, and it’s not going to get there with Venezuela dropping. Plus, I think 1 million is a bit optimistic from the US, but certainly within reason.
Agree 1 Mb/d might be optimistic, I would think US increase may be 800 kb/d minimum. Canada about 300 kb/d, maybe Brazil 200 kb/d would get us 1.3 Mb/d, but there will also be 800 kb/d decline from other non-OPEC, which brings the shortage to about 1 Mb/d. Oil prices will be rising if this analysis is correct.
Except you left off with all these increases they projected (1.8), they still expect a shortage of .6 million second through fourth quarter. Probably a carryover from 2017. That makes yours 1.6 to 1.8. It could be higher, it could be lower, but in any event, it’s a lot. Couple of years, among OECD members, the US could be the only kid on the block that has a commercial inventory.
More OPEC production drops:
https://oilprice.com/Energy/Energy-General/Oil-Prices-Spike-As-OPEC-Compliance-Hits-New-Record.html
Guym,
I take their demand projection only of 1.5 Mb/d, and have non-OPEC increasing by about 500 kb/d less than IEA (US 400 kb/d less and other non-OPEC 100 kb/ less than IEA estimate), add 600 IEA stock draw + 500 lower output estimate and we get 1.1 Mb/d less supply than demand, note that this is just a different way of arriving at the same estimate. You are double counting by adding the shortage expected by the IEA in last half of 2018.
Note OPEC expects about 200 kb/d from Brazil, 300 kb/d from Canada and 1.5 Mb/d from US, but 0.4 of the US increase is NGL and biofuels, only a 1.1 Mb/d increase in US C+C is expected. They also expect about a 1.65 Mb/d increase in demand, but keep in mind these “demand” estimates include demand for NGL. All very fuzzy unfortunately. Basically we don’t really know the demand for crude very well because we don’t have good numbers for World stocks.
Sorry, misread. Thought you were adding in Venezuela/Angola drop. Yeah, all we have is IEA and OPEC to look at for world supply/demand. Fuzzy is an understatement.
I actually wonder if looking at long term C+C output gives a better indication of demand, from Jan 2009 to Jan 2018 for example the C+C trend (using EIA data) is about a 1070 kb/d annual rate of increase, so 1100 kb/d might be a better guess for increase in C+C demand, if that is correct (note the IEA and OPEC estimate liquids demand which includes demand for NGL, biofuels etc as well as C+C demand) then US, Canada and Brazil at combined 1300 to 1500 kb/d combined with decreases elsewhere (China, Russia, and Mexico primarily of perhaps 200 to 400 kb/d), might keep some pressure off prices in 2018, but there may be other nations which decline, such as Venezuela and perhaps others which would need to be made up by OPEC increases. OPEC may choose to keep output restrained and let oil prices rise, that’s the wildcard in my view, can OPEC actually increase output or even maintain constant output with the decline in Venezuelan oil output.
My conclusion based on long term increase in World C+C output from 1982-2017 (about an 800 kb/d annual increase), is that oil prices may not continue the rapid rate of increase that has been seen since June of 2017 (roughly $25/b in 10 months).
If US, Canadian, and Brazilian output increases by about 1500 kb/d in 2018 (1000, 300, and 200), price increases maybe be quite slow (maybe rising another $2/b over the next year or so) and then a much slower rate of increase of oil prices until peak oil gets closer in 2023 to 2025. Maybe oil prices get to $85/b by 2022.
From 2023 to 2030 we might see oil prices increase to $200/b as supply will not be able to meet demand at lower oil prices over this period.
The path I choose in simple scenarios is a straight line increase, but the actual price path is impossible to predict.
https://oilprice.com/Latest-Energy-News/World-News/US-Federal-Renewables-Subsidies-Drop.html
A negative net subsidy for fossil fuels of 773 million.
Guym,
Big tax break with tax law changes at the end of 2017, so those tax flows to the government in 2016 (in other words there were tax law changes that increased taxes in 2016, were changed in 2017 so businesses in general are paying lower tax rates for 2017 and going forward.
I made a mistake in my last post on UK and had the wrong condensate value for Tormore. Below is corrected update through January. It looks fairly certain now that the Laggan and Tormore reserves are much less than originally planned (maybe only a third as much). Glenlivet and Edradur were brought on earlier than planned to fill the gap, but they are (or were) smaller fields – maybe they are doing better than planned. It’s maybe a question whether something will be found to fill the gap and keep the gas plant running before they run out of gas in a few years, I think the recent West of Shetland discovery by BP would be most likely.
UK natural gas supply is not looking in great shape. The Cygnus field also looks to be running between the low and median estimates for recovery and the Rough cushion gas is being blown down quickly.
UK’s largest LNG import terminal is devoted to Qatar gas. It’s South Hook Terminal in south Wales. Largest LNG import terminal in Europe. 25% of UK gas reqmts comes from there. Far enough away from Russia to justify paying the premium over GAZPROM pipeline.
Also explains why the UK was mute about the KSA / Qatar argument last year.
According to ClipperData Europe is buying mostly Midland WTI and Eagle Ford crude oil from the USA.
2018-05-01 (ClipperData) Europe imported record US crude exports in April. And the transatlantic arb is still wide open.
Chart: https://pbs.twimg.com/media/DcGkLHeXcAEMA6u.jpg
ClipperData on Twitter: https://twitter.com/ClipperData
3 potential ports for supertanker exports: LOOP, Corpus Christi and Texas City
2017-10-26 (Reuters) – Enterprise Products Partners LP said on Thursday it is testing crude supertanker capabilities at its Texas City dock in a move that could make it the second major company in the United States that can handle such vessels.
https://www.reuters.com/article/us-usa-oil-enterprise-prodt-exports/enterprise-products-tests-supertanker-capability-for-crude-exports-idUSKBN1HX3LD
Maybe vessels ride higher in the water when they get filled with light condensates. And I wonder if they are properly stabilized.
Yes it surprised me how close to the bottom of the channel the ships are, so maybe a lighter cargo could make a difference?
Port of Corpus Christi Caller-Times – dredging diagram https://pbs.twimg.com/media/DcHvzvBXkAA3eN1.jpg
I’m not sure how useful these are as they’re only a limited number of countries but it’s nice to check the official releases occasionally
World oil production February, (The title is in release date order)
https://pbs.twimg.com/media/DcGrRjwW4AA1lTx.jpg
World oil production March (Without the USA and others)
https://pbs.twimg.com/media/DcGs9McXkAA1HaK.jpg
Nice Bloomberg chart of US production, weekly vs monthly
https://pbs.twimg.com/media/DcGw0BiW0AAQBEB.jpg
How is “oil” defined for those “World charts”, is NGL and unconventional from OPEC included, for Norway and UK is NGL included?
They’re all C+C apart from Petrobras, Petrobras only seem to post C+C+NGLs data on their website
http://www.investidorpetrobras.com.br/en/operational-highlights/production-and-marketing
OPEC is the secondary sources without the unconventional, so any added condensate production hasn’t been included
OPEC condensates chart (MEES) https://pbs.twimg.com/media/DbeCqFEWsAU_Vw-.jpg
Canada, Alberta AER, crude oil closing stocks at 70.5 million barrels in March, up +3.6 month/month
https://pbs.twimg.com/media/DcMN351WAAAwgUo.jpg
Canada, Alberta AER, Total Crude Oil and Equivalent Production at 3.46 million barrels per day in March, up +0.28 on last years average (2017 average 3.18 m b/day)
https://pbs.twimg.com/media/DcMOG9CW4AEQ0Um.jpg
2018-05-02 (Bloomberg) Suncor Energy Inc. is barreling ahead on the ramp-ups of the Fort Hills and Hebron oil megaprojects as its refining operations protect it from the pipeline shortages and lower prices that are slamming competitors.
Canada’s largest oil producer by market value said Tuesday that Fort Hills, an oil-sands mine in Alberta, and Hebron, an offshore development along the nation’s Atlantic coast, are both ahead of schedule.
Fort Hills has a targeted capacity of 194,000 barrels a day, and Hebron is expected to produce as much as 150,000 barrels a day
https://www.bloomberg.com/news/articles/2018-05-02/suncor-ramping-up-megaprojects-as-refining-unit-protects-prices
2018-05-02 (Platts) A trader for a Mediterranean refiner that is an active buyer of Iranian crude said his company is already looking to buy Iranian oil for the next few months but if the US imposes more banking restrictions then it will have to find alternatives.
From 2011-2015 when the EU and US had levied sanctions on the transportation and purchase of Iranian crude, Iran saw its exports fall by almost 1 million b/d.
https://www.platts.com/latest-news/oil/london/analysis-european-refiners-tread-carefully-as-27969524
2018-05-01 (Bloomberg ) Iran’s crude exports were a record 2.61 million b/d in April (Total with condensates 2.87 million b/d) Shana
Oil producers,
Have the steel tariffs increased the cost of steel pipe?
Difficult to find this info on the web. Found this article:
https://www.marketwatch.com/story/heres-what-happened-the-last-time-the-us-imposed-tariffs-on-steel-2018-03-08
Seems to me that oil producers would think that steel tariffs are a bad idea because steel casing prices are likely to rise, if the tariffs are imposed.
Haven’t noticed yet. I think they all agree bad idea.
On another note, shale earnings are improving, but hedges below current market prices are not helping. Whiting is a good example, if interested take a look at 10Q. Pure play shale, almost all in Bakken. Taking a beating on hedges.
Hedging is not an easy thing to do.
Thanks shallow sand,
Hopefully Trump will exempt most of our allies permanently (EU, Canada, and Mexico).
Have oil prices made drilling new wells favorable in your area?
Not sure how much casing you purchase, is casing used in the course of downhole maintenance? I really have no clue, or is it mostly used only when drilling a new well?
Hedging seems really difficult because oil prices are difficult to predict, as I demonstrate with my poor predictions of oil prices. 🙂
I still think WTI at $80/b or more is needed for an average Bakken/Three Forks well to pay out.
First quarter results of Continental Resources and Whiting show that
oil production is down by several percent from the fourth quarter of 2017 by several percent. Since they are some of the biggest players, is it reasonable to
conclude that the “Red Queen” is about to flip off her treadmill in the Bakken?
Financier,
There is often a slowdown in the rate of well completion during the winter months in North Dakota. This past winter was particularly severe, so perhaps the effect was bigger than usual. The fall and rise in output in the ND Bakken has so far been a function of the rate of well completion.
If oil prices continue to rise, we may see the well completion rate increase in the spring and summer in North Dakota.
Hi Dennis,
Although the weather may have been a factor, please note
that CLR’s Q1 Bakken production has been up an average of 4% over the previous quarter since 2014. The drop last quarter is strange because average oil prices are up almost 50% year over year and up 13.5% from the previous quarter. One would think that management would have been “pulling the stops out” on well completions.
Financier,
Perhaps they are running out of decent locations in the sweet spots and it is no longer profitable to complete wells even with higher oil prices. I don’t follow the individual companies very closely and tend to focus on the entire “play”, in this case the entire North Dakota Bakken/Three Forks. Also it takes some time to react to an increase in prices, usually drilling decisions made today take 4 to 6 months to result in increased production.
Prices increased quite a bit over the past 6 to 10 months, increased output may be seen this spring or summer.
Permian production increased in 2014 even with a pipeline capacity shortage. And so I have no idea what’s going to happen this time?
WTI Midland-Cushing spread widens to $10 a barrel for the first time since mid-2104
Bloomberg chart https://pbs.twimg.com/media/DcQhHpRX0AEv13w.jpg
I believe it will still increase, it just won’t increase as much as without the constraints. Larger companies with alternatives outside of the Permian will opt to complete in other areas without the huge discount. Unless, prices rise to the point that discounts don’t matter. Then the only limitation is train and trucks, and how many rowboats they can fill up going down the Rio Grande. China has expressed a lot of interest in transporting to the coast, so maybe we will see Rickshaws running down the highway. I have no idea what that is. In the meantime, they can turn off the street lights in Midland/Odessa, because flaring will provide more than enough. Texas RRC doesn’t appear to give a damn.
WTI Midland-Cushing spread updated
2018-05-03 (Enno Peters) Eagle Ford – update through January 2018
https://shaleprofile.com/index.php/2018/05/03/eagle-ford-update-through-january-2018/
https://twitter.com/ShaleProfile
Dennis,
How long are you going to let this go on? Is this the type of blog you want? Please do your job. That’s why you get paid the big bucks for administration!
Hi John,
Not sure what you are referring to. I can be reached at peakoilbarrel@gmail.com
Read a blurb on SA that CLR drill and complete costs in Woodford oil window in OK dropped from $12.7 million to $11.7 million.
Isn’t that rather a lot more than the $8.7 million number floating around.
Watcher,
Well cost varies depending on depth, lateral length, fracking stages, pounds of sand used, labor costs, rig cost, and probably many other factors. The 8 to 9 million figure is a ballpark average for the US LTO sector.
More information in report linked below
https://www.eia.gov/analysis/studies/drilling/
In 2014 the average Permian well cost was about 8.6 million, including land cost.
Land costs have no doubt increased as the play has developed further and as development ramps up further, other costs are also likely to increase.
Eagle Ford sweet spot (higher land cost) well cost about $8.7 million in 2014 (includes $1.2 million land cost).
Bakken wells are more expensive at $10.3 million per well due to higher land cost of 2.5 million (2014 costs).
New posts are up.
http://peakoilbarrel.com/
Thanks George K.
I think you hit homerun with the predictions. I didn’t have a chance to look at it before now. The next question is what is on the horizon after quite a few years. The Lofoten area is a very promising prospect for oil and gas according to geologists. We could recon another 2-3 billion barrels in recoverable oil, or another Johan Sverdrup field in total. But the opposition in parlament to allow this area to be explored is severe, because this is both a tourist destination and a prestine fish resource area. An oil leakage would be devastating. Still, subsurface installation and production ships should keep the risk low. With high oil prices the public opinion would probably change. In the mean time, more exploration licences are becoming available in the Norwegian sea and the Barents sea. Who knows what that will bring about? The areas are less promising than the Lofoton area unfortunately, as hopes were high for the Barents sea especially. The alignment with the US and UK is very clear both in energy matters and defence policy for Norway : “Make more areas available for gas and oil exploration, while stay united as as a defensive block” (Norway obide very clearly in military defence matters to whatever the US/UK want).
The two electric power cables across the North Sea to UK are proceeding according to plan, to complement the one to Germany opened this year. Already two smaller capacity cables are connected to Denmark. These efforts are important to counterbalance the unpredictable nature of renewable energy. Not especially popular in Norway due to higher electric bill, but I think the relative strength of Norway when it comes to energy should be utilised in a broader perspective. (we need to import a lot, then we also need to export a lot).
So thinking very long term with all the risks accosiated with it, Norway will probably keep oil production above 1 million b/d for a long time due to unexplored areas outside North Sea. An after a while be very much electrified due to both hydro and wind power. And the question becomes how much electricity is best used in households as opposed to industry (now it is 60/40 almost). And some electricity should most likley be exported, we are prob the most electricity wasting nation in the world.