A Post by Ovi at peakoilbarrel.
Below are a number of oil (C + C ) production charts for Non-OPEC countries created from data provided by the EIA’s International Energy Statistics and updated to September 2019. Information from other sources such as the IEA and OPEC is used to provide a short term outlook for future output and direction.
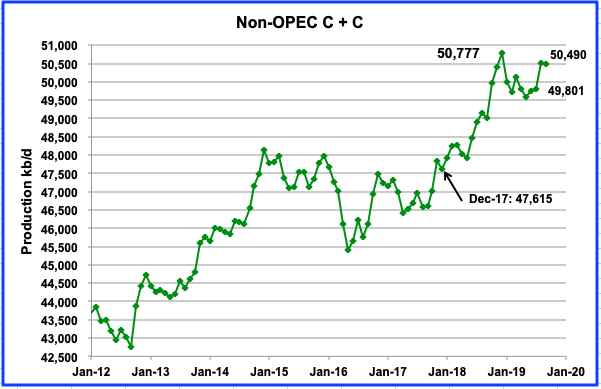
Non-OPEC production decreased by 22 kb/d from 50,512 kb/d in August to 50,490 kb/d in September. This is another output reduction month in 2019. In 2019 there have been 5 months of decline and 4 months of increases. For comparison purposes, in 2018, there were 9 monthly increases and 3 decreases. This is just another indicator of the increasing difficulty Non-OPEC countries will have boosting output going forward, now that US production growth has started to slow.
September production is just 287 kb/d short of the previous high of 50,777 kb/d reached in December 2018. Will new output from Norway and Brazil, along with small but increasing US output coming in the next few months raise Non-OPEC output beyond the previous December 2018 high?
Above are listed the world’s 14th largest Non-OPEC producers. They produced 87% of the Non-OPEC output in September. What stands out in this table is the overall output drop of 22 kb/d due to drops from Russia, Canada, Kazakhstan along with unexpected drops in Brazil and Norway. Offsetting these losses, were gains from the UK and the US.
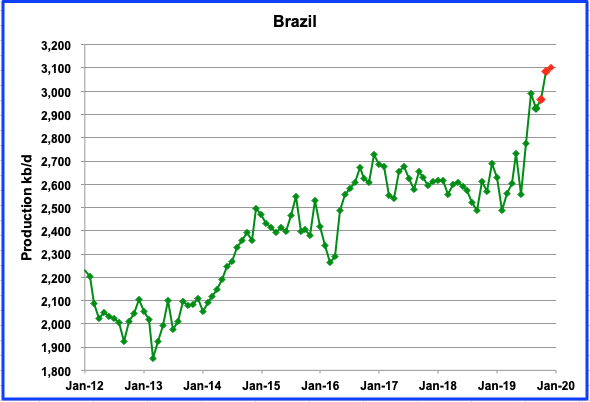
Brazil had an unexpected output drop of 62 kb/d in September to 2,927 kb/d from 2,989 kb/d in August after reporting a significant output increase of 214 kb/d last month from its deep pre-salt layer. The red dot showing December production at 3,100 kb/d was reported in January here. In early November, Brazil held an auction for foreign and domestic oil companies to bid on four offshore blocks encompassing the pre-salt layer. Unfortunately the consensus was that the auction was a bust according to this source because analysts felt that a high signing bonus scared away bidders.
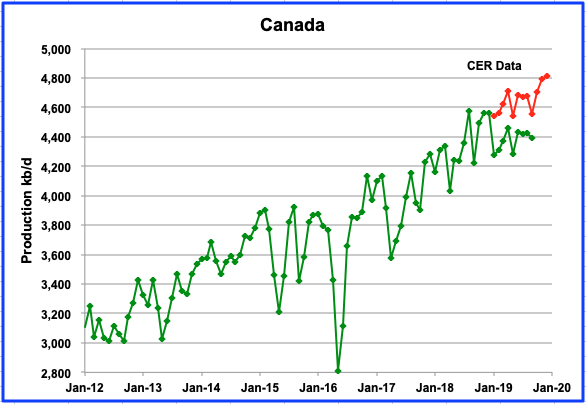
According to the EIA, Canada experienced a small output drop of 34 kb/d in September. However this is a much lower drop than the 121 kb/d reported by the Canada Energy Regulator (CER). Output from Alberta continues to be limited by the curtailment rules imposed by the government. In September, rail shipments of crude to the US dropped to 270,070 b/d from 319,594 b/d in August.
According to Bloomberg: “Canadian heavy crude’s discount to U.S. benchmark oil hit the widest since Alberta introduced a plan to limit the province’s production more than a year ago, threatening more adversity for the beleaguered industry.
Western Canadian Select’s discount to West Texas Intermediate reached $24.05 a barrel on Friday (January 10, 2020), the biggest gap since Nov. 30, 2018, the last trading day before Alberta announced that it would order producers to cut about 8.7% of the province’s daily production to help clear a glut of crude that had hammered prices.
The widening differentials suggest that Canadian oil is at high risk of a “blowout,” Credit Suisse analyst Manav Gupta said in a report this week. If the differential widens beyond $25 a barrel, the “Alberta government might be forced to step back in and raise the volumes on mandated cuts to control bloating inventory situation,” he said.”
On a different note, Dennis and I compared information from the EIA and the CER and have concluded that the EIA reduces the reported condensate numbers from the CER by a certain percentage. For most of the latest months, the gap has been close to 256 kb/d, except for September.
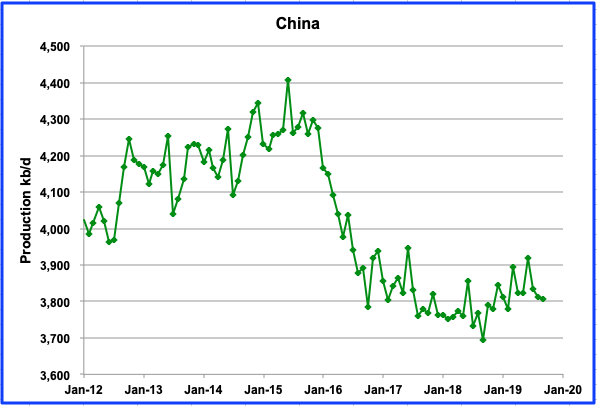
China’s production was essentially flat in September at 3,806 kb/d. It is expected to maintain this level of production into 2020 and no significant growth is expected.
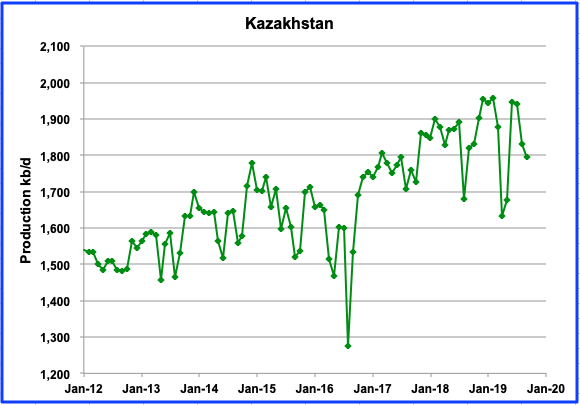
Kazakhstan output declined by 34 kb/d in September due to field maintenance. It is expected that their production will rebound to the 1,900 kb/d level in October according to the IEA.
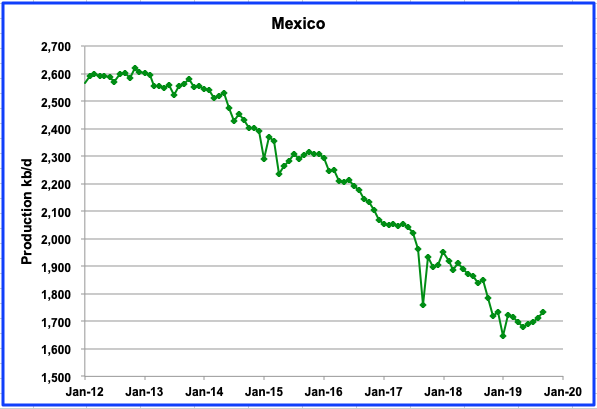
Mexican output has shown a small increase for each of the last four months. Output has increased from a low of 1,647 kb/d in January to 1,733 kb/d in September.
According to the IEA, ” Since the start of the year, annual declines have eased from a peak of nearly 330 kb/d in January to 90 kb/d in September. The biggest improvement has come from the shallow water Xanab field that saw its production fall precipitously last year. Since hitting a low of 26 kb/d in May, 110 kb/ d below a year earlier, production from Xanab recovered to 58 kb/d by September. Steady increases have also come from Ek-Balam, Onel and the heavy Ayatsil field, which rose by a combined 32 kb/d since January. Pemex drilled 146 wells between January and August 2019; an increase of 28% compared with the same period a year earlier and the highest level since 2015.”
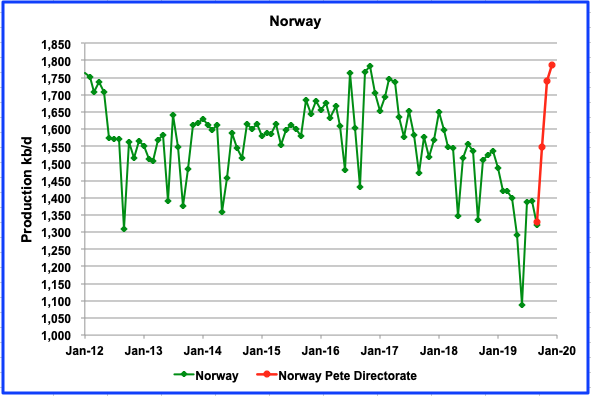
Norway’s C + C output for September was down by 71 kb/d due maintenance. However this is going to change in October when the Johan Sverdrup field output is first reported by the EIA. In December the JS field was producing at a rate of 350 kb/d according to Reuters.
Oil production data for Norway is published monthly by the Norwegian Petroleum Directorate, which reported output of 1,786 kb/d in December, has been added to the chart and is shown in red.
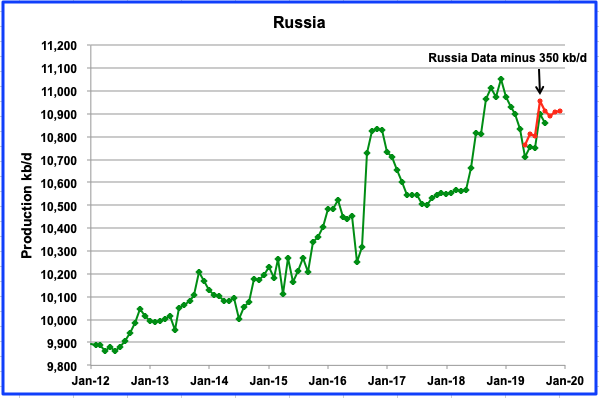
Russian production decreased by 40 kb/d from August to September to 10,860 kb/d according to the EIA. Also shown in red is a modified version of the oil output as reported by the Russian Ministry of Energy. The Russian oil output information is reported in tonnes/month. It was first converted to tonnes/day and then to barrels/day using the factor 7.33. The Russian data is higher than the EIA data because it includes condensate from NGPLs.
A comparison of the data provided by the EIA and Russia over the last two years showed a consistent difference of between 403 kb/d to 404 kb/d. Sounds like an arbitrary number by the EIA. The Russia data shown is Russia data minus 350 kb/d to better show how the EIA data tracks the Russian data by a constant number of kb/d. If the Russian data is not revised, it means Russian production will drop by 24 kb/d in the next EIA report and will add 22 kb/d by December, but will still be 42 kb/d lower than August.
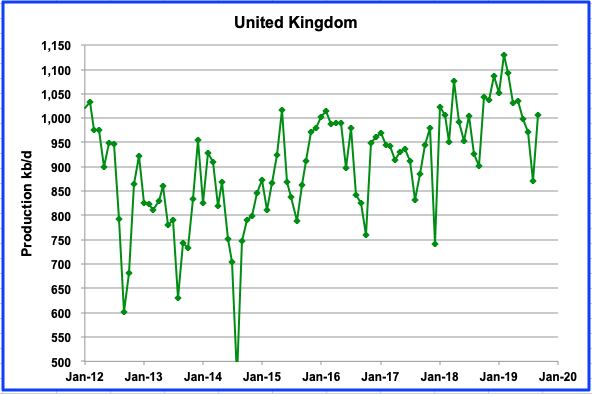
While the UK output chart shows a rebound in production of 137 kb/d to 1,007 kb/d in September, it is a major revision from the August chart. The 1,007 kb/d September output shown is actually 37 kb/d lower than what was reported in August at 1044 kb/d. The dip to 870 kb/d was originally reported to be 1,044 kb/d.
Equinor’s Mariner project started in August and will add close to 55 kb/d when it reaches its plateau next year and could rise temporarily to 70,000 kb/d at peak production.
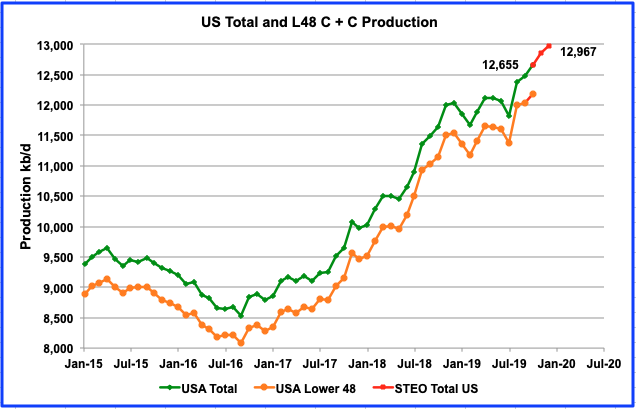
U.S. oil output continued to increase in October 2019. Production reached a new high of 12,655 kb/d, an increase 171 kb/d over September and 55 kb/d higher than estimated by the December Monthly Energy Review (MER). The red points are projected output from the January 2020 Short Term Energy Outlook (STEO)
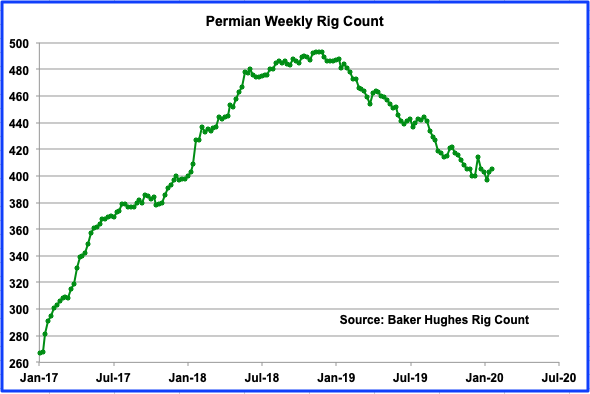
This chart shows the number of rigs operating in the Permian and is updated to Jan 24, 2020. The Permian is the basin that has been adding the most to monthly output growth in the US. From January 2019 to November 2019, oil production grew every month and over that period added 731 kb/d. In addition, from September to November, it added 100 kb/d each month, according to the EIA LTO report. In the meantime, the number of rigs in the Permian peaked in November 2018 at 493 and dropped steadily thereafter with no decrease in output. The question many are asking is “When will the declining rig count show up in declining Permian output?”
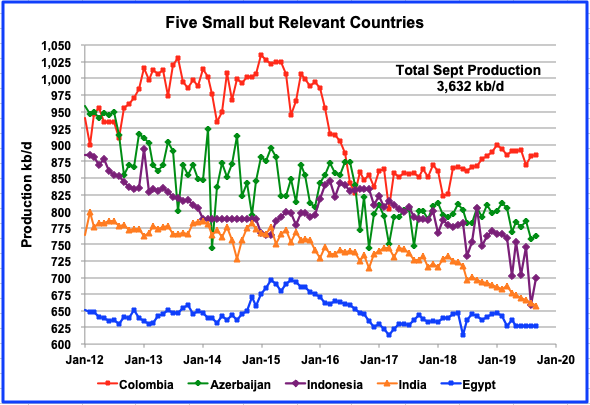
These five countries complete the list of Non-OPEC countries with annual production between 500 kb/d and 1000 kb/d. All five are in overall decline. Their combined September production is 3,632 kb/d, up by 32 kb/d from August but down 185 kb/d from September 2018. However, Columbia started to increase its production in July 2018 but that has slowed now due to riots. In August, Indonesia’s output dropped by 87 kb/d but recovered by 41 kb/d in September to 700 kb/d.
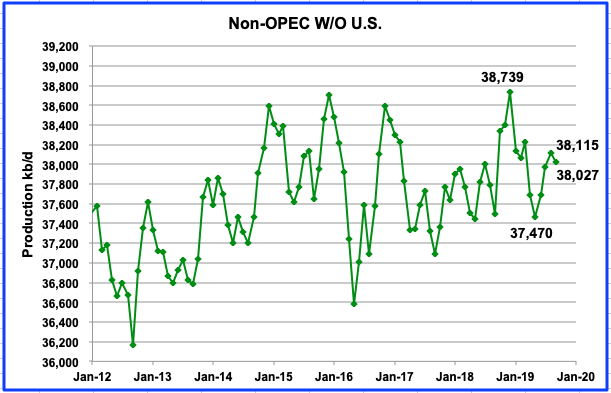
This chart shows Non-OPEC production without the US and is one of the more critical charts that bears watching in the future. It is providing an early indication that Non-OPEC oil producing countries, excluding the US, could currently be on a plateau. The current September gap of 712 kb/d with December 2018 increased by 88 kb/d since the August report.
This year will be critical since Brazil and Norway have brought new fields online with new production capacity. From the charts above, Norway will add 450 kb/d and Brazil will add close to 175 kb/d by year end, provided the EIA reports output levels as shown in the charts. Adding the additional combined production of 625 kb/d from Norway and Brazil to the 38,027 kb/d in September results in an output increase to 38,652 by year end. This would put the 2019 peak close to the December 2018 peak of 38,739 kb/d. Of course, this estimate excludes the decline that never sleeps and is discussed below.
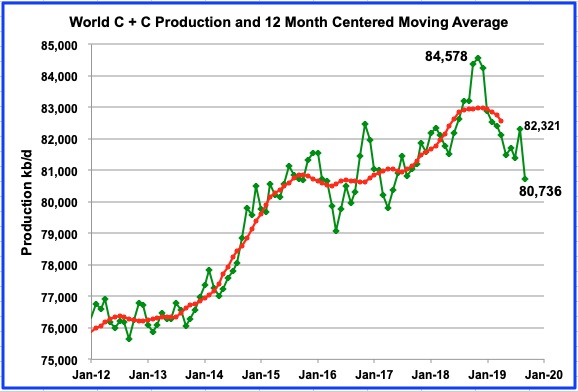
World oil production fell by 1,585 kb/d to 80,736 kb/d in September 2019. Of the 1,585 kb/d drop, 1,350 kb/d was due to the attacks on the Saudi Arabia Abqaiq processing plant, one of the world’s most important oil production facilities. The Khurais processing facilities were also attacked. According to OPEC, Saudi Arabia quickly restored 1,200 kb/d by October to return to a more normal level of 10,001 kb/d. However, November production declined by 150 kb/d.
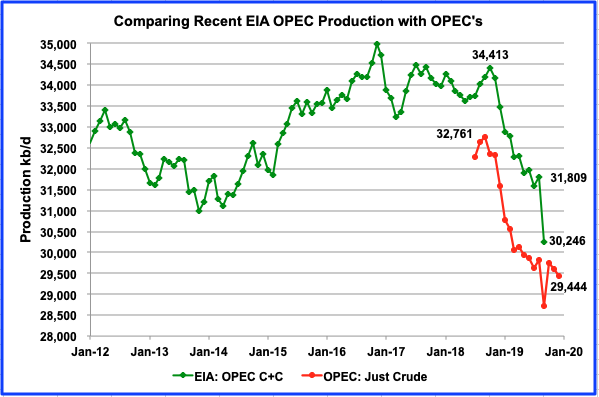
This is a comparison of the EIA’s estimate of OPEC’s C+C production vs OPEC’s crude output. The EIA’s estimate is roughly 2,000 kb/d higher, due to the inclusion of condensate. OPEC’s big production drop in September as shown in the OPEC graph is 1,093 kb/d. However, the EIA shows a drop of 1,563 kb/d. Will OPEC’s output ever get back to 34,413 kb/d of October 2018 or the previous high at 34,976 kb/d of November 2016? Something that should keep us guessing for a while.
Decline rates in Non-OPEC Countries
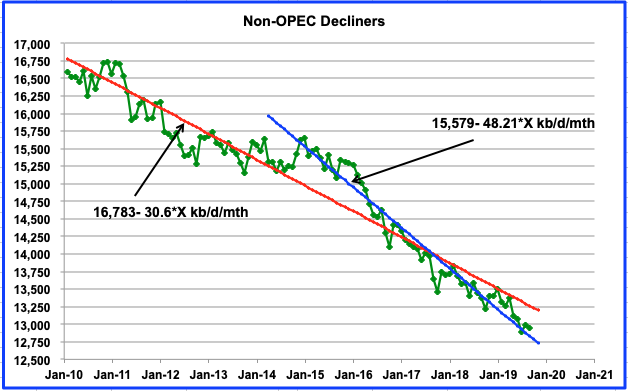
In the previous Non-OPEC post, this chart was presented to provide viewers with information on production decline rates in Non-OPEC oil fields. The press occasionally announces new oil field discoveries that will come online in a few years and by its nature appears to imply that it will add to the current production rate. Rarely is there mention of the decline rate that is constantly working 24/7 lowering the production in all fields.
In the discussion portion of the last post, Dennis suggested that terminal decline in oil fields is better modelled by an exponential function and provided a chart similar to the one below.
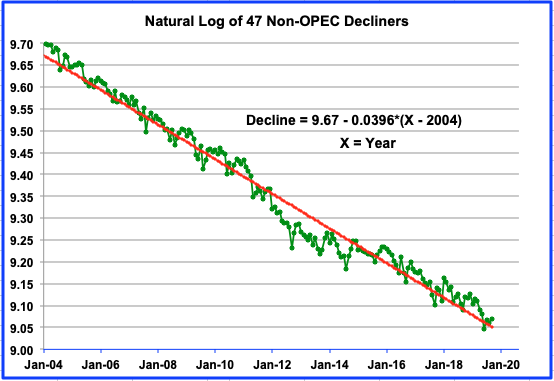
This chart shows the natural log of the total C +C production from 47 Non-OPEC countries that are experiencing declining production. The criteria for country selection was that the output in September 2019 had to be less than January 2004. A best fit linear model (red) of the data is shown and has a slope of -0.0396, which translates into an annual percentage decline rate of 3.96%. This is different than the constant monthly decline rate shown in the previous chart. Using the current output of close to 8,700 kb/d and a 4% decline rate, implies that the current decline in these fields is 348 kb/d/yr. Keep in mind that this rate will be lower next year by 4%.
In the previous post, it was noted that some analyses differentiate between natural decline (which purely reflects physical factors) from managed decline rates, which include the impact of reinvestment. The IEA estimates that the difference between natural and managed decline rates is between 2% and 3%, and has been rising over time. Based on the distinction between decline rates, the 4% estimated above would be classified as “managed decline”and accordingly, the natural decline rate of these Non-OPEC countries estimated above is closer to 6%. This higher rate would then increase the estimated decline rate above to 522 kb/d/yr.
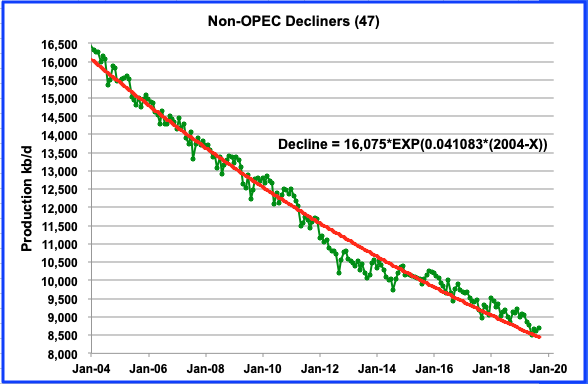
This chart shows the decline rate in the real world, rather than in the natural log world. When the best fit analysis was done using the real world data, the percentage decline rate increased slightly to 4.11%, essentially still 4%.
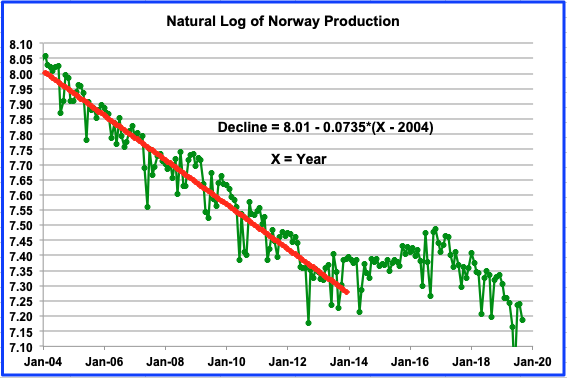
To conclude the decline discussion, the decline chart for Norway is shown above. Norway is of interest since all of its fields are in deep water in the North Sea and should show the difference in decline rates between land based and sea based oil fields. Its average annual decline rate from January 2004 to October 2013 was 7.35% and close to the 7.1% reported in the previous post using a different method. This is significantly higher than the average decline noted above for Non-OPEC countries. Also note how the decline has reappeared in late 2016 and appears to be slightly higher than the 2004 to 2013 trend.
Mystery Chart
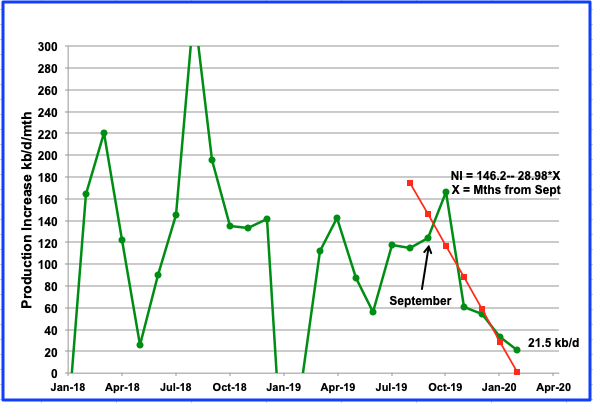
I am sure many of you will recognize this chart that will be discussed further in the early February post on US oil production.
155 responses to “Non-OPEC Production Growth is Struggling”
Mystery chart EIA DPR monthly production changes
Tony
I knew you would be the first. It’s still heading for zero but about a month or two later than I thought. Do you think there is a chance it could turn around before hitting zero. I can see it bouncing back after going through zero.
Ovi,
Monthly production change could go up and down around zero for next few months.
We’ll know more when US shale oil companies release their Dec 2019 quarterlies over next few weeks.
Ovi,
Any particular reason why the Sept to Feb data (with Dec to Feb based on a model, rather than being actual data) should provide special insight? One could easily go back to earlier DPR reports and see how reliable a predictor the trend on the most recent 6 months of data has proved. I would suggest there might have been many poor predictions using such a method. I will leave it to you to check.
Dennis
I recall that you presented data in earlier posts where you compared past and present DPR numbers and the comparisons didn’t look good. At the same time the data was very volatile over that period. However when looking at the November DPR, it appeared that the volatility in the net monthly increase had disappeared sometime between September and October of 2019. I came to the conclusion that something had changed, either their methodology or their information and that is when the first linear fit using four months of data was made. So far the downward trend in net monthly increases has persisted.
The November 2019 DPR predicted that the net monthly increase for December would be 48.2 kb/d. The current January DPR is indicating that December will come in at 54.6 kb/d. That is not a very big time span to look at but I think it is the most relevant at this time since the trend continues very smoothly down.
This still leaves the question unanswered as to why the DPR predictions are getting better. I have a theory which I will present in the US update around February 1 and which we can discuss further then.
Ovi,
We will see how good the predictions are in the future.
I am a bit more skeptical that there has been any improvement in DPR estimates. It will be interesting to here what changed.
Using all the updates to January 2020.
US production has increased by 500 kb/d since September 2019. Norway has increased production by 350 kb/d and Guyana has started production with 100 kb/d. Close to a million barrel per day increase in just 4 months.
You can see how people have been warning of a short term oversupply in the first half of 2020.
Wayne
There have been a few articles indicating that Saudi Arabia will cut an additional 500 kb/d to keep supplies in check. Not quite sure how this new corona virus will reduce demand. Both WTI and Brent have dropped close to 7% in anticipation of reduced world demand.
https://www.reuters.com/article/us-oil-opec/saudi-delivers-deeper-cuts-as-opec-oil-producers-back-new-pact-idUSKBN1YA0VU
I estimate that US production increase since September is closer to 375 kb/d looking at all sources and I think it is lower since the STEO is too optimistic. Here are the US updates that I have for oil output increments from September to December.
Weekly: 375 kb/d
STEO 487 kb/d
DPR 281 kb/d
LTO 340 kb/d
Average 383 kb/d
Thanks Ovi
That is a very deep cut for Saudi Arabia on top of existing cuts, but they will need to in order to stop prices falling into the 40s.
The virus would have to spread a lot to reduce oil consumption. But that could very well happen in the next few weeks.
Wayne,
Nothing can be judged by weekly EIA data, US output is about 270 kb/d higher in Dec 2019 compared to Sept 2019.
Dennis
Is your estimate based on your model or is it a variation on the LTO estimate above?
Ovi,
Just tight oil growth trend from Feb to Nov (about 90 kb/d increase per month) and assumed Oct, Nov, and Dec continue at about 90 kb/d each month for an increase of 3*90=270 kb/d from Sept 30 to Dec 31, 2019, I assume here that on average all US C+C increase comes from the tight oil increase in output.
Just a rough guess really.
From Twitter frac spread up again
The Primary Vision Frac Spread Count is 300 for the week ending January 24th, 2020.
@PrimaryVision
Thanks Tony,
Surprising given the news of OFS company cuts of 50%.
Refreshed budgets but you have to remember a very steep run off in the last few weeks of december – we are now back to mid december levels.
Some interesting stuff being posted by Jonny Cage re frac spreads and assuming no increase from this level will lead to in the next wee while.
Cant imagine many shale companies are making money at these levels, you would expect now might be the time to temper any production growth at all. You can lead a horse to water and all …..
Libya is starting to look grim.
https://twitter.com/NOC_Libya/status/1221025178114764800?s=20
Market completely disregarding the ~1mmbls a day of production offline – doesnt look like they have much capacity left at the ports to store any oil either ….
https://twitter.com/search?q=%23noc&src=typd&lang=en
Of this 50.4 Mbpd non-Opec production, how much is available for export?
Who among these producers are net exporters?
Hickory
To answer your question, we need Jeff Brown on this board. He developed the Export Land Model which looked at the amount of oil a country produced and how much it consumed. Attached is an old chart from Wikipedia that shows some examples from 2007.
The last articles/interviews that I found are here.
https://www.resilience.org/resilience-author/jeffrey-j-brown/
Looking at the top 14 countries in the table at the top, I think that the following are exporting countries, U.S., Russia, Canada, Brazil, Kazakstan, Mexico, Norway, UK, Azerbaijan. That is my best guess that these are exporting countries but I don’t know their internal consumption.
As you may be aware, the US is exporting oil and importing at the same time. For instance last week the US imported 6,432 kb/d of crude and exported 3,414 kb/d. It also exported 5,372 kb/d of NGPLs and imported 2,370. So for the week, the US imported 8,801 kb/d of oil and exported 8,786 kb/d kb/d, almost in balance.
For the US if we ignore hydrocarbon gas liquids (ethane, propane, and butane and the various isomers) the US is a net importer of crude plus petroleum products in Oct 2019.
Much of the net exports of World crude oil comes from OPEC (exporting is in the name).
Hickory,
Use https://www.eia.gov/international/data/world
to answer your question.
One thing is clear- it is very hard to come up with accurate up to date ‘NET export by country’ data.
Non-Opec countries who export more than 500 k bpd as of early last decade (2012-2014)
include Russia, Norway, Kazakh, Mex, Canada, Columbia, and Brazil, in descending order.
I suspect this list has changed a bit in the last 6-8 years.
Another thing is clear-
the region of East and South Asia has become a huge net importer
the region of Europe (ex Russia) is a big net importer
-the countries of Central and South America have recently become net importers
Hickory,
Yes the EIA data only goes through 2016 and the exports do not balance the imports for C+C, which is odd, seems this is not kept track of very well.
A frequent seeking alpha contributor, Johnny Cage has put together a production projection based on frac spread counts and compared to EIA STO. There is a big difference!
https://twitter.com/realjohnny_cage/status/1218351310631817216?s=21
I agree with the direction he shows, we will see.
delonghorn
That is a pretty drastic change that he is showing. You say that you agree with him. Does he give an explanation of what his model is that relates frac spreads with production that you could provide to us.
Hi Ovi. Yes Mr. Cage’s chart shows a very large change from the EIA STO. It is over a million bpd by April, 2020. His model is based on the decline in frack spreads, and the base model assumes a continuation of 289 spreads, which was the Primary Focus number for 1/17/2020. A chart down the thread shows his estimate with other assumptions for continuing spreads.
Frack spreads were generally around 450 from spring of 2018 to July 2019. In 2018 US production grew almost 100,000 bpd each month, although it slowed some in 2019 due to the increasing base decline. In July, 2019 spreads began to fall rapidly, down to 370 by September, and 290 by the end of the year.
Mr. Cage has stated he believes that it takes around 380 spreads to compensate for current decline. That’s zero growth or fall. Mr. Cage appears to base his model on a two month lag from frack to production. I think it generally takes longer, so I don’t expect the divergence to be quite that rapid.
After a well is fracked, there are number of things that happen before you get much oil or gas. First, any other wells on the same pad are usually fracked, sometimes they also wait on neighboring wells. The well site has to be cleared, and production facilities, installed. A gas line may have to be laid and tied in. These are some pretty big and expensive projects, and producers are trying to save money. They balance time vs money on many decisions they make during the process.
During periods of falling oil field activity such as now, It gets a little easier to find a piece of equipment or a crew, so the pace at which things get done speed up some. This tends to keep production a little higher for a while during a slow down.
Finally when they are ready to go, they open the well up and produce lots of frack fluids. There is not a lot of oil or gas until the big part of the frack flows back, and different operators have their own procedures. It can take up to a couple of months flow back before the well comes in strong.
So, based on frack spread info, I think Mr. Cage’s has done a wonderful job projecting the effect of the fall in frack spreads.
I do think the production drop will likely be a little slower to develop, but I think we will get there, the drop is already “baked in the cake”, based on the sub 350 frack spread count from November 2019 to date.
One more thing. The EIA STO is awfully high to begin with.
Great comment dclonghorn – why the mainstream media fixates on the rig count and note how much oil a rig produces (it doesn’t produce any after all). I think if we see frac spreads stabilise at around 300 the decline in oil production will start to decline very quickly and start showing up in the next few months.
The decline in POO aint going to be doing any shale producers any favours ….
Thanks Jack. The projections Mr. Cage made were very informative, thanks to him there is a good model.
Thanks DC for the excellent explanation how things actually work . Even a layman like me can get a clear picture .Tks .
Not clear the frac spread count will be related to completion rate as Mr. Cage assumes, also frac spread count is back up to 300, let’s assime for a moment that Mr Cage’s assumptions are realistic and output falls as his model projects.
What might happen to oil prices in that scenario?
If oil prices increase due to lower supply as is typically the case, what happens to tight oil producer profits?
If profits increase, what happens to demand for frac spreads?
If the frac spread increases, the assumption of the original model is violated and it no longer applies.
US tight oil estimate from
https://www.eia.gov/energyexplained/oil-and-petroleum-products/data/US-tight-oil-production.xlsx
delonghorn
Thanks for the detailed explanation. As usual, answers lead to more questions. Is there a definition of when is a well “Completed”. Is it when the fracking is done? Is it when the first oil comes out? Is it when the wells are tied into the delivery system?
Ovi,
A well has been completed when oil starts flowing.
Hubbard’s simplistic equation created a bell shaped curve. What was not taken into consideration is the extra oil that seeps out of the pores over time. To explain this, I think of a wrung out wet towel that is draped over a shower curtain rod in the bathroom. There is nothing dripping from the lower end right away but come back in a bit and there are drops along the bottom hem and the floor underneath is wet. If the towel is squeezed, additional water can be wrung out. If we do any equations on deletion, it seems like this phenomena has to be addressed. An exponential equation or a Hubbard type formula with an additional exponential factor, may be needed to slow the depletion given by the original equation. Over many oil wells, this may have the effect of adding several new wells.
I think I’m trying to describe the effects that cause the elongated tail on the bell shape curve.
Do tell. Squeezing the towel makes the water go out faster. Not sure how this is supposed to elongate the tail. By my tally, the tail should get shorter.
Sounds like a tall tale about a long tail. Please advise.
“Hubbard” is a squash, you twit.
“the towel is squeezed, additional water can be wrung out.”
possible a good layman’s term for all the EOR that oil companies currently use, hence the often touted steep decline posited by many – a cliff edge drop.
no fat tail as such but you could see it on some oil fields but the actual production would be quite low I would posit. The elongated tail would cease obviously when either the well is not profitable or legislation is enacted.
Forbin
When you wring the towel out the **first time**, I was thinking that this could represent the “oil” that you would find under the Hubbard curve. Letting the towel sit would cause additional “oil” to seep out much like you would see with a towel over a shower rod. Eventually, there would be less and less “additional oil” and thus a diminishing tail.
It’s more of an analogy than anything scientific.
With some of the old fields, don’t the operators will let a well sit and not pump anything for awhile tending to let more oil seep out of the formation?
Ovi,
Your mystery chart is showing a similar downtrend in monthly changes to quarterly changes in my chart below. I’ve included 30 top US shale oil companies which covers 56% of US shale oil production, based on EIA total shale oil from EIA tight oil estimates by play.
I will update this chart as these US shale oil companies release their 2019Q4 reports over the next few weeks. This chart shows that US shale oil production growth is slowing.
Tony
Interesting chart and definite sign of peaking/plateauing. Is this info just for US oil or does it include non-US oil. Thinking about CVX and XOM that have world wide operations.
Ovi
At least 99% US shale crude and condensate. CVX and XOM data to 2019Q3 are all from shaleprofile.com
CVX and XOM for following quarters assume quarterly growth rate 10% sourced from their company reports
No non-US oil
Ovi
1o top ranked by 2019Q4 shale crude oil production:
1 Occidental incl Anadarko acquisition 0.50 mbd
2 EOG 0.47 mbd
3 ExxonMobil (XOM) 0.34 mbd
4 ConocoPhillips 0.28 mbd
5 Pioneer 0.22 mbd
6 Concho 0.21 mbd
7 Continental 0.20 mbd
8 Marathon 0.20 mbd
9 Diamondback 0.19 mbd
10 Ovintiv incl Newfield acquisition 0.18 mbd
Tony
Great work. There are many pieces of information pointing to a slow down in growth in 2020. You have just added more.
Ovintiv used to be called Encana, short for Energy Canada. Many Canadians are not happy that they moved their headquarters from Calgary to the US. Canada’s, Trudeau’s, extreme policy on CC is the main culprit.
PS: I hope that people don’t think that Ovi is short for Ovintiv
Next federal election can’t come quick enough.
Great post Ovi, thanks again. China dropping from approx 4.4 to approx 3.8 over such a short period of time always attracts my eye. Any post peak postmortem opinions on China? A similar drop on a larger scale, like perhaps OPEC down approx 14% over approx 14 months, would really cause a panic I think. Are there any reasons why any specific producers might follow China’s post peak profile?
Survivalist
Their main oil field, Daqing, is in decline.
Crude output falls in 2018 at China’s top Daqing oil field
BEIJING, Jan 4 (Reuters) – Crude oil output at CNPC’s Daqing oil field, China’s largest, fell to 32 million tonnes in 2018, down more than 6 percent from a year earlier, the state-owned oil company reported in its official newspaper.
The fall came despite mounting efforts from the producer to increase domestic output, with Daqing accounting for nearly one third of CNPC’s crude production inside China.
China’s national oil and gas producers have pledged to expand domestic oil and gas exploration and production to help boost national energy security.
CNPC is having to use more non-traditional drilling techniques at the ageing oilfield, with crude output in 2018 down about 20 percent from the field’s peak annual output of 40 million tonnes in 2008.
Argentina’s new economics minister was at Davos. He announced the Vaca Muerta oil production last year rose 24% to what appears to be about 125K barrels per day. This was in addition to conventional production.
Brazil’s economics minister was also there and the two formed a handshake agreement on a pipeline directly to Brazil from the VM for gas transport. Brazil is a big consumer and someone’s LNG exports are about to take a hit.
Peak Permian Is Approaching Faster Than You Think
Bloomberg Opinion) — The heart of America’s oil renaissance is found in the Permian basin, which is showing signs of maturing fast. And for shale basins, that’s not a good thing. If the rich petroleum region wanes, U.S. oil independence will remain elusive and the OPEC cartel may finally see off its greatest threat.
The Permian, spread across west Texas and southeast New Mexico, yields more than a third of all U.S. oil production and it has contributed about two-thirds of the past three years’ worth of growth. Its boom has allowed America to export more than 3 million barrels a day of crude on a regular basis since May — more than every OPEC country except Saudi Arabia and Iraq. But the U.S. still imports twice that volume. A slowdown in the Permian would see that gap widen again.
Output from the region, where oil was first discovered by W.H. Abrams a century ago with a well that produced just 10 barrels a day, is hitting new heights. Production has continued to grow in recent months despite a drop in the number of rigs drilling in the basin, which fell by 17% last year, according to data from the Energy Information Administration, as the chart above shows. But that cannot last forever.
The latest edition of the EIA’s Drilling Productivity Report, published on Tuesday, shows that the Permian rig count fell to 402 in December, down from 485 a year earlier. Partly offsetting that decline, operators are getting more new oil per rig. But the chart below shows that the biggest increases in efficiency coincided with the steepest declines in the rig count — suggesting the improvement came through a renewed focus on the most productive parts of the play, rather than some technical breakthrough. Those strong gains have not been sustained.
The report also breaks out production from new wells — those in their first full month of operation — and legacy production from all of the rest. This is particularly important in the shale deposits because of the rapid drop in output once a well is brought into use. Production from new wells has to more than offset the declines from a growing number of older wells for overall output to grow.
The EIA data allow us to generate production profiles under various assumptions about rig counts, new well production rates and legacy-well declines. The results are worrying for those depending on ever-growing Permian output.
There are three charts in this post and a lot more text. One chart shows the Permian peaking in 2021 but you will have to click the link to see them.
Ron,
That author makes a common mistake by assuming the legacy production change will continue to increase at a linear rate, one need only look at past legacy production change (2015 to 2017) to see that this is a poor assumption.
Also assuming oil is produced from a rig not requiring an underlying frac fleet …..
With WTI price now falling likely back into the 40’s (if not lower) – Economic slowdown accelerated by nCov. This is likely going to increase Driller bankruptcies. If this holds true than it not going to take another 12 or more months for Permian to Peak.
A deep dip in prices like this is creating a temporary peak – there’s enough oily stuff left to increase production again the moment prices are back up again. At least in Permian.
If there are a significant number of bankruptcies, back production growth collapse for a while. Meanwhile, current wells will go on producing, leading to depletion. When prices rebound and drillers go back in, the older well be producing less, thus the entire formation may never exceed the 2020 peak.
Anotherwords the production will plateau instead of typical bell curve. Of course this would be better since the production from Permian would last longer at a higher output.
Eulenspiegel,
I agree. If oil prices go to 40, Permian will peak, but it is unlikely to last long.
Peak Permian or Peak U.S. Shale Oil production and decline are much worse than just the loss of domestic oil supply. It destroys once and for all the “U.S. Energy Independence” Delusion.
With U.S. Energy Independence returning to U.S. Energy Dependence, then the U.S. Dollar and U.S. Treasury Market will come under more stress. Currently, the Federal Reserve is applying $40-$75 billion a day in Liquidity via its Repo Market Operations and $60 billion a month in U.S. Treasury purchases… AND THE COUNTRY ISN’T EVEN IN A RECESSION.
The Fed is financing 75% of the U.S. Government’s $1 trillion deficit this year (12 months X $60 billion = $720 billion… same amount the for the entire U.S. Defense Budget).
Thus, the Fed intervention in the market is more than it was in 2009, when the U.S. economy was in recession and the financial system was in trouble.
So, with the Peak of the Permian and the production declines that will come from the other four top Shale Oil Regions, it will set the stage for severe stress for the U.S. Dollar and U.S. Treasury Market.
With the World Economy now at 322% Debt to GDP, this isn’t a situation that will go on for much longer.
Steve
Steve, If US equity markets roll over that is dollar negative. But if we ever get a come to Jesus moment similar to 2008 or worse. Where all hell breaks loose. US treasury market will be bid. Yields on 10year will go negative due to the flow. US dollar will be bid and gold will also be bid. Japanese Yen will be bid. Everything else will be sold hand over fist. Currently there is not near enough US dollars in the system to service USD denominated debt. Short squeeze with a much stronger dollar is in store. Not a weak dollar.
A strong U.S dollar will probably cause a stock market crash.
Only unkown factor: The FED is able to support infinite dollar supply, on demand. When things go bad they will at least try.
Read the following if you want an Idea on what Fed is doing:
https://www.market-ticker.org/akcs-www?post=237899
https://www.market-ticker.org/akcs-www?post=237899
The fed is absorbing negative interest bonds (from ECB) to get them out of the USA banking system because they are POO POO.
Negative interest rate bonds are a guaranteed LOSER. Why on earth did anyone take these things on?
They are used as collateral in REPO transactions that the banking industry is dependent on.
Is this a good thing….NOOOOOO!
Its like when the fed was bought mortgage backed securities because they were JUNK.
“The fed is absorbing negative interest bonds (from ECB) to get them out of the USA banking system because they are POO POO.”
Except I believe US Banks are heavy investing CD’s & MMA in EU banking. If you look at CD’s and MMA yields they match close to LIBOR
Watch around the 5 minute mark:
https://www.youtube.com/watch?v=-yhiKtN4dRw
I doubt the REPO market is being used to “exit from Euro bonds” since US banks would not be investing in Negative rate bonds. If they had long term Eurobonds, then they could have sold them for a profit when the bond yields crashed.
Consider that lot of money from Europe is getting invested in the US as European investors are going after the much higher yielding bond market. If your a European do you keep your money in negative interest rates accounts, or do you invest in US bonds that still offer a small positive return?
If anything the Fed would prefer to buy up US bonds to drive US interest rates lower to prevent the dollar from rising in value, which I believe is objective. Fed started dropping rates, but does not want to drop rates back to zero. so They use the REPO market to keep rates lower and preventing the dollar value from increasing.
Sorry for double post. I messed up first link
Read the following if you want an Idea on what Fed is doing:
https://www.market-ticker.org/akcs-www?post=237886
https://www.market-ticker.org/akcs-www?post=237899
The fed is absorbing negative interest rate bonds (from ECB) to get them out of the banking system because they are POO POO.
They are used as collateral in REPO transactions that the banking industry is dependent on.
Is this a good thing….NOOOOOO!
Its like when the fed was bought mortgage backed securities because they were JUNK.
One of the many things that Karl gets wrong is that although there are billions of (non US) bonds and notes trading at a negative yield it’s not because they are either worthless or because they have negative coupons. There are a few issues which do have negative coupons (in Switzerland for example) but they are few and far between. The reason why they trade at a negative yield is because they trade at a significant premium to par. IF you buy them at that level they will give you a negative yield. The reason why they trade at a premium is because they are (relatively) desirable vv. alternative investments. It’s their attractiveness that causes the negative yield, not because they are so horrible as Karl would like you to believe.
“It’s their attractiveness that causes the negative yield,”
Weekend Peak-
in your view, what does it say about the condition of the European economic prospects, when a negative yielding bond is viewed as attractive?
Assume you are a fixed income manager for a pension fund. In other words, you have a long investment horizon and generally keep securities until maturity. (in reality , holders combined, will hold a bond to maturity although individual holders don’t and may have gains or losses). Bonds are issued at a price (not always equal to par) and are redeemed at par so you know what the difference in the price you pay is and par and you also know the coupon.
So you have a choice between buying a bond issued by -say Landwirtschaftliche Rentenbank or a government bond – backed by the ability to tax to repay the bond. The Landwirtschaftliche Rentenbank bond may have a coupon of 3% – trading at 100 (to keep things simple) and the government bond a coupon of 0.5% but which one is more attractive? the bank may very well be out of business in 30 years and your pensioners (that you are investing for) are out their money – OR – you can invest in the 0.5% bond (trading at 103, giving you a negative yield to maturity). What is the more responsible investment?
Fixed income investing is about the absence of negatives, not the presence of positives so the answer is likely the negative yielding gvt bond, not the 3% corporate. You are guaranteed repayment of principal in the case of the government bond. With the corporate – who knows – you can be looking at either full repayment or a loss of a portion of that. As a fiduciary – what do you do? You probably almost don’t have a choice but to go for the minimum loss choice – the negatively yielding bond with 100% certainty vs the 3% bond (less because of the premium in the real world) with an unknown certainty of repayment.
In real world investing governement (backed) bonds have a very real advantage over corporates because they will be paid back. That certainty of return of principal is worth a lot – People would rather take a certain 98% of their investment versus a very uncertain 100% of investment (and fuck the coupon at that point) because that 100% can turn into 50% or so quite quickly. Certainty for non gvt backed bonds decreases very quickly as maturity increases.
Rgds
WeekendPeak
Wait, the US isn’t in recession? I thought that was widely predicted for this timeframe.
As for financing $700B from money created from nothing, well, that’s only 15% of spending. The deficit is 21% of spending. There’s still 79% of spending that could be borrowed. And from the Fed. Why not?
As for not going on much longer . . . why not that, too? The substance comes from nothingness. It comes from nothingness at the Fed, at the ECB, at the BOJ, at the SNB and at the PBOC. So why is this a problem? You think nothingness is going to run out? Why would nothingness run out?
The graph of China production shows peak production in 2015.
They became a net importer back in in the early 1990’s
and now import right about 10 Mbpd.
That is more than either Saudiland or Putinland export.
India hopes to catch up.
graph courtesy of Matt
http://crudeoilpeak.info/peak-oil-in-asia-where-will-the-oil-come-from-for-the-asian-century
I see WTI is under $53. Bet that will help the shale companies, which I now include XOM as being, as the company thinks it is a brilliant strategy to come late to the shale parade and try to catch up to those who at least had a few years of high oil prices.
XOM has been a bust for me for several years. Was over $85 in 2007. What a dog.
Just goes to show no matter how big you are in the oil game you are only as good as the assets you hold.
The travel industry appears poised to be decimated this year by fears over the new Wuhan coronavirus. Oil demand is likely to fall. Unfortunately, market participants feel that in order to get shale companies to produce less oil in the short and medium term, oil prices will have to fall dramatically. In economic terms, shale oil supply is extremely inelastic, so much lower prices are needed for this commodity in order to get production to go lower. There may be many shale oil bankruptcies by year end.
XOM hit a share price not seen since 2010 and is less than $5 from hitting a price not seen since 2005.
This company held up better during the 2008-2009 stock market collapse than it is now.
I hate to ride this sucker to the bottom. Oh well, it won’t break me.
I feel your pain
With my frac spread charting I wouldn’t be so caught up in the lag time on new production although I did quite a bit of work to set the lag as I believed 3 months was the magic number and settled on 2 (keep in mind it’s the sum of a whole not just what a cube is doing although it may change). What you should really pay attention to and is the most interesting part is the seasonal legacy declines extremely low in Q3/Q4 and extremely high in Q1/Q2.
Other notes in that legacy decline is increasing back to 14 levels and new oil per frac spread is dropping fairly hard since 17. Wells are not getting more efficient only significantly less and it’s not new. Using the fracs you can throw rigs, completions and DUCs in the trash where they belong. You combine all into the efficiency of the frac crew. Fracs are expensive, always working and they don’t do lease frac like lease holds from rigs. Also new oil per frac crew also very seasonal.
This is what the EIA has zero clue on. They’re looking at all this oil coming on Q4 and they’re like “oh wells much be so much better, more efficient”. Wrong mfers it’s ultra low legacy declines from running hard with new pipes dropping legacy declines down past 1% which will in turn spike over 7% in Jan/Feb.
Hey Ovi, Dennis and I agree on that one. A well is completed when it produces. Back in the older times they would occasionally set packers and swab a well through the tubing before deciding whether to run production casing or plug and abandon. I don’t know how they would report something like that, but it probably doesn’t actually make much difference to overall stuff.
One thing that does matter is frac recovery. When a fracked well is turned to produce the initial production is frack water with a skim of oil. As the frack is recovered the amount of oil hopefully goes up and water goes down. If you look at Eno’s production graphs you see that as usually the second month is higher than the first.
“If you look at Eno’s production graphs you see that as usually the second month is higher than the first.”
I thought that the reason for that was mainly since first month production is averaged for the entire month but the well might actually have started production by the end or middle of the month?
Or does he actually divide first mont production by actual days on production for first month?
Baggen,
Correct, he divides monthly average output by 365.25/12 to get bo/d. If one looks at the cumulative chart he gives cumulative barrels for the given month, you explained it precisely, monthly output is less because the average number of producing days is roughly half of month 2.
dclonghorn.
In Enno’s well profiles the reason month 1 is less than month 2 is simply statistical.
Month 1 wells typically average 14 to 16 days of production (when the average of all wells that started producing from day 1 to day 31 of month 1 is taken). For the month 2, wells average days of output averages from 28 to 30 days. That is the very simple reason that month 1 is less than month 2, month 1 has roughly half the days of output of month 2.
The period of frac water flowback is not considered a “producing day”, that is the pre-completion period as I understand the reporting.
Johnnycage. It’s good to see your comments here. I have learned a lot from following you on SA. Thank you for sharing so much. As you may have noticed up thread I linked some of your graphs and have tried to explain them. Let me know if I got anything wrong.
John
Frac spreads started to decline in March, but production continued to increase for the rest of the year. Could you explain how a model based on declining Fracs spreads explains first increasing production and then followed by a decline.
New Oil Per Month Per Frac Spread. Extracted from shale profile. 12 month average to remove the seasonality.
Frac spreads still low. The Primary Vision Frac Spread Count is 300 for the week ending January 24th, 2020.
https://twitter.com/PrimaryVision/status/1220827139710312448
Ignore past Sept19 it’s modeled and an old one. This is the seasonality and increasing legacy decline. EIA is glad handing the hell out of shale. They see these legacy seasonal declines in the numbers it would be impossible not too. Day of reckoning is soon and we can see the declines already in ng losses. btw it would take 580 fracs to get EIA’s end of year figures. In 1-2 weeks fracs will fall again from low prices. It’s associated gas that’s been crushing shale combined with cap starvation that’s been accelerated. Think what will happen when all this prod floats away soon. Going to really really hurt.
Enjoy…
Johnny,
From the EIA DPR
https://www.eia.gov/petroleum/drilling/#tabs-summary-2
EIA estimates for Feb 2020 that production from new wells to 608 kbd and legacy decline to be 586 kbd to cause production to increase from 9,178 kbd to 9,200 kbd in Feb 2020. That’s an increase of 22 kbd or 0.24% month on month. Day of reckoning is soon as next EIA DPR could show a smaller increase for Mar 2020 of 5-10 kbd, followed by a small decrease in Apr 2020 of around 10 kbd.
There’s also the issue of the quality of the 7,600 remaining DUCs.
https://www.eia.gov/petroleum/drilling/#tabs-summary-3
https://seekingalpha.com/article/4319381-shale-production-is-on-duc-life-support-and-will-need-going-forward
Despite the substantial decline in the US rig count in 2019, oil and gas production continued to expand at a robust pace.
Shale optimists like to focus on continued technological improvements as the main factor.
Continued consolidation of drilling in prime acreage and a substantial reduction in DUCs are the factors which most likely had a more substantial impact last year.
In the absence of much higher oil and gas prices, shale production could stagnate and then decline as soon as DUC draw-down reaches its limits.
Johnny,
Where do your legacy decline numbers come from, not the DPR I hope. If you are going to claim that the DPR model is crap (which is correct), you have to throw all of their numbers out, including legacy production change.
What is the basis for your lagacy decline %?
Bankruptcies continue
https://twitter.com/chigrl/status/1221882616963653635
DPR is garbage. Waste of time. Decline curves don’t move linear and nobody puts 30% of capex on the shelf for a rainy day. EIA doesn’t call out year or lease holds. Bad data worthless. 70% of costs is in the completion and money is the bottleneck. You see this pattern now with EIA not calling out ngl spiked in crude supply. They choose to run a huge adjustment to give the appearance of big production numbers. They know it and while legal is dangerous.
Btw I know people that evaluate companies and DUCs. Most tight spacing train wrecks. Here’s a chart. Note stable ratios while DUCs increase in 18. I’m telling you EIA is glad handing shale. The DUC decrease this year was to remove the runup pre Iran waivers. Should be asking yourself why the ratio is spiking right now to rigs if there’s viable DUCs.
Johnny,
Are you also predicting peak US crude this year?
I know EIA weekly supply estimates are just estimates but EIA has 13 mbd for the last two weeks to 17 Jan. I’m guessing the US crude peaks at around 13 mbd about now but this assumes that Chevron and ExxonMobil keep increasing their Permian production.
This is the huge growth of both ExxonMobil and Chevron, mainly in the Permian, according to shaleprofile.com
Shale crude oil growth ExxonMobil & Chevron
XOM has upgraded its Guyana estimate to 8 billion BOE.
They also announced a new discovery nearby. Amount largely unspecified but described as large and say they will add that to the 8 billion estimate at a later date.
Tony,
No just following the numbers. Exxon is an embarrassment in shale btw. One of the highest % of flaring. Wells not looking great also. Their investors will start pushing for them to back off. They need to work 3rd world leaders that’s what they do best. Nobody should be producing any new drilling of serious with associated gas what it is and low realizations. Exxon needs to adapt. If they refuse then there’s something structurally wrong in the company.
Johnny
US peak oil in 2020?
Johnnycage. I agree regarding XOM.
Although I thought the shale only companies were foolish for drilling so many wells during this low price period, I can at least see why they did.
Maybe XOM has crazy drilling commitments in its leases also? If not, what other reason could they have for drilling like this?
The marginal barrel worldwide is boiled down to Permian ngl. All these old wells (more ngl vs oil on the ratio as they age), continued foolish drilling by Exxon for example will continue to block new drilling in shale until the price can support it. Pre-corona virus oil was in price discovery and still is. We just have to get thru fake EIA/IEA noise. We can talk about how non efficient shale wells are all the way to the bottom of this Q1/Q2 production correction. That should make the EIA happy.
Tony,
I have peak as Dec 19 until numbers show otherwise. Could be permanent peak depending on pricing and length of recovery. I’m amazed at the EIA as the industry is in capitulation land on the service side. Bakken will roll hard 21 due to over drilling. Phantom on twitterverse has nice data showing anything over 10 wells on the DSU is basically drilled out in Bakken. WLL is done. Goehring made a comment along same line but more on spacing in their deep state analysis. We drill out in 2020 and new wells in 21 start showing this issue. EF should be rolling over in 2020 also. I’ll keep watching the new IP oil coming with legacy declines. They’re telling me where this is headed.
Shale Profile just updated EF to October. Still flat.
USA C+C production through December 2019 according to the EIA’s Monthly Energy Review. They have US production up by 14,000 barrels per day in December.
The last three months of the Monthly Energy Review are just estimates. Those months are often heavily revised. In fact every month of the past year are often revised but the last months are the most heavily revised.
Ron
If the MER is correct for December at 12,861 kb/d, then that means that the January 2020 STEO is really off in their prediction. They have December at 12,967 kb/d, 106 kb/d too high. There was this huge jump in the Jan 2020 STEO over the December one, that gave the impression it was bit overdone. Hopefully, we will start to see the STEO starting to drop their monthly production estimates as they were doing from September to December.
EF, CO and OK will be the first ones to roll over in the 914’s. L48 non GOM set to decline at least 200kbd in 2020 also. That peaked in August off new pipeline but will drain quick. All this infrastructure brought crude forward with nothing behind it.
Guardian to ban advertising from fossil fuel firms
https://www.theguardian.com/media/2020/jan/29/guardian-to-ban-advertising-from-fossil-fuel-firms-climate-crisis
Hey folks, this is big. I posted earlier that Russia hopes to keep its oil production at around 11.2 million barrels per day for the next four years. Now they are saying “maybe not”. Bold mine.
Russia Warns Market That Its Oil Production Could Drop
Russia may not be able to maintain the level of its oil production in the future due to the current taxation system on the oil industry, Russian Energy Minister Alexander Novak said on Wednesday.
Currently, Russia produces around 11.2 million barrels per day (bpd) of crude oil and condensate.
The energy ministry sees risks in Russia’s goal to keep its oil production levels due to higher production costs and dwindling reserves, Russian media quoted Novak as saying at a meeting to discuss the country’s economic policy on Wednesday.
Russia is currently overhauling its taxation system to move from a tax based on production to a profit-based taxation and to gradually phase out the crude oil export duty by 2024, which is expected to increase export netbacks for oil producers.
Russia’s energy ministry plans to update this year the energy strategy through 2035, said Novak, who kept his job in the recent reshuffle of the Russian government.
The energy strategy is filed with the government, there are disagreements on it, but they will be discussed soon, Novak said today.
As early as in September 2018, Novak was quoted as saying that Russia’s oil production could peak as early as in 2021 due to high taxes and costs, provided there are no benefits for exploration or tax incentives introduced.
If current production trends continue, and if Russia doesn’t do anything to further stimulate oil exploration and new field development, after 2021, production may start to fall and reach just 310 million tons by 2035, that is, Russia’s oil production could drop by 44 percent by then, Novak said back then.
Russia’s crude oil and condensate production could rise to more than 12 million bpd by 2035, if global demand for liquid hydrocarbons continues to grow, Russia’s second-largest oil producer, Lukoil, said in a new forecast last month.
By Tsvetana Paraskova for Oilprice.com
We’ll have to wait and see, but I take everything from that site with a large pinch of salt.
Oilprice.com posts a lot of click-bait tabloid style garbage.
Oilprice.com posts a lot of click-bait tabloid style garbage.
Yeah, they often copy and paste the entire posts of Peak Oil Barrel without even asking permission. 😉
However, they quote here the Russian Energy Minister. In this case, I will take their word for it, that these are the words of the Energy Minister. I just don’t think they would make up a blatant lie and say it was the words of the Russian Energy Minister.
“Blatant lie”
Your kidding, right ? Ron,you know better. This is the age of Trump
If both Saudi and Russia are peaking roughly about now, who’s going to pick up the slack: Guyana. Norway, the Permian ,,,?
Curious, but why do you think someone must take up the slack?
….., after 2021, production may start to fall and reach just 310 million tons by 2035, that is, Russia’s oil production could drop by 44 percent by then,….
Imagine, “just” 310 million tons produced in ONE year. It’s a fact, Russia is a big country with quite a few giant and a lot of small oilfields, but still. Production now will be about 500 million tons yearly, equals 0,5 billion tons a year ! That can hold on only very far from ‘forever’. And most of the ‘easy to get oil’ has gone already.
How do we reconcile the Energy Minister comments with Lukoil?
“Russia’s crude oil and condensate production could rise to more than 12 million bpd by 2035, if global demand for liquid hydrocarbons continues to grow, Russia’s second-largest oil producer, Lukoil, said in a new forecast last month.”
Ovi,
All forecasts are wrong, but forward looking statements by oil companies are particularly at odds with actual future output, EIA and Russian energy ministry reports are far from perfect, but typically will be an order of magnitude better than oil company press releases, which in fine print basically say, believe none of what is said in large print. 🙂
In short, Ron might say believe the oil minister and not Lukoil, it is certainly what I would say.
Ovi wrote: “Russia’s crude oil and condensate production could rise to more than 12 million bpd by 2035,…
Ovi, that is 16 years from now, counting this year. That is an increase of 800,000 barrels per day or 50,000 barrels per day per year. Do you think that is an optimistic prediction? I think it is a blatant admission that “we are going nowhere.”
So do you believe Lukoil who says we are going nowhere but where we are right now? Or do you believe the Russian Oil Minister who says “we have peaked and headed lower”?
Take your choice. But either way, it does not make one hell of a lot of difference.
On Jan. 28 price of Brent dipped down to it’s trendline support coming off of 2016 lows. Looks like that support is going to break and price go lower. WTI is just a couple of dollars above it trendline support coming off 2016 lows. If price blows through these areas of support. $20 oil i’ve been talking about since last April comes into view.
At what point would you recommend starting to look at oil from the long side?
Thanks
WP
$20 oil – I’m guessing that won’t happen. Coronavirus will have an impact but only down by $3:
Taking a page from the SARS epidemic in 2003, the virus that originated in Wuhan is estimated to give a “negative shock” to oil, with jet fuel accounting for more than half of the 260,000 barrel-a-day demand loss. That translates to a “modest” $2.90 a barrel impact on oil prices, said analysts at the bank.
https://www.bnnbloomberg.ca/goldman-says-oil-could-fall-3-as-china-s-deadly-virus-spreads-1.1377536
Once quarterlies are released by shale oil companies and confirms US shale oil growth slowdown, this will be bullish for oil price. Hess just released their 2019Q4 earnings.
https://investors.hess.com/financial-information/Quarterly-Earnings
The chart below shows that US shale crude oil production is slowing and potentially on a peak plateau, if production from the majors is excluded.
Hess says they will grow Bakken production in 2020 running six rigs, then drop to four rigs in 2021. They hope to hold production flat the next five years running four rigs.
They claim this will generate net free cash flow of $750 million annually starting in 2021 at $55 WTI.
Does net cash flow mean “after CAPEX”?
I assume the GOR for Hess is rising as is WOR.
Hess seems to post losses almost every quarter. Over $7 billion of debt.
I wonder if Hess has made or lost money overall in the Bakken since the shale boom started there?
Oil is already down $10 from the corona virus. A spread to SE Asia and/or India will put renewed pressure on price. Totally different scenario than SARS due to
– infectious rate of new virus;
– massive increase in China’s air travel (up 20 fold since SARS)
– importance of China and Asia generally to world economy
At 20$ oil I’ll take my whole money and go long oil options… not possible to loose anything at this point.
Oil production will collapse and people will drive their pickup trucks for fun. Even SARS will run out of steam at some time.
You guys looking at the Lukoil projection. 2035 is a long way out.
Time for the Kara sea. Time for the Bazhenov.
https://www.greentechmedia.com/articles/read/eia-renewables-will-overtake-natural-gas-in-us-power-mix
I would ordinarily post this in the non petroleum thread, but it the growth of renewable energy is obviously going to have an absolutely earthshaking effect on the price of oil and gas over the coming years.
How long it will take for this to OBVIOUSLY ( to laymen) force down the price of petroleum from what it would OTHERWISE BE is impossible for me to say, but we are already getting pretty close to ten percent of our electricity here in the USA from wind and solar power……… and that’s enough to have a HUGE impact on the price of gas and coal.
In five to ten more years there will imo surely be enough electric vehicles on the road to lower the price of oil quite a bit below what it would OTHERWISE be.
From the EIA report that OFM referenced just above-
https://www.eia.gov/outlooks/aeo/pdf/AEO2020%20Petroleum%20and%20Other%20Liquids.pdf
They now project that USA oil and ngl production in the reference scenario will still be as high as it is now until the late 2040’s.
Although the eia also attempts to project oil production in a high and low price scenario.
It helps to keep in mind that for the EIA, “reference” means BAU, status quo. It will show no significant changes from the present.
I find all the conflicting information about US Shale output in general, and the Permian in particular, to be incredibly confusing. I am amazed by the depth and breadth of Dennis Coyne’s models and want to point that out in particular, because I think he does amazing stuff.
But I’ve read through this piece here and I find what Johnycage says extremely interesting, but it doesn’t really line up with much of what Dennis forecasts and I’m left twiddling my thumbs completely confused. Throw in various and sundry forecasts from government sources (IEA, EIA etc..) and I get even more confused.
Can somebody with the wisdom of Solomon please clear this up for me. Thanks in advance 😉
Mario,
Thank you.
There are many different ways to approach the problem. I use average well profiles and completion rates, an idea which many people have used before (Paul Pukite, aka Webhubbletelescope, Rune Likvern, aka FractionalFlow, and others).
Johnny Cage bases his analysis on frac spreads, but implicitly he makes some assumption about average completions per frac spread.
See https://peakoilbarrel.com/oil-shock-model-dispersive-discovery-simplified/
and also for other posts on shock model see
https://peakoilbarrel.com/category/shock-model/page/2/
also this post provides an introduction
http://peakoilbarrel.com/oil-field-models-decline-rates-convolution/
Also at link below is a permian model that you can play with
https://drive.google.com/file/d/1fyAD5-CngWdgq_kaZ7ow1k7O_dNr8xaW/view?usp=sharing
Change row 4 of the spreadsheet to get different scenarios for Permian basin.
at link below is a US tight oil model
https://drive.google.com/file/d/1rFHsprpvN1J2V3-C2RNqSXAGBazSdG-i/view?usp=sharing
basically this is the Permian model with a “rest of US tight oil” model that is fixed. Agaimn change row 4 to adjust Permian scenario to whatever you believe is reasonable,
The EIA scenarios should be ignored, they are absurd, same for IEA, OPEC etc.
Some tight oil scenarios that seem reasonable to me in chart below.
The low price scenario assumes oil prices remain $70/bo or less for Brent oil in 2018$ through 2030.
A scenario which roughly matches the Cage 289 frac spread scenario.
This indicates how much the Permian completion rate would need to fall (I assume other basins remain about where they were in Nov 2019 for completion rate and simply adjust the Permian basin completion rate lower.
I am skeptical that things will play out this way, completion rate falls from 1109 in Nov 2019 to 684 in May 2020 for my scenario (a 38% drop in the completion rate.) I doubt the completion rate will drop that quickly.
Wow. Thank you so much for that Dennis. I looked at one of the links but I’ll definitely need more time to try to understand it. It’s not the easiest stuff for me to get my mind around.
I will look at it all much more closely next week, but thank you very much.
I also appreciate your comments on the projections generated by the EIA, IEA and OPEC. It kind of shocks me that huge agencies like that could screw up so badly. Seems very counter intuitive to me.
Thanks again.
Mario,
I am most familiar with EIA’s Annual Energy Outlook 2020 where the reference scenario (best guess) has cumulative tight oil production of 113 Gb from 2019 to 2050, if we add the 13 Gb of tight oil produced from 2000 to 2018 we have 126 Gb of cumulative output from 2000-2050, also if we assume tight oil production drops to zero from 2050 to 2060 with a linear fall in output, that adds another 16 Gb of tight oil output for a total of 142 Gb of tight oil output from 2000 to 2060.
The USGS best guess TRR for tight oil from Permian, Bakken, and Eagle Ford is about 100 Gb (this ignores economics), if we assume other US tight oil plays might have a TRR of 20 Gb we would have a total of 120 Gb of tight oil produced in a high oil price scenario, making reasonable economic assumptions, assuming USGS best guess TRR estimates are correct, and using the AEO reference oil price scenario the economically recoverable tight oil resource might be about 80 to 90 Gb, if we take 85 Gb as a best guess, the AEO 2020 reference scenario is about 67% too high (142/85=1.67).
Mario says:
I second that!
Abrupt Reversal Of Shale Oil’s Fortunes Points To A Radical Reset Of Oil Prices
The Reuters’ 2013 poll predicted $100 Brent. It went to $50. The 2020 poll predicts $65. If history is a guide, it will go to 2 x $65 = $130.
The second shale oil boom was due to 500 frac spreads paid for in the first; now only 300 are left, and 200 were sold for scrap. No one is buying new.
The prediction of a 900,000 bbl/day surge in production in 2020 is physically impossible; when the market finds that out, there will be a reset in oil prices.
From replacement cost, assuming plentiful supplies of cheap shale oil, back to the traditional pricing dictated by parasite economics.
Schlumberger and Halliburton have given up on fracking; they are headed offshore. That’s where the action will be in 2020.
Last Tuesday, the Energy Information Administration (EIA) predicted that shale oil production in February will hit an all-time record.
This is a really long article. I have posted only the first few lines. The below graph from the Drilling Productivity Report shows the DPRs oil production predicted through December. The author left out their prediction for January and February.
Ron Wrote:
“The Reuters’ 2013 poll predicted $100 Brent. It went to $50. The 2020 poll predicts $65. If history is a guide, it will go to 2 x $65 = $130.”
Oil would probably go to $35 before it goes to $130, unless their is a massive amount of inflation. The world is drowning in debt, and interest rates keep on sinking to avoid a global depression. Consumers simply cannot afford expensive Energy. If Oil prices take off it will just fuel a lot of demand destruction, capping prices.
Murphy Oil 2019Q4 just released which has US onshore Eagle Ford Q4 production and 2020Q1 guidance forecast.
https://ir.murphyoilcorp.com/news-releases/news-release-details/murphy-oil-corporation-announces-fourth-quarter-and-full-year-0
Here are recent quarterly crude oil production rates
2019Q1 26 kbd
2019Q2 33
2019Q3 41
2019Q4 39
2020Q1 32 (guidance/forecast from Murphy)
Although Murphy production rates are low, the focus is Eagle Ford. Since 2016Q1, Murphy’s peak was 2019Q3 at 41 kbd. We wait for more quarterlies.
Murphy Oil shareholders not impressed by 2019Q4 results
Rune Likvern published a piece on his blog a few weeks ago, I don’t think it has been mentioned here: https://runelikvern.online/2020/01/09/bakken-something-about-eurs-pdp-reserves-and-r-over-p-ratio/
XOM posted $68 million profit in US upstream in Q4, 2019. That was helped by +$274 million of one time items (asset sales?).
So XOM lost $206 million on US upstream operations, excluding one time items.
A large amount of Q4 profit was actually gain on the sale of Norwegian assets.
Clearly XOM doesn’t work at $50s WTI. They proved it again in yet another quarter. It appears they are borrowing to pay the dividend.
How many barrel a day do they produce? 400k? Looks like they lost round about 5$ / barrel then.
So they need 62-63$ WTI to break even. 70-80 minimum for paying dividens and stock buybacks as their stockholders are used to.
Creative accounting can help here.
4 million BOEPD.
Spending $30+ Billion of CAPEX annually and production is basically flat.
I thought only of the Permian oil – since US upstream activity was discussed.
Ok. My bad there. I thought you meant the entire company.
CVX lost a boatload, due to big write downs of shale and GOM assets.
Minus the impairments, CVX US upstream earnings were about $700 million for the quarter. As the largest owner of minerals in the Permian Basin, I suspect all of these earnings and then some consist of shale royalties.
Mineral owners are the only ones who have fared well on the shale boom, although I wonder how many have went the way of lottery winners when the decline takes the elevator down a few floors. Also, hopefully the shale mineral owners have also learned non-consent is a sure way to never see any income, and have thus signed leases.
hopefully the shale mineral owners have also learned non-consent is a sure way to never see any income, and have thus signed leases.
Could you expand on that?
Guess XOM like all other produce the best acres first, and the result might not get better in future if oilprice remains low.
ExxonMobil and Chevron U.S. Upstream Trainwreck
What’s taking place in the First & Second-Largest Oil Companies in the U.S. reminds me of the slow-motion trainwreck called Chesapeake Energy.
Exxon invested $2.8 billion in Q4 in its U.S. Upstream Sector to report a (net) $68 million profit. And, that $2.8 billion CAPEX investment only netted an 11,000 bopd increase in its U.S. upstream liquids production Q4 over Q3.
I highly recommend those with an OPEN MIND to watch this presentation: https://www.youtube.com/watch?v=oy-94IgDz3w&t
Economics 101 taught in College and practiced by the mainstream Economists is totally MEANINGLESS. They do not include the Resource base in their economic models. Thus, the notion of the ENERGY TOOTH FAIRY forever.
Jean-Marc says at the end of the presentation that when the new swing producer, U.S. Shale Oil Production peaks, then so will the world. And, because the U.S. and Canada were responsible for 80% of global oil production growth over the last 10 years, they were also responsible for the majority of Global GDP growth for the past decade.
Thus, when U.S. Shale oil production peaks…. say good-bye to 2-3% Global GDP Growth. Unfortunately, due to the highly leveraged debt-based financial system, 0% GDP growth for a few years just might be enough to destabilize the entire PONZI SCHEME FACADE.
Steve
I had the misfortune of spending four years of my life earning an undergrad economics degree, the entire discipline is a fucking joke based on numerous fallacies. A short list of the most obvious:
– items that are not traded have no value. Hence, the environment, democracy, personal fulfillment, child-rearing, etc have no value;
– good are infinitely substitutable – hence growth can be infinite;
– humans are “rational actors”;
– people get all their economic fulfillment from consuming, and none from the quality/enjoyment of their work…
The misallocation of resources based on these fallacies boggles the mind. Exxon/Chevron throwing money away in shale oil is just another good example. Shale oil = where money goes to die. The shame is if we as a society had used the colossal amount of money wasted in shale oil ponzi schemes for renewable energy/EV transition instead, we would be much closer to energy independence, tackling global climate disruption, and would have created many more sustainable jobs along the way. What a waste…
I was an econ major in the 1960s and felt there were big holes in what we were taught. It was economics based on American business. Anything else was not even considered.
This is not and has never been an investment blog, but some numbers do align with oil output. As for CVX and XOM, write down of assets doesn’t affect cash available to pay dividends, be it borrowed or not. The virus may take borrowing costs down even further, so no reason they have to care much about non cash profit — especially given the consumption numbers from India and China.
About the latest 2019 consumption data out of India was 9 mos ago for their Q1 and quoted 2.7% growth in diesel, 8% growth in gasoline burn and 14% rise in LPG. Note that LPG is an unusual 40% of India consumption. And India is annually the fastest growing oil consumer. A likely customer of Eagleford liquid.
In other news . . . Canadian oil sands face a Federal political obstacle end of Feb. It’s a big deal. Politics could overwhelm their economics. google trudeau and oil sands
Are you talking about the Teck Frontier mine project?
Watcher,
You say, “This has never been an investment blog.” What does that mean? Regardless, Oil & Investment go hand in hand. There is no oil without investment.
Discussing oil without including “Investment” is like talking about Food without mentioning Cooking.
Do yourself a favor and watch that video I linked.
You might learn something.
steve
What does investment mean when it is measured in a parameter created from nothingness.
You can get oil out of the ground without spending a penny. Daqing started flowing in 1960 under Chairman Mao’s rule. The peasants drilled the hole and hauled the oil. They were given food and water.
Watcher.
That is kind of my point.
The largest oil company in North America cannot even produce shale economically, yet shale production has grown from zero in 2005 to over 9 million BOPD 15 years later.
Price matters, but price has to be way, way lower than break even for it to matter much.
shallow sand,
It is doubtful US tight oil would have flourished without the high oil prices in 2008 and 2011 to 2014 (over $100/bo in 2018$ in latter period). Since 2014 the increase in tight oil output at 50 to 75 per barrel has been surprising to me, especially considering the low natural gas prices combined with low oil prices. I imagine there are few wells (maybe 10% of wells completed) that will pay out at current price levels.
From an economics perspective, the continued high completion rate seems irrational, I have no explanation.
” At first sight, the recent sharp drop in working frac spreads looks extremely odd. Did something change? ”
https://seekingalpha.com/article/4320190-abrupt-reversal-of-shale-oils-fortunes-points-to-radical-reset-of-oil-prices
Take a minute a go view a chart of the Dow Jones. Set it on the monthly chart. Zoom out so it shows the monthly history of price all the back to 1920. 100 years ago. That monthly candlestick that just printed for the month of January 2020. There is not another like in the last 100 years. It’s the most bearish monthly candlestick i’ve ever see on any chart.
A new post “Open thread Non-Petroleum” has been posted.
A new post “US Production Growth Surges” has been posted.
http://peakoilbarrel.com/open-thread-non-petroleum-6/
http://peakoilbarrel.com/us-production-growth-surges/
From page 20 of XOM https://corporate.exxonmobil.com/-/media/Global/Files/investor-relations/quarterly-earnings/presentation-materials/2019-presentation-materials/earnings-presentation-4q.pdf
Actual XOM unconventional oil equivalent production fell a little from Q3 to Q4 but there is no disclosure about whether the fall is from oil or gas.
https://shaleprofile.com/blog/permian-monthly-update/permian-update-through-october-2019/ also showing a small 1% drop for ExxonMobil oil production from Sep to Oct.
Similarly, https://shaleprofile.com/blog/bakken-monthly-update/north-dakota-update-through-november-2019/ shows Exxon Mobil drop from 99 kbd oil in July down to 73 kbd in November.
A new post “Open thread Non-Petroleum” has been posted.
A new post “US Production Growth Surges” has been posted.
http://peakoilbarrel.com/open-thread-non-petroleum-6/
http://peakoilbarrel.com/us-production-growth-surges/