A post by Ovi at peakoilbarrel
Below are a number of oil (C + C ) production charts for Non-OPEC countries created from data provided by the EIA’s International Energy Statistics and updated to April 2020. Information from other sources such as the OPEC and country specific sites is used to provide a short term outlook for future output and direction.
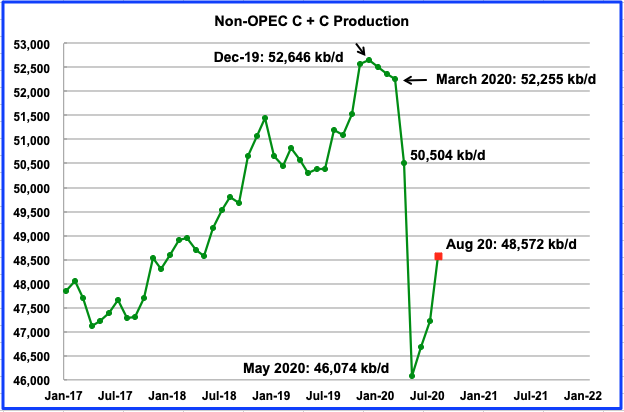
Non-OPEC production dropped slowly from a high of 52,646 kb/d in December 2019 to 52,255 kb/d in March 2020. In April that changed when we saw the first big drop in output from the Non-OPEC countries. April output collapsed by 1,751 kb/d to 50,504 kb/d. Those drops are associated with the OPEC + Declaration of Cooperation (DOC) commitments made by Non-OPEC countries, CV-19 and the WTI price collapse.
The projection to August (red square) was made using the August STEO report. It projects Non-OPEC production will drop to 46,074 kb/d in May before beginning to recover to over 48,000 kb/d in August.
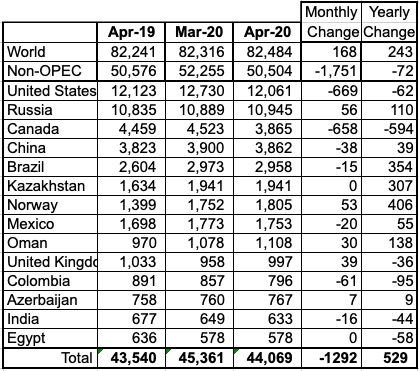
Above are listed the worldʼs 14th largest Non-OPEC producers. They produced 87.93% of the Non-OPEC output in April and the percentage seems to vary very little MoM. On a YoY basis, Non-OPEC production was down by 72 kb/d. On a MoM basis, production was down by 1,751 kb/d. World oil production was up by 168 kb/d, MoM and 243 kb/d YoY.
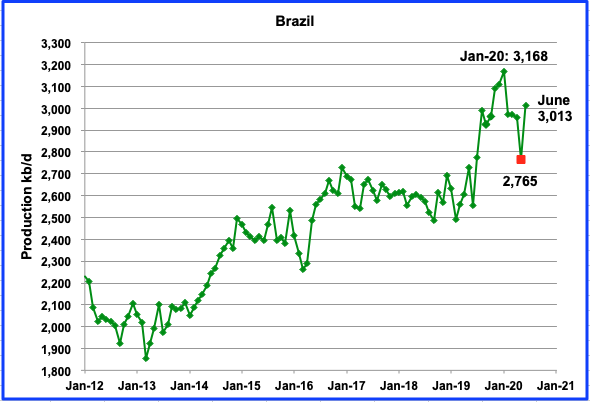
Brazil’s oil output in April was 2,958 kb/d. May saw a drop in output to 2,765 kb/d but it rebounded in June to 3,013 kb/d according to this source. The increase in production is mainly due to the Lula and Búzios fields, which together account for more than 50% of the total national production.
“Pre-salt production in June was 2,125 kb /d of oil, 70.5%, which was produced through 118 wells. “
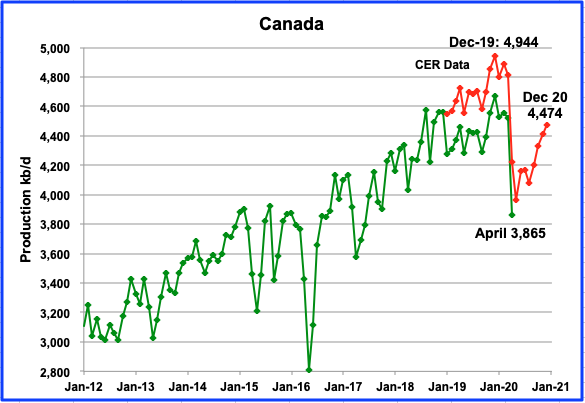
The EIA shows Canadian production was down in April by 658 kb/d to 3,865 kb/d. The Canada Energy Regulator (CER) has just updated their projected production data for 2020. (Thanks Ron). The CER data is higher because it includes NGPLs in their estimates and is close to 6% of total output. According to the CER, output will recover by December to 4,474 kb/d, close to 470 kb/d lower than the December 2019 high. Albertaʼs monthly production limits for raw crude and bitumen are currently set at 3.81 Mb/d from December 2019 to August 2020.
While hearings continue to block progress on construction of TC Energyʼs Keystone XL pipeline, president Trump has given permission for TC Energy to increase the capacity of the Keystone pipeline by to 170 kb/d to 760 kb/d. The president did this due continuing process delays on the Keystone XL pipeline.
“TC Energy will be able to increase its transportation of oil by 50,000 bpd next year, doing so without making any substantial capital investments in the pipeline. Instead, the company will add drag reducing agents to the oil which will make the flow of the liquid smoother, according to Bevin Wirzba, the senior vice-president for liquids pipelines during the call.”
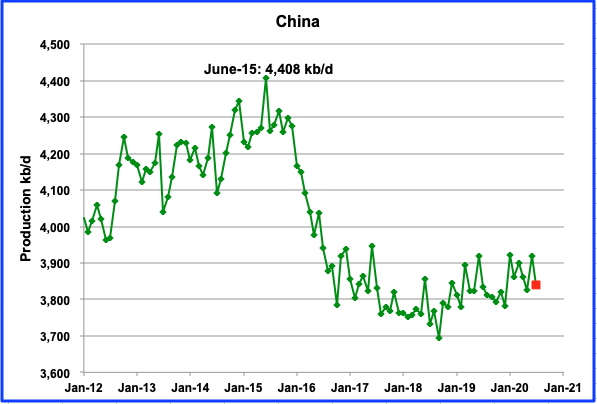
Chinaʼs production peaked in June-15 at 4,408 kb/d and has been in a steady decline up to September 2018 where it reached an output low of 3,694 kb/d. In the EIAʼs update, Chinaʼs April production decreased by 38 kb/d to 3,862 kb/d. According to this source, Chinaʼs July production dropped by 80 kb/d to 3,840 kb/d (Red square) from June’s 3,920 kb/d..
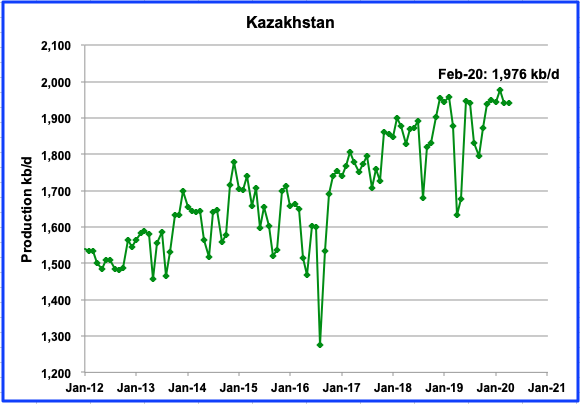
Kazakhstan production hit a new output high in February, 1,976 kb/d. For April, production was flat at 1,941 kb/d. OPEC expects their output to drop by an average 15 kb/d this year.
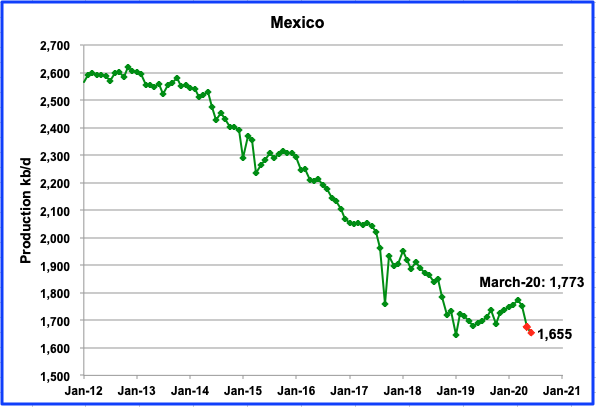
Mexico had steady output increase from May 2019 to March 2020 to 1,773 kb/d. However, the trend was reversed in April. Mexicoʼs production decreased in April by 20 kb/d to 1,753 kb/d according to the EIA. Data from Pemex shows that production dropped to 1,655 kb/d in June. Under the DoC, Mexico committed to reduce output by 100 kb/d in May. Relative to March, June production is down by 118 kb/d and this puts Mexico in compliance with their commitment.
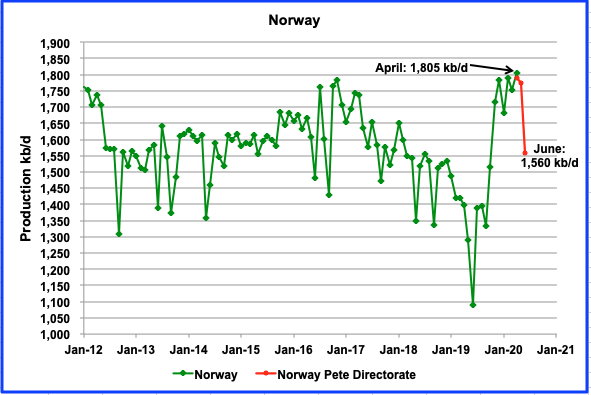
Norwayʼs output increased by 53 kb/d in April from 1,752 kb/d to 1,805 kb/d. March output was revised up from 1,735 kb/d to 1,752 kb/d according to the EIA and in accordance with the NPD report. The red lines indicate production going forward as outlined by the NPD. May production came in at 1,775 kb/d rather than the pre-pandemic planned 1,859 kb/d originally predicted by the NPD.
Average daily production in June was 1,560 kb/d. “On 29 April 2020, the Government decided to implement a cut in Norwegian oil production. The oil production figures for June include the commitment of cutting 250 kb/d.” This cut is 50 kb/d higher than originally planned. So June production of 1,560 kb/d is 245 kb/d lower than April and within 5 kb/d of their 250 kb/d cut committment.
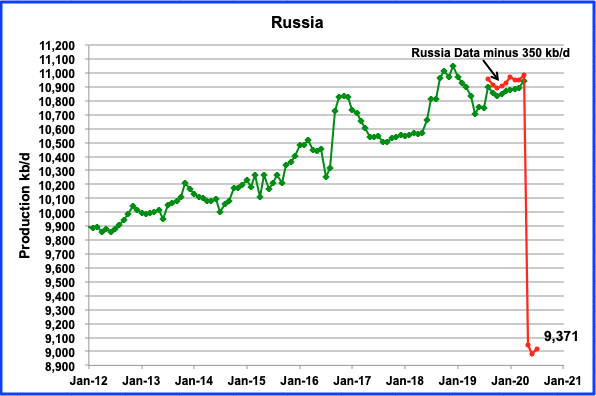
According to the Russian Ministry of energy, Russian production increased by 42 kb/d in July to 9,371 kb/d.
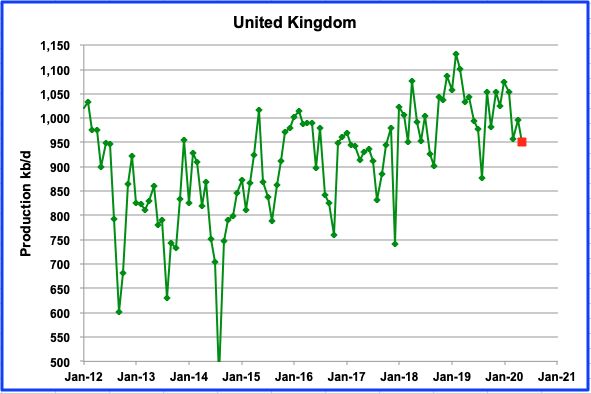
UKʼs production increased by 39 kb/d in April to 997 kb/d. According to OPEC, production is expected to drop to 950 kb/d in May (Red square).
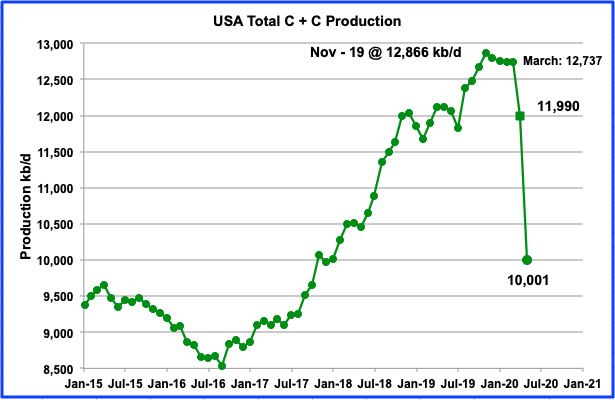
May’s production drop is just short of 2 Mb/d by 11 kb/d. Awesome. US oil fields began a slow and steady decline from November 2019 to March 2020. March brought the combination of CV-19 and oil price drop that led to sharp production plunges in April and May. Since the current EIA data is two months delayed, May is the second month that shows the combined effects of the pandemic and low oil prices. Will June drop below 10,001 kb/d? (Note that this chart uses PSM data, which is slightly different than the EIA international which is slow in updating its US data.)
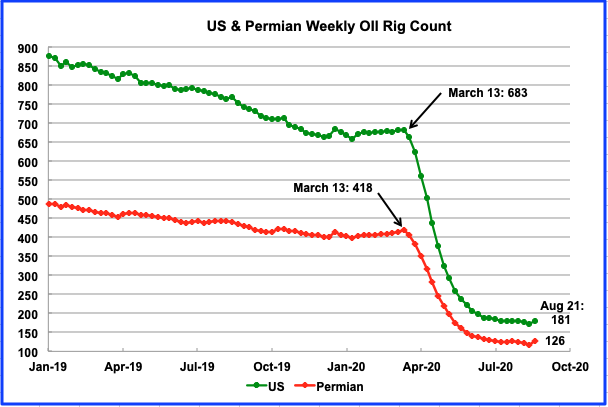
US oil rigs dropped from 683 on March 13th to 172 on Aug 14th. At the same time, Permian rigs dropped from 418 to 116. For the week of August 21, the trend reversed. US oil rigs increased by 9 and Permian rigs by 10. As a percentage, Permian oil rigs represented 61.2% of the total on March 13th and they gradually increased to 69.6% for the week of Aug 21.
According to the August DPR, the 126 rigs operating in the Permian in August will be sufficient to raise production in August by 108 kb/d to 4,147 kb/d.
This weeks increase in oil rigs seems to imply that $42 WTI (August 21, 2020) is sufficient to bring back drilling in the Permian. For the week of August 21, Williston and Eagle Ford each dropped one rig. In non-basin areas, three rigs increased. On a state basis, Texas was up 10 to 96, North Dakota down 1 to 10 and New Mexico up 2 to 46.
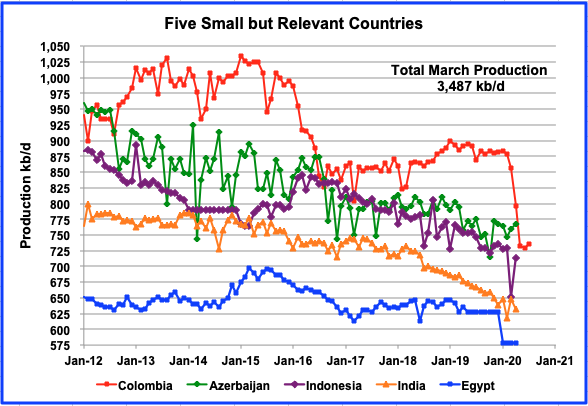
These five countries complete the list of Non-OPEC countries with annual production between 500 kb/d and 1,000 kb/d. All five are in overall decline. Their combined April production was 3,487 kb/d down 8 kb/d from March’s output of 3,495 kb/d. Azerbaijan, Indonesia and India appear to be in a slow steady decline phase.
Columbiaʼs production has been essentially flat since August 2019 but declined by 75 kb/d from February to April. In August, it was reported that production had fallen to 735 kb/d. “The country previously expected that with oil prices in a range of $60 to $65 a barrel, some 42 exploration wells would be drilled in 2020. Now it expects 20 to 33 wells, he said.”
NON OPEC W/O US PRODUCTION
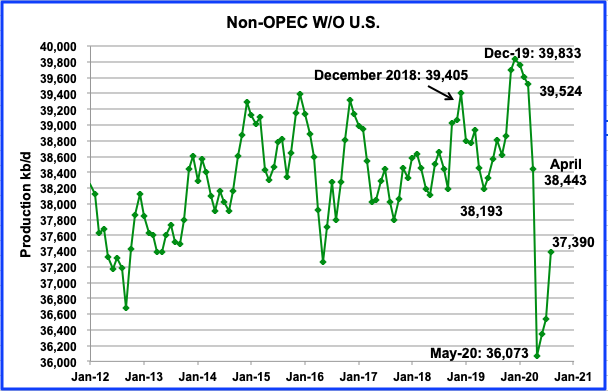
This chart is providing an early indication that Non-OPEC countries, excluding the US, are approaching an output plateau. April is the first month in which the large production drop associated with CV-19 and the plunge in oil prices shows up in this chart. Excluding the US, output from these countries dropped by 1,081 kb/d in April to 38,443 kb/d and then will drop by a further 2,370 kb/d in May.
Using information from the August STEO, output from Non OPEC countries, W/O the US, will drop to close to 36,000kb/d in May and then will begin to rebound starting in June. August output is expected to reach 37,390 kb/d.
World Oil Production
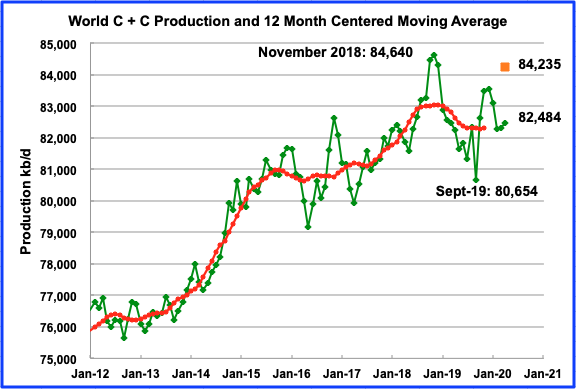
World oil production in April increased by 168 kb/d to 82,484 kb/d. OPEC’s production increase of 1,919 kb/d in April was offset by Non-OPEC’s decline of 1,751 kb/d, the difference being 168 kb/d. April’s output of 82,484 is 2,156 kb/d lower than the November 2018 peak.
The orange square represents world oil production if the Non-OPEC countries’ output had not dropped by 1,751 kb/d. In other words, if the OPEC output surge of 1,991 kb/d had been added to a stable Non-OPEC output, World output would have been 405 kb/d lower than the peak on November 2018.
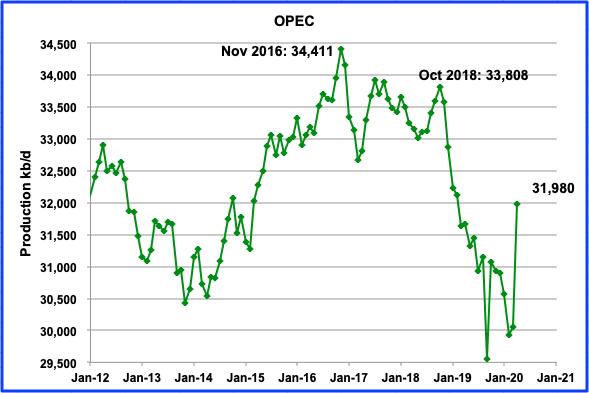
OPEC oil (C + C) production increased by 1,919 kb/d in April to 31,980 kb/d.
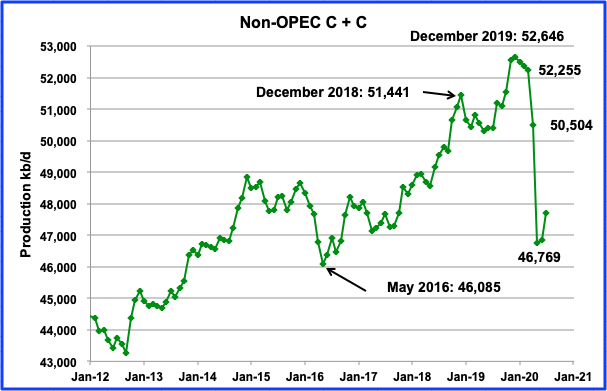
Non-OPEC output dropped by 1,751 kb/d in April to 50,504 kb/d. May is expected to be the low point at 46,769 kb/d before output begins to recover in June.
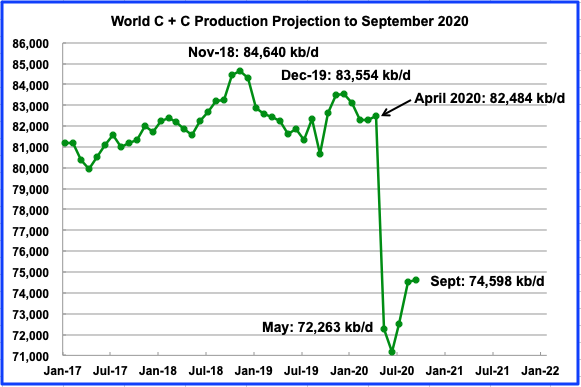
This chart projects world production out to September 2020. It uses the August STEO along with the International Energy Statistics to make the projection. It projects that world production will collapse by 10,221 kb/d in May. By September, output is expected to recover to 74,598 kb/d.
World oil production increased slightly in April because OPEC and Non-OPEC production went in opposite directions. However in May, OPEC reversed its over production and along with the Non-OPEC cuts/declines, the reversal and cuts became additive and massive. Looking at some of the individual country drops between April and May as reported by other sources, these stood out; OPEC 6,331 kb/d, Russia 1,942 kb/d, US 2,060 kb/d, Canada 260 kb/d, Brazil 193 kb/d and Mexico 76 kb/d for a total of 10,862 kb/d. This is 641 kb/d higher than the DPR projected May decline of 10,221 kb/d.
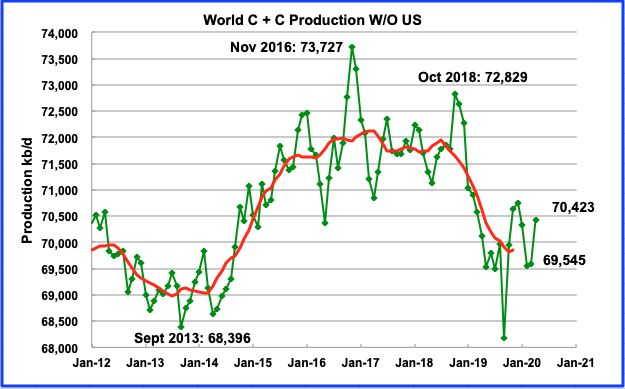
This chart is world oil production without the US. Note that the November 2016 peak is two years prior to all the worldʼs countries peak shown in the previous chart. April production was 70,423 kb/d, an increase of 878 kb/d over March and 3,304 kb/d lower the the November 2016 peak. For May, we should expect to see a production decrease of approximately 8,100 kb/d to 62,200 kb/d.
188 responses to “Non-OPEC Oil Production Collapses in April”
Ovi,
For the last chart in your post, I focus on the centered 12 month average. What I see is an undulating plateau from 2015 to 2018 and then a decline in 2018 and 2019 due to cuts by OPEC and Russia.
The chart below is from Ron’s post last week, the 12 month average is a trailing average so needs to be shifted to 6 months earlier to compare with a centered 12 month average. It is pretty clear from the chart that the decline in World minus US after mid 2018 is explained by OPEC+ cuts.
Dennis
The last chart stops at April. Russia had little influence at that point. The drop down to close 68,200 in September 2019 was the attack on Saudi Arabia.
The purpose of that last chart is to show the importance/role of the US on world oil production from November 2016 to November 2018 and beyond. From November 2016 to November 2018, OPEC production dropped by 838 kb/d. Over the same time, US production increased by 3,819 kb/d which resulted in the November 2018 peak.
OPEC production had a peak on November 2016 at 34,411. After that they started reducing production to offset US production and then that accelerated post November 2018 to 4,340 kb/d in March 2020 relative to November 2016.
I think the more interesting chart is the world oil production chart (four up from the last one) with the orange square. It demonstrates that with the main OPEC countries producing at max, the November 2018 peak was not surpassed. It just shows how difficult it will be to exceed that peak without the US producing at levels greater than 12,500 kb/d.
Good point Ovi. OPEC peaked in November 2016, I don’t think there is any doubt about that. Yes, I know Iran can produce a lot more if sanctions were lifted. And Libya can produce a bit more if they ever get their political problems settled… if ever. And Venezuela will eventually produce more if they ever get Maduro out of there and then, and then… However, that is likely to be at least five years down the road, likely more.
But all OPEC nations, or at least 11 of the 13, are post-peak. I would estimate that all 13 are post-peak. They will never increase their production above that November 2016 level regardless of what happens, political wise. And I strongly believe that non-OPEC has peaked as well. So that means……
Ovi and Ron,
If oil prices rise, much changes. If as Ron believes, World oil demand never returns to the 2019 level and oil prices remain under $55/bo from 2020 to 2030 (or perhaps even forever), then it is likely that peak oil will be 2018. If on the other hand oil prices rise to $70/b0 (2019 US$) or more (rising at about $2/bo per year in 2019$), by 2035 or so, then rising output by US, Brazil, Canada, Russia, Saudi Arabia, Iraq, Kuwait, UAE, and possibly Iran are likely to offset falling output from other producing nations and we will see a final peak in 2028 to 2032 (note that this is based on the conservative oil price scenario that sees oil prices rising rather slowly over the next 15 years and no higher than $70/bo in 2019$).
A higher oil price scenario might see an earlier or later peak, but my expectation is the final peak will only be 84 to 86 Mb/d for World C plus C, just slightly higher than 2018.
What matters is the World total, a couple of nations with increasing output can offset those producing nations that have decreasing output. Shock model below is consistent with the CAPP projection from 2019 for Canadian oil (where output increases due to increased unconventional oil) and my tight oil scenario with a $70/bo maximum Brent oil price in 2019 US$. Conventional oil sees a small increase in the extraction rate from producing reserves as oil prices rise, in 2018 the extraction rate was 5.6% and the scenario has a 6% extraction rate at the peak in 2031, similar level to 2006 and less than all years from 1946 to 2005, except 2002.
Ovi,
World C+C minus US C+C had a declining trend of only 200 kb/d annually from Oct 2016 to Dec 2018.
Yes US output increased a lot over this period and oil prices were fairly low (except part of 2018) on average over the period. Lower US output and/or higher oil prices would likely have led to higher output for World minus US. Lots of potential increases could come from Iran, Iraq, Saudi Arabia, Kuwait, UAE, Brazil, and Canada. Russia and US may be able to return to their previous highs as well, much depends on World economic output, oil demand and the price of oil.
Dennis
The critical issue in this discussion is where will demand be in a few years from now. The OPEC March report had world demand in Q4-20 @ 101.85 Mb/d.
The August issue has Q4-20 demand @ 95.83 Mb/d and Q4-21 demand @ 99.33 Mb/d. Similarly the August EIA STEO has Q4-20 demand @ 97.74 Mb/d and Q4-21 demand @ 101.36 Mb/d.
Those Q4-20 demand numbers are a big jump for the low 80 Mb/d demand numbers we are seeing now. Both the EIA and OPEC are projecting an additional increase of close to 3.5 Mb/d in going from Q4-20 to Q4-21.
Your chart above indicates an average supply increase of close to 800 kb/d/yr out to 2030. So the question that needs to be addressed is can all of the countries you mention, US, Brazil, Canada, Russia, Saudi Arabia, Iraq, Kuwait, UAE, and possibly Iran, make up the gap between a supply increase of 800 kb/d/yr and a potential annual demand increase of between 1.0 Mb/d and 1.2 Mb/d.
As I have mentioned previously, once we get back to the 82.5 Mb/d demand for C C, most countries will be back to where they were in Jan-Feb of this year and then the question becomes how much spare capacity did they have. The US was critical in meeting the demand increases up to end 2019. How long could it continue adding 1 Mb/d to meet the increasing world demand all on its own? There are a few of us on this site that think that the US annual supply increase was starting to roll over.
How much Sustained Surge Capacity does it have left?
Ovi,
Note that my scenarios focus on C plus C output and demand, demand for C plus C grew at about 800 kb/d each year on average from 1982 to 2019. Once the economy recovers I expect the rate of growth in demand for C plus C to be 800 kb/d or less probably from 2023 to 2030, after that prices will rise enough to reduce demand growth to the level of supply growth (roughly, the market is rarely in perfect balance). All liquids supply includes lost of other stuff such as NGPL, biofuels, and refinery gains, these are less important sources of supply much of it being propane, ethane, and butane which are less useful as transport fuel.
If demand is higher than supply then oil prices rise and more reserves are developed to become producing reserves. The $70/bo Brent oil price scenario (maximum price from 2032 to 2040) leads to the following scenario for US output. There is no reason Brazil, Canada, Iraq, Saudi Arabia, Kuwait, and UAE will not be able to raise output above there previous peak. Iran can increase output if sanctions are removed and demand is unlikely to recover as fast as the EIA and OPEC believe, it will be 2023 to 2024 before demand returns to 2019 level and the increase from there may be slow due to higher oil prices.
Chart below has a US scenario for a conservative (maximum $70/bo for Brent in 2019$ from 2032 to 2040). Note that this scenario assumes tight oil wells after March 2021 are financed from cash flow after interest payments, it is assumed debt is rolled over until it is finally paid off in its entirety by December 2032 (debt is gradually paid off over the August 2023 to December 2032 period.)
Dennis, there are two big unknowns facing us, dictating the future economics. They are the length of the virus knockdown and the depth of damage to the economy. It could be over in three or four years, as your chart indicates and it could last for two decades. And even when we do get it under control, the damage to the economy could last for decades.
So right now all any of us are doing is wild ass guessing, nothing more. Of course, there are other unknowns, like which nations have already peaked and which have a little more oomph in them. But all that does is just add to the uncertainty, making our guesses even more uncertain. We may as well be asking a soothsayer. His/her answers would likely be every bit as accurate as our guesses.
Ron,
I agree, we do not know what future economic growth might look like, there are a number of predictions by different organizations such as the IMF and World Bank, but these future scenarios are often incorrect. As to extraction of oil, there are many reputable estimates of crude oil resources, my models use a relatively conservative estimate of 2800 Gb conventional and 200 Gb of non-conventional C plus C. If you are correct about peak demand for oil due to a future dearth of economic growth, then you will also be correct about the peak date for World C plus C.
I just disagree with your assessment of the economic future for the World over the next 20 years or so, eventually economic output may peak, but it will likely occur after a demographic transition to declining World total fertility rates and eventually declining World population. I agree for the next 3 to 5 years we may not see World real GDP rise to the 2019 level, but beyond that the odds become increasingly long that we will not see World real GDP rise above the 2019 level. Likewise oil demand is likely to rise above the 2019 level by at least 2027 and possibly as early as 2025. Oil prices will rise to a level needed to balance supply with demand (difficult to know what that price level will be).
A more conservative oil shock model below (lower future peak extraction rate for conventional producing reserves of 5.7% in 2030 (in 2018 the extraction rate was 5.58% and in 2010 the rate was 5.79%, peak extraction rate was 12.1% in 1973). Peak is 84 Mb/d in 2030 for this scenario.
Best explanation of shock model in book by Pukite et al, link below
https://www.wiley.com/en-us/Mathematical+Geoenergy%3A+Discovery%2C+Depletion%2C+and+Renewal-p-9781119434337
Many University Libraries will have a copy.
Seems to me the big wildcards in supply are the political ones.
Libya,Iran,Venezuela.
Will any of these come to market in the next decade.
Iran perhaps, but their theocratic mission of regional disruption and dominance seems to be a priority over optimizing oil production/export and economic growth.
And which other exporting country is likely to be added to this failed state list over the coming decade?
Hickory,
Libya and Venezuela are already pretty close to zero output and have been declining for 5 to 10 years, I do not expect much increase (none in fact) from those nations. Iran’s decrease since 2017 has been due to US sanctions which can easily be reversed, that will depend on the competency of the US executive branch, hopefully that will change in 5 months or so.
As to other major producers becoming failed states, this cannot be predicted in advance.
I dont quite agree that Iran sanctions depend solely on a competent usa executive branch (yes that would be a breathe of fresh air), but also on the behavior of iran itself.
My point was that other non-geologic impediments to crude oil production, while unpredictable, should come as no surprise in this decade.
If it was just geology, and demand growth, I think your projections are top notch.
Thank you Hickory. I agree a competent executive is not the sole determinant for Iranian sanctions, but would be helpful in my opinion,
Certainly political events will occur and may affect oil output, some may increase output others may cause output to decrease. This is essentially an unpredictable random input to the model. These “shocks” would cause an increase or decrease in the World conventional extraction rate. They are easily added as they occur, unfortuntely clairvoyance would be needed for an accurate future scenario, not a skill I possess. 🙂
I lean towards the idea that there will be more failures among the producing states- failed governments, sanctions and trade wars, kinetic wars (fancy term for blood and twisted metal and columns of smoke), piracy and terrorism. More likely as prices of oil rise in this decade.
True it is not an optimistic stance, but that is how I run. Seen plenty of history, and human nature. Not pretty.
Hickory, yeah, my point exactly.
I know it seems almost inconceivable but there is a non-zero chance that peak-oil itself will increasingly create feedback loops of failure. I know, I know, we’ve been predicting this for a little under 3,000 years (/sarc), but things do seem a lot more wobbly than they did in 2007. Also different, peak oilers aren’t the only ones who are noticing this. Most people I know sound like me in 2005.
Twocats,
Current pandemic and lack of leadership leads to pessimism.
There are plenty of challenges, could lead to positive or negative changes, it will be some of both.
Any discussion of this link might be best conducted in the non petroleum thread, but the guys IN the hands on oil business might want to think about it unless they’re not too far from retirement age.
https://www.bloomberg.com/news/articles/2020-08-16/oil-companies-wonder-if-it-s-worth-looking-for-oil-anymore?utm_source=pocket-newtab
OFM
This article was posted in Ron’s OPEC post earlier this week. It is not behind a paywall here.
https://www.bnnbloomberg.ca/oil-companies-wonder-if-it-s-worth-looking-for-oil-anymore-1.1480762
That article cites the “energy transition” now underway and “peak demand.” Those are nice narratives–but they are not real. Fossil fuels generate the same % of world electricity as 25 years ago; oil demand increases every year. Our dependence on oil has been highlighted by Covid-19. Projections in April and May suggested world liquids consumption would drop by 25 to 30 million bpd. The actual drop was much less–something on the order of 10 million bpd. There are lessons in the Covid-19 experience about what oil demand will look like when oil passes the $100 mark, which it inevitably will. All the agriculture necessary to feed 7 billion people, all the plastics required to produce I-phones and a million other things people can’t comprehend living without, require oil. I’ve been an oil producer for decades–the time to buy is now, while blood is in the streets. This is hardly the first down cycle for oil prices.
Is there a reliable overall consumption number out? I look pretty hard for these things and all I have seen is declarations that China consumption has returned to levels of December 2019.
Watcher,
We have OPEC and IEA estimates for consumption, as to reliability, it is what we have, BP annual estimates may be better, but we won’t see 2020 numbers until next June.
Check Table 3a in the STEO PDF file for a quick summary. More details in the STEO Excel files.
The STEO expects the world will be back to almost normal by end 2021. Are they betting on a vaccine?
Just a quick hypothetical.
People who couldn’t afford fuel-who couldn’t compete with western economies for any proportion of the global fuel pie, and made do with beasts of burden and wood-dung fuels- find that a stable amount of fuel at a stable price is suddenly available. It would make sense to them for heavy equipment, chainsaws, concrete- any place they can justify the investments to use that fuel.
My guess is that the fuel is going to places that didn’t have access before. Western economies will continue to use less, but fuel that can be produced at a cost these new users can afford (or that is produced and sold below cost to keep the oil flowing) will find a ready market.
Indeed Lloyd.
I’d offer up a slight distinction in groupings.
Rather than West vs East, or North vs South, First world or Third,
we now have a more complex world, and the ability to buy oil, or cell phones and chain saws for that matter, can now be divided up into the
‘haves and have nots’.
There are over 1 billion cars in the world today.
This division knows no borders, no race, no age, and no ideology.
Since 1 liter of gasoline has the equivalent energy of approx 9 men full days hard labor, people will value petrol indefinitely, and will be willing to pay large amounts of money for it. Of course as it gets more expensive, they will increasingly think long and hard about using it for frivolous purposes, or wastefully.
Just how much does it cost (ten years after peak) to drive to golf course, the ball game, the casino, the dry cleaners?
Electric motors are cheaper than gas motors. Electric scooters are cheaper than horses, and cheaper than gas scooters. Electric lighting is cheaper than kerosene. Used EVs are cheaper to operate than used ICEs.
There is a transition problem, with substantial delays in making electric alternatives available in developing countries, but fundamentally:
It’s cheaper for the very poor to skip over the FF era.
Nick, you are absolutely correct. Electric motors are cheaper than ICEs in every case. But….
The source of energy in ICEs are in the vehicle with the ICE. The source of energy for electric vehicles is in some power stations on the grid. That is the difference. Production and storage are still the major problems with renewable energy. A problem you have not yet solved. Not saying that you will not solve that problem, but just saying that you have not yet solved that problem… especially the “storage” part.
EVs don’t have quite as much range as ICEs, yet, but a 250 mile range isn’t bad (Chevy Bolt).
And we were talking about the needs of lower income drivers. New ones are cheaper to own and operate, and used ones will be sharply cheaper to own and operate.
PV with Li + battery storage. Just enough to charge your vehicle overnight. Not cheap and it only works under certain conditions and circumstances. But those for whom it does and who can afford it there is little excuse for not doing it.
Nick, it is going to take a long time to replace the fleet of 1 billion ICE cars, not to mention the trucks, buses, trains, planes and boats of the world, regardless of the improved efficiency of transport electrification.
Petrol consumption at massive quantity is baked in the cake for a decade or two (regardless of projections or desires to the contrary).
I agree, that’s likely. It doesn’t have to happen, but it’s likely.
We can each make a small but significant difference in making the transition faster.
At some point there will be a transition away from oil as output peaks, I agree that oil prices will rise and there may be a lot of profits in oil in the future. After 2035 we might see declining demand, I would sell out before we get there, if I owned oil assets.
So called renewable will just be addons to fossil fuel economy. Well at least for a little while they will be. Monetary system is going to fail globally. It’s the debt that the issue. Not the government debt. They absolutely no intentions of ever paying it down much less back. $30 trillion doesn’t matter one bit it’s going to double and then double again. Unless system fails first.
It’s all the private and corporate debt that is the issue. In order to pay debts back plus interest. You need two things. Growing energy consumption and growing credit creation. AKA economic growth. You can’t consume what you don’t have. And you have to always have more and consume more than you did before. Otherwise debt can’t be paid back plus interest.
Banks aren’t making money with low interest rates. They are making money by buying assets frontrunning the FED. Flip them to the FED. Banks have no reason whatsoever to lend money out right now. Certainly not to Shale oil companies. Only reason any bank would loan to a Shale oil company is knowing the FED was going to buy the debt. I don’t see pension funds lining up to buy that debt going forward from here either.
You know after 2009 at least we had growing oil production. Growing renewable energy just isn’t going to be enough. A lot of fossil fuel will have to be diverted from elsewhere just to build it out.
And i have no idea what kind of a system it will be or how it would work when loans are no longer made. Why make loans if they can’t be paid back with interest. Think about that for a minute. A system with no credit. No borrowing from the future. Long-term that is what see.
Short-term. The longer we trade sideways (markets) and the longer we have not enough growth the closer we get to an insolvency crisis where private and corporate debts defaults go to unthinkable levels. Economy needs Covid to disappear in a hurry or we will get an insolvency crisis.
I’m going to hold my long oil position regardless. Price goes back to $100 from the price i bought at i’ll retire. Don’t matter how long it takes. There will be a whole lot of demand that governments step in and do something from here on out.
Oil can get back to $100 just on monetary supply expansion alone.
The “peak demand” narrative is getting an awful lot of play in the financial media recently, including the oil and gas financial subsection.
If we take Gail Tverberg and Art Berman equally seriously, both indicate a tight correlation between growth in oil consumption (implying demand growth) and GDP growth. The “R-squared” (don’t ask me how that’s calculated) said to be very high for the correlation.
So, the “peak demand” narrative can be boiled down to “peak standards of living” in the global industrial economy, coupled with “steady living-standard decline.” The USA is already in a decades-long secular stagnation status, resulting in the worst inequality of wealth, income and political power that America’s “non-elite workers” (as Tverbeg calls us) have experienced in our nation’s history.
The financial press writers should be careful what they’re wishing for methinks.
Correlation is seriously not causation. Oil demand has been growing along with GDP because there have been no constraints on oil production.
Lead, asbestos and mercury production used to grow with GDP, and then we realized they were toxic. And then they didn’t grow with GDP.
Horses, and horse manure, used to correlate with GDP. Urban planners in the 1880’s were deeply concerned about hitting limits to growth due to choking on horse manure. And then…it stopped correlating.
There’s a moral here: too much of a good thing. Horse manure, in reasonable quantities, is a fertilizer. Nothing but good. Oil, in reasonable amounts, is enormously useful. But too much is bad for us, and we’re discovering that we have to transition away from it for our own good.
What’s the thing that’ll keep GDP going up, or as you like to call it, “grow with GDP”, once fossil fuel production begins to decline? What’s gonna grow with GDP after fossil fuel? No Mother Goose moral tales please. Maybe try Disney.
That’s a long and complex discussion (just look at all the discussions on “the other side”). I’ve think you’ve heard most of it. It can be summarized with “efficiency” and “substitution”.
Keep in mind that most of GDP is services, which can be expanded either in volume or quality (either counts towards GDP growth) with very little additional energy (think engineers, doctors, and lawyers working on 10W laptops). I can hear a question about internet and server electricity consumption: yes, it’s significant, but it can be made much more efficient, and it can come from renewables.
The smartest people in the business or just dummies .
https://wolfstreet.com/2020/08/21/shells-new-12-17-billion-largest-ever-floating-facility-shut-down-months-after-shipping-first-lng-cargo-made-uneconomical-by-long-plunge-of-lng-prices/
Matrix of Oil and Gas Bankruptcies Jan to June 2020
In this Article https://www.zerohedge.com/markets/us-default-bomb-goes-2020-will-have-record-number-large-corporate-bankruptcies
Exxon dropped from Dow Jones Industrial Average. Several others. It derives from Apple’s split. Not really significant.
Significant is the Exxon stock performance, no higher today than in 1998. 22 years.
Meanwhile s & p 500 has almost tripled (2.9 x’s) in that time.
I suppose the lack of any value growth of the company over the last couple decades means that the price of oil and gas was just too low for it to prosper.
Would have been better to save the resource until it was needed more (and thus at least a little bit profitable)?
Maybe the next ten years will be better.
Watcher
Why is there a connection between the Apple split and XOM. Three stocks were dropped and three were added.
It has to do with market cap and how the increase in number of shares in APPL changes the divisor for the entirety of the DJIA. To make the numbers work out in the definition of the index it was better to pick up other companies from the same industrial sector than those that already existed, and dropped.
APPL move changed stock price weighting and made tech 20% of the share defined index. Prior to split 27ish%. So shuffling necessary. Chevron remains. Could have been a coin flip. Not really a compelling reason to have both
Watcher
The DOW is not market weighted. It is the sum of the stock price multiplied by a factor. Originally in 1890s it was the sum of the stocks. When new ones are brought in and an old ones dropped, the DOW needs to add a multiplier to the stocks so that the index is the same as the day before.
My original thought when I asked the ? above was that when Apple split 4 for 1, they would change the factor by 4. Looks like they could not do that, not sure why. So they brought in the others to get teck up to 23%.
It looks like the picture of peak is really starting to develop. Even with Dennis’ projection that the world may ultimately peak higher later in the 2020’s he is still talking about not that much higher a peak. We are on the undulating plateau. To me the question really is (when you step back and look at the overall mountain) when do we start down the back side of the mountain and get off the plateau? The plateau is great because we (hopefully) can keep life stable but the problems really begin when the relentless slide begins. The backside of the mountain is what scares me and I think it could surprise us as being closer than we think given how old the super giants are.
Karen
well said Karen.
Karen,relevant to your observation . The end of the super giants.
https://damnthematrix.wordpress.com/2019/05/16/ants-and-what-it-means/
Thanks Hole in Head for this article. However, you will notice it refers, often, to figures 1 through 6, but figures 1 through 6 are nowhere to be found in the article. I found them. They are from Steve’s blog, The SRSrocco Report.
THE END OF THE OIL GIANTS: And What It Means
Great article. I would be interested in getting other’s opinion on this article.
Ron,thanks for filling in the gaps . You sir, are a gem .
Tom Murphy had a physics blog devoted to energy issues, called Do The Math. He describes very well the “Energy Trap” as he calls it, and i found it a sobering read.
This was written in 2013, and i wonder how the ideas he described have aged since then?
https://dothemath.ucsd.edu/2011/10/the-energy-trap/
Many Do the Math posts have touched on the inevitable cessation of growth and on the challenge we will face in developing a replacement energy infrastructure once our fossil fuel inheritance is spent. The focus has been on long-term physical constraints, and not on the messy details of our response in the short-term. But our reaction to a diminishing flow of fossil fuel energy in the short-term will determine whether we transition to a sustainable but technological existence or allow ourselves to collapse. One stumbling block in particular has me worried. I call it The Energy Trap.
In brief, the idea is that once we enter a decline phase in fossil fuel availability—first in petroleum—our growth-based economic system will struggle to cope with a contraction of its very lifeblood. Fuel prices will skyrocket, some individuals and exporting nations will react by hoarding, and energy scarcity will quickly become the new norm. The invisible hand of the market will slap us silly demanding a new energy infrastructure based on non-fossil solutions. But here’s the rub. The construction of that shiny new infrastructure requires not just money, but…energy. And that’s the very commodity in short supply. Will we really be willing to sacrifice additional energy in the short term—effectively steepening the decline—for a long-term energy plan? It’s a trap!
.
.
For resources that do not require substantial up-front cost in the form of infrastructure, the trap does not apply. Fossil fuels tend to be of this sort. The energy required to deliver a barrel of oil or a ton of coal tends to be specific to the delivered unit, and is not dominated by up-front cost. It is similar for tar sands, which requires substantial energy to heat and process the sludge. Even at 5:1 EROEI, filling a 2-unit gap can be achieved by producing 2.5 units of output while losing 0.5 units to investment. Thus it is possible to maintain a steady energy supply. The fact that fossil fuels don’t trap us encourages us to stick with them. But being a finite resource, their attractiveness is the sound of the Siren, luring us to stay on the sinking ship. Or did the Sirens lure sailors from ships? Either way, fossil fuels are already compatible with our transportation fleet, strengthening the death-grip.
Conversely, solar photovoltaics, solar thermal, wind, and nuclear, are all ways to make electricity, but these do not help us very much as a direct replacement of the first-to-fail fossil fuel: oil. This is a very serious point. As Bob Hirsch pointed out in the 2005 report commissioned by the Department of Energy, we face a liquid fuels problem in peak oil. As such, not one of the five immediately actionable crash-program mitigation strategies outlined in the report represented a departure from finite fossil fuels. The grip is tight, indeed.
We must therefore compound the Energy Trap problem if we want to replace oil with any of the renewable sources listed above, because we need to add the energy investment associated with manufacturing a new fleet of electric vehicles of one form or another (plug-in hybrid qualifies). This can’t happen overnight, and will result in a prolonged transportation energy shortfall even greater in magnitude than depicted above.
.
.
In the parallel world of economics, an energy decline likely spells deep recession. The substantial financial investment needed to carry out an energy replacement crash program will be hard to scrape together in tough times, especially given that we are unlikely to converge on the “right” solution into which we sink our bucks.
Politically, the Energy Trap is a killer. In my lifetime, I have not witnessed in our political system the adult behavior that would be needed to buckle down for a long-term goal involving short-term sacrifice. …
very important points stated in the Tom Murphy story you post GerryF,
with one important caveat regarding this paragraph-
“Conversely, solar photovoltaics, solar thermal, wind, and nuclear, are all ways to make electricity, but these do not help us very much as a direct replacement of the first-to-fail fossil fuel: oil. This is a very serious point. As Bob Hirsch pointed out in the 2005 report commissioned by the Department of Energy, we face a liquid fuels problem in peak oil.”
In 2005 electric vehicle transport was not viable/cost competitive.
Now it is.
We can gradually transition from liquid fuel to electricity for transportation. At least to a considerable degree, if collectively we choose to. Depends on policy and being awake.
Most people tend to jump to a position of all or none, which doesn’t generally reflect the situation in reality.
Oil isn’t going to just disappear in 2018 or 2028 (peak).
Electric vehicles aren’t just going to replace all ICE one sunny day.
There can be a very long and doable transition time.
For example-
The american average drives 29 miles/vehicle/day.
Today, you can purchase (base price 28.8K) a small suv that has a 600 mile combined range.
Thats 538 miles petrol, and 42 miles electric.
The electric is used first, and so most people could do most/much of their driving without petrol, and yet still go on a cross country trip when they need to.
If vehicles like this were common, the oil reserves of this country would last for much longer.
The tools and potential are on deck, here and now.
-the vehicle I referenced in the toyota RAV4 Prime.
Any of the major automakers could make a vehicle with this capability this year.
https://www.motortrend.com/news/2021-toyota-rav4-prime-review-specs-interior/
Tom Murphy’s first numeric example is
Let’s say that our nation (or world) uses 100 units of fossil fuel energy one year, and expects to get only 98 units the following year. We need to come up with 2 units of replacement energy within a year’s time to fill the gap. If, for example, the replacement:
has an EROEI of 10:1;
requires most of the energy investment up front (solar panel or wind turbine manufacture, nuclear plant construction, etc.);
and will last 40 years,
then we need an up-front energy investment amounting to 4 year’s worth of the new source’s output energy. Since we require an output of 2 units of energy to fill the gap, we will need 8 units of energy to bring the resource into use.
Of the 100 units of total energy resource in place in year one, only 92 are available for use—looking suddenly like an 8% decline. If we sit on our hands and do not launch a replacement infrastructure, we would have 98 units available for use next year. It’s still a decline, but a 2% decline is more palatable than an effective 8% decline. Since each subsequent year expects a similar fossil fuel decline, the game repeats. Where is the incentive to launch a new infrastructure? This is why I call it a trap. We need to exacerbate the sacrifice for a prolonged period in order to come out on top in the end.
..
Another aspect of the trap is that we cannot build our way out of the problem. If we tried to outsmart the trap by building an 8-unit replacement in year one, it would require 32 units to produce and only dig a deeper hole. The essential point is that up-front infrastructure energy costs mean that one step forward results in four steps back, given EROEI around 10:1 and up-front investment for a 40 year lifetime. Nature does not provide an energy financing scheme. You can’t build a windmill on promised energy.
We can mess with the numbers to get different results. If only half the total energy invested is up-front, and the rest is distributed across the life of the resource (mining and enriching uranium, for instance), then we take a 4% hit instead of 8%. Likewise, a 40-year windmill at 20:1 EROEI and full up-front investment will require 2 years of its 2-unit gap-filling contribution to install, amounting to an energy cost of 4 units and therefore a 4% hit. It’s still bigger than the do-nothing 2%, which, remember, is already a source of pain. Anyone want to double the pain? Anyone? Elect me, and that’s what we’ll do. Any takers? No? Wimps.
… and Tom Murphy’s second example:
When France decided to go big on nuclear, they built 56 reactors in 15 years. In doing so, they replaced 80% of their electricity consumption, which translates to about 30% of their total energy use. So this puts them at about 2% per year in energy replacement.
..
Let’s imagine a more realistic trajectory for the replacement effort. In our scenario, the world faces a huge crisis, so we could perhaps outperform France’s impressive nuclear push and ultimately replace energy infrastructure at a rate of 4% per year. But it takes time to get there. If it takes 10 years to ramp up to full speed, we have the situation seen in the following graph.
The energy investment still forces us to steepen the decline, initially looking like a 3.2% rather than a 2% decline. But it’s not as jarring as a sudden 8% drop. On the other hand, we fall farther before pulling out, bottoming out at >14% total drop around years 8–9. It takes more than 10 years to make out better than the do-nothing approach in terms of net energy loss. A table corresponding to the plot appears below for those interested in poring over the numbers to figure out how this game is played.
..
Note that anywhere along the path, a cessation of the replacement effort will bring instant relief. For example, at the beginning of year 6, having installed 6 units of replacement energy up to that point, abandoning the effort will see 88 units of fossil fuel plus the 6 units of replacement for a total of 94 units. This would be a considerable step up from the previous year’s 88 units of available energy, and an even larger apparent gain over the 86.8 units that would be available under a continuation of the crash program. Likewise, if one stopped the program at the end of ten years, the installed 22 units of replacement would complement the eleventh-year fossil fuel amount of 78 units to bring us back to a peachy 100 units—like nothing had ever happened, and far better than the 88 units that we would otherwise endure under a continuation of the program. But stopping renews the dangerous decline. The point is that there will always be a strong temptation to end the short-term pain for immediate relief.
When i first read Murphy’s blog years ago, I assumed that the likely scenario was that we’d start ramping up coal production.
There’s lots of it.
Climate change is a ‘future’ problem, heating my home isn’t.
I thought that many governments would rather lessen the pain now, while they’re in office, and push the pollution, GHG emissions, etc., down the road onto someone else.
I’m not sure what i think now. The numbers for solar/wind are encouraging, but are they enough to get us out of the trap?
I had hopes that nuclear would see a resurgence, now that there are new and safer and better technologies, but that seems a way off as well.
From Tom Murphy again…
As mentioned before, the Energy Trap is a generic consequence of modest-EROEI sources requiring substantial up-front investment in energy. We would need the EROEI to be equal to the resource lifetime in order to have a null effect during the decline years, or better than this to ease the pain or allow growth. For a 40 year lifetime (e.g., power plant, solar panels, wind turbines), this means we would need 40:1 EROEI or better to avoid the trap. Our alternatives simply don’t measure up. Curses!
Karen,
Consider following chart with log scale for World C C output. If we call plateau 76 to 84 Mb/d, that would be 2012 to 2038 for the scenario presented. The average annual decline rate from 2038 to 2110 is 2.8% for this scenario. Note that coal, natural gas, nuclear, wind, solar, geothermal, and biofuels are all potential energy sources that could increase in output to account for any deficit. Better energy efficiency and a decrease in average total fertility rate (eventually leading to lower human population worldwide) will also help to reduce energy use.
When conventional plateaued beginning in 2005 the prudent thing to do would have been to carefully manage all of what was left to give us the most preparation. Instead we went on a tear of extracting and burning everything as much as a we could as fast as we could for 15 years. I hate that the Saudis have kept us in the dark with what is internationally vital information. But of course most people don’t even realize any of this. As Nate Hagens says – People are energy blind. I agree with the article that our backside slope may be a Seneca Cliff.
Ugo Bardi- Seneca
“increases are of sluggish growth, but the way to ruin is rapid.”
Karen
Karen.
To most people in the USA, food comes from the grocery store and gasoline comes from the gas station.
I live out here in the middle of nowhere where food and fuel are produced. They are actually laying off people at our petroleum refinery, first time since the 1980s.
The layoffs were short sighted then and IMO they are now.
I agree Karen. I’m quite interested in China’s decline profile; by my Mark 1 eyeball it looks to be a drop of 13% in about 2 years, give or take. Should either KSA, USA or Russia experience a similar magnitude and rate of decline then times will likely get a little tough. Imagine if all three popped like that in unison. It’d be a bloodbath.
Survivalist , I hiccuped when I read your post . If this happens then it is FUBAR . Just thinking about the three candidates you have mentioned :
1. USA: The shale story is over . It was about 5.5 million barrels per day . It will vanish real fast as oil prices will remain low (Ron and me have a bet against Dennis on this )
2. KSA : Ron has practical experience and says the ^Saudis lie thru their teeth ^ . So does Matt Mushalik who bought out the misreporting of supply when the Yemenis droned the Abaiqe refinery . They sell from inventory and show it as production . Smoke and mirrors .
3 . Russia : Their oil minister has already said there is no scope to increase production . Most of their production is coming from horizontal drilling adopted after the collapse of FSU . That means almost 30 years . The oil wells must be pretty well creamed by now .
All are requested to chime in .
Yes – That is the fear. Declines of multiple large producers. I have been reading your posts and conversations for years but I am surprised how little discussion there is about these enhanced drilling methods and how they can keep flow rates up but must inevitably lead to a total collapse in a field. So the appearance of plenty of oil in a field is kept up until the very last minute and then they crash big time and not just a gentle decline for a long time.
Karen
Karen, I think the decline rate issue got shoved on the sidelines by the shale oil “fraud” . Now that the fraud is exposed hopefully we will get back to sane issues that actually prevail in the real world of oil . Wake up call .
Karen,
The most mature large oil producing nation is the US, we have never seen such a crash in conventional oil output in the US, we might see it in offshore fields, but I doubt we will see multiple large producing nations crash simultaneously.
A straight flush can happen, but it’s not smart to bet on one at the start of a hand.
Well, yes, many of our fields have crashed. Prudhoe Bay crashed, just as all giant fields must crash. And many have, like Cantarell. The huge East Texas oil fields are now a shadow of their former glory. Most supergiant fields in Asia and Russia have peaked and are now either on a plateau or have started to decline, like Ghawar.
Thanks for that graphic Ron. China’s big drop has been on my mind for a while. I would imagine it’s quite a mix of fields and factors that they have. China’s national production profile demonstrates that a 13% decline in 24 months is a possibility; to wit, it happened to them. If it is repeated, even closely, by any of the big ones, we’re gonna feel it hurt. I like this dudes June 2020 update.
https://crudeoilpeak.info/china-peak-oil
China has many small fields and one supergiant, Daqing. Daqing began its collapse in the late 1990s. All supergiants collapse sooner or later. The vast majority are either on a plateau or are already in collapse like Daqing.
Survivalist,
Yes China saw a big drop in output when prices crashed in 2015 to 2017.
About an 11% average annual output decline in C plus C output from Sept 2015 to Sept 2016. From Oct 2016 to May 2020 average annual Chinese C+C output has risen slightly at an average annual rate of increase of 0.12% per year, basically flat output for 3 years and 7 months.
Ron,
Chart below has natural log US C plus C output minus tight oil so we can see decline rate. Data from EIA for US C plus C and tight oil from Jan 2000 to Dec 2019. The average annual decline rate over that 20 year period was about 1% per year for the most mature oil producing nation in the World with the most aggressive drilling program on the planet.
Dennis, you have US C+C, minus tight oil, at over 8.4 million barrels per day. That cannot possibly be right. I am assuming the Y scale is in million barrels per day. Otherwise I cannot imagine what it is.
Ron the chart is the natural log of US C plus C minis tight oil so we can see decline rate. Chart below is in kb/d with an exponential trend line to show the average annual rate of decline (1.1%), it is the exponent on the exponential function.
To edit comment you click save to post the edited comment.
Ron,
The chart below reflects the “crash” in Prudhoe bay output and its affect on US output from 1990 to 2005 (before tight oil was important).
Average annual decline rate is about 2.2% per year.
Ron this last chart may reflect the impact on US output of some of the large Texas fields crashing, I subtract Alaskan output so the ramp up of Alaskan output in the 1980’s does not hide the decline. The period is 1971 to 2005, before tight oil became important. Average annual decline rate for US minus Alaska C+C output is about 2.2%.
Individual fields might crash in output, but typically this does not happen for the nation as a whole except where most output from the nation is from offshore fields (UK, Norway, and Mexico are all examples).
In reply to this:
The chart below reflects the “crash” in Prudhoe bay output and its affect on US output from 1990 to 2005 (before tight oil was important).
Average annual decline rate is about 2.2% per year.
Average decline rate is 2.2% per year? So what is that supposed to prove? That Prudhoe Bay did not crash? Or that giant and supergiant fields never crash?
Dennis, when you post total US production you are mixing all US fields, some declining while others may be increasing. That makes it impossible to see individual fields and/or their decline rate.
Prudhoe Bay production collapsed just like Daquing collapsed. That is just what all supergiant fields eventually do.
Chart for Mexico, Norway and UK, 2005 to 2019, decline rate averaged about 4.3% per year, higher for first half at about 6.2% and then lower over second half of this period, about 2.6%.
A problem with this new format. Cannot edit comments. You get edit but how do you post it?
At any rate, what I wanted to add: Your chart starts at the year 2020. Prudhoe bay and East Texas crashed way before that. Therefore your post simply sidesteps my post and moves way past it in order to show a lower decline rate. Also, when you show the decline of an entire nation’s decline rate, that masks any much faster decline of any individual fields within that nation.
Ron,
Yes individual fields can decline very quickly, often we do not have data for individual fields. The point is that when you add all the fields up, the decline rate is not that high. I don’t care what happens in individual fields, it is total oil output that is important. There are nations that have seen fast decline, but for most large producers with primarily onshore output the decline rate has been about 2.2% as shown by the US data.
You wrote: To edit comment you click save to post the edited comment.
I would be glad to do that if those words appear anywhere on the page.
Ron,
You have to log out of wordpress dashboard for it to work properly.
I updated plugin hoping to solve the problem with comments, we could try some other editor, but it works fine if one is not logged in to WordPress.
Amazed at the 86% RF for East Texas field up above. I would think with all of the well control that the original oil in place is pretty well constrained and this 86% is a pretty reliable number.
It suggests to me that almost all of the mobile oil at East Texas field has been produced, and maybe even some of the residual oil. I suspect a field as big as East Texas has had, over the years, numerous EOR/IOR projects.
I’m curious if anyone has any good references comparing field size with recovery factor. I suspect bigger fields have better recovery factors because they can support more drilling, water injection, 3D seismic, EOR/IOR projects, etc.
Note that I have been able to edit and repost my comments.
Problem with website.
Do not post comments as a backup restore is in process. Sorry some comments will likely be lost.
Testing for Dennis
Somebody broke something
Why has the comments section vanished ?
60 comments but zero showing? Anyone seeing this?
OT:
comments not visible.
Is it just me?
Might be fixed
Hopefully comments are working again! Just read this great article about oil, Russia, Putin and sanctions. Explains Russian interference in the elections. http://energyskeptic.com/2020/maddows-blowout-russian-peak-oil-corruption-fake-news/
Don’t believe in Peak Oil? Then you must read thes. Bold mine.
The End of the Oil Age Is Upon Us
A new report suggests that over the next 30 years, at least 80 percent of the oil industry will be wiped out.
SNIP
I obtained the draft manuscript, titled Energy and Power Futures, from the authors earlier this year when it was first finalized in January—just before the COVID-19 pandemic came on the scene. Villamizar’s forecast placed “the start date of oil’s decline at around 2020”—described as a “tipping point” for world oil production which, from then on “will go down. Nowhere in sight is the possibility of going over the all-time production high of 35.7 billion barrels per year (or 100 million barrels per day) beyond 2020.”
That’s where I stopped reading.
Yes, it can be mostly due to demand destruction, but the market reacts to subliminal signals that TPTB will try to rationalize away or ignore.
Climate scientists and government activists will take credit as being due to climate change mitigation efforts as that is preferable to pointing to something that they can’t control — the obvious depletion of crude oil reserves.
Paul,
There are some oil reserves that remain, whether they are vast or not depends in part on demand for oil. About 1350 Gb have been produced (C plus C only), if we assume unconventional oil (tight oil and oil sands) potentially could be 500 Gb (this was Laherrere’s estimate back in 2012) and conventional C plus C URR is about 2800 Gb (a 2018 estimate by Laherrere was about 2700 to 3000 Gb), we would have about 1950 Gb of proved plus probable (2P) reserves remaining. Of course at 30 Gb per year of oil produced for 10 years and then linear decline over 28 years (2030 to 2058), for a simple trapezoid scenario we would be out of oil in 2058. So only moderately “vast”. Some (USGS for example) claim the unconventional resource may be 1000 Gb, that would lead to a different scenario.
The point is that if one considers 1950 Gb of oil resources to be “vast”, then the resources may be vast (synonym is large or immense), which is not the same as unlimited or infinite.
Correction, cumulative World C plus C output through the end of 2019 was about 1395 Gb, so about 45 Gb more than my comment above so remaining 2P reserves would be about 1900 Gb assuming a total URR of 3300 Gb, note that my typical scenarios assume only 200 Gb of unconventional oil resources will be extracted due to falling oil demand (not 500 Gb) so the URR for World C C is about 3000 Gb in those scenarios, with about 1600 Gb of resources remaining after 2019.
Dennis, does the 1900 Gb number include or exclude the 100’s of Gb of exaggerated (non-existent?) Middle East reserves?
Frugal,
Based on Laherrere’s estimate for World conventional oil URR of 2700 to 3000 Gb from 2018, combined with earlier estimates (circa 2013) for extra heavy oil (mostly produced in Canada and Venezuela) of about 500 Gb. I use 2800 conventional and 500 unconventional to arrive at 3300 World C plus C URR.
See link below for Laherrere’s 2018 paper
https://aspofrance.files.wordpress.com/2018/08/35cooilforecast.pdf
for earlier forecast for extra heavy oil see page 24 Figure 36 at link below
http://aspofrance.viabloga.com/files/JL_2013_oilgasprodforecasts.pdf
Note that in the 2018 paper this estimate for extra heavy oil was revised to 200 Gb, that’s what I use for my Shock model with a URR of 3000 Gb.
None of these estimates include the inflated OPEC reserves, they use 2P reserves which is the best estimate by petroleum engineers.
Frugal,
Short reply to your query, my estimate excludes the inflated OPEC reserves.
“This drop in demand means, of course, that global oil production will also decline because it is no longer needed.”
The article is suggesting that production won’t increase because the demand won’t be there and we will gradually transition away from oil as it’s not needed.
Essentially, oil has peaked, but who cares as we won’t need as much as we smoothly transition away from it. Kind of makes “peak oil” a moot point, and not a pending global disaster as is often discussed here.
Is that your opinion as well Ron?
Dennis said the original WordPress blog theme may have caused comments to go missing after an update. He changed the theme to another one which caused the look to change, but at least the comments are back.
Working to see if there’s a permanent fix.
Hi All,
A change in the look of the website as the old theme is broken and I could not find an update.
Paul may be able to get the new theme to look a bit more like the old one as he actually knows a bit about software and I know only enough to get me into trouble. 🙂
Dennis , I am usually at odds with you ,but nothing stops from appreciating the work and effort that you put in to keep this forum active . Greatly appreciated .
hole in head,
A team effort, I had a lot of help from Ovi, Ron, and Paul Pukite to get things back up and running.
My apologies for the problems, I was on the road and it made it difficult to address the problem quickly.
The new look works – has the same functionality for the reader. You can leave it this way for all I care.
Dennis
Congrats. It is looking good right now. ??????????.
Ovi,
Thanks for your assistance getting things back in shape.
Government Agency Warns Global Oil Industry Is on the Brink of a Meltdown
A government research report produced by Finland warns that the increasingly unsustainable economics of the oil industry could derail the global financial system within the next few years.
This is a good read. Essentially peak oil will happen once peak credit does. And that will happen…? But it gets more likely every day.
Thanks for the upkeep on the site. Get a paypal donate going. Keep Ron in the black, so to speak.
Survivalist,
The money to keep the site running comes from me for the past couple of years, for the first 5 years or so (I forget the exact date) it was all Ron.
Ovi, Ron, Islandboy, George Kaplan, and Paul Pukite has been critical for content at the site.
You guys should pass the hat once in a while, imho. I’m sure it’s a chore here. This place is frickin’ gold for awesome articles, and the comments are for the most part quite exceptional compared to comment threads elsewhere; the deeper end of the pool, so to speak. A few bucks to pass around might up the sites game too; maybe buy some oil data reports or something.
If there’s one thing I’ve learnt from POB, it’s that there are folks writing stuff online for free that is better than the stuff being written by a lot of the other folks who expect to get paid for it.
Thanks survivalist.
I may do that, but it might turn some people off. I suppose I could keep it low key.
Comment from Shallow S.?
From the Platts rig count:
“Another three-rig decrease in recent days came from Salina, a small niche play in Kansas, which in July and early August only had one to four rigs running.
But in mid-August, the play’s rigs jumped to six from two, held at six for two weeks, and in recent days plunged to three, Matt Andre, an analyst with S&P Global Platts Analytics said.
“It was more of a surprise that it increased to six rigs [earlier this month] rather than falling back to three,” Andre said, since drilling there is carried out by vertical-only rigs, which suggests it is not an unconventional play.
Greenbub,
My understanding is that shallow sand has not completed a new well for many years, maybe since 2015, in the current oil price environment we would expect very few new onshore wells completed in the US, though no doubt we would need a few rigs for workovers on existing wells and for water disposal wells and such. Shallow sand could probably offer much more intelligent analysis of the US onshore conventional oil outlook at oil prices under $45/bo.
The short story is the outlook is not good.
Greenbub.
I don’t know specifically about the rigs referenced in Kansas.
We have not drilled and completed an oil well since the third quarter of 2014.
I am not aware of any wells being drilled in our field in 2020. There have been a few 2015-19.
Many conventional plays are under secondary or tertiary production, and it could be that not only production wells, but possibly injection and/or disposal wells were being drilled. Just speculating.
In our field it has not been economic to drill new wells generally since prices crashed in late 2014.
2018 WTI averaged $65. It was a good year financially for us. 2019 WTI averaged $56. It was ok. 2015, 2016, 2017 and 2020 have been among the worst we have had since 2002 and prior.
2020 could be our worst year. Will depends on whether prices hold or rise some more.
Thanks Shallow sand.
Always nice to hear from someone who knows what’s going on in the real oil fields of the US.
I imagine I am not the only one who appreciates you sharing your knowledge.
Dennis.
A little more information.
The largest company in our field still has most of its wells shut in. Really don’t know what is going on there. The same thing with regard to the largest company in the field to the S of us.
When I say largest, both are by a good amount. The one in our field was producing around 800 BOPD. That I hear is now under 100. The next largest in our field is at around 300, followed by us at just below 200, one at around 150 and several from 50-100.
In the field to the S, the largest operator was over 1,000, with no others much over 100.
I do know both of these companies have problems with employee turnover. I think that is because they both require much larger workforce’s than the rest. There just aren’t a lot of experienced workers left. Both laid off a lot of people, and it could be they are having trouble getting them, or replacement workers back?
Of course, it could also be financial? I don’t know what the financial situations are. I do know the largest company here didn’t have debt going into the late 2014 crash. They have owned the production for a long time, bought when prices were low and paid off the debt when prices rose 2005-2006.
Things are really bad in the oilfield around here. But we are nearing $40 per barrel, which is more than our overall expenses. But not by much. The problem is the future is more bleak than I can remember. COVID plus anti-oil sentiment = poor outlook.
Nothing has sold here. Banks absolutely will not take leases as collateral.
Thanks Shallow Sand. Eventually I expect the pandemic to subside and oil prices may rise to $50/bo at the wellhead in your field (perhaps by the end of 2021). I would think there would be some unemployment that might lead to some workers being available (though they would need to be trained) so it is surprising that companies would have trouble finding workers. What is the unemployment rate in your area these days?
Idk what the unemployment rate is.
There are untrained workers.
But untrained workers aren’t going to help to reactivate hundreds of wells.
In the late 1990’s crash, hundreds of wells were shut in. From 2000-2005 these were mostly reactivated. But many had to be pulled, most of the down hole equipment had to be replaced.
So these companies will be looking at real problems the longer they keep the wells down.
4 weeks didn’t hurt us. But these companies have a lot of wells that have now been shut in for four months.
Some of our best wells are ones that were shut in during the late 1990s bust.
They had been abandoned by companies that had went out of business. We leased the acreage, took the wells out of the state orphan well fund and did whatever repairs were necessary.
Maybe that will be happening again in a few years?
Could be, if oil prices rise to $80/bo or more, though you would have a better idea of what oil price is needed (it will vary from place to place).
I would think an experienced oil man could train a good worker and pass on their knowledge, I imagine there are good workers who have been laid off in the pandemic and might be willing to learn. Perhaps not.
Dennis.
If oil prices rise and stay there long enough. It takes awhile to train people to work on their own managing a water flood. Pumpers are in short supply.
Pumpers here generally are in charge of 40-70 producing wells, 20-30 injection wells, plus 5-10 or more plants with everything from 10 hydra cell pumps pumping less than 50 BWPD at low psi to quint-plex plunger pumps disposing of thousands of BWPD at 800 psi. Managing water is a big part of the job. Chemical treating wells is a big part of the job. Looking for leaks, oiling and greasing, gauging and taking daily meter readings. This is just a small part of the list. This is all done solo, in the boondocks, with someone generally not looking over one’s shoulder. In conditions from 100 F heat, to electrical storms at 2 am, to ice, snow and lots of rain and mud.
I can’t think of many jobs where there is more opportunity to cut corners, with the results not being immediately apparent. For example improper chemical treating may not show up for 6 months.
Most are predicting low oil prices for decades. So there won’t be much motive for hiring newbies, nor will many be attracted to the work.
But they weren’t predicting low prices for decades in the early 2010’s. High prices forever, with $60s WTI being considered low.
Who knows? It is largely dependent on oil prices, as it always has.
As you say, there aren’t many people working in horse drawn buggy manufacturing these days.
Shallow sand,
I think we are at least 3 to 4 decades away from the oil industry going the way of the horse and buggy, though you are correct I have given that example (mostly referring to ICE autos, I think). There are many uses for oil that are not easily replaced (air travel being an obvious example, and a lot of petrochemical use as well). The key thing is supply vs demand, at some point supply of oil may outstrip demand for oil over the long term, but I think this won’t be until at least 2035, and possibly as late as 2050 (depends in part on the price of oil and the speed with which the cost to manufacture batteries for EVs falls.)
There is no way to predict this, but my sense is that there will be a 10 year period from 2025 to 2035 where oil prices may rise to over $80/b0 in 2019 US$ (Brent price) on average for that decade. I think there may be money to be made with conventional stripper wells at that price, you would have a better guess than me. Then sell your assets in 2035, at the top.
New US tight oil data is out for July with large revisions of the estimates from July 2020 (data through June 2020) especially for May (revised lower by 923 kb/d) and June (revised lower by 566 kb/d). Not sure what the estimates are based on, but usually they are not this far off (May estimate in July off by 15% and June estimate in July off by 9%). They have a difficult time with big changes and smaller producers (that do not fill out government surveys) may have been incorrectly estimated ( a guess on my part). I expect there will be future large revisions to the data.
My recent scenario for US tight oil has output falling to 5000 kb/d by early 2022.
Nat gas discoveries in the eastern Mediterranean is resulting in a geopolitical scramble there. Discussed well here-
https://www.aljazeera.com/indepth/features/project-force-battle-resources-eastern-mediterranean-200813065238935.html
“How much natural gas is at stake? Some estimates put the size of the reserves at 3.5 trillion cubic metres, which would put the region on a par with Venezuela and Nigeria. The United States could run for nearly a decade on that find alone. Additionally, there is a further 5.13 trillion cubic metres of gas estimated to be in the Nile Basin. It is no surprise then that Egypt, Cyprus, Greece, Turkey, Israel, Lebanon, Jordan and the Palestinian authorities all want as large a piece of the pie that they can secure for themselves.”
‘Is Argentina’s Shale Too Expensive To Drill?’
Yes.
But when oil is over $80 maybe.
https://oilprice.com/Energy/Crude-Oil/Is-Argentinas-Shale-Too-Expensive-To-Drill.html
US rig count was down by 3 for the week of August 28. Two of the three were from the Permian
Thanks Ovi,
US rig count down by 74% and Permian down by 70% since March. In March 61% of oil rigs were operating in the Permian and the most recent data has 69% of oil rigs operating in the Permian. So everywhere has decreased, but the Permian less so since March 13, 2020.
Dennis
On Monday we find out if all of those parked rigs result in US June production falling below 10,000 kb/d. I think it will. Surprised if it doesn’t.
The EIA’sMonthly Energy Review says it will stay well above that level.
Oct-19 … 12,673
Nov-19 … 12,860
Dec-19 … 12,802
Jan-20 … 12,755
Feb-20 … 12,746
Mar-20 … 12,737
Apr-20 … 11,990
May-20 … 10,001
Jun-20 … 10,897
Jul-20 … 11,035
Of course the Monthly Energy Review is always off. But that far off?
Ron,
The monthly energy review for the final two months just uses the STEO estimates, these can miss the mark by large margins on a regular basis.
I agree June output might rise, perhaps by about 270 kb/d, I think the MER estimate will be too high by about 600 kb/d.
Ovi,
If the tight oil estimates are correct, and there is a good chance they are not, June output is likely higher than May output. Note that I expect we may see the May estimate revised lower so that June output might not be above 10 Mb/d, but it may still be higher than the revised May output. Also whatever gets reported on Aug 31 for May and June US C plus C output is likely to be revised in the future. My guess is that US output will fall by roughly 3 Mb/d from March 2020 to March 2022. There might be a small increase in June, but then decline will resume at the current oil price level.
Dennis/Ron
It is all a question of which rock you want to look under. The LTO is showing and increase of 230 kb/d from May to June. However looking at the on-sh0re L48 conventional oil (L48 – LTO), it is down by 376 kb/d for a net drop of 146 kb/d. It was extended to June using the STEO.
It will be all settled tomorrow.
Ovi,
Depends on how much faith one has in the STEO, if one looks at how much the STEO forecast changes from month to month as new forecasts are released, it inspires little confidence.
Personally I trust the PSM and LTO estimates more, though last month’s LTO estimate was nearly as bad as an STEO forecast. 🙂
I think the MER will be too high for June. STEO suggests a decrease of L48 excluding GOM in June of 140 kb/d, if we assume most of this comes from tight oil, it is very different from the EIA’s recent tight oil estimate with an increase of 230 kb/d. In addition we have the data that conventional output in Illinois increased strongly in June, if this is typical of most conventional production in the US, we would expect an increase from conventional output as well. The STEO expects only a 100 kb/d drop in output from GOM and Alaska, if that is accurate, we should expect an increase of output in June of 130 kb/d minimum, if conventional onshore output is unchanged from the May level.
Dennis/Ron
You win.
June May
10,436 10,016
Ovi,
I was off by 150 kb/d, my guess in a comment above was about a 270 kb/d increase from May to June.
Looks pretty clear to me that the virus has taken over all manner of influence on pretty much anything. There’s not much point in talking about who is running out of oil because all of those graphs of history just don’t apply anymore. This is a different world and it has no history.
The system is holding together for the time being as a consequence of governments running up enormous deficits and funding them in whatever way possible, which is euphemism for central banks lending the money. It’s hard to see how that’s forever. Really hard. It will be tried, but forever is tough to see.
Far more so than the years we have spent thinking about the shape of the peak and decline of oil production, we now have to think about how and why the country that generated the virus in whatever way, is the country suffering the least economically.
When this is pointed out, it’s become maximally comfortable to take refuge in, all together now, I don’t believe any data out of China.
This looks like a mistake to me. Quite a lot of their data is correct. Who is going to accept this? As the pressures evolve, as it becomes clear that China didn’t have to run up 28 trillion dollars in debt, who is going to accept that? It doesn’t matter if they did a better job economically. Doesn’t matter if they were wiser about running up debt. They are the source of the virus and they are suffering the least from it, and in the face of pressures no one’s going to accept this.
I expect lawsuits. I expect guilty verdicts. I expect awards for national plaintiffs. They won’t ever be paid. No one’s going to accept this.
Zero Hedge ran an article today that pretty much shuts down presumption that New York peaked and then had a sharp decline in cases and deaths because of herd immunity. Sorry, that doesn’t fly. The subway system has ridership of about 25% of pre virus levels. A train to the north suburbs has a similar decline in ridership and ditto the Long Island Railroad.
Infection was stopped, not by masks and standing 6 ft apart, but rather by never going into the city. Going to be hard to run an economy like that. Hard to fund state and city pensions like that.
Leaning back and presuming that work-from-home solves problems is what one does when one forgets trucks that brought the food to your shelves and the guy driving them can’t work from home.
It is always tempting to blame someone else, but severe mismanagement of the pandemic will not be dismissed or forgotten.
Reality over ideology.
Reality always wins, unfortunate for our current leadership.
Watcher- “the country [China] that generated the virus”
Clarification for sake of truth and fidelity of scientific evidence-
To Generate- to bring into existence; to accomplish, to bring about, to beget
A natural virus or bacteria is not generated by a country or its people.
This covid-19 arose in the territory known as China (as best we know).
There is no scientific evidence that it was created by any act of mankind, in fact the genome analysis is absent of any trace of manipulation- “SARS-CoV-2 is not a laboratory construct or a purposefully manipulated virus.” This has been studied in exquisite detail internationally.
This is simply the factual evidence and truth, unless and until scientific genetic evidence is found to the contrary. This is the global scientific consensus.
Speaking as though this was created or ‘generated’ by an act of (Chinese) genetic intervention is simply an act of stating a mistruth. I assume that use of the term ‘generation’ here was a simple/honest mistake.
We call that lying if it is intentional.
I have heard this term used before, and previously on this blog.
I believe in upholding truth, and so I bring this false attribution to the table.
“The buck stops here” is a phrase that was popularized by U.S. President Harry S. Truman, who kept a sign with that phrase on his desk in the Oval Office. The phrase refers to the notion that the President has to make the decisions and accept the full and ultimate responsibility for those decisions. [for better, or worse in this pandemic. Much worse.]
Sars-cv-2 has 29000 base pairs.
Humans just aren’t that smart.
(while all RNA viruses mutate, this one has been quite stable, probably because of its transfer rate and large size)
Just some data on the airlines . Massacre or genocide .
1. AirFrance : 7500 jobs gone . 15% of workforce . Further layoffs not ruled out .
2.American : 23500 voluntary + 19000 on 1st Oct in case of no bailout . Total 42500
3.Alaska : 4200 on 1st Oct .
4.British Airways : 22000 involuntary layoffs
5.Cathay : No layoffs as 90% staff agreed to work without pay till the end of 2020 .
6.Delta : 1806 voluntary + 1900 on 1st Oct . Total 3706 . These are pilots only . 20% have taken voluntary retirement .
7.Finnair : 15% workforce relieved .
8.Gatwick Airport : 24% workers relieved .
9 .Lufthansa : 22000 going .
10 .Southwest : 17000 voluntary . 24% of workforce gone .
11.United :36000 gone .45% of workforce
12 .KLM : 6600 voluntary . 20 % of workforce gone .
13 . Qantas : 26000 involuntary .Further cuts not ruled out
On a lighter note ,Qantas will now be selling luxury pajamas on its flights to beat the downturn . What next ? Lingerie and sex toys ? 🙂
61 million Americans are no more commuting . With this much demand destruction ,no way prices of oil are going up .
Last minute , MGM resorts fired 18000 in Las Vegas . Las Vegas will be the first abandoned city . Unsustainable . When people will visit it several years down the lane they will wonder ” what were they thinking ” .
And if i remember correctly demand according to eia us weekly supplied petroleum products is back at about 20 million boepd from a low point of about 14.
Baggen,
A better number is the 4 week average which is down 3 Mb/d from a year ago. The last week of April it was 5.5 Mb/d below one year earlier, so things have improved since April, but things are not back to normal levels of demand, it will be another 12 to 24 months at least, or potentially demand may never return to 2019 level for the US. I believe the World demand for C plus C will exceed the 2019 level by 2023 or 2024.
Dennis, yes my point was as stated that demand has increased quite a bit from the low point for the us, but ofc we are not back at 2019 levels yet as we lack in aviation and some in other categories as well.
“I believe the World demand for C plus C will exceed the 2019 level by 2023 or 2024.”
I believe you are correct here, or i think it might come even earlier and that should make things interesting.
This would be funny if it wasn’t so tragic. NO, hell no, normality will not return by 2023 or 2024. Everyone is looking at the 1918 flu and saying, yes, things returned to normal in a year or so after that, and this is the same thing.
NO, no, hell no. This is nothing like the 1918 Spanish Flu. Not even remotely similar. Two things are totally different. First, the virus is totally different, and second, the world is totally different. This virus is muting fast and has already mutated into several different strands. One vaccine will not suffice. And several people have already gotten the virus a second time. So immunity with a vaccine is not a guarantee. There may never be an effective vaccine.
And the world is different. Today thousands of people fly around the world every day. Or at least they did. A few still do but their numbers are greatly reduced. And world air travel will not return to its former glory for decades if it ever does.
And there is one other thing you guys seem totally blind to. The world, due to overpopulation, climate change, political unrest, and other problems, will have a devastating effect on any recovery. The economic/environmental/political collapse has likely started, right at the point where its most devastating effect could be felt. That is just at the point where it could be felt the hardest, at the point of a pandemic spreading around the world.
No, the world will never return to the normal of the last decade.
Wholeheartedly agreed.
In 2019, world industrial manufacturing and global trade were already declining and most economies were struggling.
The virus didn’t trigger those problems, it’s the dwindling energy supply, more specifically oil that is the main reason of this slowdown. The virus has dramatically accelerated the downturn though.
Less oil available means less activity, be it social or economic. Now that we are past peak, the economic pie is shrinking. Renewables will not reverse the trend, only a high density energy source could.
Some people still believe that a high priced barrel could get us back on track and postpone the peak. In theory it would be possible, but it simply will not happen. Our real prosperity comes from a high EROI energy source, not printed dollars, and now too many people are jobless to afford oil with a high price tag. We might see a spike in as supplies run low, but it will be most probably very short lived.
Now our world has hit the limits to growth. Actually those limits were probably hit before, but GFC made shale oil possible thanks to cheap credit. Oil’s retirement party, as Art Berman excellently put it. As a result we were able to kick the can a bit further down the road.
Depleted resources, severe ecological overshoot, wealth inequality, shrinking economies, decreasing food production, increasing populism, social unrest arising almost everywhere.
We’re going downhill, and dangerously approaching the steeper part of the curve. The world will be very different in a few years, but not in a pleasant way.
VFatalis, thanks for the great post. You point out the thing that very few people understand, that is the impending collapse of our economic and environmental world as we know it. They simply cannot comprehend the fact that the world will simply go on its merry way regardless of what we do to it.
For years I have told my children, three boys, that this collapse is coming. But I also told them that I would be safely dead when it happened. Now I am not so sure. 😉 But, it is the inability of the masses of people to see and comprehend the big picture that keeps them ignorant of the impending crisis. That and the fact that they would just refuse to believe it even if they did.
People desire to believe what they desire to be true.
Francis Bacon
As Extinction Rebellion folks like to say: “Normal is the Crisis.”
Joseph Schumpeter would agree. According to him (and Karl Marx) capitalism constantly destroys itself. The difference is that Marx saw this as the seed of eventual destruction, but Schumpeter saw it as a survival strategy.
I agree with Ron that the pandemic will last longer than most expect, and with hole in head that it will destroy a lot of the current economy. In fact the second “prediction” is already happening. There is also a massive readjustment going on.
The American Republican party (among others) thinks that we should just ignore the millions of victims and carry on as usual. Most of the world is reacting more humanely, changing the way business is done to deal with the new reality.
But some (including me, being a computer guy) won’t be hurt as much as others (like the unfortunate shallow sand) will, and I expect massive changes in how we do business to deal with the new situation.
There seems to be the opinion here that the world needs to drive around in circles in oversized vehicles to sustain demand for oil, because the oil industry is what keeps the world economy afloat. In fact, the oil industry has been in decline relative to the rest of world economy since the late 70s, and the current disaster is just speeding that process up.
For example, I spent years as a trans-Atlantic frequent flyer, but I doubt the destruction of this industry really matters. It’s mostly just fluff anyway, more often an employee perk than an economic necessity.
It will take years to get rid of the pandemic, and the economy will change irrecoverably. Some industries will be hit very hard. But it will not be the end of the world. The real challenge for governments now is to keep demand high — or put in monetary terms, to avoid deflation.
Ron,
Im not as sure about that as you are time will tell. The one thing that concerns me is the economic damage that has been done globally by the virus and if there is any way out of that considering growth and consumption is needed on this i fear it might be the last straw for the system we will see i guess.
Regarding the virus and normality yes it will take a lot of time for air traffic to return to 2019 levels if it ever does, but apart from that people will press on with life in some sense in my country nobody cares any more, if it wernt for the “respect the distance” signs on the floor of the supermarket i wouldn’t notice it at all any more.
Regarding mutation correct me here as this is totally not my field but from what i understand a virus mutation is not like in the horror movies in 99/100 times it mutates into something leds lethal that our imumne system handles better and therefore it dies off like many viruses has before.
Personally i think after your election is done it will probably be some shift in the attention the virus is getting.
I agree with you about the over population, but that is also where i base my belief on future increased consumption. Partly on recovery and partly on the fact that we will continue with mass migration and move people from low energy lifestyle into high energy lifestyle thus fueling consumption at a much higher rate than any alternative energy alternative will provide.
So in short my belief is if the world dont collapse on its current economic system consumption will increase and pass 2019 levels (exclude aviation for a good bit longer)
Hi Ron,
By normal, I am talking simply about a “normal” level of oil demand, or as I think I said, demand for oil will return to the 2019 level at some point, likely by 2024 imho. Whether the the 2019 level is “normal” or not, I believe we will get to higher levels of oil demand.
Also note that “normal” in 2024 would be a demand level that is about 4000 kb/d higher than 2019, so approximately 86.5 Mb/d of C plus C demand in 2024 would be “normal” based on the experience of 1983 to 2019. I am predicting perhaps 83 or 83.5 Mb/d of C+C demand in 2024, considerably below “normal” levels.
Pretty sure nobody expects a return to “normal”, which as I have said before, changes year by year, essentially there is no normal, it changes constantly.
Baggen and Dennis, both of you are on the wrong side of the equation . First understand ,if you are in a hole 50 ft deep and you cover 10 ft ,you are still 40 ft in the hole . A rebound is not recovery . The virus and the actions taken by the governments worldwide has blown open the already cracked up financial,economic,political and social systems . The blow is lethal . How lethal ? See my post above on the airlines to see how bad it is . I have not included regional carriers in Asia and Europe and also not national carriers like Air India , Pakistan international, Iberia ,Alitalia which were beyond redemption even before the virus hit . Travel and tourism is a $ 11 trillion industry , 10.8% of global GDP . Gone . 1 in 6 in Thailand ,1 in 5 in Turkey,Greece, Morroco and Egypt worked directly in the game . All gone . Not coming back . Boeing had grounded 730 Boeing 737 Max because of the crash but continued production for 3/4 months even after FAA grounded the airline . I think there are about a 1000 planes that are sitting on the runways .All idled . Airbus has 250 planes ready but the customers viz Etihad ,Emirates,Gulf airways are not taking delivery . That is stranded assets of about $ 500 billion . Airbus fired 15000 workers and said further cuts will follow . The following industries were on the death bed even before the virus .
1. Mining
2. Aircraft manufacturing (commercial)
3 . Ship building
4. oil and gas
The virus has hammered the final nail in the coffin . Yes ,these industries are functioning ,but they are zombies . 20 % of Dow is composed of these zombies and in Europe the zombies are anything between 25-30% . So let us move on . Automotive will be the next on the block and everything industrial . We are now on the downward slope of the decline of industrial civilisation and no amount of money printing is going to save this . The world is now in the ”Economic stagnation and social destruction ” mode . Social destruction is already arrived in USA and in other countries in its own way . Example ,in India tomorrow the moratorium on payment of loans to the bank expires . The government has said no more extensions . Result , a spike in suicides . What has me worried is the massive worldwide unemployment . That will really push society to the edge of the cliff . I hear economists and politicians talk about retraining , but retrain to what or for what . What are you going to retrain the 3700 Delta pilots for . Fix bicycle punctures or drive for DHL ? Jobs are gone . 9 million white collar jobs which are not counted as ”unemployed” in EU will be counted so in November . India lost 18.6 million salaried jobs this year . Unemployed in India alone is 400 million . ILO forecasts that by Feb 2021 when the virus would be 1 year old the total number of unemployed will INCREASE by 1.6 billion . 50 million unemployed in USA . What are the future openings ? Gig workers ? Uber , Lyft and deliver pizzas . Count the hits to the hotel industry, film industry , restaurants and all the direct ancillary suppliers etc,etc to the big corporations and you have about my best conservative guess is about 25% of the total world’s GDP is lost and this is a deep hole from which it is impossible to get out with the tools we have at our disposal today . There is no way to go back to pre covid . Forget it . From here the roll is downhill , let us just hope that bad does not become terrible . Before covid I use to say ” The music is playing but the party is over”. I have modified that to ” The music and the party is over ,now comes the hangover” . All be well and take care .
P.S : Vaccine or no vaccine . Won’t make a dime of a difference .The goose is cooked .
Hih,
Obviously my short post was hard to understand it seems. I simply stated that us consumption had recovered quite a bit from the lows. I dont know if it will be sustained but i think so, we will simply see in the near future.
However i agree that a discussion if it will be a sustained increase or just a dead cat bounce is more interesting that talking about selecting average numbers from the month instead of weekly numbers to arrive at the same conclusion.
Anyway i think this is where i make for the door and simply wait a couple of years on the subject and we will se how it played out and the “winner” may have the internet glory of “remember when i told you so…”
Personally i think it will be the future increase in oil prices that will be the last straw. We have now set the arena and guaranteed lower future production if demand recovers (more than it already has) with printed money, population or whatever we will arrive at high prices down the road.
Baggen,
The world has handled higher oil prices from 2012 to 2014 with relatively good global economic growth, so if oil prices remain under $120/bo in 2019 US $ the World economy can likely handle it.
Hole in head,
Yes the current economic crisis is devastating, deficit fiscal spending by governments (hopefully not on war as in 1939-1945, but on wise investments to deal with the coming fossil fuel energy crisis and to minimize climate change) can repair the economic damage and yes some people will need to change their careers as happens continually in a capitalist economic system.
Capitalism is far more resilient than you or Ron believe. We will see in a few years who is predicting things more accurately.
Dennis , you are misreading events . This is a total new ball game . This is phase change . The ICE burns gasoline to produce exhaust gases , try collecting those gases and convert them back to gasoline . When phase change occurs all past experiences become irrelevant . This is akin to a girl arriving at puberty , she becomes a woman . As to deficit spending etc the CB’s have already lost control ,that is evident by the hand lashing and waving by Powell ,Lagarde, Carney and Kuroda . There guess is as good as yours and mine . As to new careers may be you can enlighten me and Ron and others where they will come from . No ,some people will not change their careers ,they will join the queue of the long term unemployed . Capitalism works well with nett surplus energy , the moment we have a slight shortfall it fails . No, we do not need a 50% shortfall ,20% short is enough to bring the system down . The human body is 80 % water .How much do have to loose before we die ? As some one who has had a personal experience with cholera the answer is 20% . The blood pressure drops drastically leading to a heart failure (luckily I could get timely help and survived ). Understand I am talking about a “Synchronised system failure ” . The human body is a synchronized system composed of several subsystems like digestive ,renal,nervous,circulatory etc . A failure in one of the systems leads to the breakdown of the whole physical entity called the human body . It is the same with our current life style .That is where the world is poised today , subsystems are failing and soon the whole structure will fail .
hole in head,
We will see, South Asia will recover, as will China in my opinion.
Also you are focusing on monetary policy (central banks), it is fiscal policy (spending and taxation) that is important to get the economy back on its feet. As to what jobs specifically will increase or decrease, impossible to predict. Generally the jobs that are available will be filled, and which jobs exist will depend on both technology and consumer preferences which determines which products are desired and how they are produced. See Walrasian Economics
a good text at link below
https://www.amazon.com/Introduction-Economic-Theory-Market-Behavior/dp/1845425103/ref=sr_1_2?dchild=1&keywords=Walrasian+economics+katzner&qid=1598835688&s=books&sr=1-2
Deficit spending was a topic of argument in my junior high civics class circa 1944. I was concerned. I still own an uncashed $25 war bond bought with a book of 25 cent stamps. As I recall about half of the US dollar value was stolen (inflated away) by wars end. But we were thrilled with winning.
Dennis,
“Baggen,
The world has handled higher oil prices from 2012 to 2014 with relatively good global economic growth, so if oil prices remain under $120/bo in 2019 US $ the World economy can likely handle it.”
Hope you are correct here, im not entirely convinced that the system will be able to handle high prices on oil after the current strain to the system. I believe like you that demand and consumption will increase but i also believe we will have severe problems of increasing production (even in a high price environment) in other words peak oil has already happened and when the world realizes this prices might move towards more extremes.
Dennis ,let me clarify a little bit more . In SE Asia the elephant is China . Other players are Vietnam , Indonesia and a little bit of Thailand which have some sort of an industrial base . Laos and Cambodia don’t count while Malaysia is basically a commodity exporter of palm oil and rubber . Capacity in Vietnam is maxed out . Not enough land and infra for further expansion . Same for Thailand and Indonesia . By the way tourism was 20% of GDP in Thailand and Indonesia and that is down the tube . Getting a flip from the three is out of question . India was supposed to pick up the lag but the figures for the second quarter just came in . An unbelievable (-)24% . This is from 8 % in 2016 . A deep hole .
As to monetary and fiscal policy . You have a valid point . The problem is that fiscal policy is controlled by the politicians .Now show me a politician who will cut spending and raise taxes and I will show you a bridge I can sell you . In the real world the politicians have handed over reigns of the total economic system to the CB’s as it absolves them of all responsibility when the system starts falling down . Pass the buck to the CB’s .
Jobs will be filled . Of course jobs will be filled . Yes but $ 100000 per year aircraft engineer will be unemployed and the new job will be a $8 hr job at Walmart filling empty shelves or at an Amazon fulfillment centre where you can’t even get a pee break . This is the trade off . Oh , please do not talk about new jobs coming from tech . Tech will shrink also . It is over-hyped .
Behavior economics . I am observing that . For the first time the parents or elders who said “The future for our children will be better than ours ” are saying ” What are our children going to do, how will they survive “. A 180 degree U turn in thought . Result is thrift .They have zipped up their wallets .
Just in Summer sales of clothing in Belgium only 40 % of last year .
https://www.brusselstimes.com/news/business/129115/40-summer-sales-stocks-remain-unsold-people-do-not-dare-to-consume/
Oh , please do not talk about new jobs coming from tech . Tech will shrink also . It is over-hyped .
Tech doesn’t bring jobs. Tech takes jobs. Automation allows one man to do the job of many.
Baggen,
If oil prices move to extreme levels (above $130/bo in 2019 US$), I would agree the World is likely to reduce consumption, perhaps by means of a more aggressive move to electric land transport. Supply is likely to increase at oil prices above $75/bo in 2019 US$ in my opinion, consider the increase in oil output in 2018.
hole in head,
World Bank suggests World real GDP falls by 5.2% in 2020 and then rises by 4.2% in 2021, growth would only need to be 1.3% in 2022 to get us back to the 2019 level of World real GDP. This is their reference scenario, they also have more pessimistic and optimistic scenarios.
On tech creating jobs, I did not say it would. I simply said the number of jobs changes with technology, this mostly affects cost of production typically reducing the cost of the goods produced for the consumer. Generally what one is likely to see with too many pilots is for older pilots to retire early, doubt many will be working at Walmart. Same for engineers, those in aerospace and petroleum would move to other industries, generally the skills can be adapted to other industries, generally there is a shortage of experienced engineers and people with good science and math(s) skills, they will find work.
This pandemic was/is a partial test of oil demand- what percent of the 7.8 billion populations consumption is discretionary vs essential.
Not a very strict test, since the ‘haves’ of the world still are, and will be, doing plenty of discretionary oil consumption.
What is discretionary or optional oil consumption?
Depends on how severe the conditions are, but certainly all tourism and much of the entertainment and social related travel- from sporting and music events, conventions, and military activities, for example.
These kind of consumptive events and industries are all optional/incidental to life.
However, these industries and activities do employ a huge number of people around the world.
In a world that is overpopulated and dependent on fossil energy that will be soon be in decline, it only a matter of time before a stricter test of ‘discretionary’ demand is experienced. The severity will vary by country, and wealth level, of course.
If there is any choice, your employment and wages, and your regions earnings, should not be based on sectors that will suffer from loss of energy or demand in these discretionary consumption sectors.
In a world which has grown into severe population overshoot based on abundant energy, extreme manipulation of the natural world and resources, and medical advances, we should expect to experience very hard pressures that will reverse the human tsunami covering the world.
HiH,
A good helicopter view imho.
The masses will be fooled, but they ain’t stupid. Mainstream media is pushing narratives like never before. They’re in a hurry.
Within a few months they will announce that smoking weed will be good to counter hopelesness. Followed by sniffing glue, produced locally.
hole in head —
>Now show me a politician who will cut spending and raise taxes and I will show you a bridge I can sell you.
That’s pretty much what the German government did to run a budget surplus every year form 2013 to 2019. In that period there was a Christian Democrat (Wolfgang Schäuble) and a Social Democrat (Peter Altmaier) as Minister of Finance.
Hole in head,
For the US the “hole” was about 5.6 Mb/d for products supplied, in the most recent 4 week average it was 3.2 Mb/d. So the 56 foot hole has been reduced to about 32 feet. I expect for the US the hole might get deeper, though this would depend in part on the level of imported oil, possibly US demand for petroleum products will never return to the 2019 level, I am highly skeptical that this will be true at the World level as less developed nations will continue to grow at higher rates than advanced economies and their demand for petroleum products will continue to grow, by a larger amount than any decline in petroleum demand from OECD nations.
Dennis ,incorrect . The 3rd largest importer India has seen a 50 % fall in diesel usage . 55% of the trucks in India are parked . I am reporting this from ground zero . The devolping world story is over . The devolping world is on the way to destitution . Why ? When we talk of devolping countries it basically means SE Asia + Indian subcontinent . As someone who has family ties and has also lived and worked there ,it is game over . I do not count MENA as devolping because they are a one trick pony and the name of the pony is oil . There is nothing else there except overpopulation , water scarcity, environmental degradation .
P.S : I don’t know where to classify China .
Dennis ,if you believe in World bank and IMF forecast Greece should be up and running . Italy should be racing Usain Bolt . Their forecasts are not worth the paper they are written on . You think it is easy to adapt new skills . A pilot ,aerospace engineer or petro engineer do their studies but what is more important is hands on experience . At age 45-50 you are having to go through retraining when you are in a demotivated state of mind because you got fired . All you have is an inside hollowness of ” my life was a waste “. I know because I have met many such persons . But for the sake of argument they are willing to be retrained , the question for what industry . Name me five industries where you can employ a fired Petro engineer, aerospace engineer or a pilot .Already excluded are automotive ,aircraft mfg,mining , O&G,shipbuilding as these are now zombies . I sincerely hope you have some good answers .
waste “
Solar, wind, building design, electric transport, HVDC transmission. Sometimes people need to find something else when their industry fails. Just the way it is in a capitalist economic system, far from perfect, but we have not found anything better in my view.
Note I am thinking of highly regulated capitalism with an adequate social safety net as exists in most OECD nations with the exception of the US which is very backward in this regard.
Alimbiquated ,agree but then Germans have two fears wired in their DNA ,one Hitler and second Weimer inflation when the price of a meal changed between you ordering the meal and by the time you finished it and wanted to pay .
I think this little sub-thread has been an interesting read and has good input from all. I’ll just say that I believe both sides are right. Since I’ve decided to invest heavily into the stock market I speak with a degree of self-interest, but I tend to agree with Dennis’s contention about a fast recovery simply because everybody on Earth craves it now.
On the flip-side, everything depends on how covid plays out,and we might not even be beyond the first act. If there is far worse to come from covid, then all bets are off as to what will happen from now into the mid ’20s.
Long term, it’s hard for me to not expect massive doom and gloom. I won’t retread the aforementioned details about environment and economics, but I’ll just add that boomers are on the way out and brain-fried demagogue millennials and zoomers will soon attain positions of power by default, so for whatever horrific entertainment you can get from Trump at the moment, you can probably multiply it 10-fold for future leadership.
aaaa, you said ” but I tend to agree with Dennis’s contention about a fast recovery simply because everybody on Earth craves it now.;”
So by your logic if everyone in the world has a craving for a sirloin steak it should (will) happen . An old saying ” If wishes were horses beggars would ride ” . Heck, don’t take me seriously . 🙂
hole in head,
You mentioned that no politician likes to cut spending or to raise taxes, I agree. The solution to the current crisis is to increase government spending and to cut taxes, many politicians will agree to that.
Good idea . Let us increase the deficit by $ 100 trillion . Ever heard of a thing called inflation . Happening right under our noses. India inflation 7% . .https://www.brusselstimes.com/economics/129224/belgian-groceries-up-to-10-more-expensive-due-to-pandemic/
hole in head,
In most places inflation is under control, in fact during a depression the problem tends to be deflation in most places that have decent control over money supply.
Dennis , it has only started ,don’t jump the gun . I have earlier posted “Inflation in all things essential (except oil ) ,deflation in all things non essential ”. That is the future . Hickory is correct in his observation ,the central bankers will work all out to push inflation ,deflation is a nightmare for the CB’s .
The central bankers and other government agencies will do whatever it takes to avoid deflation, or to keep it minimal for as long as possible.
Inflation is seen as the lesser economic evil.
It hurts certain group, such as those living on savings or those who wages are fixed, but deflation lowers the economic level of the whole.
Either way, we should expect the purchasing power of most people to decline. That is the consequence of overgrowing/overspending your means, and wasting financial and economic resources on frivolous/grandiose/and destructive things.
The choices are poor when you’ve traveled so far out on the limb- ie overgrown on a weak foundation.
Hickory,
Mostly just a function of a severe shock to the economic system, there are proper policy options to minimize the damage, but not all of it can be eliminated. In this situation, government deficit spending is the proper solution, concern over government debt is misplaced during a Depression, that is what got Hoover into trouble.
Agree, and the challenge will be to debase the dollar slowly enough over the next decades that the loss of purchasing power does cause a depression. It is a dangerous game to play, but the choices are slim.
Hickory,
As I suggested there is little chance of inflation causing a depression, a depression is a lack of economic activity which leads to low aggregate demand and a tendency for the price level to fall.
This is a disaster for those who are in debt, which in most cases is lower income individuals.
The world might not return to pre virus norms.
China seems to have.
Can an American public . . . can an American government tolerate an enormous loss of GDP and erasure of a GDP lead that it had over China — because of a Chinese virus that is killing old people in most of the countries of the world, but largely not in China.
How long will anyone tolerate that? It should be almost effortless to manufacture a provocation for war. A nuclear exchange is not very oil consumptive. China, having little domestically, would not be constrained by supply in their retaliation on the US Gulf Coast refineries.
I wouldn’t trust numbers coming out of the mouths of Chinese officials. A lot of what they say is exaggerations or outright lies. For example they’re claiming only 4600 people have died from Covid-19 to date, which is a completely unreasonable number considering the population of China. Adding two zeros to the official numbers will bring you closer to the truth.
watcher -” It should be almost effortless to manufacture a provocation for war.”…
That would be an evil act, if there ever was one.
Do you really think that China manufactured the covid-19 virus?
I’ll look for any non-oil related comment on the appropriate (other) thread.
Interesting little development.
https://www.argusmedia.com/en/news/2136983-aramco-makes-oil-gas-discoveries-near-northern-border
What the FED said last week was pretty important to all markets including oil. But basically what they said is they will let inflation run above their normally target. This puts upward pressure on bond yields while they keep the FED’s fund rate at zero creating a spread. Without yield curve control in place this puts a lot of upward pressure on bond yields. There is a whole lot of US government debt that has to be rolled over between now in the end of 2021. It’s almost $9 trillion that has to be rolled over.
But here is the thing. If US yields rise it takes everybody’s yields with it. It pretty much forces the rest of the world to buy our debt otherwise yields rise in places like Europe and Japan. Well other central banks can do yield curve control to hold their interest rates down. But if they do money will just flow out of their country into US debt anyway as investor chase that little bit of yield.
If we get inflation above 2% via government spending. Price of oil rises to back to $100 through inflation and demand return all of a sudden shale oil is an attractive investment again by end of 2022. Well it is attractive to those who are looking for yield instead of capital gains which would be your pension fund money at $100 oil.
We might not ever see a higher peak in oil production. But we will still get booms when conditions are right to make credit flow.
New data out for US June output see
https://www.eia.gov/petroleum/production/
June 2020 C plus C output in US up by 420 kb/d from May 2020.
A new open thread Non-Petroleum has been posted
http://peakoilbarrel.com/open-thread-non-petroleum-september-1-2020/
A new thread on US June production has been posted,
http://peakoilbarrel.com/us-june-production-rebounds/
Alimbiquated ,agree but then Germans have two fears wired in their DNA ,one Hitler and second Weimer inflation when the price of a meal changed between you ordering the meal and by the time you finished it and wanted to pay .