A post by Ovi at peakoilbarrel
Below are a number of oil (C + C ) production charts for Non-OPEC countries created from data provided by the EIA’s International Energy Statistics and updated to March 2020. Information from other sources such as the OPEC and country specific sites is used to provide a short term outlook for future output and direction.
Near the end, there is a section comparing World oil production with World oil production W/O the US. Interestingly, World oil W/O the US peaked two years before World oil production. The last section provides a short summary of The Shift Report, where it shows the increasing difficulty oil producing countries will have in offsetting decline in old oil fields and the difficulty in getting back to pre-pandemic supply levels.
It would be appreciated if we could have some further comments on these two sections before the Covid comments start. Does the fact that world oil production W/O the US peaked two years before World oil production make it more likely that November 2018 will continue to be the date for Peak Oil? Are there any weaknesses or missing or newer information that could shift the Shift Report time frame for meeting world demand post 2025?
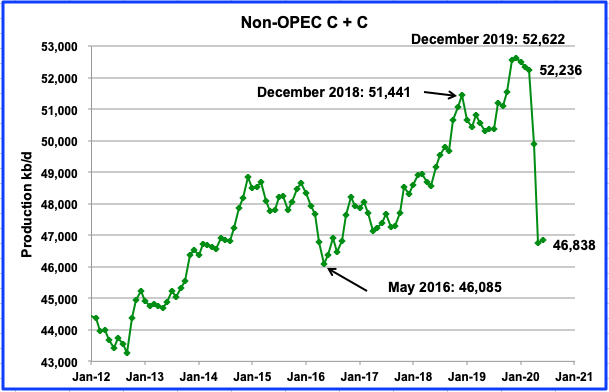
Non-OPEC production dropped from a high of 52,622 kb/d in December 2019 to 52,236 kb/d in March 2020. March’s output of 52,236 kb/d, slid by 109 kb/d from February. The effects of the pandemic and weak oil prices on production will first show up in the EIA’s April data. The STEO was used to project Non-OPEC production out to June 2020. The projected drop from March to May is 5,467 kb/d. June is projected to have an output increase of 79 kb/d. It will be a few years before we have an indication that December 2019 was the peak for Non-OPEC production.
The December 2019 peak of 52,622kb/d was the result of a confluence of new oil coming on line from a number of countries. From October to November 2019, 1,026 kb/d of new output was added. Of the 1,026 kb/d, contributions from Brazil (126), Canada (163), Norway (202), US (192) and the UK (72) totalled 755 kb/d in November 2019, which then lead to the peak in December 2019, which was 1,181 kb/d higher than December 2018 high.
Above are listed the worldʼs 14th largest Non-OPEC producers. They produced 86.9% of the Non-OPEC output in February and March and the percentage seems to vary very little. On a YoY basis, Non-OPEC production was up by 1,441 kb/d. In March 2020, Non-OPEC output accounted for 63.5% of world oil supply and Non-OPEC W/O US accounted for 48% of world supply.
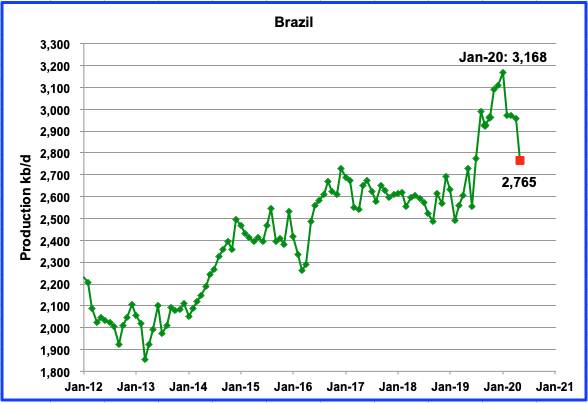
The EIA reported Brazil’s March output was 2,973 kb/d. The April and May data, were obtained from this source and this one where it was reported that April output was 2,958 kb/d, down by 14 kb/d from March and May was 2,765 kb/d (red square). May production was down as the coronavirus ripped through offshore and onshore oilfields, hurting production. Petrobras had planned to reduce production by 200 kb/d in May and this may have occurred naturally due to the pandemic.
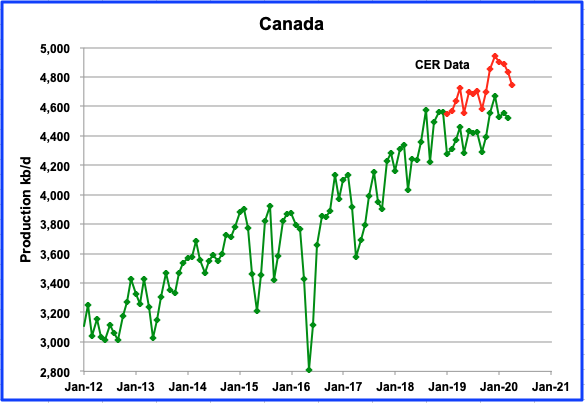
The EIA shows Canadian production was down in March by 31 kb/d to 4,523 kb/d. The CER projects production will drop by 93 kb/d in April. The CER data is higher because it includes NGPLs in their estimates. Alberta’s monthly production limits for raw crude and bitumen are currently set at 3.81 Mb/d from December 2019 to August 2020.
Progress on construction of Enbridge’s Line 3 and TC Energy’s Keystone XL was halted by new court rulings in June. However on July 2, TMX received a favourable hearing. The Supreme Court of Canada refused to hear an appeal of the federal government’s approval of the $12.6 billion Trans Mountain pipeline expansion, which is already under construction. Operations are expected to begin in late 2022.
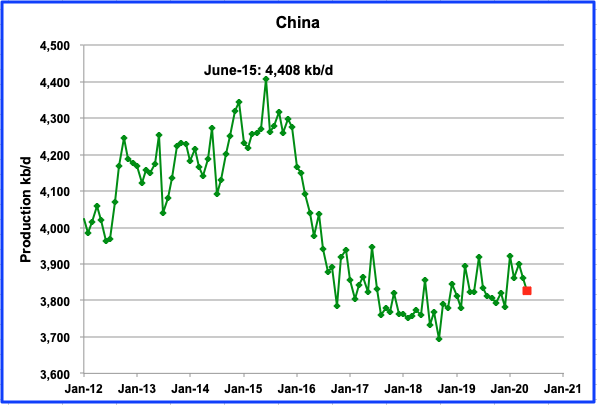
China’s production peaked in June-15 at 4,408 kb/d and has been in a steady decline up to September 2018 where it reached an output low of 3,694 kb/d. In the EIA’s update, China’s March production increased by 39 kb/d to get back to 3,900 kb/d. According to this source, China’s May production dropped to 3,827 kb/d, red square.
According to the Reuters report: “Declining output this year comes as China’s major oil fields Daqing and Shengli announced production cuts at the beginning of the year. The pace of decline in production will ease this year due to higher crude prices,” said Gao Jian, a crude oil analyst with China Sublime Information Group.
PetroChina, the owner of China’s largest oilfield Daqing, said in December that it would slash capital spending on the field this year by 20 percent from a year earlier.
OPEC expects China’s output to be flat for 2020.
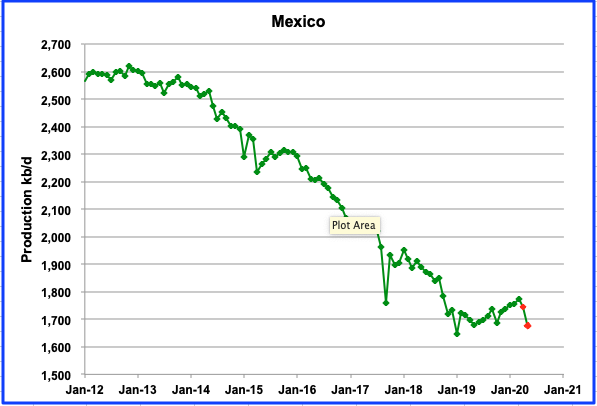
Mexico continued its slow steady output increase to March but suffered a reversal in April. Mexico’s production increased in March by 18 kb/d to 1,774 kb/d according to the EIA. Data from Pemex shows that production dropped by 25 kb/d in April to 1,746 kb/d and in May by 69 kb/d to 1,677 kb/d, red dots. Under the DoC, Mexico has committed to reduce output by 100 kb/d in May. Relative to March, May production is down by 97 kb/d.
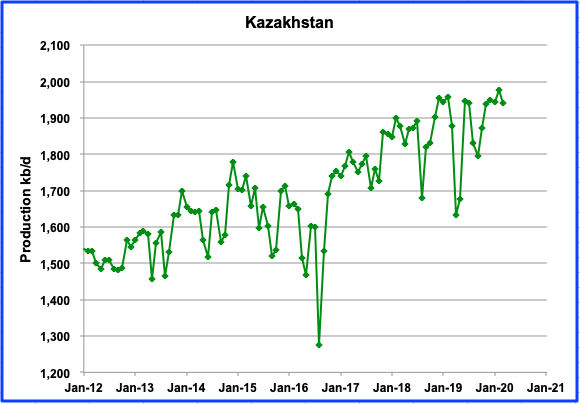
Kazakhstan production hit a new output high in February, 1,976 kb/d, 31 kb/d higher than January. For March, production dropped by 35 kb/d. Kazakhstan has been unable to get their production above the 1,950 kb/d to 1,975 kb/d level since December 2019. OPEC expects their output to drop by an average 15 kb/d this year.
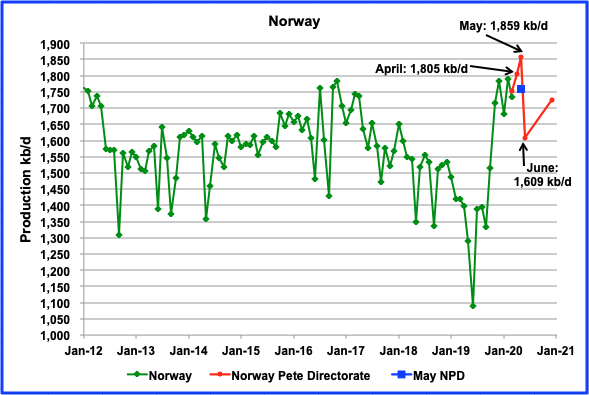
Norway’s output dropped by 55 kb/d in March to 1,735 kb/d according to the EIA. The NPD reports March production to be 1,752 kb/d, higher by 17 kb/d than the EIA. The red lines indicate production going forward as outlined by the NPD. The blue dot shows May production came in at 1,760 kb/d rather than the planned 1,859 kb/d originally planned by Norway. This indicates that Norway is in compliance with the DoC.
Average daily production in June was 1,560 kb/d. On 29 April 2020, the Government decided to implement a cut in Norwegian oil production. The production figures for oil in June include this cut of 250 kb/d. This cut is 50 kb/d higher than originally planned. So the June production of 1,560 kb/d is essentially 50 kb/d lower than the June prediction shown in the chart
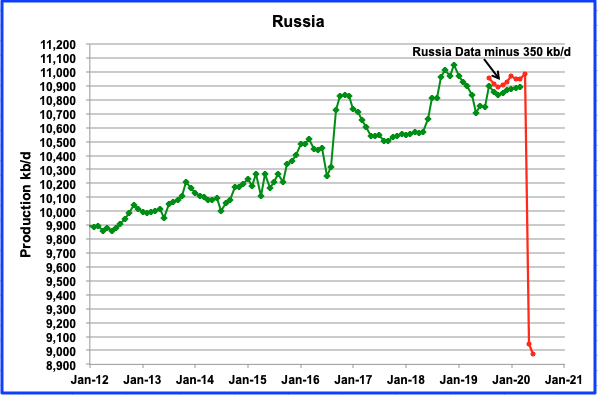
According to the Russian Ministry of energy, Russian production dropped by 1,942 kb/d in May to 9,397 kb/d and a further 74 kb/d to 9,323 kb/d in June.
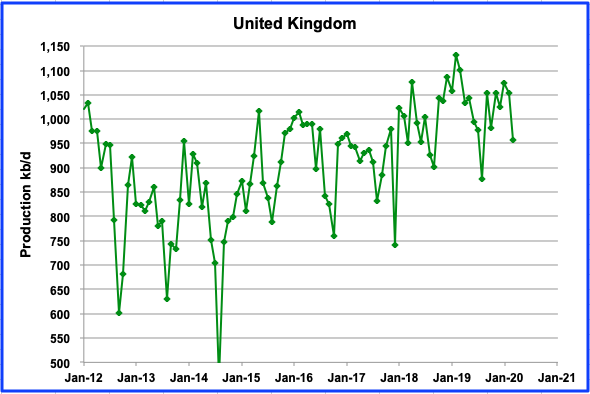
UK’s production dropped by 96 kb/d in March to 958 kb/d. According to OPEC, production is expected to recover in April.
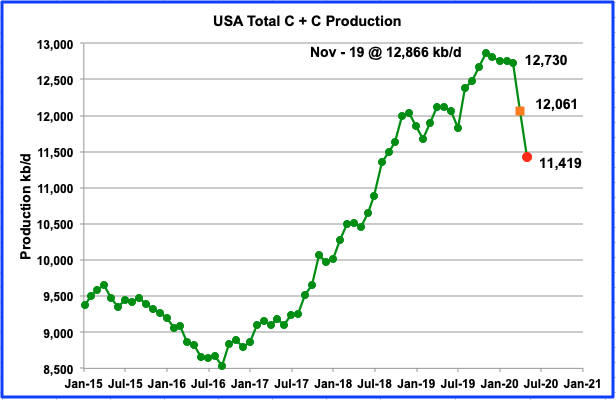
This US production chart is updated to April and tentatively extended to May and shows the continuous slow decline in oil output from US oil fields from November 2019 to March 2020 and then the sharp acceleration in decline in April and May. Since the current EIA monthly data is two months delayed, April is the first month that shows the combined effects of the pandemic and low oil prices.
March output was 12,730 kb/d, revised up by 14 kb/d from the previous release. The orange square is April output according to the EIA’s PSM June release and is 12,061 kb/d, a drop of 669 kb/d from March. Using the EIA’s weekly data, May drops to 11,419 kb/d, red dot. The July STEO is projecting May output to be lower at 11,200 kb/d and June at 10,900 kb/d.
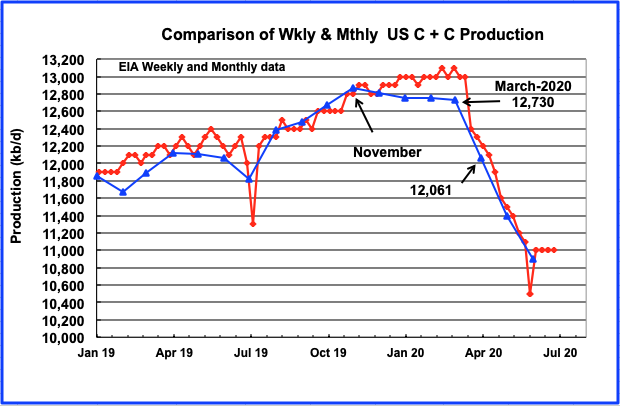
Above are the US weekly production numbers up to the week of July 10. They have been steady at 11,000 kb/d since the week of June 19. Interestingly, for the week of July 10, the lower 48 were down by 100 kb/d to 10,500 kb/d. The L48 decline was offset by the weekly increase in Alaska so that overall US production remained at 11,000 kb/d.
The last two blue triangles represent monthly output estimates from the late June MER for May (11,394 kb/d) and a 30 day average of the weekly data for June, respectively. The June average is 10,900 kb/d. The STEO is estimating June production to be higher by close to 80 kb/d at 10,980 kb/d.
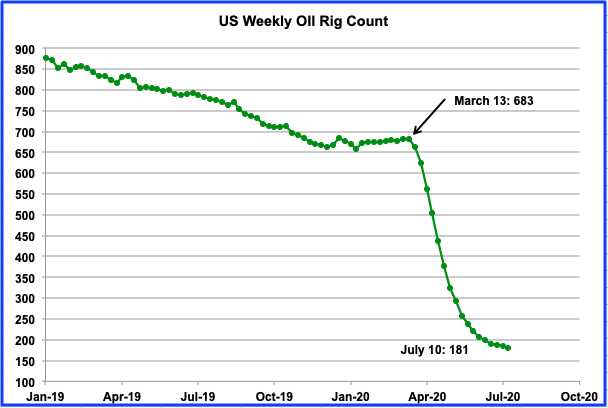
The weekly drop in US operational oil rigs is slowing and appears to be heading for a minimum in July. For the week of July 10, US oil rigs dropped by 4 from the previous week to 181. Interestingly, over the past 3 weeks, the Texas Oil rig count continued to drop: June 26 (98), July 2 (97) and 92 for the week of July 10.
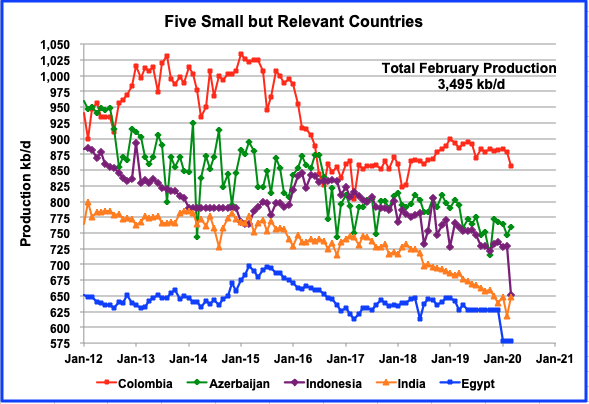
These five countries complete the list of Non-OPEC countries with annual production between 500 kb/d and 1,000 kb/d. All five are in overall decline. Their combined March production was 3,495 kb/d down 67 kb/d from February’s output of 3,562 kb/d. Note that Columbiaʼs production has been essentially flat since August 2019 but showing signs of decline. Azerbaijan, Indonesia and India appear to be in a slow steady decline phase.
NON OPEC W/O U.S. PRODUCTION
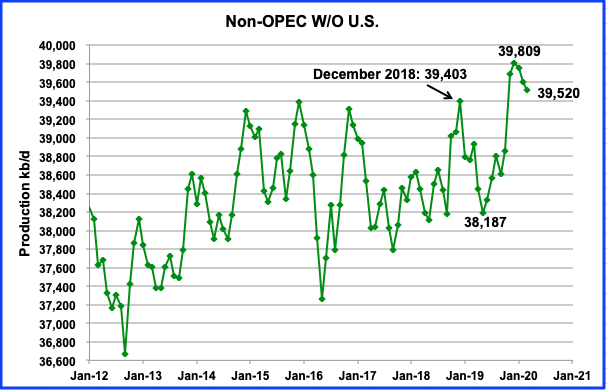
This chart is providing an early indication that Non-OPEC countries, excluding the US, are very close to an output plateau. From December 2014 to December 2018, yearly peak output remained in the range 39,300 kb/d to 39,400 kb/d, essentially an output plateau. However in December 2019 production reached a new high of 39,805 kb/d. It will be interesting to see how low production from these Non-OPEC countries will drop by August after implementing their cuts promised in the OPEC + Declaration of Cooperation
World Oil Production
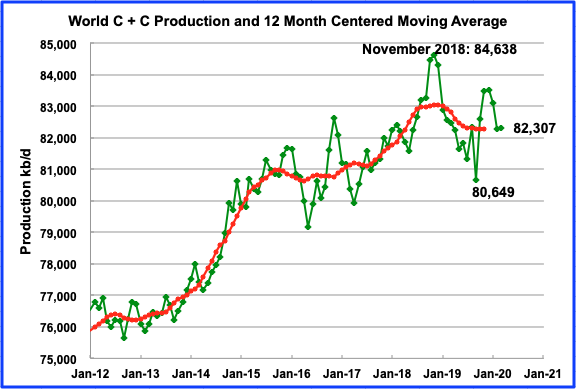
World oil production in March was essentially flat at 82,307 kb/d. This puts March output 2,331 kb/d below the slightly revised November 2018 high of 84,638 kb/d.
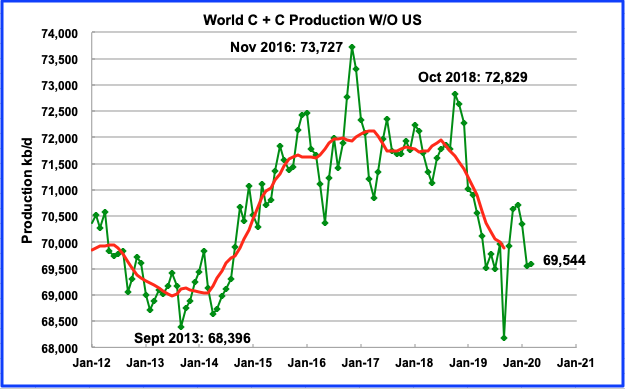
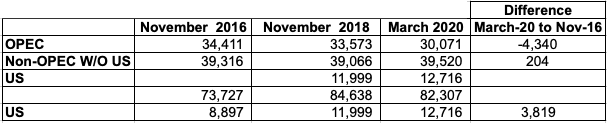
This chart is world oil production without the US. Note how the peak for these oil producing countries is November 2016, two years prior to all the world’s country peaks shown in the previous chart. The November 2018 peak in the previous chart was composed of the following components: OPEC (33,573), Non-OPEC W/O US (39,066), US (11,999). Total 84,638 kb/d. The November 2016 peak W/O the US was composed as follows: OPEC (34,411), Non-OPEC W/O US (39,316). US was 8,897 kb/d.
So over those two years, OPEC reduced its production by 838 kb/d while the US increased its production by 3,102 kb/d to meet increasing world demand.
The current components for March 2020 are as follows: OPEC (30,071), Non-OPEC W/O US (39,520), US (12,716). Total 82,307 kb/d. Relative to the 2016 peak, OPEC is down by 4,340 kb/d, Non-OPEC W/O US is up by 204 kb/d and the US is up by 3,819 kb/d. This clearly shows how much market share the US has taken from OPEC and its impact on world oil supply and price. The above numbers have been put into air tabular form below. Note that after November 2018, the US added an additional 867 kb/d to top out at 12,866 kb/d in November 2019.
Rising US production, starting in 2016 to March 2020 by 3,891 kb/d, forced OPEC countries to reduce output by 4,340 kb/d in order to maintain a semblance of supply/demand balance. Saudi Arabia after being rebuffed by Russia in March, finally said, No More!!

Note how OPEC C + C production also peaked at the same time as the world W/O US production peaked, i.e. Nov-16. Essentially, the November 2016 peak W/O US was fuelled by OPEC and the November 2018 world peak was fuelled by the US.
The Shift Report
This report discusses the effects of the likely decline in the production capacity of the countries that supply more than half of the oil consumed by the European Union. The report shows how the decline could lead to severe constraints on oil supply to EU countries and the rest of the world.
The Shift project purchased a licence to access one of the three authoritative databases on the state of global fuel production. This database, produced by the Norwegian company Rystad Energy, serves as the standard reference for the industry, as well as for the IEA (although the agency does not reveal its sources in detail).
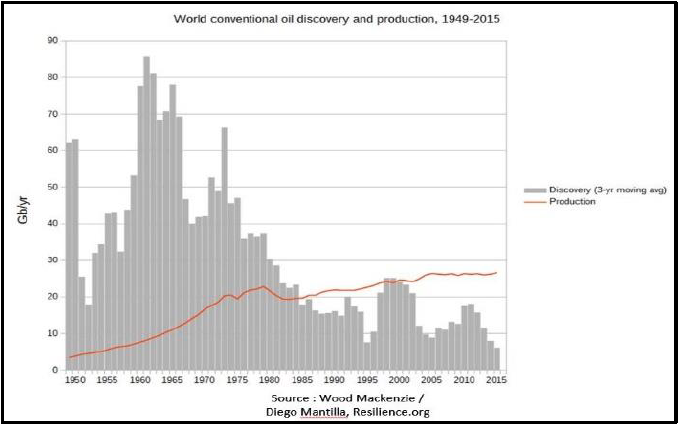
This graph is a variation on the typical discovery chart in that it uses a 3 year rolling average. Note that in 2015, world discoveries were close to 6 billion barrels and consumption was approximately to 27 billion barrels, a deficit of 21 billion barrels. Consumption and discoveries were last equal around the year 2000. Peak discoveries occurred in the early 60s, 60 years ago.
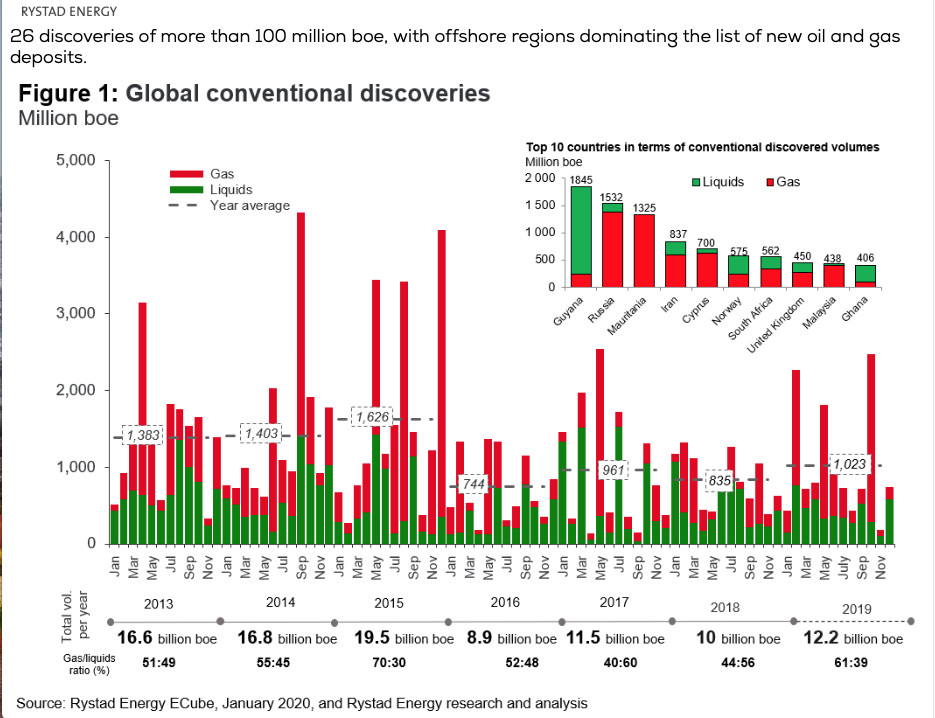
This chart shows new oil discoveries from 2013 to 2019 as reported by Rystad Energy. Global oil and gas discoveries reached a four-year high in 2019, boosted by ExxonMobil’s Guyana success. The world’s oil and gas explorers powered ahead and discovered 12.2 billion barrels of oil equivalent (boe) in 2019, the highest volume since 2015, according to estimates from Rystad Energy. Of the 12.2 B barrels, approximately 4 B to 5 B barrels appear to be crude.
Last year, 26 discoveries were recorded of more than 100 million boe, with offshore regions dominating the list of new oil and gas deposits. Compare the current 100 million boe discoveries with the 3,000 million boe to 5,000 million boe discoveries in the 1970 to 1980 time frame shown in the world discovery chart above. The new fields are much smaller and decline faster.
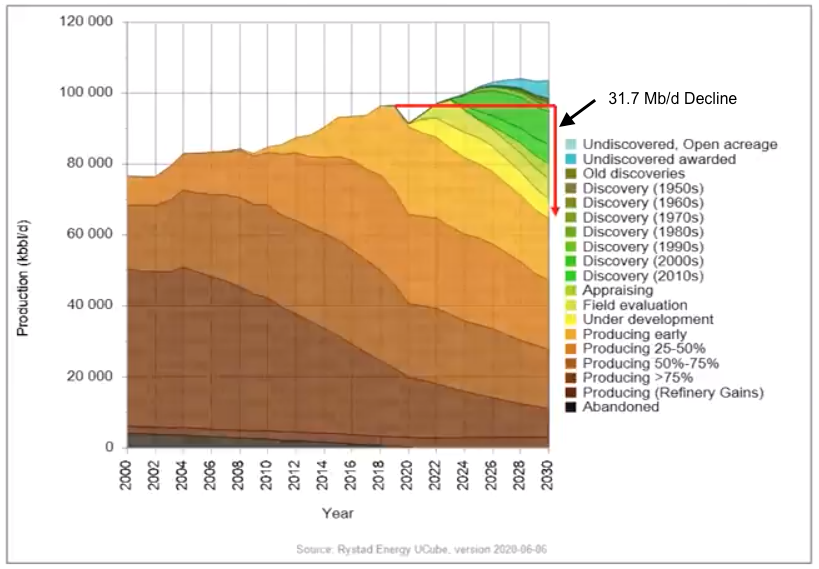
This chart displayed the evolution of global production by the percentage maturity of the extraction sources: almost half of the current production (47.8% or 46.1 Mb/d) stems from so called “mature” sources, i.e. oil fields that already started to decline.
This chart also reveals that, just to maintain production at its (96.5 Mb/d) level, one third of the current (2019) production will need to be replaced by 2030. This decline in current production that needs to be replaced over the next ten years is 31.7 Mb/d, equivalent to the current combined production capacities of the United States, Saudi Arabia, and Russia, the world’s three largest producers. Note this implies oil production from these fields is declining at slightly more than 3 Mb/d/yr
“If we are to reach the total production level of 103.6 Mb/d expected for 2030, nearly a quarter of this 23.6 Mb/d will have to be obtained from past discoveries (green) or from possible future discoveries (blue). The actual development potential of these discoveries is by nature problematic, both from an economic and geological perspective.”
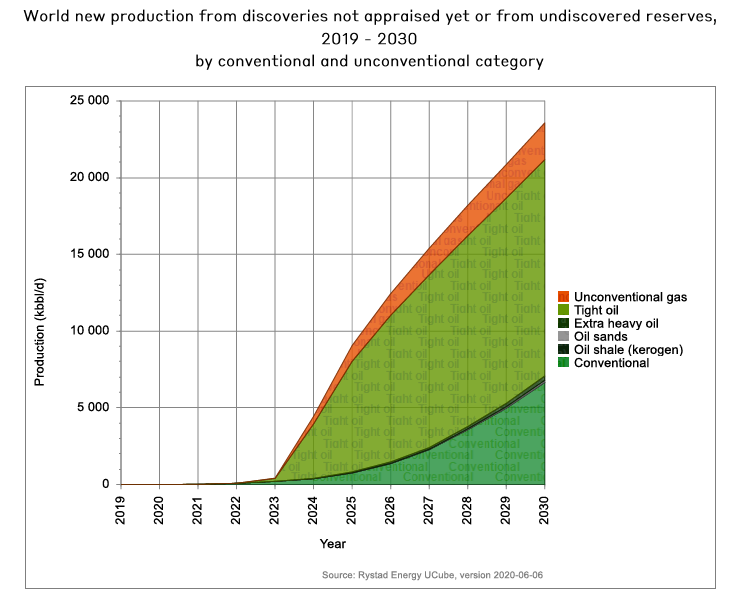
This chart shows the expected role of past discoveries to meet future demand.
“From 2023 onwards, the ability to maintain production depends on the actual development of past discoveries and from 2026 onwards, it depends on the development of possible future discoveries. Of these conjectural 23.6 Mb/d of new production capacity, 70% will have to be provided by tight oil or natural gas liquids from unconventional gas wells.” Will shale oil fields in the US and other countries be able to produce at this level and at what WTI price?
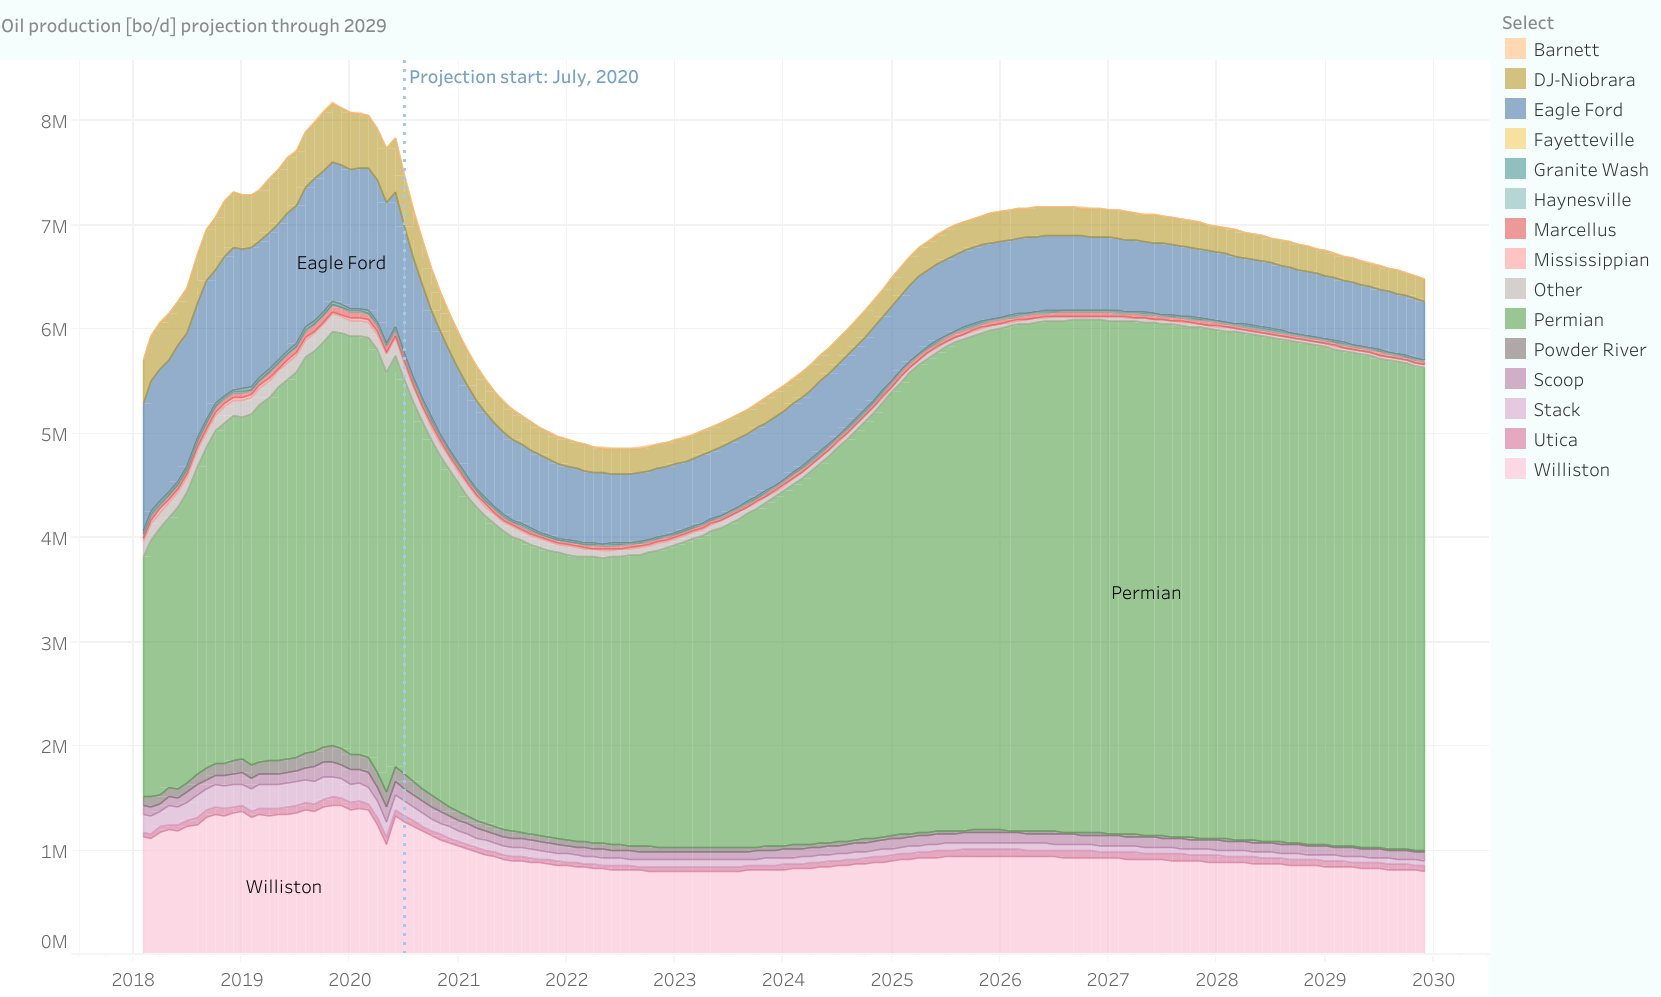
In the July 3 US production post, Dennis posted this chart which shows the potential output from US shale out to 2028. Let’s say it is close to 6.5 Mb/d in 2028. His description and updated detailed chart is posted below
“Another alternative tight oil scenario, the only change is an assumption of a decrease in average well productivity of 1% per month starting in Jan 2025. This is based on the observation that the sweet spots are becoming fully drilled already in 2020 and by 2025 at the latest less productive areas will be where tight oil wells are completed.”
In the preceding slide from the Shift report, it is expecting 13 Mb/d from tight oil in 2028, a difference of 6.5 Mb/d. This is a clue/indication that we may have a supply crisis before 2028 if the economy recovers fully by 2023.
Updated image for supply projection from www.shaleprofile.com showing all tight oil basins
143 responses to “March Non-OPEC Production Slides”
It would be useful to find more analysis of the effect of prices on production. For instance, price seems to be important to production levels in China, as noted in this post: “The pace of decline in production will ease this year due to higher crude prices,”.
Nick,
Difficult to tease out price effects on oil output. At the macro scale oil output correlates much better with real GDP than with the real price of oil, there is likely a small efffect, but there are too many other confounding factors. Ceteris paribus, increased prices tends to lead to increased output. Generally the ceteris paribus simplification proves false in practice.
Well, I know what you mean: at the macro scale there will be many confounding effects.
On the other hand, there’s an old joke about that: a police officer finds a guy, obviously drunk, peering at the sidewalk under a street lamp. The officer asks what’s going on. The guy replies that he’s looking for his keys, which he lost across the street next to his car. Puzzled, the officer asks why the guy is looking under the street lamp, when he lost the keys across the street. The guy replies: “The light is so much better over here!”. The moral of the story is that it may be difficult to look in the right place, but looking in the wrong place isn’t useful, no matter how easy it looks.
In this case, we absolutely know that when supply scarcity hits, price is important. We know this because in the two historical cases price has been very powerful. The first case is in the early 80’s, when high prices caused supply to rise around the world at the same time it forced consumption to drop as consumers found equally useful and cheaper substitutes. OPEC was floored for decades. The 2nd case happened just five to ten years ago when rising prices incentivized US production, which once again killed prices and floored OPEC.
We can’t see this effect at the macro scale in a simple linear regression because high prices are so powerful that they don’t last long: they raise production and reduce consumption until prices fall again. There’s an old saying here: “The cure for high prices is…high prices.”
LTO was not foreseen. But, economists who were scoffed at as “cornucopians” predicted the result: some kind of reaction to prices which would change the situation. It’s possible that next time the new supply will take the form of efficiency and EVs. It’s certainly true that National Oil Companies are less responsive to prices than small and medium size oil companies in the US. All we have to do is look at the volume of drilling in the US vs other countries for it to be obvious that the US is far, far more aggressive about finding and using it’s resources. But again….LTO was not foreseen. And LTO eliminated the need and possibility for other countries to step up in response to those high prices. The US was first, but are we sure that a long period of high prices would not induce other countries to step up? I think it was RockyMntnGuy who said there was a general opinion among experienced oily guys that Mexico had a lot of untapped potential. There’s the Vaca Muerta, Siberian resources, Iraqi fields that they have claimed could reach 7Mbpd, etc., etc. We’ve seen that past history is no guarantee of future performance in the US. Are we sure that other areas are fully exploited?
Here’s my point: if we want to fully analyze the future of oil production, it needs to be more “granular” and cast a wide net for untapped potential in various fields and countries. And, most of all, it needs to take into account the enormous power of price incentives if we expect a sustained period of high prices.
Nick G,
Looking backwards we can predict the past fairly well.
Predictions of the future are more difficult. We do not know the future price level.
Sure. But, that’s what modeling is all about: teasing out relationships and then testing the results in various scenarios.
One piece of the puzzle is prices: we have clues about possible price levels during periods of relative scarcity. These include 2004-07 when prices started to rise, and especially from the 2012-15 period of sustained high prices. Another piece is timing and duration of high prices: we have the results of your current scenarios that seem to identify rough dates when oil production growth will fall short, i.e. below the consumption level indicated by historical relationships between GDP and oil production.
I agree that identifying elasticity of oil supply (the relationship between prices and production) is hard. The Fed has done some macro analysis, but I think we need country-by-country and field-by-field analysis. Maybe we can get some volunteers from people who live in those places…
Nick G,
Laherrere does some analysis and field data might be gleaned from his analyses, mostly that information is proprietary, except a few places (Norway, and UK have pretty good data publicly available and there is data for US Gulf of Mexico). It would need to be considered mostly on a national level, a lot of work to do this for the 35 largest oil producers.
How about you do it for the US? I think you will find that there is little correlation between output and oil price.
Hmmm. Well, first, I think we’d exclude anything before 1975: domestic sales prices were controlled for a long period by the Feds, and supply was controlled in large part by the TRRC.
We probably need to smooth prices with a rolling average, as oil operators would look at prices that way. We probably need to compare prices to production roughly 3 years later due to the lag between greenlighting a project and completion.
Production will take place over many years, especially for convention wells, so it might be useful to look at the correlation between prices and number of wells drilled.
Hi Nick,
There are so many moving parts to the price of oil. I think the best your going to get is a range which price operates and history can help predict that range. What we learned in economics applies contrary to those like Tverberg believes. With the long term and high costs of capital investment to move the needle it can take a decade.
Over the last decade we have learned that 100 dollar oil has the ability to vastly increase production beyond what bankers ever expected. The shale play should keep a cap on the price for sometime. In addition, it justifies increases in investment in the costly production of more efficient transportation vehicles. It also opens the door for substitutes like EV’s.
At the other end of the scale the last 6 years seems to tell us sub $50 oil at current production levels is unsustainable with bankruptcies.
Bottom line, supply and demand in a free market will govern price over time and there will be some losers in a capitalism free market system. It’s part of risk of being an entrepreneur which most don’t seem to understand or prepare for.
The oil industry is seeing competition in transportation that it hasn’t seen in the last century.
Yeah, makes sense.
Things are complex and changing fairly quickly. Tesla has the largest valuation in the car industry. A friend at BP tells me they’re very serious about moving away from oil. She didn’t give details but she seemed very impressed with their level of commitment…
Ovi,
It seems unlikely that tight oil will match the projections by Rystad. Potentially if tight oil ramps up to 1100 completions per month by Sept 2024 (that was the average monthly completion rate in 2019) and average well productivity starts to decrease at 1% per month starting in August 2024, then we get the scenario below. The completion rate falls to 200 per month in Jan 2021 and then rises at about 3% per month up to Sept 2024 reaching 1100 per month, then the completion rate holds steady at 1100 per month until Dec 2029.
One consideration is that Rystad talks about “new tight oil”, if newly completed wells after 2019 constitute “new oil” then in the chart below (slightly modified scenario that peaks in 2028, with slower ramp to 1100 wells (2.5% increase per month after Jan 2021 to August 2026) and productivity decrease of 1% per month starting August 2026. About 7 Mb/d of “new” tight oil from wells completed from Jan 2020 to Dec 2029 is produced in Dec 2029 (see chart below.) Projection from https://shaleprofile.com/us-tight-oil-gas-projection/
Note that in 2030 Rystad is calling for about 14 Mb/d of “new” tight oil output. That is a highly unlikely scenario (perhaps 2% probability that output is at least as high as the Rystad projection in my view), essentially wishful thinking. Under a highly optimistic scenario we might see 10 Mb/d of tight oil output in 2028-2030 and about 8.7 Mb/d of this would be “new tight oil” (my guess is that even this scenario has less than a 20% probability).
Scenario below assumes no decrease in average well productivity through Dec 2029 (not realistic in my opinion). The completion rate continues to ramp up from 1100 new wells per month in Dec 2025 to 1800 wells in Dec 2029. Peak output in Dec 2029 at 14.9 Mb/d, with roughly 13.7 Mb/d of new output after Dec 2019. This scenario is not realistic, I just tried to construct something that would meet the Rystad projection, it requires very questionable assumptions.
Dennis, your first chart was almost within the reason of possibility. Almost, but not quite. This one above is totally out of the circle of possibility. It is hilariously silly. Dennis, are you just trying to be funny or what?
If you really think it is outside the area of possibility, then why the hell did you post it? I would not post a chart that I think is totally absurd, even as a joke. So what the hell is this?
Ron did you read my comment? What part of “this is not realistic” do you not understand. The idea was to see what would need to happen to match the Rystad projection (third chart from bottom of post.
Based on the excellent supply projection app at shaleprofile.com
Screen shot of parameters used for scenario below.
https://shaleprofile.com/us-tight-oil-gas-projection/
Yes, yes, I read your comment. That still does not explain why you posted such an absurd chart. Your reasoning must be something like: “I will post this even though it is not reasonable because it just might be accurate. Therefore I will take no chances. I will cover my ass matter what.” And I just might be able to say, “Hey, I published this chart way back in July 21st 2020. This was my projection”. Okay, you might not say that but it would be implied.
Dennis, I could post a similar post showing US production going to 3 million barrels per day and world production dropping to 40 million barrels per day by 2030. But why the hell would I do that? I do not post stupid absurd projections, no matter who makes them.
Sorry Dennis, but I am almost snockered tonight and I really just don’t give a shit. I once heard “A drunk man’s words are a sober man’s thoughts.” So now you know.
Ron,
Not a problem, your mind reading abilities are about as good as mine. (That is they are not good.)
The point was to show what assumptions might lead to the Rystad projection, the key mistake they make is to assume average well productivity never decreases. From 2012 to 2019 for the average US tight oil well this might be a correct assumption (in fact average new well EUR has increased, but this is mostly due to longer average lateral lengths, and higher proppant loading over time. If we normalize the data by looking at EUR per foot of lateral the increases in productivity are quite small. It is likely that the optimal lateral length, proppant levels and types of additives to the fracking fluid have been determined so increases in EUR for the average new tight oil well will be close to zero in the future. The very basic mistake that Rystad has made is to assume that every acre or bench (different vertical levels that are targeted) is relatively uniform. A casual look at the spread in average well productivities shows that there is a wide range of well productivity and common sense suggests that oil companies will target the most productive areas first and that the number of wells that can be drilled in these “sweet spots” is limited. As drilling moves to less productive areas, the average new well will see a decrease in EUR. My earlier projections make such an assumption (starting in Jan 2025, we do not know when this will actually occur.)
So far there is an apparent decrease in average well productivity for the Eagle Ford, but not for the Permian, Bakken, or Niobrara.
The Bakken might be close to its maximum. Note that newer completion techniques might lead to higher initial output with lower output after the first 12 months of output relative to older wells. That would change projections of future tight oil output as EUR would be lower than many assume.
screenshot
Dennis
I think that Rystad just said that this is what is expected of tight oil if the world were ever to get back to previous production levels. I am surprised that they didn’t point out the difficulty of almost doubling LTO production from the high level it achieved by the end of 2019.
Your extreme scenarios show how difficult if not impossible it would be to achieve the production levels required.
Ovi,
Based on the shift report, it seems this is what Rystad is projecting for tight oil to get to a peak World C+C output of about 89 Mb/d in 2035 (about 88 Mb/d at US tight liquids peak in 2031).
See also http://peakoilbarrel.com/march-non-opec-production-slides/#comment-706139
Great post Ovi. thanks so much.
I’m, too, am very interested in reading responses to your query- “Does the fact that world oil production W/O the US peaked two years before World oil production make it more likely that November 2018 will continue to be the date for Peak Oil? Are there any weaknesses or missing or newer information that could shift the Shift Report time frame for meeting world demand post 2025?”
Survivalist,
I think the answer is that increased tight oil output led to a glut which depressed investment in new projects. I do not think output can reach the levels predicted by Rystad for 2030, but there is a lot of room between Nov/Dec 2018 being the centered 12 month average peak in World C+C output, (this is the only number that is important, monthly records are of little consequence in my view) that is it is the final peak that will never be surpassed and the projected 105 Mb/d for total liquids output. Certainly the tight oil projection made by Rystad is beyond optimistic (silly as Ron has suggested).
Survivalist
Thanks. The most recent OPEC report has some interesting info (Pages 37 & 38).
“Currently, there are only 16 new projects of more than 10 tb/d in non-OPEC countries which are expected to start up in 2021. The total planned production for these projects is forecast to reach around 300 tb/d. Norway with six projects is the main driver for new production in 2021.”
“According to the latest information on project ramp ups in 2021 based on Rystad Energy’s UCube database, 2.42 mb/d is estimated to come on stream through already existing project ramp ups. As a result, a total of 2.72 mb/d of new production is planned for 2021, which will be partially offset by natural declines. However, the large portion of this incremental production will just compensate the curtailed volumes that were lost in 2020. As a result, non-OPEC liquids supply in 2021 is likely to grow by 0.92 mb/d, y-o-y.”
So current field ramp ups will add 2.42 Mb/d next year. Add in the 0.3 Mb/d from new projects and all these projects end up adding 2.72 Mb/d next year. However after accounting for decline the world ends up with 0.92 Mb/d. So the decline over one year is 1.8 Mb/d. The Shift report is indicting annual decline rates closer to 3.0 Mb/d. Quite a difference.
Have I missed something in looking at the OPEC report and potential decline rates.
Ovi,
I just carefully read through the Shift Project report, I could not find any place where they said annual decline rates are 3 Mb/d.
Also the decline in output during 2020, due to very low oil prices, might lead to a rebound in output in 2021 as oil prices return to over $55/bo, so that might account for the difference. A look at figure 50 in the shift report (page 54) suggests a decline of 10 Mb/d from 2020 to 2025 for fields that have already been developed as of 2019, which suggests about a 2 Mb/d decline, pretty close to the OPEC estimate of 1.8 Mb/d.
I see where you get your 3 Mb/d decline estimate, if you look at the decline from 2020 to 2025, the average is about 2 Mb/d. (Output falls about 10 Mb/d from 90 Mb/d to 80 Mb/d over the 2020 to 2025 period.)
Dennis
Under the third picture in the Shift report section above, the following is written.
This decline in current production that needs to be replaced over the next ten years is 31.7 Mb/d, equivalent to the current combined production capacities of the United States, Saudi Arabia, and Russia, the world’s three largest producers. Note this implies oil production from these fields is declining at slightly more than 3 Mb/d/yr.
I took the time span to be 1o years for the 31.7 Mb/d drop.
Ovi,
If you look at the chart, over the first 5 years (2020 to 2025), output drops by about 10 Mb/d, so when comparing to an OPEC estimate for 2021, it would seem a better measure, at least to me. So over those 5 years the average annual rate of decline predicted by Rystad is about 2 Mb/d, not very different from the OPEC estimate of 1.8 Mb/d.
Thanks for the info Ovi and Dennis,
I agree Dennis, I quite like seeing C+C data smoothed with seasonal adjustment. I’m not sure of whether I prefer the 12 month trailing or the 6 month centered, that I see here, in terms of ‘measuring the moment’.
Dennis/Survivalist
Your eye doesn’t need a 12 month average, centred or not, to see where the peak is. ?????
Ovi,
In some cases the centered 12 month peak matches up with the obvious peak in the monthly data (as in Nov 2018), in other cases this was not true as in 2016/2017 where the monthly peak was late 2016, but the centered 12 month peak was early 2017. The fact that the two line up in Nov 2018 is just a statistical coincidence. In my view, the centered 12 month peak is more important than the monthly peak, but not all agree.
Also in 2015 the centered 12 month peak did not match the monthly peak.
Dennis
Do a few months really matter when we have to wait for between 5 to 10 years to really know if there was a peak. The 12 month average is useful when you have a meandering plateau or if one wants to try curve fitting. For the two cases in the post above, we know pretty well what to look for.
Ovi,
Yearly average output is more relevant than single month spikes in output, the precise month matters not, so if we just plotted yearly output I would agree the peak would be clear, the noisy monthly data makes things less clear to me than a centered 12 month average. I agree a few months difference is not important. In fact the precise year does not matter much. We are likely at peak oil either now or in the near future. Shift report basically says 2020 to 2035 is the likely window, I agree and would narrow the window to 2025 to 2030.
Why not just look at reality?
November 2018 was peak global production.
C+C either exceeds that, or not.
It is quite simple.
It is starting to fade in the rear view mirror—–
Hightrekker,
If reality is defined by a single month’s output then certainly the one month peak was Nov 2018. It was an abnormal time where OPEC was establishing maximum production rates before a new quota agreement. To me, 12 month centered average output, or annual output is a better measure as if better reflects sustainable output.
Shale CEO college – now I understand the economics:
https://twitter.com/i/status/1269029457085566978
(found via Oilystuff link to Thad Toupe to twitter feed)
A somewhat realistically optimistic scenario below where average new well EUR is assumed to decrease at 1% each month starting in Jan 2025 (this actual date is unknown) well completions fall to 200 per month by Jan 2025 and return to 1000 per month by 2027 (a gradual increase of 2.5% per month from 2021 to 2024 and then a slower 1% per month increase from 2025 to 2030), by Dec 2025 well completions reach 1500 per month. Tight oil output reaches about 8.5 Mb/d by Dec 2030 for this optimistic scenario. My WAG is about a 25% probability that tight oil output might be this high or higher, my best guess is a peak around 2027/2028 at about 7 to 8 Mb/d.
To reproduce the scenario in comment above use link below with model parameters shown in screenshot below
https://shaleprofile.com/us-tight-oil-gas-projection/
Note there is a walkthrough video on how to use this tool at the page above, just scroll down (or link below)
https://youtu.be/mzvLOWGuWWM
Dennis
I think much of the future LTO output will be determined by how many of the small players were bought up by the bigger players. Big players such as XOM and CVX have a longer term outlook and plan ahead on how to utilize their fields. They may also be more conscious of their need for higher prices so that they and other players can do more exploration. So the supply of LTO to some extent depends on the ratio of land owned by CVX and XOM and by the little guys. I wonder if this type of info is readily available.
Ovi,
It would take some digging through SEC reports and many companies are privately held.
shale profile might have some of this information available in its subscription service, but alas I cannot afford the service.
Ovi,
I think the most important factor will be the price of oil. At $60/bo tight oil is barely viable at current average new well EUR for the Permian basin, other tight oil basins may require higher oil prices in order to be viable. There is already some evidence that average new well EUR has started to fall for the Eagle Ford, the Bakken, may be next, then perhaps Niobrara, I expect the Permian will be last basin to see decreasing average EUR for newly completed wells.
As some of the more poorly run tight oil companies go bankrupt their better assets will be bought by stronger and better managed companies that may develop the tight oil resource in a more intelligent manner. This may be wishful thinking as the price crash in 2014/2015 seemed to have little effect on better management of tight oil resources.
Mistyped above well completions fall to 200 per month in Jan 2021.
another typo, in comment above, completions reach 1500 per month in Dec 2029 (I mistakenly typed Dec 2025 initially).
In addition I said output reached 8.5 Mb/d in Dec 2030, should be Dec 2029 (end of projection).
My reasoning for a peak in 2028 is that I expect the well completion rate will slow down at around this point as wells become less profitable so completion rate peaks at 1100 completions per month in 2026 and output plateaus in 2027 to 2028 and starts to decline by 2029.
See http://peakoilbarrel.com/march-non-opec-production-slides/#comment-706064 for details on that scenario.
Link to shift project report below
https://theshiftproject.org/wp-content/uploads/2020/06/Study_Risk-supply-Europe_TSP-with-Rystad-Data.pdf
Dennis, from your Shift Project link:
Rystad assumes that Russia has reached its production peak in 2019 at 11.67 Mb/d (Figures 30, 31, and 32) and expects that decline in Russian Production to reach 10.9% between 2019 and 2030.
In the early 2010s, IEA suggested that a decline in Russian oil might begin before 2020. Russia managed to push back this fatal moment through a sustained industrial effort, which has been particularly successful in areas of Russian territory that were still undeveloped: in Arctic Russia and, even more so, in Eastern Siberia. However, since 2018, Moscow has repeatedly presented that prospect of a peak by 2021 as highly probable. (28)
28 “Russia is Only 3 Years Away From Peak Oil, Energy Minister Warns”, The Moscow Times, September 24, 2018; Nastassia ASTRASHEUSKAYA, “Russia makes its oil reserves work harder as output declines”, The Financial Times, November 12, 2019
Below this Russian discussion and charts, there is a similar discussion and charts about ALL of African production. They have all have peaked, 2019 or much earlier, every damn one of them.
West Africa peaked in 2010.
Ron,
Yes these are all part of the Rystad forecast which has output rising overall. Their forecast is about 5 Mb/d higher than my shock model in 2030, most of this difference is accounted for by their very unrealistic tight oil projection (about 11 Mb/d for tight oil C plus C only, excluding NGL) where I have tight oil at about 6.4 Mb/d in 2030 (fairly close to the 2018 annual average US tight oil output of 6.5 Mb/d).
See http://peakoilbarrel.com/march-non-opec-production-slides/#comment-706149
The Europeans settled on 850 billion euros. This sort of thing is and always has been why the dollar-is-going to-collapse crowd face such an obstacle.
The PBOC this past week nationalized a slew of banks inside their country. This was done while every report available suggests Chinese oil consumption has returned to 2019 levels. And while they maintain their currency peg.
Japan has fallen off the radar screen of currency management and fiscal stimulus, though I suppose we can be sure it’s out there.
Rumor has it should Joe Biden be elected he will re-enter the Iranian deal in coordination with the EU. This will flood about 2.5 mbpd out of Iranian ports onto the world stage. Since that revenue would fund anti-Israeli activity, Israeli interdiction missions would seem likely and I don’t think they’ll have any difficulty getting air-to-air refueling permission over KSA. Might even get permission to land and refuel.
Russian aircraft are defending areas of Syria from Israeli Air Force attack. One could expect the same for Iran. That will be fun.
Odds look pretty good Turkey and Egypt will be going to war. Should be a minor bump to oil consumption. And eventually increase Libyan output.
DC and all,
Small item: The Tesoro High Plains Pipeline in North Dakota has just been shut down by a court for trespassing on the Fort Berthold Reservation. Tesoro and the Dakota Access carry about a third of Bakken crude production. Tesoro carries crude to the refinery at Mandan.
An agreement to allow passage across Reservation land was not renewed so Marathon is to pay $187 million and then may be allowed to re-open the pipeline I guess.
This statement from Ovi’s post is a critical one- “just to maintain production at its (96.5 Mb/d) level, one third of the current (2019) production will need to be replaced by 2030. This decline in current production that needs to be replaced over the next ten years is 31.7 Mb/d, equivalent to the current combined production capacities of the United States, Saudi Arabia, and Russia, the world’s three largest producers.”
The Shift Project- https://theshiftproject.org/en/article/eu-oil-depletion-2030-study/
‘EU’s current oil supplier’s volume produced is projected to shrink by 8% by 2030’
As an analogy to oil available for export on the world market think of how an effective Covid-19 vaccine will be distributed. The first 500 million doses will go to those who have pre-existing contracts, with the countries that have invested by funding the R & D, along with those who can come up with enough funds to outbid all the other countries. And within countries, it will go to the wealthy and their health care workers, and the ruling bureaucrats and the security forces who protect them. It will not be distributed based on need.
Just as an initial vaccine will not be distributed based on human need, neither will crude oil.
When depletion exceeds demand, it will flow towards those who out compete others with a combination of cash, loans, or physical protection. Thus the Chinese Belt and Road initiative.
About ½ of global crude oil is exported (anyone have better data on this?). This fraction available for export will decline as more and more countries on the exporting list only have enough production to fulfill their internal demand [ie Export Land Model]
Clearly, countries who are dependent on importing crude oil will be in energy shortage unless they learn to use less. China, India, US? , Japan , S Korea, Germany, Spain, Italy, Netherlands, France and Taiwan are the biggest importers by volume (in descending) order, but more than a 100 other smaller countries are also heavily dependent on imports of crude to sustain their economic output. And many of these countries will struggle to pay higher prices for the fuel.
The point of this is to indicate that the energy shortage as crude oil declines will be felt very unevenly across the world. Some countries will be able to ramp up electric transport more rapidly than others. Some have much greater purchasing power than others. Many of the USA former (before trump) allies and market partners are extremely vulnerable. The stage is set for very uneven disruption , if the decline after peak happens more rapidly than countries can adapt.
Hickory , you have bought up a concern which was on my mind but delayed in asking ,that was the ELM model . As we stand today and from forecast with current trends LTO in USA will decline by about 4-5 million barrels by June/ July 2021 . That means that USA must import this shortfall to cover its butt . Who will supply this ? The world oil production is in a declining mode . Dennis is presuming that the situation will improve in Libya, Iraq etc and cover up . I am with Ron on this . Above ground situations will not improve but get worse and the US will be forced to get out of its entanglements due to domestic upcoming problems , of course depletion and decline rates do not sleep . In such a case which importer will have a supply cut to fill in the gap? When I look at geostrategic political alliances my bet is on India. Opinions solicited .
Hole in head- I think you are correct about India’s vulnerability. If India finds itself on the short end of the oil stick, they could be forced to make a deal with Iran as a preferred buyer of Iran’s crude, regardless of US or EU sanctions on Iran. They may have some competition for that crude, from a slew of other big importing countries, like China.
Hicks,it cannot make a deal with Iran now . Iran got pissed off since India caved in to US sanctions and stopped importing . Last week Iran and China signed a 25 year cooperation agreement which is basically an oil for technology and material deal . Iranian oil is now earmarked for China mainly . The Iranians are annoyed and also cancelled a $8 billion deal with India to devolp Chabar port in Iran . The deal is now handed over to the Chinese . The plan is to connect Chabar with Gwadar in Pakistan and make a pipeline in parallel to the Karakorum highway to bring Natural gas to China . Geopolitics at work .
Thanks for the info.
Here an article detailing some this information. It can all be seen as part of the larger scheme- China’s Belt and road initiative.
https://www.maritime-executive.com/editorials/shifting-ties-boost-china-s-influence-in-iranian-pakistani-ports
‘Should China hold a crucial stake in both Gwadar and Chabahar, it is bound to reap great economic, commercial, and strategic benefits, with a presence opposite to the Strait of Hormuz and close to the Persian Gulf. China would be well-positioned to act as policeman for the security of the Persian Gulf and Arabian Sea.’
From your link, bold theirs:
A declining production for Russia, former USSR countries and Africa, which represent 50% of EU’s oil supply
The combined production of Russia and all former USSR countries, which together account for more than 40% of the EU’s oil supply, seems to have entered a systematic decline in 2019. Africa’s oil production (more than 10% of EU supplies) appears set to decline at least until 2030.
“Peak oil” is a major yet largely undocumented issue that has not yet received the attention it deserves.
They are saying that Russia, the rest of the former USSR countries along with Africa’s oil-producing countries have peaked and are now in decline. And the general consensus is that the USA has peaked as well. Sooooo…..
“Peak oil” is a major yet largely undocumented issue that has not yet received the attention it deserves. But it soon will be getting its just desserts.
“A declining production for Russia, former USSR countries and Africa, which represent 50% of EU’s oil supply”
““Peak oil” is a major yet largely undocumented issue that has not yet received the attention it deserves. But it soon will be getting its just desserts.”
It deserves attention if the decline in Russia is higher than the decline of Europeans demand. If you check the German data on energy – Germany is the most important Russian customer for fossil energy – you may see a Russian problem. 🙂
In Germany and France we will see around 20% of new cars being BEVs or PHEVs in 2025, more than 50% in 2030. Oil for heating is dying at a rate of more than 3% per year. My assumption is that the German demand for FF will be 40% or even less of the current demand in 2040, 20% in 2050.
I imagine Russia will find customers in India and China for their oil output, not clear it will be a problem for Russia to find customers from 2025 to 2035.
Hicks,
The Shift forecast using Rystad data shows Ghawar C&C on a down trend since 1997 which agrees with slide 20 of the 2004 presentation by Aramaco’s Baqi and Saleri. However, the Rystad Ghawar annual production data shows more annual volatility than the Aramco data.
https://csis-website-prod.s3.amazonaws.com/s3fs-public/legacy_files/files/attachments/040224_baqiandsaleri.pdf
I’m guessing that the Ghawar C&C increase from 3.5 mbd in 2020 to 5.0 mbd in 2025 could be wishful thinking by Rystad.
Does Aramco just give Ghawar production data to Rystad? If so, is the data split by Ghawar’s five sub-fields? If the data is split then which sub-fields are increasing their production rates in 2025? I don’t understand Rystad’s Ghawar forecast.
In 2006, Hans Jud used Baqi and Saleri’s data and his own modeling to create production history from 1951 to 2003.
https://www.peakoil.net/files/SA-Oilprod_field-by-field.pdf
Tony, that chart is from an ASPO publication made in 2006. Aramco used to allow the Association of Petroleum Engineers data from Ghawar and other ARAMCO fields. They stopped doing that sometime early in this century, 2003 or 2004 I believe.
No, ARAMCO does not give data to Rystad. All ARAMCO data published by Rystad are estimates. All we have so far is the ARAMCO IPO issued in 2019 that showed Ghawar production at 3.8 million barrels per day.
Thanks, Ron
Hicks,
I also question Saudi Arabia liquid fossil fuel production forecast. All the green shaded forecast production just seems optimistic. Is the green mostly NGLs? There must have been some big fields discovered in the 1970s which will start producing in about 2032. Why so late?
It just appears that Rystad is being too optimistic on Saudi Arabia’s future liquids production. There’s also no split between crude, condensate and NGLs.
Hickory,
Potentially the disruption of society due to declining oil output might lead to changes in social behavior.
Some places may see negative changes and others possibly positive changes. A look at history from 1929 to 1950 gives us some idea of the different ways that society might adjust, perhaps some nations will learn from history, many will not.
Dennis , ^Potentially the disruption of society due to declining oil output might lead to changes in social behavior.^
Agree with you 100% . The question now is how extreme . Disruption is already happening . Will the process of change be violent , will it be peaceful ? As we stand today, seems violent . We have entered into uncharted waters. The end of the ^Oil age^ was not going to be pleasant which I learnt from Campbell,Simmons,Dreyfus and our own Ron , but the extent was always an unknown and we are going to discover that . Best of luck to all .
I tend to lean to the pessimistic (realistic) side of things when it comes to humanity, based on the horrific history. Nonetheless, I do recognize that the ill-effects of liquid fuel shortage can be much lower than was possible even 10 years (pre-fracking), since many locales can successfully ramp up electricity as a replacement for the liquids. If they prioritize it. The technology and competitive pricing is now clearly ripe.
Please don’t exaggerate my statement, I am not suggesting cure.
Ten percent reduction in liquid fuel use.
Ten percent replacement of ICE with PHEV or EV.
These things are readily achievable in this decade, if we thought it was important.
It would help, and be a decent start (several decades late).
Hicks,^Ten percent reduction in liquid fuel use.
Ten percent replacement of ICE with PHEV or EV.
These things are readily achievable in this decade, if we thought it was important.
It would help, and be a decent start (several decades late).^
Sorry , I am in disagreement with you on this . A 10% loss in employment the travel and tourism sector cannot be offset by a 10% rise for rise in employment in let us say the manufacture of EV’s . A case of apples and oranges . No, I am not trying to exaggerate your statement ,just pointing out that the cure suggested is not valid . Also electricity is not a substitute for liquid fuels in all liquid fuel applications .
“Also electricity is not a substitute for liquid fuels in all liquid fuel applications”
I agree, and it makes sense to prioritize liquids for the uses most important.
But for pushing passengers around electric works great.
And I don’t think the economy has to contract to save 10% of liquid fuel consumption (or do without as depletion occurs).
We waste a lot on frivolous uses. We tend to use very big vehicles when smaller ones would do just fine- a single person going to the grocery store or work in a pickup, when they have no cargo, for example. For many people, pickups and SUV’s are a fashion statement. And driving a bit slower saves a lot of fuel.
Ten percent wouldn’t be hard, and if it comes to shortage, and people don’t have electric or PHEV’s, then yes some industries will suffer. Like tourism (ski slopes, sports stadiums, cruise lines) and airlines.
Peak anything is a bitch.
Especially when you aren’t ready to make changes.
HinHead, let me give you an example.
I’ve got a plugin hybrid made in Detroit van.
I’ve had it two years now.
Before that I used 100% gasoline to get around.
Now, I’ve gone 73% mileage on electricity(solar) and 27% on gasoline (the ICE is their standard one)
I don’t need to go far most of the time, so this wouldn’t be nearly as remarkable for someone who travels over 30 miles a day routinely. Still, most people could easily save 10% petrol easily with such a vehicle.
This is just scratching the surface on adaptation.
And yes, the van is a great vehicle. It get 32 miles electric.
Other PHEV passenger vehicles on market today get 38-48 miles electric from Ford, Honda, Toyota.
Actually, you’re pretty typical. Divide 2.88 trillion vehicle miles by 278M light vehicles and you get an average of 28 miles per day. 80% of miles driven are within 30 miles of home.
https://www.fhwa.dot.gov/policyinformation/tables/vmt/vmt_forecast_sum.pdf
https://www.autonews.com/automakers-suppliers/average-age-vehicles-us-roads-hits-118-years#:~:text=The number of registered light,average age was 9.6 years.
Hicks ,you have given the answer to the questions by quoting ^Especially when you aren’t ready to make changes.^. Impossible to get 10 persons in a room to agree on change ,how are we going to change 7 billion. Look what is happening with the change regarding masks . There is virtually a war on . Mission impossible . 10% curtailment on frivolous stuff is not feasible . Our’s is ^ The waste fill economy ^ . My frivolous spending is somebody else’s income . If I stop,then someone is going to loose income .
P.S : Can I use the phrase ^Peak anything is a bitch ^ in other posts ,or do you have a copyright on it .:-)
Have at it (on the phrase).
And yes, I absolutely expect a lot of pain in the worlds economy as oil peaks, far worse in certain sectors and certain countries.
True as you say, collective human decision making on big matters is extremely poor.
hole in head,
If 10% of liquid fuel use could occur, but you are correct that it will take a larger than 10% replacement of ICEV fuel use with hybrids, plugin hybrids, EVs, and generally better fuel efficiency for new ICEVs, as not all liquid fuel is used in the land transportation sector.
As to reduced tourism, etc, do you assume the pandemic lasts forever? Perhaps people thought that in 1918 as well, but eventually we develop immunity and develop treatments for those who become ill.
I imagine tourism and travel will be fine in 2 or 3 years. Oil prices will increase to match supply and demand and the increased oil price will cause shifts in consumer behavior where huge SUVs and pickup trucks will no longer be the norm for trips to the mall or grocery store and charging stations for EVs will become ubiquitous because it will be a disadvantage for those places that do not have them. Note that electricity can be produced by many different sources whether it be nuclear, wind, solar, geothermal, hydro, tidal, natural gas, or coal.
Land transport (gasoline and diesel) consumed about 63% of World C+C production in 2019 (52.3 Mb/d), it will be quite a while until World C+C falls to 31 Mb/d, with growth at the 1983 to 2019 average rate, we might see demand of 42 Mb/d for non-land transport uses by 2060. Using an oil shock model I get about 46 to 47 Mb/d of C+C output under a variety of extraction rate (for conventional producing reserves) assumptions in 2060.
Higher oil prices and falling costs for batteries may lead to a gradual transition away from oil use for land transport over the 2020 to 2060 period, though there is no guarantee this will happen smoothly and it might not happen at all, I imagine it will not be smooth sailing, it will take great effort and there will be significant bumps in the road.
On tourism and pandemic: virus by itself seems to be less of an issue. But the economies have collapsed and to that extent recovery would be muted. USA was a bubble even before covid …
Earlier this week, we had a report that suggested over 25% of population in Delhi have developed anti-bodies. This survey was based on a random sample conducted by a government body in India. There were similar such reports from other big cities in India and another survey suggested, 15% of Indians may have already recovered. Note that reported infected counts are way below at about 0.1% of total population – that’s no surprise and everyone knows tests conducted in India are very low.
This means herd immunity is not too far away and infection possibly peaking in a months time. But what’s more important is, mortality rate would be way less: India reports 4% or so, but reality seems to be less than 0.1%.
Similar report by CDC USA (this wasn’t nearly as random) also showed nearly 25% of population in NYC already had immunity. This was conducted couple of months ago. Not sure why that didn’t gain any attention …
Because the serology people have become a cult.
From all sorts of different sources it has become clear that longevity of relevant antibodies is weeks, not months or years.
The profiles of cities are consistently showing lower levels of people with antibodies than expected, leading with Stockholm, for the obvious reason that they disappeared and Memory B cells did not replenish them. If such a thing as herd immunity to this virus ever exists, it’s going to have to be from something other than anybodies.
I don’t know what it means to lose immunity. Memory cells are what they are – they kick in to produce killer cells upon second infection.
But even so, you are missing the point Watcher. This also points to a very low mortality rate. And if I recovered first time without even me knowing that I got sick, why would I be worried about falling sick again?
Satish , I agree with you that tourism and travel is over . As to data provided by the Indian government , if you believe this then I have a bridge to sell you .
Led by ^Lier in Chief ^ Modi .
Lol. Look I am not a fan of any government, least of all right wing ones.
I am aware this was a survey done by government but there were similar reports by private labs. How do you explain falling counts in big cities in India? You could perhaps reduce the rate of increase, but it’s inconceivable to contain this disease in Mumbai and slums of Dharavi.
Hint:
26.8 years old
The median age in India was 26.8 years old
“This means herd immunity is not too far away and infection possibly peaking in a months time. But what’s more important is, mortality rate would be way less: India reports 4% or so, but reality seems to be less than 0.1%.“
Satish,
This means that in India probably even a higher percentage of infections show mild or no symptoms.
Those infections don’t give a strong and long lasting protection against reinfection.
Dennis , yes the era of travel and tourism is over . It is not coming back and I will explain why .
1. The oldies mostly prefer group tours which means your probability of catching the virus increases . Most are now vary of getting on an aeroplane , so this group of travelers is greatly reduced.
2.The millennial group and the backpackers are also dead . The boom was by low cost airlines ,which are docked and are on their destination to bankruptcy . Let alone low cost airlines ,yesterday Eurolines the Greyhound of Europe filed for bankruptcy . No passengers for a Euro 10 ticket Paris to Frankfurt .
3. The world id bankrupt . 50 million wait for the cheque to arrive under PPP so that they can buy groceries and pay for medicines . Another 20 million wait to download the amount under SNAP . This is USA ,one of the most prosperous countries in the world . In UK MORE than 50% of the families are on support . 9 million furloughed and not counted as unemployed because they get cheques under their PPP . Germany the richest in Europe is having disguised unemployment and terrific underemployment . Public is worried where their next meal is going to come from and planning a vacation is the last thing on their mind . The biggest addition in the last years was the Chinese ,well they are no more welcome in any part of the world . End of story .
3. The conditions of the flu of 1918 and today are not similar ,so you cannot make an analogy . Yesterday is not today . The Titanic has hit the iceberg and is taking water .Get a lifeboat . Wait till the elections are over when fireworks will really start .
4. By 2-3 years you presume travel will be back ,but by then the airlines will be parked in the Arizona desert sucking sand . Dust to dust and ashes to ashes.
5. Here is something of interest regarding Germany.
https://www.dw.com/en/germany-stuttgart-frankfurt-violence/a-54267195
Hole in head,
I guess we will see in a couple of years if tourism is dead. It is rather obvious it is doing poorly today, so your firm belief is that the pandemic will never end?
I think that would be a very poor bet, in 5 years it will be behind us, in the mean time I agree the World economy will do quite poorly relative to 2015 to 2019. For 2025-2029, the World economy may be ok as energy consumption would have been subdued over the previous 5 years due to slower economic growth, this might delay the peak in World oil output to 2030 (depends in part on the length of the Depression), then from 2030 to 2035, the absence of any better policy decisions to usher in an energy transition might lead to a second depression from 2030-2035 as the World economy slows in response to high oil prices and the disruption that entails. This second brick up the side of the head to national governments might lead to better policy, or the infinite stupidity of human behavior might prevail. That leads to WW3 unfortunately, not a happy ending.
We should do our best to avoid that outcome, but nationalistic fervor and a lack of diplomacy tends to lead us in that direction.
so your firm belief is that the pandemic will never end?
I think that would be a very poor bet, in 5 years it will be behind us,…
Lend me your crystal ball Dennis, for I think that would be an even poorer bet. One very good bet would be it’s going to get worse, perhaps a lot worse, before it gets better.
The data we have shows the condition is just awful. But that data is woefully incomplete. In South Texas, there are a lot of immigrant families. They live in large family groups but are afraid to get tested because they fear the government. The actual infection rate is likely many times the official count.
I don’t know when this pandemic will be over but I seriously doubt it will be behind us in five years.
Dennis, I don’t know if the virus will be there in 2 years,3 years or 5 years time . Not important because the damage is already done .Understand it is subject to mutation ,one mutation and the world will be back to square one as in Jan 2020 ,all research for the vaccine rendered unsuitable . This is for the long haul . However, I am sure of one thing that it has dealt a knockout blow to the world’s economic and financial system which was already tottering . In boxing a knockout means they will carry you off on a stretcher , the fight is over and there is no chance of another round .
Ron,
Yes it may get worse, then it will get better, 5 years is a long time, the pandemic has been with us for 8 months. The 1918 pandemic was about 2 years and 3 months, not clear this will be worse (roughly 2.2% of the World population died from the Spanish flu). Used information from link below.
https://en.wikipedia.org/wiki/Spanish_flu
Hole in head,
The mutations do not necessarily make the virus more deadly, as it is studied and better understood, treatments will be developed even if a vaccine is never successfully developed. Fauci seems optimistic, I am going to humbly suggest he knows far more than me, perhaps you know more than him?
I think that the pandemic will be subdued within 18 months, due to a combination of semi-effective treatments, vaccination and built up immunity.
But the economic damage will carry on for much longer, and with it a lower oil demand than would have previously been forecast. Peoples savings have taken a big hit. Unemployment will stay high in many sectors for a long time. Some sectors may never recover to prior levels- such as the retail consumer good sector (and all the commercial real estate that hosts it will suffer mightily), tourism, and ICE manufacturing.
The budgets for local,city, state governments , and the spending that they undertake, are shot to hell with this.
Hospital budgets have likely been killed.
Spending on planned equipment upgrades will be put on hold.
Taxes will be increased to help pay for all the unemployment support (32 million now) and lost revenues.
Big long term negative ripples from all these effects.
These comments are US-centric , and may not be relevant to other countries.
A few years ago we had SARS. This year we had CV19. There is a good probability that that China will generate CV2?. Anybody want to guess what that ? mark will be.
On the other hand, Yellowstone National Park is booming.
Fauci seems optimistic,..
Dennis,
Fauci IS optimistic now about one or more vaccines to be ready to use before end of this year. About two months ago he was cautiously optimistic and said that a recent developed vaccine produces antibodies that has neutralizing properties on covid-19. That means that the antibodies bind to the parts of the virus that it uses to bind to cell receptors.
I think that the pandemic will be subdued within 18 months, due to a combination of semi-effective treatments, vaccination and built up immunity.
Hickory,
Yesterday on CNN Bill Gates said that he expects that before end of the year a combination of medicines will reduce the percentage of covid-19 deaths by 80-90 % and that in the year 2021 all the developed countries will have enough vaccines and the same would be true in 2022 for the developing countries.
Who knows.
One problem is that in for example the U.S. a lot of people are ‘anti-science’ orientated and don’t want to get vaccinated.
Mutations is another problem, as stated by Ron. Not all mutations have consequences regarding effectiveness of vaccines though: the neutralizing property must stay intact.
Regarding huilt up immunity: still it is unknown how long immunity lasts. That could well be very short (weeks) in people that hardly get ill.
Stage 3 trials have to show how effective the vaccines are in the elderly and risk groups of the population, and if the side effects are also tolerable.
hole in head,
You seem to believe the outcome of the pandemic will be horrific, the worse it becomes, the more social behavior is affected. Humans adjust to circumstances and societies adjust as well.
Dennis,you misunderstand me . For me the virus is horrific or not horrific is unimportant . A death is a death ,period . Jobs lost are jobs lost . The angle that I view is the economic suffering ,pain ,damage it is causing to society and will continue causing . The damage done is long term and irreversible . You feel it is short term and we shall return to BAU, that is where we differ . Humans adjust well on the up slope, a rising tide lifts all boats , this is the first time in modern history we have a one time event that has exposed all the cracks in our financial and social system . Adjusting on the down slope is going to be a challenge for which we are ill prepared .
hole in head,
Nope. Society will change as a result of the pandemic. so you predict the end of economic growth? That will occur at some point, but at the World level real GDP per capita has mostly risen at about 1.4% per year from 1980 to 2019. That could change, but I expect it will be a gradual change as less developed nations become wealthier and their rate of growth slows, also population may peak by 2070 and start to decline. The only thing that is constant is change, there never has been BAU and never will be.
I do agree there will be economic damage, in the past such episodes have resulted in dramatic social changes (such as US from 1933 to 1945), booms and busts have been a characteristic of capitalism from the start, often people say in the midst of a severe downturn that recovery is impossible. Perhaps that sentiment will one day prove correct, humans are pretty resilient and in some cases make changes that are an improvement.
Dennis,
You state, “in the past such episodes have resulted in dramatic social changes (such as US from 1933 to 1945), booms and busts have been a characteristic of capitalism from the start”.
And this is not the first time you have blamed capitalism for the economic ills. We have not had capitalism in a long while, and I dare say ever.
How on earth was 2008 crash and the years that followed anything to do with capitalism? You abolish fed and you will have none of this. How many disasters do we need before we acknowledge that Keynesian economics do not work.
Murray Rothbard and many others from Austrian economics school of thought have explained everyone of these issues and the government meddling. Fed has only managed to create bubbles and helped governments destroy markets from functioning freely.
I speak for libertarianism and before you guys paint me red, let me say that free market capitalism is the polar opposite of conservatism. It is the far left. It’s only because of modern American political views, these idealogies got distorted. It’s strange to see conservatives and libertarians vote identically. And equally to see liberals and communists together. Historically, Nascism & Communism were viewed as essentially indistinguishable – right of center.
For a proper account of Austrian views, I recommend books written by Murray Rothbard. Road to Serfdom by Friedrich Hayek and Economics in One Lesson by Henry Hazlitt were also some of the books that influenced me. Or, Ludwig Von Mises himself.
Satish, I am a follower of Mises and Minsky so I get what you are explaining . Problem is that economics is also a tool of politics and geo politics . The Breton Woods conference established Keynesian Economics as the anchor for the post WWII economic reconstruction and subsequent order . Very few on this forum were even born then ,however we will bear the consequences of that decision . Was it the correct decision ? I don’t know . The second alternative at that time was Marx . Not a lot to choose from . Currently to point out fault with the past is futile . We are we are, and we have to handle the current situation . As a matter of fact the current situation is out of our control ,all we can do is understand why and how we got here ,because that will at least keep us sane while the world goes running around like a headless chicken . Read Mises etc but better to read ^ Overshoot ^ , ^ The Limits to growth^, Charles hall book on EREOI .
P.S : Glad to know you are not a ^Modi Bhakt^ .
Satish,
There is no perfectly competitive free market capitalism as exists in the World of Walras, upon which most of neoclassical economics is built.
I am not “blaming capitalism for all economic ills”, I am observing historical economic output, purely empirical. Properly regulated capitalism is the best system devised by human society so far, there are no perfect social systems, in my opinion, this will always be true. Booms and busts are just what exist, in textbooks they do not occur, but we do not live in the simplified world of economics textbooks.
“You abolish fed and you will have none of this. How many disasters do we need before we acknowledge that Keynesian economics do not work.”
An alternative view-
The world economy has overgrown its foundations, and is therefore very fragile.
Every year that we don’t have a severe crises, such as 2008-9, and 2020,
is a year that the Fed did an exemplary job.
There is a high risk for a more severe crash at some point, but the Fed can only make so many sandbags at once. They only control one of the many factors at play- The gas pedal of one country.
Keynesian economics is more focused on fiscal policy. The Monetarist view focuses on the Fed. Generally monetary policy helps little with a depression.
Economics is a tricky business no controlled experiments and changing theories influence social behavior making theories obsolete when they become widely accepted. This is true of all social theory.
Hicks . I agree with you to some extent . What the FED did in 2008 was not exemplary but the only action they could do . There was no way out . The alternative would be a system failure . Economists from Mises,Minsky school of thought do not approve of this and I think neither would Adam Smith . At a personal level I am glad they did it because it has given me an extra 12 years of the good life . Simultaneously, I was aware that the can has been kicked down the road ,seems we have now run out of road . Best of luck to all . Take care ,the fireworks are just getting started .
https://www.cnbc.com/2020/07/22/dr-anthony-fauci-warns-the-coronavirus-wont-ever-be-totally-eradicated.html
Dennis your quote ^ Fauci seems optimistic, I am going to humbly suggest he knows far more than me, perhaps you know more than him?^
Well it seems the doctor and me are on the same wavelength .
😉
Of course the virus will not be completely eradicated. There is a lot of room between 50 cases worldwide and a pandemic. I do not think Fauci has suggested that no vaccine or treatment options will be developed in the future. Maybe I missed it. 😉
With this peaking reality now looking more real than ever, I would imagine that many here are pondering whether its worth dusting off our posts of 20 years on OilDrum et al to again go over the expected challenges we are facing. But maybe just a couple of words will suffice: ‘Seneca sucks’.
Brent is almost $45
https://oilprice.com/
TonyEriksen,
They have a split for World liquids, see chart below, but nothing for individual nations.
Better quality image at link below
http://peakoilbarrel.com/wp-content/uploads/2020/07/rystadchemqualb.png
TonyE,
I agree the Rystad projection seems optimistic. The shift report (see page 53) concludes that the peak is likely to fall between Laherrrere’s estimate of 2020 and Rystad’s 2035 estimate for World C+C. If we focus on energy content of World C+C+NGL, BP gets the following for historical consumption data.
Rystad does not correctly account for the reduced energy content of World NGL output, measuring energy in volume terms (i.e. barrels) throws apples and oranges together, not great for energy analysis.
Looking at the chart above, World C+C+NGL output doubled from 30 Mboe/d in 1965 to 60 Mboe/d in 1979, or 14 years. Output reached 40 Mboe/d in 1969 and doubled to 80 Mboe/d in 2013, this time it took 44 years or about 3 times longer. The peak either has passed in 2018 or will occur within the next 15 years, my best guess is 7 or 8 years for World C+C peak (with 50/50 chance it might be before or after Dec 31, 2027), though a 5 to 10 year window (2025-2030), might have a 50/50 chance of the peak falling either inside or outside that 6 year window.
Comparison to a World Oil shock model, modified with extraction rate gradually increasing from 5.6% in 2027 to 7.4% in 2057 (previous version assumed 5.6% extraction rate from 2027 to 2044 with declining extraction rate after 2044.) Peak is at 84 Mb/d in 2030/2031. Note that top two areas are refinery gains (brown) and NGL (pink), the Shock model is for C C only so light purple area (condensate) is included.
Note that Rystad assumes roughly 11 Mb/d of tight oil output in 2060 (assuming 50% of the C C NGL from tight oil and shale gas consists of C C in 2060), my model assumes output of tight oil has fallen to 0.2 Mb/d in 2060. This accounts for much of the difference between my estimate and that of Rystad.
http://peakoilbarrel.com/wp-content/uploads/2020/07/shock200723.png
Link above has higher resolution version of chart below. Shock model is black dashed line.
From shift report page 57. The tight oil projection for nations besides the US is absurdly optimistic in my opinion. Note that in 2019 they have “tight oil” which includes NGL from shale gas at about 12.5 Mb/d for the US. Actual US tight oil C+C output in 2019 was about 7.7 Mb/d (annual average output), so about 61.6% of the “tight oil” in Rystad’s numbers was C+C from tight oil and shale gas production. If we assume this ratio remains constant through the US tight oil peak in 2031 (as forecast by Rystad) at about 18 Mb/d, then C+C from US tight oil in that year would be 18*0.616=11.1 Mb/d. I would put the odds at less than 1 in 20 that this level (11.1 Mb/d) of US tight oil C+C output is reached in the future.
rystad tight
Link in comment above “rystad tight” has better quality image of image below.
The report’s projections of total liquids hang heavy on NGL’s and tight oil.
To achieve those levels of production (if possible) requires the assumption of much higher prices to provide the motivation.
Hickory,
I agree, Rystad assumes oil price returns to $70 per barrel by 2023 and then rises from there smoothly. Even a high oil price scenario will not allow the level of tight oil and NGL from shale plays that Rystad predicts, the C C NGL from shale plays might reach 14 Mb/d (with about 8.5 Mb/d of C C) at most, Rystad also does not use barrels of oil equivalent, it uses straight barrels in its analysis. The NGL barrels have far less energy content than an average barrel of C C, this is a reporting problem for EIA, IEA, and OPEC, all should follow the example of BP and report in exajoules.
US tight oil from tight oil production estimates by play at page linked below
https://www.eia.gov/petroleum/data.php#crude
2019 average US tight oil output 7760 kb/d. June 2020 at 6844 kb/d.
Good read from Reuters on American supply prospects. Stripper wells also being shut in:
“The shut-ins have been dramatic, and some may be permanent,” said Patrick Montalban, a Montana producer and treasurer of the National Stripper Well Association, which represents owners of these aged wells.”
Will US oil ever be able to reach new highs if the base of stripper well production has been permanently curtailed? Seems unlikely…
https://www.reuters.com/article/us-global-oil-usa-shale-insight/bounceback-in-u-s-shale-oil-output-is-unlikely-to-last-the-summer-idUSKCN24O0EZ
Stephen Hren,
Good article, thanks. Note that only 200 kb/d of stripper well output has been shut in, some of it may be shut down permanently, Shallow sand or Mike might be able to offer an estimate of how much, maybe 25%? I really do not know. Probably nobody does, but somebody in the business could make a better guess than me.
Yes but we know that conventional production of all types will continue to dwindle until we have a prolonged uptick in prices. It’s not just about tight oil. Of course no one can know how much of the shut ins of conventional US crude will be permanent, but it will keep happening at WTI < $50.
Stephen,
I agree conventional output will decline (probably at about a 3% annual rate for wells not shut in). For all US stripper wells (less than 15 boe/d output) in 2018 output was about 750 kb/d. So if we assume this was also the level in 2019, stripper wells would have accounted for about 6% of US output. Tight oil is a pretty big piece of the puzzle as about 61% of US output in 2019 was from tight oil.
US output dropped by about 670 kb/d in April 2020, tight oil output dropped by 527 kb/d in April, about 79% of the total drop in output. In March 2020 tight oil accounted for 65% of US C C output, so tight oil is dropping faster than conventional C C output which dropped by about 3.2% in April vs 6.4% for tight oil.
For absolute numbers, we have 143 kb/d for conventional and 527 kb/d for tight oil for the decrease in output in April 2020.
Note that the drop for tight oil output was larger in May at 738 kb/d, but we do not have data yet for all of the US, the monthly energy review estimates are often far from the mark, for April the monthly energy review estimate was too low by 587 kb/d an error of almost 5%. So I will wait for the Petroleum Supply Monthly report for the May US C C output estimate as that is the gold standard (the May data comes out July 31).
I do agree that it is unlikely that the US will reach a new oil peak, I doubt tight oil will make it back to the previous high of 8 Mb/d for the centered 12 month average (Nov 2019). Declining conventional output requires an even higher level of tight oil output to attain a new peak. I think the odds are less than 1 in 4 a new US centered 12 month average C C output peak will occur, but that’s a WAG.
That all sounds reasonable, thanks for your detailed thoughts Dennis.
One thought – how many stripper wells will there by by say 2027-2028 when you propose tight oil might approach its previous peaks? All those depleted tight oil wells, will anyone bother with them?
Stephen,
Difficult to guess the number of stripper wells in 2027/2028.
For US tight oil stripper wells (less than 10 b/d) there were about 3400 in March 2013 and March 2020 the number had increased to 23122. If the rate of increase continued over the next 7 years there would be over 150,000 tight oil stripper wells by 2027.
Related
https://www.visualcapitalist.com/tracking-the-growing-wave-of-oil-gas-bankruptcies-in-2020/
Hole in head: “In boxing a knockout means they will carry you off on a stretcher “. Haven’t watched too many matches?
Greenbub ,boxing stopped being fun ever since Ali left the scene . Haven’t watched since long ,you are correct . I don’t even know who the current world champion is .
you missed a lot of great fights and drama
Bad news .
https://abc13.com/oil-gas-jobs-schlumberger-layoffs-covid-unemployment-houston/6332754/
I wonder if anyone has any experience with developing LNG re-gasification terminals, i.e.,building the infrastructure required to offload a cargo of LNG and store it as it is being fed into the existing natural gas distribution network. Here in Nova Scotia we draw natgas from the Boston area through the Maritimes and NorthEast pipeline (originally built to ship our offshore natural gas to New England; those wells are now abandoned). Plans to dissolve salt caverns to store off-season gas have run into permitting problems, so I wonder how economical it is to store LNG above ground for a while.
We have a developed harbour at Halifax that can handle the big ships, and with so much LNG available along the Gulf of Mexico coast, it would seem that this type of project would be a no-brainer. It obviously doesn’t pencil out; does anyone have any thoughts on why? TIA
Redbriars
I don’t have direct knowledge in what you are looking for. However I did sponsor the demonstration of two LNG buses. Before doing that I toured the the Atlanta LNG site. They had a fleet of pick up trucks operating on liquid natural gas.
They take natural gas and liquify it and do the reverse. Gasifying the LNG requires huge radiators/evaporators to get heat from the air into the LNG to gasify. On very humid days the coils could ice up. Below is a link that could be useful.
https://www.atlanticlng.com/about-lng
Steve is sharp as ever. Some interesting comments also .
https://srsroccoreport.com/its-all-downhill-from-here-u-s-oil-production-peak-already-in-the-rear-view-mirror/
Hole in head,
Steve seems to be using weekly data to pick the US peak, the weekly data is garbage.
So far the monthly peak (for data reported at the end of June) is Nov 2019 at 12.866 Mb/d for US C plus C, new data comes out at the end of July and often there are slight revisions so the date might move as output was pretty flat from Nov 2019 to March 2020 and Feb 2020 or March 2020 might be revised higher in the future or Nov 2019 could be revised lower. It is likely the peak is behind us, I would say odds are 3:1 or higher that 12.9 Mb/d for US C plus C will never be surpassed.
Seems now US oil production starting to increase again.. 11.1 mbpd , are they earning money on WTI 40 usd ?
https://www.eia.gov/dnav/pet/hist/LeafHandler.ashx?n=PET&s=WCRFPUS2&f=W
It’s probably in anticipation of increasing demand. I hope there won’t be a bull trap
Freddy,
As I often point out, the weekly output estimates are often far from the mark, only the data from the Petroleum supply monthly is accurate.
https://www.eia.gov/petroleum/supply/monthly/
Any other EIA data on C C output is not very good. The only exception is the “tight oil production estimates by play” at the page linked below
https://www.eia.gov/petroleum/data.php#crude
So far the minimum reported US C plus C (oil) output has been 12.06 Mb/d. In May tight oil output fell be 740 kb/d, so we might see US oil output fall to 11.3 Mb/d in May and to perhaps 11.2 Mb/d in June. Too early to judge July, as the weekly data is often wrong by 200 to 300 kb/d.
The eia said 70bbbl in midland at 10% recovery. They’ve already made 3 or 4 bbbl. It is fucked civilization will collapse.
Just check this . Read the barrels per oil well . You will laugh . Energy independence ,my foot .
https://www.dmr.nd.gov/oilgas/stats/historicalbakkenoilstats.pdf
Rystad’s New Oil Demand Scenario Banks On Second Wave COVID-19
Rystad Energy is now changing its base-case scenario for oil demand, banking on a second wave of Covid-19.
The new assumption for the base case now incorporates a mild second wave of the coronavirus, which will stall the global oil demand recovery. While Europe reopens parts of its economy, triggering an increase in oil demand, increases in the number of coronavirus cases in other large oil consumers, including the United States, Brazil, and India will offset those European increases, according to Rystad.
Rystad also added a worst-case scenario—one that sees oil demand to be 3.7 million bpd lower for the remainder of 2020, compared to the above base-case scenario, if full lockdowns are reimplemented globally due to increases in the coronavirus.
Rystad notes, however, that even in this case, where a second wave causes widespread full lockdowns, oil demand will not be as hampered as it was back in April when the virus first shocked the oil markets. This, Rystad suggests, is because the world is now armed with better information with which it could implement more targeted lockdowns and handle increased infections. Also at play is the fact that the economy simply cannot handle another “economic meltdown”.
Rystad now sees its base case calling for oil demand to stay flat through October, before inching slowly up thereafter—but more slowly than Rystad had previously predicted.
For July, Rystad now expects oil demand to average 90.2 million bpd; 90.6 million bpd in August, September, and October; 93 million bpd in November, and 94.7 million bpd in December. This compares to oil demand of more than 99 million bpd last year.
But Rystad’s predictions don’t just have oil demand snapping back immediately after 2020 either. According to Rystad, this second coronavirus wave will last through February 2021.
Annualized, Rystad now sees full year 2020 oil demand averaging 89.7 million bpd, with 2021 oil demand averaging 97.1 million bpd—still under the 2019 average. In fact, Rystad does not see oil demand snapping back until the end of 2022, when it sees aviation activity as fully recovered.
India is a catastrophe in the pipeline . Will become number 1 in Corona cases shortly . Economy is dead . 28.5% decline in oil imports .
https://energy.economictimes.indiatimes.com/news/oil-and-gas/june-oil-imports-lowest-in-nearly-nine-years-none-from-venezuela/77177768
India has a special defense. You can’t have deaths from the virus without cases of the disease, but the vast majority of cases do not die.
India has a special defense and it is called life expectancy. They don’t live long enough naturally to reach the disease’s death zone.
Life expectancy in India
Average Life Expectancy in India 2019. As per the National Health Profile 2019, the average life expectancy of Indians is 68.7 years. Male life expectancy is 67.4 years and female life expectancy is 70.2 years. Below is the trend from 1970s to 2016. Nov 12 2019
That is average life expectancy at birth. That means all those who die earlier in life are averaged in. As a person grows older, the average life expectancy for those alive at that age would naturally increase.
But that is all academic. I think India, as well as any other nation in the world, has a lot to fear from the virus.
Guys watch this and you will understand the massive crisis is at hand . Currently the crematoriums are running out of wood to burn the dead bodies as Hindus are cremated and not buried . Very few electric crematoriums in the country . I am reporting from ground zero . Karan Thapar is in India what Tim Sebastioan ,Stephen Sakur at BBC Hardtalk or Ed Murrow or Rather in the USA . No bullshit . 100 million cases . A 1% morality rate is a million dead . Not to be dismissed .
https://www.youtube.com/watch?v=gHakQGaEd9g
P.S : Karan was anchor at BBC hardtalk India . The current Modi govt had him removed and also pressurised other TV channels not to give him a platform .
Where did you get 1% mortality rate for India? I watched a few minutes and discussions talked about not projecting Delhi’s infection counts to rest of India. Sure, it spreads like wild fire in a dense city and rural India is still catching up.
The real point is mortality in Delhi seems to be less 0.1%. New models from USA too point to 0.3%. This is true of sero surveys done in other big cities in India such as Mumbai & Chennai. And they all point to recoveries that is at least an order of magnitude higher and so very low mortality. Why should we not project that mortality rate to rest of India? Perhaps we could argue that cities have a slightly younger population than rural areas. But do you think anyone cares about extremely poor old people in a remote village? And what exactly are they going to do to prevent deaths there? Use computers for farming?
Covid seems to be a non-issue. And Indian governments are too slow to wake up to this reality. You only see corruption all around – be it with the dubious RT-PCR tests they conduct (& the lack of it early on), bed allocations by local politicians & bribes involved, hurried allocations to fast track vaccines and their refusal to ramp up antibody tests (they are quite cheap).
In a month’s time, India would reach herd immunity and numbers would start to decline. But with mortality of less than 0.1% when India’s death rate is 0.7%, this whole exercise of watching daily infection counts is pointless. India does not have a choice either way even if mortality rates were higher at 1% with so much poverty all around.
No Ron, you are completely mistaken about India. Ask a poor migrant from a rural area who moved to big cities in India. We talk about social distance but these folks can’t maintain physical distance even within their homes. They live in such crowded slums and chawls where per capita space would be less than 20 sq.ft with toilets shared by multiple housing units.
And with a draconian lock down through April and May, they lost their jobs and had no where to go. With no money and food, their choice was to die of virus or hunger. With hindsight, I can now say they wouldn’t have died from virus. With no transportation, they walked to their villages that were several 100 kms away often that crossed state boundaries where they were refused entry. A few didn’t make it.
So, no India does not have to fear from virus. They need to worry about this limited lock down in cities that served no purpose. Economy is completely broken and needs to restart immediately.
So, no India does not have to fear from the virus. They need to worry about this limited lock down in cities that served no purpose.
Satish, your logic is so utterly stupid someone might think Trump wrote it.
COVID-19 in India Shoots Over 14 Lakh With Highest Single-day Spike of 49,931 Cases, 708 Death in 24 Hours
Of course, a lockdown would be bad for the economy. Covid-19 is bad for human life. Both are bad. The government must decide which is worse. I will not argue that point but only an imbecile would argue that only one can be bad.
Ron,
Only someone who is naive would believe these counts. Real count is possibly a 50 times higher. And that means mortality rates are so low, it doesn’t warrant these discussions.
This analyst expects things to be pretty much back to normal by the fourth quarter of 2021. I question his logic, or whatever he used to arrive at that conclusion.
CRUDE OIL PRICE FORECAST: OPEC+ SUPPLY INCREASE ON TAP AS GLOBAL ECONOMIC ACTIVITY REBOUNDS FROM Q2 GDP GROWTH IMPLOSION
Rising demand for crude oil has correspondingly enticed OPEC and its allies to begin reversing production cuts announced earlier this year that were aimed at absorbing excess market supply. This was indicated by OPEC+ delegates who backed an agreement solidified by Saudi Arabia and Russia to increase the group’s crude oil output by 2-million barrels per day starting next month.
The move looks to ease OPEC+ production cuts from 9.7-million barrels per day to 7.7-million barrels per day on net. As such, a bearish risk facing crude oil price action emerges with OPEC+ set to unwind prior supply cuts and relax oversight of standing output quotas. Another notable headwind looming over the direction of crude oil includes potential for the v-shaped recovery in global GDP growth to abate as the ‘liquidity high’ from unprecedented monetary and fiscal stimulus measures wears off.
Ron,
That analysis (in the table) basically comes from OPEC, it was in the most recent MOMR, so it is OPEC’s mistake, the analyst simply reports their forecast, but he also seems to indicate things don’t look very good for 2020Q3 and expects demand to be well short of supply and oil prices to remain low.
Just a wag of course but I would expect a vaccine to start being disseminated by next spring (3 good candidates starting phase 3 trials as we speak) and for the global economy to have worked through its doldrums by summer 2022. The next 12 months after that should get very interesting with collapse in investment in the oil sector over the preceding six years.
https://www.thestreet.com/mishtalk/economics/iran-and-china-on-verge-of-a-huge-deal-thank-trump
haven’t seen anyone mention this.
China and Iran on verge of agreeing to military for oil deal….among other things.
New posts up
http://peakoilbarrel.com/us-gom-2019-summary-part-iii-production/
http://peakoilbarrel.com/open-thread-non-petroleum-july-27-2020/