Folks here know that I like to post charts created from oil production data. But there has been a dearth of data lately. But not to worry, the data should start coming fast and furious later this week. However in the meantime I decided post a little about what the EIA expects in the future. They published the below comments and chart April 7, 2014. Bold mine.
Petroleum & Other Liquids
In the Annual Energy Outlook 2014 (AEO2014) Reference case, crude oil* production rises from 6.5 million barrels per day (MMbbl/d) in 2012 to 9.6 MMbbl/d before 2020, a production level not seen since 1970. Tight oil production growth accounts for 81% of this increase, and sees its share of national crude oil production grow from 35% in 2012 to 50% in 2019. In the High Oil and Gas case, U.S. crude oil production reaches 11.3 MMbbl/d in 2019 and reaches 13.3 MMbbl/d in the mid-2030s.
Under the Reference case, the import share of U.S. petroleum and other liquid fuels falls to about 25% during the last half of the current decade before rising again to 32% by 2040. In comparison, the High Oil and Gas Resource case projects that net U.S. oil imports will continue to decline through the mid-2030s and remain at or near zero between 2035 and 2040.
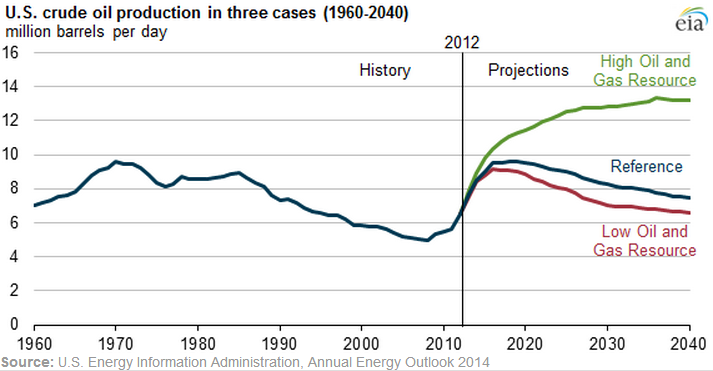
In the High Oil and Gas Resource case, tight oil plays an even more prominent role in driving national production growth, accounting for nearly two-thirds of total U.S. production by 2035, versus less than half of total U.S. production in the Reference case. Tight oil development is still at an early stage, and the outlook is highly uncertain. In EIA’s view, there is more upside potential for greater gains in production than downside potential for lower production levels. The High Oil and Gas Resource case assumes improvements in tight oil production technology beyond those in the Reference case, as well as higher well productivity rates.
Other assumptions reflected in the High Resource case include:
- Identification of additional tight oil resources
- 50% higher Estimated Ultimate Recovery (EUR) for tight/shale oil and natural gas wells
- 50% lower well spacing per acre for tight/shale oil and natural gas wells, with diminishing EUR for closely-spaced wells
- A 1% annual increase in the EURs for tight/shale oil and natural gas wells reflecting both abundant resources and technology advances
- Additional resources in Alaska and Lower 48 offshore fields
They are covering all base so how could they be wrong? But they say there is more upside potential than downside potential. That is, they think the high oil projection is more likely than the low oil projection. I would beg to differ because, so far, it is looking like the low oil projection is pretty much on track.
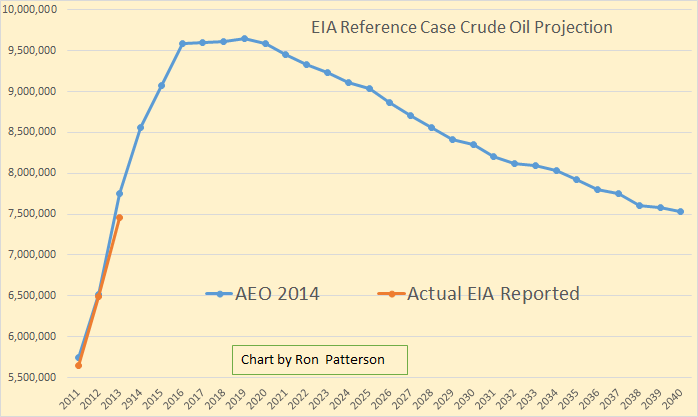 Average 2013 crude oil production came in 300 thousand barrels per day lower than the EIA’s projected reference case.
The EIA also projects what future imports are supposed to look like. Notice that projected imports are not in barrels per day but percent of total consumption.
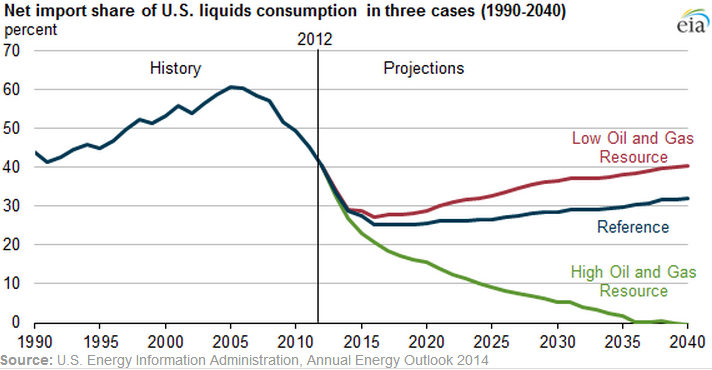
In the high reference case the US becomes energy independent around 2036. In both other cases imports bottom out in 2016 and then head upward. So what’s all this noise about dropping the US ban on exporting crude oil?
Natural Gas storage continued to drop. We were 1005 BCF below the five year average for the week ending 28 March 2014. This data can be found at: AmericanOilman.com
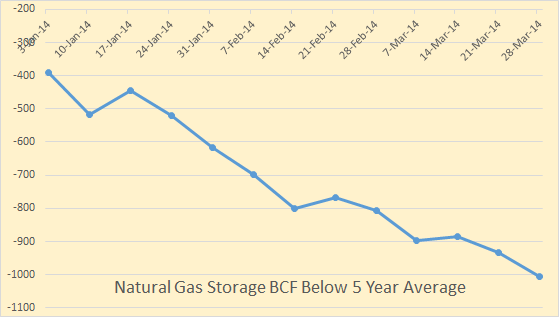
This is not because production is falling.
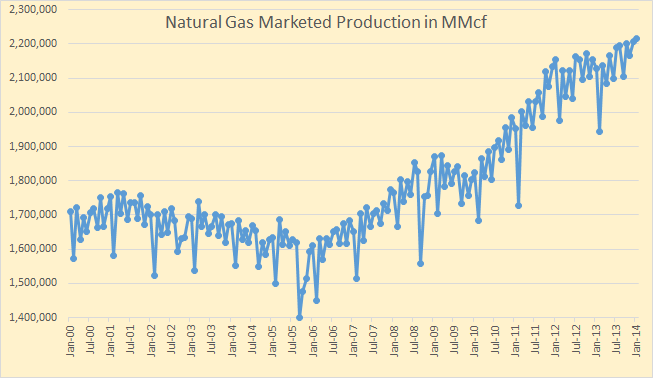
A really severe winter was one cause of the drop in storage but more natural gas fueled power plants is part of the cause also. As long as gas remains so cheap the situation is not likely to get any better. It is trading around $4.50 per MMbtu today, April 7.
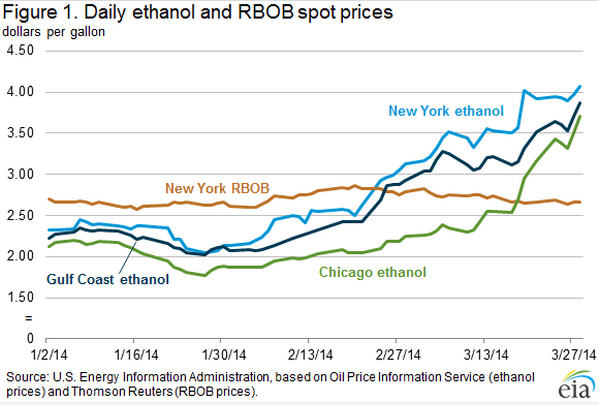
The price of ethanol is getting very interesting.
*Crude Oil, in all cases here also includes Condensate.
119 responses to “Just How Good Are The EIA’s Predictions?”
Thank you, Ron, for your excellent blog. I don’t always understand it, but I always enjoy and appreciate it.
In related news, the EIA recently announced their AEO research department has relocated to “the Emerald Triangle” on California’s north coast.. When asked for an explanation of the move, EIA sources replied, “Research staff felt it important to be closer to the source of their primary research tool”.
This latest move holds the promise of putting the EIA research department at the same high level of achievement as CERA’s and the IEA’s energy research teams….
I also want to say thank you for the hard work you put in to creating this blog, have been following your insightful analysis of the data since the oildrum days when I used scan through the comments section looking for your opinions. Whilst I’m neither an oil industry person nor one of the white middle class engineers which appeared to be the standard profile of the old oildrum I never the less I find your articles pretty clear and easy to follow. I also find your projections to be realistic rather than doomerish. Anyway as regards to the US natural gas storage situation referenced near the end I find myself wondering how long it will take the market to really appreciate the urgency of the situation and really start pushing up the price.
I also find your projections to be realistic rather than doomerish.
Well I try to be realistic but I have been a doomer for a lot more years than I have been a peak oiler. That’s why I posted David Price’s essay “Energy and Human Evolution” as a page on this blog.
Hi Ron, hope you find this Brazilian link interesting…
http://www.presalt.com/en/pre-salt-production/brazilian-pre-salt-production-all-wells/2459-presalt-com-monthly-production-report-of-the-brazilian-pre-salt-august-2014.html
Ethonol going up because nat gas is used for fertilizer stock?
We turn oil into food, food into oil… makes perfect sense.
Nah, what’s happening is, the big, obligated refiners/marketers, such as Exxon, et al, are still refusing to use their allotted amount of ethanol (by selling E85, E15, etc,) and as a result they’re having to go out into the market and buy RINS.
As a result, the corner service station is able to buy ethanol, and turn around and sell the attached RINS for a huge price – last year at this time the RINS were going for $1.35, or so.
Once the RINS are taken into account, ethanol is selling fairly reasonable (Carbon Green Bioenergy in Michigan was selling E85 for $2.29/gal. the last I looked.)
I cannot quite make sense of you corner service station and rins.
I assume by corner station you actually mean small refineries and so forth but I still don’t get it.
I don’t know of any major brand service stations or any stations at all for that matter , with one single exception, that are not selling E10
Mac, “corner station” would be a metaphor for small independent marketer. (ie. non-obligated party)
The “Obligated Parties” can no longer meet their ethanol quota – it goes up a little bit/per gallon every year – simply by blending 10% ethanol in their gasoline.
From here on out, (actually, starting last year) the Exxons and Chevrons of the world will have to sell some higher ethanol blends, or buy RINS from other parties.
For some inexplicable reason, these large companies have continued to place their bets on a bid to get the Obama EPA to loosen their RINS constraints, rather than just sell some higher blends. As a result, they have to scramble in February and March to buy Renewable Identification Credits every year.
RON,
I believe the EIA’s HIGH OIL & GAS PROJECTION is SPOT ON.
Peak Oil is Dead.
steve
Did you notice that the difference between their Reference and Low Oil point is 2040 is only about one million barrels per day while the difference between their Reference and High Oil point in 2040 is about six million barrels per day? Why this great disparity? They are all their money on Light Tight Oil. The High Oil point assumes that LTO will just keep increasing into the stratosphere. And they say this is more likely than their Low Oil prediction. For this to be the most likely sweet spots will not run out, wells drilled will expand exponentially and decline rates will improve dramatically.
I don’t think this is very likely at all. Either these guys are lying or they are just not very smart.
Hi Ron,
I am not an expert in oil like you (although I do like to think of myself as a well informed layman !) but I have been paying close attention to the way government fore casters work for about four decades now.
A few people at the top find out what the bosses want to hear and provide guidelines to their underlings that guarantee predictions that will make the bosses happy.
The bosses of course are over at the fed and the commerce department and other such places and if they don’t get the messages they want to hear they get new messengers.
I hate to be utterly cynical but this same pattern is repeated right across the board in every part of the government I have had reason to study.
There are plenty of former employees of such agencies that will tell you I am barking up the right tree.
So long as they played along they got along.
To twist a famous quote around a man’s salary actually often depends on his understanding things which are necessarily left unsaid.
“Either these guys are lying or they are just not very smart.”
EIA nat gas inventory data is a lie and Robry proved it: http://www.investorvillage.com/smbd.asp?mb=4288&mn=136781&pt=msg&mid=13707301
I proved EIA’s Texas oil production data is a lie.
Their forecasts are always cornucopian and later proved false.
US government data on inflation is always understated. US government data on employment and GDP is always overstated: See shadowstats.com.
If it is not a lie, why is every data point produced by the government tinted in massive shades of optimism???
The government is honest?: http://www.investorvillage.com/smbd.asp?mb=4288&mn=135196&pt=msg&mid=13644647
Coolreit,
I agree with you on this one. Energy analyst Bill Powers believes the EIA has been overstating production figures in same areas, up to 10%. In the newest NatGas report, the EIA stated that New Mexico is still growing gas production, but according to the state data, production has been steadily declining for the past 10 years.
steve
Hi Steve,
The state data is often not very timely, the EIA data for more recent months (the most recent 12) is better than the RRC of Texas data.
	Feb 2013 data			April 2014 Data
     EIA(MMb/d)TRC(MMb/d)%  diff    EIA(MMb/d)TRC(MMb/d)	% diff
2005	1.076	   1.076		1.076	  1.076
2006	1.075	   1.075		1.075	  1.075
2007	1.072	   1.072		1.072	  1.072
2008	1.109	   1.109		1.109	  1.112
2009	1.093	   1.094   -0.1%	1.094	  1.094	        0.0%
2010	1.171	   1.167    0.3%	1.168	  1.169	       -0.1%
2011	1.463	   1.411    3.7%	1.453	  1.446	        0.5%
2012	1.986	   1.632    21.7%	1.98	  1.949	        1.6%
2013				        2.561	  2.315	       10.6%
The Feb data above is taken from Roger Blanchard’s post
http://www.resilience.org/stories/2013-03-19/commentary-texas-and-eagle-ford-where-the-action-is
and compared with EIA and TRC data downloaded April 8, 2014. The TRC data is not nearly as good an estimate for actual C+C output for the most recent year, EIA data may be high by 1 or 2 %.
You don’t believe the shadowstats data, do you? For inflation, the billion prices project is much better.
The EIA is saying that even in the worst-case scenario, production will be stable or increase for as long as the eye can see (30 – 50 years). How can one be pessimistic about the future of the oil supply?
And this is the case for other countries too, if they could just reduce regulations, let free enterprise flourish, and reduce taxes.
And this is the case for other countries too, if they could just reduce regulations, let free enterprise flourish, and reduce taxes.
But of course! There is just nothing that reduced regulations, low taxes and free enterprise cannot do. This method could very easily produce oil where no oil exist. This method could get blood from a turnip…. Couldn’t it?
I would like to remind the CONSERVATIVE & LIBERTARIAN wanna-bes that the human body has regulators for a reason. Without regulators the body would die after consuming 1-2 alcoholic drinks.
Sometime along the way, WHITEY forgot this innate understanding and decided to transform animals, plants, fish and the environment from the vital web of life to a quantifiable RESOURCE.
Thus, the age of RESOURCE EXRACTION began in earnest.
Unfortunately for WHITEY, this game of transform life into resources is coming to an end as the environment’s check engine light is blinking RED.
Lastly… Ron, I totally agree with you. The EIA is completely FOS.
steve
We should avoid the use of terms such as ”whitey” in this sort of forum.
old farmer,
I use that term to describe humans that have lost their way. I fit into that category. When we worked close to the land we had color on our face and skin. The Sun is a vital element of health.
Now, because we work inside all day long, we are just like a piece of Bleached White Bread.
Has nothing to do with race.
steve
I agree with OFM on the use of colors. There are some expressions which are “loaded” with all kinds of meanings.
“Has nothing to do with race.”
Usually is used because the opposite is true.
If you have to say it, then whatever you are trying to defend, should not have been said, not here IMO.
Maybe you got a point there. Let’s E-nay on that term and insert NITWIT. I still get my point across and don’t hurt anyone’s feelings.
Steve
Hi Canabuck,
I think you may be confusing the net imports chart with production, after 2020 US production decreases except in the high resource case, which when you add up the numbers is 92 Gb for the reference case from 2011 to 2040 and about 200 Gb for the high resources case, when added to the 190 Gb already produced by the US we get close to a URR of 400 Gb.
Let’s just say it is a wee bit optimistic 🙂
I didn’t see an import chart above.
Though it seems that there is a predicted production decrease after 2020. I would also say that the further into the future you go, the wider the error bars on all of the predictions. And so, anything beyond 5-10 years is just guesswork, and we should not consider it, especially for business decisions. I think too many prediction charts do not have error bars.
The growth of wind power in Germany, and the decline of nuclear power in Japan are two examples of big changes that were not foreseen.
Yes, the URR of 92 – 200 Gb is a wide range.
Peak oil is not dead just yet.
It remains to be seen whether any country that has experienced a major decline in production over a long period can ever surpass it’s previous peak.
Oil is going to live a little longer before we preach it’s peak funeral-maybe another three or four years.
But it is about as close to a cinch as you can get that unconventional production world wide cannot ramp up as fast as legacy conventional fields are declining – unless prices rise sharply.
Substantially higher prices might stimulate enough new production both conventional and unconventional to offset depletion for a few more years.
The real reason peak advocates have been wrong so far is that we did not seriously anticipate the world actually being able to consume oil in the amounts it does at a hundred dollars a barrel.
We loved to talk about what would happen when prices shot thru the roof.The one thing we did not anticipate as a group is that the economy would actually stagger on with oil prices so high.
But in terms of history a year is but a day or two to a man. Peak oil will play out slowly in terms of the way our minds work it will happen in a flash in terms of history.
Unless the economy can by some means continue to function even with substantially higher prices than a hundred bucks a barrel peak is pretty close.
A whole lot of very smart people think the economy is already on financial life support.
I tend to agree with them but I also think that if peak oil plays out slowly enough that we can manage a transition to coal based and renewable energy and continue business as usual until we fry.
My guess for what it is worth is that falling oil production will catch the economy by surprise sometime over the next decade.
If this happens ,we aren’t going to have adequate time to adjust to a lack of oil with the consequences running from a more or less permanent super duper depression possibly all the way to WWIII.
Prices are up about five times with production still flat over the last decade.
This basically boils down to two questions.
One A is how much new production could be brought to market with prices up another fifty bucks or so by way of example and one B is how long it would take for that to happen.
Number Two question is whether the world has the ability to pay that hypothetical one fifty.
old farmer,
I was making a funny.. a joke. If you read the words inside the text-box in that chart you would have realized the EIA is completely lost their marbles.
steve
I should have had another cup of coffee before I posted that comment!
IF the box had been a bear it would have had me for breakfast for sure.;-)
With 7 new export terminal permits for liquefied natural gas approved and 14 more pending I would guess that the price to consumers for natural gas is going to go nowhere but up – up – UP! The rapid switch from coal to natural gas for electricity generation (driven by the fed gov according to my local electric co-op) I expect electric rates to go way up over the next 10 years with a lot more brownouts and rolling blackouts.
With one propane export terminal exporting 400,000 barrels per day of propane last year and 3 more terminals set to come on line exports of propane by 2020 are supposed to be 1,800,000 barrels per day, I am predicting that the price and availability of propane for corn drying and home heating are going to both get worse. Unless we have a really dry fall and mild winter, propane prices will go way up and there will be shortages in the Midwest.
It will be interesting to see whether my predictions or EIA’s come closer to reality by 2020. (Only 6 years away – WOW!)
Ron, Thanks for all the work you go to to supply the rest of us with all of this information. I really do appreciate it.
Nah. This is not a problem. If the numbers don’t look good, a minor esoteric change can be made raising the definition of crude to API 55 and presto, crude production will look okay.
You can somewhat bet on this. If shale drilling starts in China, why would they be obligated to define their output according to the AMERICAN Petroleum Institute’s definitions? Or why would Russia feel so obligated?
The High prediction is simply politics; giving powerful groups what they want in order to maintain their agenda. This is clear by the way the ‘Reference’ and the Low are almost identical, or at least are proximate. Clearly these lines reflect the general area that the technical staff think likely. The green [ha!] line is simply raw meat to the O&G industry, the whole BAU machine, and of course to the America Triumphant nostalgists.
“The High Oil and Gas Resource case assumes improvements in tight oil production technology beyond those in the Reference case, as well as higher well productivity rates.”
What were the improvements assumed in the reference case?
Hi all,
I begin to suspect that we will not see peak oil in our lifetime (with all that this means for people that see reality with a peak oil view). Seeing the evolution of Iraq’s oil production since the US invasion one begins to understand that US government (or whoever is that is really in control in the US) will do “what needs to be done” to kick the can down the road. The destruction of Iraq to secure the flow of his cheap oil was something needed to be done to give more time to BAU. If this Matrix MUST continue, what else do you think has to be done? I mean… to get to the level of destroying a country using the lie of WMD (ah, and doing great business in the process)….
eugeni, that was a great ‘concise’ comment. However, invasion of Iraq, Libya, as well as all the other proxies wars in The Middle East are consequences of oil. And other other factors, of course.
You could even say that US running private and government debts, and QE ‘mainly’ for the elites, has to do that we can NO longer grow. Again , oil been a major factor.
And again, thanks to Ron, and all of you, to take on [keep us on] where ‘The Oil Drum’ left us.
Outstanding work and website layout!
Rather than post the same arguments again, a link:
Has global crude oil (not C+C) production peaked?
http://peakoil.com/forums/viewtopic.php?f=1&t=69442
Perhaps the best supporting data are down toward the bottom of the thread.
Estimated* Global Crude Oil Production, 2002 to 2012, mbpd
2002: 60
2003: 62
2004: 65
2005: 67
2006: 65
2007: 65
2008: 66
2009: 64
2010: 66
2011: 65
2012: 67
*Assumptions: Global Condensate to Crude + Condensate Ratio was 10% for 2002 to 2005 (versus 11% for Texas in 2005), and condensate production increased at the same rate as the rate of increase in global dry processed gas production from 2005 t0 2012 (2.8%/year, EIA). Crude oil is defined as oil with an API gravity of 45 or less (per RBN Energy). Data rounded off to two significant figures.
So once the ‘compensatory gas’ falls away (~ 2017?) things will really start to get interesting?
I am basically arguing that global crude oil production*, basically peaked in 2005, but global gas production–and associated liquids, NGL’s and condensates–continued to increase. So, when global gas production plateaus or declines, we would a plateau or a decline in total petroleum liquids.
However, we have already seen a material decline in Global and Available Net Exports of oil. Following is a graph showing normalized liquids values, partially updated through 2012.
*45 or lower API gravity oil (per RBN Energy)
Thanks again, and did I just read Ron recently making a gas-decline prediction recently? 2017-ish? If so, is it doubtful that the next economic stair-step is going to be anything like 2008’s? If so, what kind of economic stair-step do you figure?
did I just read Ron recently making a gas-decline prediction recently? 2017-ish?
I really don’t think so. I did predict peak Crude oil 2017-ish however.
If enough attention is attracted to it, I suspect nat gas can be redefined too. Kashagan is apparently flowing big numbers for H2S and I am sure that could be lumped in with the CH4 and added up.
Hell, if air bubbles get in, we’ll count those, too (unless we are reporting it to the tax people).
Understood, thanks.
Yes, you’ll see peak oil in your lifetime. You’re seeing it now. We’re in the bumpy plateau, with some fracking gimmicks being used as part of the long con. Which isn’t to say that fracking isn’t real and isn’t producing real oil and gas, but it’s just another desperate act to kick the can down the road a bit, and it’s a very short term one at that.
The real question isn’t if we’ll live through peak oil–it’s here, we’re living it–it’s whether or not we’ll live to see a mainstream acknowledgement of its reality. I think there’s a solid chance that when the fracking bubble bursts, peak oil is going to start getting some serious national discussion again. But there’s about as good a chance, in my mind, that we’ll turn our eyes to some other bubble to claim that peak oil isn’t real and that everything’s going to be fine. All the same nonsense we’ve been hearing since 2008 (and during economic troubles before that) that we’re about to turn the corner, green shoots, new growth, human ingenuity, blah blah blah *insert your favorite desperate denial here.*
We’ll probably get another economic tumble along the lines of 2008 when the fracking bubble bursts. Gambits and counter measures will be brought to bear and eventually they’ll stabilize us at a lower standard of living. The usual rhetoric about turning the corner and getting back to our glory days will be trotted out once the crisis has been stabilized, some new bubble will start being inflated (perhaps solar PV–which isn’t going to solve our problems any more so than fracking, but sounds like a better bubble to live through to me) and a sizable portion will know that everything’s broken but will continue to try to convince themselves that they can go on living the way they’re living and someone somewhere will fix things so they don’t have to dramatically alter their lives and learn to get by on far less energy, resources, and money than they currently do.
Meanwhile, everyone who isn’t figuring out how to do exactly that–get by on far less energy, resources, and money–right now is flirting with disaster. We’re all going to be a hell of a lot poorer in the near future and if you’re not trying to figure out how to do that as gracefully as possible, you’re shooting yourself in the foot. Not that figuring those things out right now are any guarantee that you won’t get the short end of the stick in the future, but it at least gives you a touch more of a fighting chance.
[…] Just How Good Are The EIA’s Predictions? » Peak Oil BarrelPeak Oil Barrel. […]
hi Keyser,
thanks for the answer, that is exactly my point. From a peak oil view, everything can be related to energy, and thanks to dedicated people like Ron and a lot others, it seems clear to me that we are pretty close to a moment of real economic collapse. So, to avoid this, to continue BAU instead of a changing the economic paradigm (or reality paradigm) what should happen? what should happen to avoid peak oil in the next two years I mean (as it seems we are headed)? should be something BIG or we can go on fracking everywhere? china should stop growing? india? because if there existed a temporal “solution” like Iraq (UN embargo + 2003 invasion) I guess if there is a temporal solution now (like the 2008 crisis, in my opinion), even if is a crazy idea.
Didn’t Cal-Pine Energy go belly up when natural gas hit 20 dollars back ca. 2000? It will be deja vu all over again. I guess it never gets old to learn things the hard way one more time.
Propane for drying grains? Not anymore. A farmer I know has set up a grain drying system using coal. Spent 400 grand and it has paid for itself already. The farmer has plenty of customers standing in line to have their grain and corn dried with the coal system.
Fortunately, there are other fossil fuels to replace what was once the preferred choice of fuel to provide heat to dry grains. The reason why? Price.
In 1981, I dried 800 metric tonne of sunflowers, the entire crop, with a propane fueled grain dryer. The price of propane was at .59 and the bill was 15,000 dollars for the propane that fall. That’s about 24,000 gallons of propane. This past year, the cost would have been 120 grand. Prohibitive costs force changes.
The 800 metric tonne of sunflowers were properly dried and the sale of the sunflowers produced a good profit. Without drying the sunflowers, the price received would have been in the 1 to 2 cent range, not the 17 cents per pound price paid. The propane cost was a not a huge factor, it was inexpensive. Coal has become the fuel of choice to provide the heat energy to dry grains for one farmer and it has worked out fine.
Oil does price itself out of the market. The bottom line always prevails.
Always a choice in the matter, even when it seems that there isn’t. Coal’s future as an energy supply will never die in a thousand years, it is there to use and it will be used. One thing about coal, it is an inexpensive and efficient source of energy and will not fail in the long haul. It is better than oil.
Oil? Too much consumed for frivolous reasons and the price will remain high for a long time to come, barring complete collapse.
It is peak oil from here on out for the simple reason that there is too much waste involved.
Auxiliary energy sources will remain a distant second, third, fourth, etc.
What is the market for sunflowers? Or is it seeds?
I am writing an article and was wondering if any of the below make sense.
(Feel free to edit it for better, or any, clarity. Careful, though, I may credit you.)
“Divesting from the fossil-fuel industries seems to presuppose that the monsters’ monetary system hasn’t, at least, significantly, decoupled from reality or some vestige of rational, common-sense on the part of capitalist-state governments, investors and markets, but who is to say that, if divesting starts siphoning off sufficient levels of capitalist-state lifeblood, the monsters won’t start– or continue– dangerously flaying about in contrived coups and pseudo-wars, and attempting to switch from one type of (self-)financing artery to another, if ‘too big to fail’, ‘printing money out of thin air’, ‘neo-slavery’ (neo-human energy-slaves?) or authoritarianism mean anything. Also, there are some apparently very strong ‘sociohistorigeopolitical’ connections between state governments, fossil-fuel/fossil-fuel industries and their military industrial complexes, which, for one example, take a lot of juice to run. This is possibly in some part why large-scale centralized capitalist-state governments have done very little in the way of dealing with climate change and fossil-fuel consumption, because each, pursued to the letter, writes their demise/epitaph, and there are a lot of employees in government, a lot of lock-ins… in need of freeing.”
http://www.resilience.org/stories/2013-02-18/commentary-the-export-capacity-index
Thanks, Jeffrey.
I have yet to read your entire article, but why should they ‘overlook’ that? How much sense does that make?
Almost no one understands what I call “Net Export Math,” or if they do understand it, they are largely in some stage of denial (including senior personnel at the EIA and DOE, whom I briefed on Net Export Math, along with a contingent from ASPO-USA, in December, 2012).
My estimate is that in the seven years from 2006 to 2012 inclusive we have already burned through about one-fifth of post-2005 Global CNE (Cumulative Net Exports of oil). Note that by definition, the remaining supply of post-2005 Global CNE has fallen; the only question is the rate of depletion.
I’ve never exactly considered, until now, what this oft-mentioned ‘denial’ exactly signifies, what its implications are, etc.., to say nothing of those who can’t deny something they know nothing about.
maybe the denialists did something unspeakably evil in response to peak oil
We have to stop them.
This is the spirit Caelan!!
I recommend you begin with family and friends, a lot of us did it, you will understand what is denial 🙂
You have draw-down (overshoot) and then the parable of the violent tribes. How do you offer an alternative, real-time sunlight way-of-life that successfully competes with one that is drawing-down (cheating)?
“It might be tempting to hope that capitalism will collapse on its own. Unfortunately, the system isn’t going to smash itself. Capitalism in crisis becomes even more ruthless. They no longer even bother to keep up the pretence of caring about the future. Resource depletion and natural disasters aren’t problems for capitalists— in fact, scarcity makes prices and profits soar, and catastrophes are huge investment opportunities. The only panic that a capitalist feels when contemplating the melting of the Arctic is that he won’t get to the newly uncovered oil first. They don’t care where they get their energy, as long as they control it all. The system is dynamic, adaptable, and infinitely ruthless. Capitalism will ultimately destroy itself, but only when it’s destroyed all life on the planet, which is too late to matter.” ~ Stephanie McMillan
…Family and friends? What family and friends? 😉
(To Caelen, not eugeni. And really, to Stephanie McMillan.)
The notion that capitalism–or humanity in any societal or economic configuration–can kill all life on this planet is the height of hubris. We can’t and we won’t. We’ll kill a lot, and we’ll kill a lot of ourselves in the process–and lord knows we’ll just keep making a horrific mess of things until natural limitations fully clamp down and put a stop to our nonsense–but we aren’t going to destroy all life on this planet. We don’t have that power, and the belief that we do is borne out of the same deluded industrial belief system currently running our civilization into the ground.
JC, Point taken, and I’m going with what Stephanie McMillan likely had thought.
She also does comics, along with her ride
So poetic license seems quite on her side.
With more poetry and love
And no greed from above
And more of what’s left of the Earth’s fossil goo.
For the kids, it is imagined, they’ll agree, too.
I can get behind a little poetic license. I’ve been known to take some myself. I’ll have to add some of her work to the reading list and see what I think.
the evil will destroy itself… but it’s the death throes
the empire will thrash around and kill lots of people as it dies.
.
.
it’s the imperial character… i guess you could start from 1908, when the british empire discovered oil in iran…
or you could start from the arly 1800s, when the brits addicted millions of chinese to opium
there’s been a few dustups, a couple change-of-command ceremonies since then, but it’s just the same old empire that preserved itself in the 1800s by addicting millions of chinese to opium
we’re still using opium to prop up our financial system, so i guess the imperial character hasnt changed much
they’ve just got better at jpublic relations
and they got lots better tools
Too many are taking that lying down… and in bed, dreaming.
Hi Jeffrey,
I have often wondered how you determine what the “post 2005 Global CNE” is. You need to assume that you know the rate that consumption will increase in exporting countries (there is no reason to assume this rate will remain fixed, it could increase, decrease or remain constant), let’s say it remains at the same rate as over the 2005 to 2013 period (average rate over that period). You also need to know how much oil these net exporters will produce from 2005 to whenever they stop producing, what number do you use for this estimate? Does it take into account the Tar sands in Canada and the Orinoco belt in Venezuela?
Let’s say prices rise to $300/ barrel (in 2013 $) between now and 2033, a 6% annual rate of increase (about half the 1998 to 2013 rate of increase), does that change your expectation of how much oil might be produced?
For the Six Countries, based on the seven year 1995 to 2002 rate of decline in their ECI Ratio (see definitions below), they would approach zero net exports around the year 2015.
I multiplied their annual net exports in 1995, one GB/year, X 20 years X 0.5 (area under a triangle), less one Gb (net exports at peak in 1995) to get an estimate of post-1995 CNE from the Six Countries of 9 Gb, based on the seven year 1995 to 2002 rate of decline in their ECI Ratio.
Actual post-1995 CNE were 7.3 Gb. As I have previously noted, as their production increased from 1995 to 1999, they had already shipped about half of post-1995 CNE.
Definitions:
Six countries = The major net oil exporters, excluding China, that hit or approached zero net exports from 1980 to 2010
ECI Ratio = Ratio of production to consumption
GNE* at (so far) net export peak in 2005: 16.6 GB.
Based on seven year 2005 to 2012 rate of decline in Top 33 ECI Ratio:
Estimated p0st-2005 Global CNE = (16.6 GB/year X 66 years X 0.5) less 16.6 GB = 530 Gb.
They shipped about 111 Gb from 2006 to 2012 inclusive, suggesting that Global CNE were about 21% depleted at the end of 2012. Many things are possible, but this is what the data show, using a method that was too conservative for the Six Country Case History.
If you want a really interesting CNE estimate, try estimating remaining Available post-2005 CNE (GNE less Chindia’s Net Imports, CNI). At 2005 to 2012 rate of decline in GNE/CNI ratio ANE (GNE less CNI) would theoretically hit zero around the year 2030.
*GNE = Combined net exports from Top 33 net exporters in 2005.
Should read:
They shipped about 111 Gb from 2006 to 2012 inclusive, suggesting that Global CNE were about 21% depleted at the end of 2012. Many things are possible, but this is what the data show, using a method that was too optimistic for the Six Country Case History.
And the rates of change in the ECI ratios for the (2005) Top 33 net exporters from 2005 to 2012. This is our global net export supply base:
Pretty popular presumption that a price increase yields more oil.
But don’t the truck drivers get pay increases if such inflation occurred? Not to mention the cost to fill their diesel tanks.
Is it certain that a price increase makes more oil sources profitable? Maybe no longer. If there were a big price jump, hard to see how the Teamsters don’t arrive in force to unionize those guys.
Price increases do increase elasticity of demand however,
next reprice will discover a whole lot more can’t, shan’t, won’t current oil users. By choice or not.
Loren Steffy is a rational voice in the MSM wilderness:
http://www.oilvoice.com/n/Oil_exports_The_rhetoric_and_the_reality/e30e5b32c90e.aspx#gsc.tab=0
A somewhat more rational (but still on the optimistic side) scenario for US LTO in chart below.
The EIA’s AEO2014 tight oil reference scenario is included for comparison. Note that the AEO2014 output is 44 Gb from 2011 to 2040 and if a tail is added for 2041 to 2073 the URR would rise to 55 Gb from 2011 to 2073. The high resources case has 50% higher EUR per well so the estimate would rise to 82.5 Gb, down spacing raises it another 50%, so 124 Gb, then we have the 1% annual increase in EUR over 26 years or another 29% increase which brings us to 161 Gb of LTO, add this to the 190 Gb that the US has already produced for 350 Gb of C+C output and we are the new KSA 😉 My scenario is a measly 23 Gb and is in my view too optimistic, maybe a 25% chance of achieving 23 Gb of LTO.
From the Wall Street Journal, behind a pay wall but I got it through Google News.
Oil Futures Vault on Lower Production Forecasts
The U.S. is likely to produce 8.37 million barrels a day of crude oil this year, the U.S. Energy Information Administration said Tuesday. The projection is down from 8.39 million barrels a day in the EIA’s previous forecast but still up from 7.44 million barrels a day in 2013. In 2015, the EIA forecasts production of 9.13 million barrels a day of oil, down from 9.16 million barrels a day previously.
The EIA decreased their projected prodution by 20,000 bp/d and WTI futures jumped by $2.00 a barrel. But I think they still have their prediction way too high. They say production increased in 2013 by 952,000 barrels per day but will increase by only 930,000 bp/d in 2014. I would bet production will not increase by nearly that much. Less than 800,000 barrels per day I believe.
“On” style attribution is usually worthless.
ZH’s earlier stuff:
surge in prices of oil (Brent and WTI) as news broke of tanks rolling once again in Eastern Ukraine.
Kinda hard to figure out what the EIA is thinking.
Nope, look at what Continental (CLR) did today. Up about 5% as was Kodiak (KOG) which is said to be the most exciting Bakken company. Oasis is looking good to. Folks the juggernaut that has been unleashed by the dual miracles of horizontal drilling and fracking is just getting started. There is still hundreds of billions of $ worth of wealth left to be created, this thing is just getting started especially when you think of all the places around the world where this technology will get exported. What’s best is that it’s all-American technology perfected by hard working self-made entrepreneurs, or ‘petropreneurs’ as we should really be calling them. How can you not look around at the economic miracle that has been unleashed by these independent companies and improved the lives of so many individuals and local communities and not be proud of what makes the USA such a great place, our uncomperable can-do work ethic.
Disclaimer: I am long shares of Whiting (WLL), Continental (CLR), Apache (APA), and frac sand supplier Hi-Crush (HCLP), plus short a couple of others. Furthermore I may initiate a buy of Rose Rock Midstream (RRMS) in the next 72 hours.
Hard work will only make you tired and age you while knowledge will protect you from “experts.”
“There is still hundreds of billions of $ worth of wealth left to be created”
Probably.
The Fed is doing $55 Billion per month.
BTW isn’t the most exciting Bakken company the one that will get the plug and abandon contracts?
There are always bright spots no matter the industry or the state of the economy.Nobody here is denying that tight oil and gas are making big tracks but we aren’t so sure that the tight oil industry can fill the boots of the old generation of legacy conventional fields that are playing out.
It remains to be seen whether there are more sweet spots such as the Bakken and the Eagle Ford and if so how big they are.
Oil in the ground is not the same thing as money in the bank and the economy may not support the prices needed to extract most of the tight oil known to exist.
You are counting chickens that haven’t hatched yet.
Personally I would like to think that gasoline will stay cheap for another decade or so because I may hope to drive that much longer.
(I’m counting on being safely dead before runaway warming causes too many problems for me personally.;-) )
But my money is on a sharply rising price and short supplies.
If you own stock in a tight oil company that has good ground and deep enough pockets to get well established and prices shoot up fifty bucks a barrel you are going to be in the tall cotton.
But there are going to be a lot of losers and relatively few winners.
Mac,
“(I’m counting on being safely dead before runaway warming causes too many problems for me personally.;-) )”
Problem is, most people agree with this sentiment but without the smiley face attached to their thinking. So I ask: will our grandchildren blame us for the garbage we’ve left them or will they be far too busy dodging bullets to remember we even existed? Because, the way I see it: boomers (majority) don’t see a problem, doomers (minority) don’t see any point in looking for solutions and there are not enough left to make a difference. Which makes me a safely dead doomer — I guess.
Doug
From GOP Deeply Divided Over Climate Change
I felt the same way until I started thinking about the basis for the confidence in the GW science over the last year. Now, I am at best agnostic and leaning towards thinking that the science is not really there.
It is very difficult to have a science based just on observations (think economics, political science, …), You can find associations with observational methods but you really cannot really do science in terms of testing of hypothesis with just observation methods. This means that we have no way to really test the hypothesis of GW.
“This means that we have no way to really test the hypothesis of GW.”
I disagree with you at every possible level. First, virtually every scientist studying GW accepts it as reality; many (most) see irreversible feedback loops already established. Therefore, and with respect, I doubt you are qualified to have creditable doubts.
Second, we do most certainly have ways to “test the hypothesis”. There are hundreds of scientists measuring CO2 levels, methane levels, sea level increases, etc. They are also looking at tree rings, ice cores, lake sediment records, weather records, etc. I could go on and on but it’s not necessary because, in terms of science, there is NO doubt. The real questions being asked are structured as how soon, how bad – not if.
Third, denial greatly exacerbates the problem. You can deny that you daughter is pregnant but doing so only hurts her and your family but when the planet we live on, rely on, is at risk, everything we value is in peril.
Fourth, I know several people working on GW, scientists who are under enormous and constant pressure to underrate risks, tone down reports, honey coat comments; because the “people in charge” want to pretend our fairy tale world will go on forever. It won’t, not the way we’re going.
Maybe you believe in the tooth fairy or think the earth is flat. But, I will take the word of a dentist or an astronomer when looking for answers to those questions. Climate scientists, essentially all of them, are telling me we have a problem, the biggest problem mankind has ever faced.
Doug
Hi Doug,
I have been talking to Old Tech for a long time here and at The Oil Drum and he is a good guy with his heart in the right place.
I know a number of open minded people in his situation and while I agree with you the science is sound it is not necessarily clear to those of us who have had less opportunity to study science in the classroom.
Old Tech may not have had that opportunity.
IF you don’t have some expertise in a given field you are at the mercy of opposing camps and have no real way of knowing who is actually telling the truth except to take one party or the other on the basis of faith.
I can say with absolute confidence that in terms of common sense – common sense being based on however much knowledge a person has of relevant subjects- that most people who doubt man made warming have good reason- from what they do actually know themselves – to doubt man made warming.
If they are predisposed to believe that any given group or coalition of people is willing to manipulate the government to get what it wants – then they are going to be doubters or deniers.
And since virtually everybody is willing these days to use the power of the government to get what he wants- nobody should be surprised.
We are all of us willing to play partisan games and lie our asses off in the course of doing so.
I have been in the same spot myself on some issues and am still in that spot on a couple.
I cannot make up my mind for instance whether the war on drugs is a net benefit or loss to our country.
But I do know that the people who are adamantly in favor have a lot of skin in the game in terms of making a lot of money out of drug prohibition.
I also know what a meth habit can do to a person in a year.
If you are absolutely sure somebody is lying to you on any given topic then that a person has no credibility on other topics.
In my estimation the people in the tea party mostly have their heads so far up their butts that they will never know what sunshine is but very few of us in this forum would deny that they are right about one thing– we are in financial overshoot.
If you know something about finance but nothing about biology and physics and geology you will trust the tea party a lot quicker than a democrat who is telling you your cheap coal fired electricity is ruining the world for his grandchildren.
From the pov of a conservative hard working hillbilly such as some I know of with law degrees- from well known universities- you have caught the democrats and environmentalists in a gigantic lie–and nearly every body is totally cynical these days.
Lawyers you see almost always know something about money and finance but they usually know next to nothing about the sciences.
You can graduate from almost any university these days with just one survey course in a science of any sort -which means that for all practical purposes you are totally ignorant of the sciences.
Almost every body these days believes any body in a different camp is without ethics.It is not hard to see how people have come to see others this way- both parties are rotten to the core in terms of pork and corrupt as hell and have sold out on the grand scale to various special interests.
I’m going to use my winnings from my Petrobank stock investments (which was implicitly recommended in a series of Oil Drum articles), to buy into Bakken Play stocks.
Of course, I used my winnings from a prior investment in Pacific Ethanol (also recommended by an Oil Drum blogger, circa 2006) to buy into Petrobank.
Better research the soaring debt ratio:
http://seekingalpha.com/article/1916001-continental-resources-debt-and-capital-analysis
“Continental Resources’s total debt to total assets ratio has increased over the past three years from 0.27 to 0.38. As the total debt to total assets ratio has increased, this indicates that since 2010, Continental Resources has added more total debt value than total asset.”
http://www.nasdaq.com/symbol/clr/guru-analysis/dreman
If CLR was rolling in dough, they should be paying down debt or at least not continued to add new debt. CLR is probably the next Enron/LehmanBros.
What if EOG (very active in both the Eagle Ford and Bakken) is the next Enron? 😈
A CLR price drop would be VERY timing delicate. If it happens BEFORE the divorce judge computes the value Hamm’s wife gets then XXX shares have to be handed over to her.
If it happens AFTER the monetary computation is decreed, then a LOT more shares would have to be handed over.
A worsening debt/equity ratio will be prominent in the attorney arguments about the actual value of the company she gets half of.
Isn`t it better to be smart working? Yes there is a lot of unconventional oil and gas in the World. However it is not cheap to produce. In my view prices for oil have to double and for gas increase four times until the companies can make money in the long run. So, it is better to wait until this becomes true and investors recover their senses. APA is for instance way down below its 200day moving average. They are hugely exposed to shale and investors seem to agree that it was not a smart move. It just fell yesterday despite strong oil and gas prices
So, it appears that the EIA high case suggests that we hit a an indefinite plateau of about 13 mbpd in US crude + condensate (C+C) production.
Of course, there is that pesky problem of high–and rising–decline rates, as an increasing percentage of total production comes from high decline rate tight/shale plays.
Citi Research puts the underlying decline rate from existing natural gas production at about 24%/year.
If we assume a conservative estimate that existing US crude oil production is declining at about 10%/year, gradually rising to at least 15%/year, in order to maintain 13 mbpd, with a decline rate of 15%/year from existing wells, we would have to put on line 2 mbpd of new production every year just to maintain 13 mbpd. 2 mbpd every year would be equivalent to adding the productive equivalent of the peak production from the North Slope of Alaska–every single year.
Steven Kopits responds to Barron’s ($75 oil) article:
http://blogs.platts.com/2014/04/09/citi-chevron-oil-price/#comment-64499
Well, 3 years will pass and we will know the answer ^_^. On a more serious tone, 2017 is definitely a key year also according to the CDS data:
http://fantazzini.narod.ru/int.html#cds
WTI hit $103 a little while ago. It is back down to $102.94 right now. The WTI – Brent spread is down to $4.98.
If it holds up, we’re about 72 hrs from another SPR threat leak.
What’s the story behind the SPR at present? If you read my comment just below, there’s a lot of stuff that doesn’t make sense to me at present. Its the sort of thing that can happen when there’s a really ugly secret dying to escape.
I spent a moment looking into it.
It’s not all desirable oil.
695 million barrels. Split between light sweet and heavy sour. No official storage of gasoline, kerosene or other fractions, though in New England there is some heating oil storage. Avg price paid per barrel of what’s in storage about $21. Been there a long time. They do keep the oil types seperated. No mixing sour and sweet.
They have a website of their very own:
http://www.spr.doe.gov/
This is from Euan Mears blog and most of it makes great sense.
But the last part once the author starts talking about the effect of possible sanctions on Russia and a consequent fall in the price of oil makes about as much sense as a pig saddle to me.
I would like to hear the opinions of some of the regulars here about this.Maybe I am missing something obvious.
http://euanmearns.com/from-financial-subprime-to-global-energy-subprime/
Mac, the author Andrew McKillop, I believe, comes from the school of abundance. This is his third guest post I’ve hosted and with each of them I’ve agreed with most of what he says but always disagreed with parts. I think his notion on oil prices is based on the bizarre outcome that Europe somehow stops demanding oil. Hence, reduced demand results in a fall in oil price.
You wouldn’t believe how bizarre our circumstances are here over Russia. I’m afraid that Obama’s sabre rattling and drawing red lines that must not be crossed doesn’t help. As you well know, the US energy cavalry is not about to come galloping over the pond to our rescue. And rescued from what? I don’t think Russia poses any threat at all to our security. The only threat lies with our imbecile politicians. Especially those unelected bureaucrats from the European Empire.
US crude oil production for the week ending on April 4 rose to 8,229 thousand barrels per day from 8,192 thousand barrels per day. Compared to 52 weeks ago, the US crude oil production rose by 1,048 thousand barrels per day.
Based on my record, the US crude oil production levels for previous weeks were not revised.
Dood, this is modeled data. Look at that chart. That doesn’t look ridiculously linear to you?
The 52-week growth of US weekly crude oil production (the average oil production over the last 52 weeks less the average oil production over the previous 52 weeks) declined from 1,187 thousand barrels per day for the previous week to 1,185 thousand barrels per day for the week ending on April 4. The declining rate slowed compared to several previous weeks.
From the end of 2013, the US weekly oil production growth has declined at the average rate of 4 thousand barrels per day per week. At this rate, the US oil production is likely to peak in 2019/2020, with a peak production level of 10.6 million barrels per day.
P.E. this 8,229 kb/d along with last weeks 8,192 kb/d is also a prediction. The EIA really has no idea what U.S. oil production was last week, so they guess. They are guessing at what the numbers will actually be when the data finally comes in.
For the last three months those guesses have been way too high. Though the weekly data seems to never get revised the monthly data does. And for December and January the weekly data has been between 0ne hundred fifty to two hundred fifty thousand barrels per day too high.
For instance the average weekly production data for December came out to be 8,091 kb/d, but the monthly data came in at 7,871 kb/d. The weekly data was 220 kb/d too high. For January the weekly average was 150 kb/d too high. And of course even this data is still subject to revision.
See the corrected data here: Crude Oil Production in Thousand barrels per day.
Even these montly figures are not accurate, because the EIA doesn’t know how much Texas is producing. I don’t believe that Texas is really up 600kbpd year over year, with North Dakota 1/3 of that.
Oddly, Alaska gets an uptick in winter last few years. Weird.
Actually not weird. Maintenance is only efficient in summers and flow rates are kept as high as possible in winter months. Its bad enough when the pipeline (TAP) is operating only at 25% capacity, running it at 20%, or less, in winter would (will) be a nightmare: But perhaps normal in the near future.
Doug
Ron, I am aware of the limitation of the weekly data. That has been said, the weekly data provide the first estimate (or guesstimate) from EIA.
If one trusts the EIA’s latest short-term energy outlook, the gap between the monthly data and the weekly data may have been narrowed. For February, EIA’s short-term energy outlook reports the production to be 8060 thousand barrels per day, compared to 8104 thousand barrels calculated from the weekly data (a gap of 44 thousand). For March, the short-term energy outlook reports the production to be 8160 thousand barrels per day, compared to 8195 thousand barrels calculated from the weekly data (a gap of 35 thousand).
It is possible that the monthly production will be revised down when the monthly production data are officially published. We’ll see.
Lots of oil remains on the North Slope
It’s very unlikely we’ll find any more super-giant deposits like the Prudhoe Bay and Kuparuk River fields. We can find a lot of smaller fields, though.
These will be expensive, and less profitable than big fields, and that’s where the economics come in.
Geologically-speaking, the oil source rocks underlying the North Slope are some of the most prolific in the world. That means there’s a lot of oil and gas around….
I believe we might soon bend the curve on [Alaska’s] production decline. Instead of production dropping 6 percent, the long-term trend, we might see a 1 percent decline this year and, if we’re lucky, no decline next year.
“I believe we might soon bend the curve on [Alaska’s] production decline.”
Wasn’t there a vote or going to be a vote soon to raise the state tax rates on Alaskan Oil and Gas Production? I vaguely recall something about a proposed tax change that would make unprofitable to develop new projects in Alaska. I recall that Shell Pulled the plug on its big Alaska project earlier this year. Unless Oil companies invest in new projects in Alaska I don’t see a change in production declines.
TechGuy,
No. The vote was to basically eliminate taxes on oil production in order to encourage more exploration development. It passed and Alaska is now loosing about two billion per year in revenue: no significant new work on the horizon. Alaska has a rainy day fund of roughly 16 billion dollars and are talking about using some of this to develop and produce NG: pipelines, etc. Who knows what will come of this, merely politicians talking so far.
Doug
Buying jobs.
Never ever forget, when the Bakken (or Alaska) are clearly in drastic output decline, but are drilling like hell to lessen that decline rate, it will be called an “oil boom”.
Boomage is measured in hours worked, not barrels out.
Since production from the Prudhoe Bay oil field began in 1977, the 1,114 wells punching into the Sadlerochit Fm. have produced 11 billion barrels of oil out of an estimated total recoverable reserve of 13 billion barrels. Production from Kuparuk River field peaked at 327,000 BPD and is currently producing about 50,000 BPD. And, every conceivable enhanced recovery method has already been applied to these fields; the various satellite fields are minuscule by comparison. In fact, Kaparuk is (was) big but certainly not a super-giant. The North Slope is tapped out, Period.
Doug
For the record, the Trans Alaska Pipeline (TAP) was grossly overbuilt, in a bad way. It currently transports about 500,000 BPD and everyone keeps harping on the “fact” that it won’t be viable at less than 350,000 BPD: maybe, maybe not. Personally, given decreasing production capacity from Prudhoe Bay, etc., I doubt the TAP will operate for six more years. The trouble is there are many variables to the equation that are rarely, if ever, discussed in public. These range from well head water cuts to California oil markets and a ton of very tricky stuff in between. But, as everyone here knows depletion goes on and on and on: Like the devil, It NEVER rests.
Doug
Does water flow with the oil in that pipe? Do they separate at input or output? Any NGLs in that flow?
Watcher,
No, Output, Yes.
Cheers,
Doug
Shale Revolution Reverses Global Energy Flow
The shale revolution has also shifted the marginal source of supply from the Middle East, Africa and Latin America, where investment and production are tightly controlled by governments, to Texas, Oklahoma, North Dakota and other states, where production is driven by the private sector.
Not since the mid-1980s, when new oil fields came onstream in the North Sea, Alaska and the Soviet Union, have world oil supplies been so diversified.
With diversification comes greater security. Global oil markets have weathered the loss of millions of barrels per day from Libya, Syria, South Sudan and Iran over the last three years with almost no impact on prices or the availability of crude.
Is this the issue that will have the biggest near term influence on price? The drop in US imports allowed by the quick ramp up of domestic supply through Shale [plus a not insignificant drop in demand] has enabled China to grow imports without the price going through the roof. Is China now reaching towards a slowdown in demand growth? Perhaps even to its own demand plateau? Could this provide sufficient relief to keep oil stuck on the ~USD100 shelf for even longer? Will the re-price be kicked down the road and not arrive late 14- 2015 as some expect?
http://uk.reuters.com/article/2014/04/10/china-crude-imports-idUKL3N0N120P20140410
Hi Patrick,
Possible interest? GREENER ENERGY BLOSSOMS IN CHINA
http://www.atimes.com/atimes/China_Business/CBIZ-01-040414.html
“The energy landscape continues to give the clearest indication of the trends in industrial dynamics and prospects for the future. China is powering ahead with renewables while at the same time it expands its reliance on fossil fuels; the US by contrast is further locking in its dependence on fossil fuels. The distinction is critical.”
Doug
However China imported 2 % crude oil more year over year. During the January February period it imported 10% more y/y. So the trend for Chinese oil imports is still up for years to come.
Natural Gas in storage now at 1/2 level one year ago 826 bcf vs. 1,675 bcf. I wish the historical band went back ten years instead of just five. The storage curve is just now starting to go up (by a measly 4 bcf last week), but the previous average started it’s upward movement several weeks earlier.
What will storage be in November? Even EIA is predicting it won’t hit last year’s level (shown here. Last year maxed out at 3.8 bcf, they are predicting 3.4 for fall 2014 and 3.6 for fall 2015. That’s an 11% drop for fall 2014 vs fall 2013. Does anyone not think that is huge?
Wait. Seriously? You’re pimping your blog **here**???
Watcher, thanks for the heads up. I get these spam comments occasionally. I try to delete them as quick as they appear. This one just slipped through. But it is gone now.
EIA graphs are beautiful. The graphs do not match the total oil reserves, which are around 36 billion barrel oil. New technology can do this miracle. USA resources are huge; the technology is not available to support the EIA forecasts. Theoretical potential by assuming new drillings, and the rates proved from many new wells drilled on the past, gives us what we want. Checking the data we generate, based on cumulative existing reserves, which have some risk, do not match. Here is the problem and need a solution. The solution is that the oil operators discover the new technology, today or tomorrow, or find the person who has the technology. Second step is apply the technology and further develop it to make the dreams come true. Wish EIA will do this.