I am starting this post off with a news article because it explains why JODI has U.S. production numbers wrong for July.
No, U.S. Oil Production Probably Didn’t Rise in July
The Joint Organizations Data Initiative (JODI) releases monthly oil supply-and-demand data for about 80 countries, which it gathers by directly surveying the countries. It is widely cited by analysts, especially for its figures on demand, imports and exports.
The latest JODI data released Sunday showed that U.S. crude-oil production rose from 9.3 million barrels a day in June to 9.5 million barrels in July.
But the EIA’s latest forecast called for July production to fall to 9.2 million barrels a day in July, continuing the trend of declining U.S. production as companies cut spending in the face of low prices.
For the charts below I have used JODI data for all Non-OPEC nations except those that do not report to JODI. For them I use the EIA data and carry forward the same data that the EIA reported, (April). For the USA, since the JODI data is obviously wrong for July, I simply carried forward the June data which also came directly from the EIA. And for OPEC I use the OPEC MOMR’s “secondary sources”. JODI also uses the MOMR for their data but uses the “direct communication” data instead of the secondary sources data.
The data below is through July 2015 and is in thousand barrels per day.
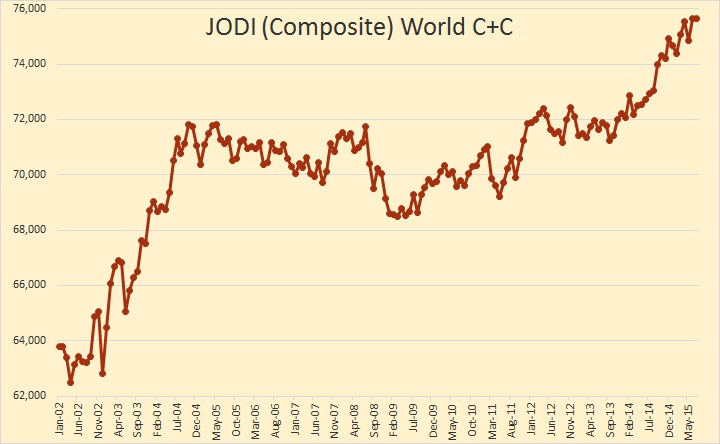
In July we remained at or near the world’s all time peak at 75,631,000 barrels per day, down just 15,000 bpd from June.
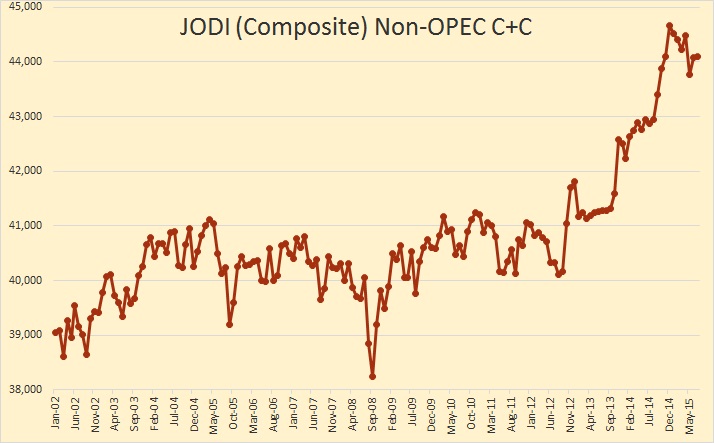
JODI Non-OPEC stood at 44,100,000 bpd in July, down 567,000 bpd from the peak in December.

JODI Non-OPEC less USA stood at 34,804,000 bpd in July, down 900,000 bpd from the most recent high in December 2010.
The below table, Giant Oil Fields of the World Data as of 2013 is from Art Berman. It was complied by Mike Horn and Associates and is on the AAPG records. The Excel file that I received was far more extensive than the below. It contained the 738 largest oil fields and 1048 total oil and gas fields. I have shortened it to only fields above 5 billion barrels of oil, ultimate recovery estimate.
Five fields above 5 billion barrels ultimate recovery are not included. Three, Vostochno-Prinovozemelsky, Kaigan-Vasyugan and Kurmangazy (Russia and Caspian) because there was no data and Manifa and Khurais (Saudi Arabia) because due to decades mothballed off line, I found their data to be inaccurate. Mike Horn and Associates apparently calculated production from the date they first came on line and made no allowance for their decades off line. They had Manifa and Khurais far more depleted than I thought to be the case. But that still left 56 giant fields above 5 billion barrels ultimate recovery.
Horn and Associates calculated the decline, from first production, using three decline rates, 6.7 percent per year, 3.4 percent per year and 1.4 percent per year. Then they calculated the decline rate using an average of those three decline rates. The average of the three is the one used here when I calculated the remaining reserves from the original ultimate recovery estimate. The average of those three works out to be 3.83% decline per year. I think that number is very conservative.
Unfortunately Horn and Associates did not calculate remaining MMBO, only MMBOE. For the 733 total oil fields with ultimate recoverable one billion barrels or more, the total ultimate recoverable oil came to 1,435,993 MMBO. That is 1.436 trillion barrels of oil in giant fields only. But the MMBOE in those 733 fields came to 4,674,021 MMBOE. That’s 4.674 trillion barrels of oil equivalent.
Of that original 4,674,021 MMBOE 1,479,623 MMBOE or 31.66% of the original ultimate recoverable oil, gas and condensate remain.
There were 310 other fields in this study but they were gas only fields and none of those were included in any of the calculations above.
__________________________________________________________
I send out an email notice whenever I have a new post. If you would like to be included in that notice then please post me at DarwinianOne at Gmail.com.
211 responses to “JODI Data and Giant Field Depletion”
A similar study from 1978 http://www.rand.org/content/dam/rand/pubs/reports/2006/R2284.pdf
Three decades ago ~50% of expected recoverable crude source was supergiants.
And now? MMBOE trickery only to rope investors?
More from Richard Nehring – 2007. http://www.resilience.org/stories/2007-10-08/interview-richard-nehring
Over the past fifteen years I have read over twenty books on peak oil (Campbell, Deffeyes, Simmons, Heinberg, Kunstler, Greer, etc) and read at least one peak oil site every day (oil drum, resilience, this one, etc). The consensus seems to have been that depletion would run at least 2% a year, and this report suggests more. Well, it has now been ten years since the plateau around 2005, implying that the world should have been down by 15-20 million barrels a day by now. My question is this, even allowing for the additional 6 million added by the US, Canada, and Iraq in the last few years, why is the world not down 10-14 million barrels a day by now?
Take away the hype and fanfare, and the simplest explanation is what is most likely to be true – there is no oil shortage. Why is the consensus so often wrong? The consensus, but its nature, is not likely to challenge the established thought patterns. Moreover, are books more likely to be sold based on a shortage or a surplus? Does good news sell better or bad news?
Let me see if I follow your reasoning:
1. The simplest explanation is likely true.
2. Consensus is often wrong.
3. Book sales are inversely correlated with reality.
And this is how you’ve evaluated the validity of peak oil?
Robert, I do not challenge the validity of peak oil at all (and by peak oil, I am assuming you mean peak oil production). Debating when peak oil will occur interests me less than the reason peak oil occurred – was it (or will it) be because the finite supply of remaining oil could not be extracted fast enough or efficiently enough to satisfy growing demand – or that demand for oil simply declined to the extent that there was no more need for expensive oil – there were other energy sources that were more abundant. I should say that I am not a peak oil expert like the others on this site, so my opinions should be taken with a grain of salt.
… or that demand for oil simply declined to the extent that there was no more need for expensive oil – there were other energy sources that were more abundant.
That is a possibility, provided peak oil does not happen for another half a century or more. Because that is about the rate other energy sources are replacing oil.
Peak oil will happen when rising prices can no longer bring enough new oil on line to replace declining production. It is that simple. Nothing complicated about it.
Also, prices will rise only after oil peaks, not before or even during the peak.
Peak oil will happen when rising prices can no longer bring enough new oil on line to replace declining production. It is that simple.
That’s actually very helpful, and having followed this conversation for more than a decade, I never really thought about it that way.
Thanks.
Hi Ron,
If there is a plateau in output, where would the peak be? It seems to me it would be called the middle of the plateau. If such a plateau occurs prices will rise unless there is a decrease in demand for some other reason (a recession perhaps), also the peak will not really be apparent for a few years, there have been many false peaks in the past, we will need to see a 2% decline before the peak might be called (though this would not have worked for the 1980 peak where output declined by 12% from 1980 to 1983.) Oil prices are unpredictable, the could rise before peak, during peak or after peak, it will depend on both supply and demand.
If there is a plateau in output, where would the peak be?
That would require a perfectly flat plateau. Not a chance of that happening. Therefore the peak would be the highest point in the plateau.
There is a possibility that the peak will not be known for years afterward. On the other hand if there is a sharp peak and a swift decline then we can know only a year or so afterward. It all depends on circumstances and the state of the economy.
we will need to see a 2% decline before the peak might be called…
Really Dennis, neither you nor I have any idea what the decline might be after the peak. I am obviously expecting a much steeper decline than you are. Only time will tell us which one of us is closer to the truth.
The decline in the early 80s, of which you speak, was caused by the Iran-Iraqi war and the resulting “Tanker Wars” in the Persian Gulf. Only a damn fool would have thought the decline was because of peak oil. So please don’t bring that old saw up as an example of a decline that could have fooled anyone. I lived through that decline and very well remember the cause. We all knew what the cause was. In fact I was in Saudi at the time. It is very clear to me. I was in Ras Tanura at the time and very well remember Saudi making deliberate deep cuts. And I also remember the massive oil pollution of the Persian Gulf.
Hi Ron,
I am not talking about 2% per year,just that output falls 2% from the peak. It can be 1 month or 10 years, you are correct that we do not know what it will be. I did not claim that we were not aware why output fell in 1980-82. There may have been those that thought output would never recover to 1979 levels, in fact it took until 1996 before the annual C+C output was higher than 1979 annual output (that is 17 years). Were you sure over that period that output would surpass the previous peak? If there is a steep decline as you foresee, that would be best as there will be a crisis that will precipitate the changes necessary for transition, hopefully you will be correct. I think my scenarios are far more likely and although an undulating plateau may occur (as has happened several times in the past) many will think that is a pause before the next increase in output. If C+C output falls by 2 or 4% from the peak with high oil prices, reality may finally sink in for the average person.
I didn’t start to follow this closely until Matt Simmon’s published Twilight in the Desert in 2005, so I did not really think about peak oil very much before that.
There may have been those that thought output would never recover to 1979 levels, in fact it took until 1996 before the annual C+C output was higher than 1979 annual output (that is 17 years). Were you sure over that period that output would surpass the previous peak?
No Dennis, it was not all that dramatic. Production started to rise in 1984, leveled out in 1985 then took off again, leveled out for two years in 91 then continued upward from that point. We all knew during that time that peak oil was not in sight. It was not a subject at all in those days. That is late 80s and early 90s.
Dennis, for god’s sake, we knew what caused the crash in the early 80s. I remember it very well because I was right in the middle of it. Peak oil was not even on the horizon then. We all knew what caused the oil crises of the 70s and early 80s. It was OPEC! There was never any doubt about that and there was never any doubt that we would recover from that.
Hi Ron,
Here is the World C+C chart from 1965 to 2014 (EIA annual C+C data).
”Also, prices will rise only after oil peaks, not before or even during the peak.”
”Peak oil will happen when rising prices can no longer bring enough new oil on line to replace declining production. It is that simple. Nothing complicated about it.”
I am strongly inclined to agree with you.
But as far as the RATE at which other sources of energy replace oil is concerned- just about all the ones that MIGHT serve can at least potentially grow at exponential rates.
If lithium does indeed turn out to be too expensive to be used by the hundred pound in car batteries on the grand scale, there is still the possibility that fuel cells will scale up and there is little question that hydrogen will be affordable – at least for truly ESSENTIAL transportation.
I am hoping some chemical engineer who might be knowledgeable about the electrolysis of water, or any other industrial process that yields purified hydrogen will chime in and tell us if hydrogen production can be efficiently tailored to the use of intermittent energy.
If the infrastructure for producing it from water is not outrageously expensive, then we can get plenty of hydrogen from wind and solar power. A hydrogen pipeline from the deserts of New Mexico and Arizona to the Northeast would cost an arm and a leg- but the sun shines very dependably in the southwest and solar farms there could be built to the extent that hardly any natural gas at all would be needed during daylight hours to fire power plants. Any excess at off peak hours could be fed to the hydrogen plants.
Ditto wind in other parts of the country.
Sometimes things get built without much if any immediate consideration being given to making a profit by anybody except the contractor doing the actual building.
Armies, navies, air forces and interstate highway systems come to mind.
I have not found any recent figures put out by an apparently reputable researcher, but I suppose it is reasonable to expect that the cost of building HVDC power lines- very high capacity long distance transmission lines- will fall by five percent or more per year, at the end points, which is where the super expensive equipment is needed – one installation at each end.
The actual construction of power lines is a mature industry and the cost per mile of such lines will probably just go up with the cost of materials , men and machinery.
In the event of an emergency being declared, there will be PLENTY of machinery and men.The machinery can be diverted from building new highways and shopping malls. Aluminum might be in short supply. Steel will not be- not if an oil shortage has forced the scrapping of tens of millions of older gas hog cars and trucks.
In the event of the prez declaring a national emergency, which could easily come to pass, environmental reviews and right of way issues could be dispensed with very quickly indeed, thus expediting the construction of renewable infrastructure wherever it can be built to best advantage.
I can easily envision the production of pure electric and plug in hybrid cars increasing by a hundred percent a year for four or five years – assuming the battery manufacturers can keep up.
After that the rate of growth would probably slow substantially but plug in hybrid production could probably be increased by ten to twenty percent a year for a long time- as long as the supply of lithium holds out.
Driving a plug in hybrid with two seats fore and aft and a ten kWh battery and a muscular lawn mower engine would be infinitely preferable to giving up the mcmansion for a non existent decent apartment downtown.
There is no real reason such a car couldn’t be built out of well painted high strength steel, ( which is already in common use in cheap cars), fiberglass , aluminum’ and maybe a little carbon fiber etc. A car built along these lines could easily be made to last a lifetime with a few repairs..
Tradesmen and engineers know that most machinery including heavy trucks is built to be very easily repaired – with all the major components having standardized dimensions and fasteners etc. You don’t buy a new electric motor or chain or bearing or hydraulic pump or cylinder from the OEM- unless you want to. You just give your jobber the description and he can provide you will a functionally identical part for a quarter of the money – or twice the money- depending on the brand name on the part.Sometimes I have found it worth paying twice the price myself , for example for tires, shock absorbers, mufflers, and other parts -because twice the price can buy you five times the warranty as well as greater safety reliability fuel economy etc.
I once had a friend who could RandR an old VW beetle engine without any help and very few tools between breakfast and lunch and smoke cigarettes and drink cokes and bullshit right along and finish up with time to spare. Cars CAN be built to last- and they CAN be built to be easily repairable.
As the Snap On guy sez, the sweetness of quality is remembered long after the sting of high initial price has been forgotten.
A MAN SIZED fuel cell could easily be fitted into the space occupied by big diesel engine radiator transmission and diesel fuel tanks on a heavy duty truck.
Hydrogen is very light and it might actually be practical to swap out hydrogen tanks on cars and trucks after the fashion that some people thought batteries could be swapped out in cars.
I have swapped out propane tanks on forklifts by hand, and the process takes hardly any longer than filling up with gasoline, maybe five minutes or so.
You would not have to worry about getting a worn out tank because you would only be keeping it until you swap out again for another full one.
With current technology, either you’re converting to electricity with a catalyst which is very expensive and low power/weight, or the energy efficiency of the process is awful.
Interestingly, this method is close to the cheapest there is for low duty cycle peaking power, i.e. the power plant that you run only during the record or near record cold snaps and heat waves. If you have natural gas available at a reasonable price it loses to that, but not by all that much.
The reason it does so well is that for a low duty cycle, only the fixed cost/kilowatt matters, and the variable cost/kilowatt hour is close to irrelevant.
You really, really don’t want to mess around with swapping out hydrogen tanks. 10,000 psi rating, exotic carbon fiber construction. Ding it in a swap, oh, boy. Boom.
Here’s a Youtube link to the Toyota Mirai fuel tanks and drive system being assembled.
https://www.youtube.com/watch?v=bge5K4lt-ow
And the fuel cells have their own exotic materials requirements – platinum, etc. operate at 700 degrees F.
Makes an EV look like a simple toy by comparison.
But it isn’t the hardware that is the death-knell for renewable hydrogen. It’s the thermodynamics. Only about 35% of the electrical energy generated at the power source (power plant, wind turbine, etc.) can be delivered to the vehicle motor. There isn’t a lot of thermodynamic room for efficiency improvements at the fuel cell or electrolyzer level. The well-to-motor efficiency for EV’s using lithium batteries is about 80-85%. In an energy-constrained world, the huge efficiency difference between fuel cell-hydrogen and EV-battery technologies is just too high a price to pay for the luxury of improved energy density or fast fueling.
We could use a tritium fusion process to generate heat, melt salt, use the salt to make steam, use the steam to generate electricity and use the electricity to drive electric motors. The tritium container for a four passenger vehicle will be the size of a hand grenade.
I am ready bet against fuel cells becoming a practical option in cars myself, anytime SOON, but what do the people at Toyota know that I don’t?
I can answer THAT question easily enough- PLENTY.
Most people get old and get firmly set in their opinions , but I continue to change my own as evidence to the contrary comes in.
The company I worked for had a hydrogen fuel cell vehicle running around, it was 100 % bullshit.
If transport by others. Choices choices – Bags of NPK or used Li Car traction Batteries in the barn? Li Batteries can be stored for long periods at 50% charge which would kill other chemistries. but must be protected against self discharge at all costs. – 20 watt PV panel can do this. Perhaps Indestructible Nickel Iron Edison cells better choice for stationary apps.
“Peak oil will happen when rising prices can no longer bring enough new oil on line to replace declining production. It is that simple. Nothing complicated about it.”
WTF is rising prices? From current 48 usd/b to 50 usd/b? Or from current 48 to 300 usd/b? Do you think that there will be peak oil at 300 usd/b? If oil goes to 300 usd/b there won’t be peak oil for couple of decades. I’m amazed how some people still talk about “rising prices” when it’s obvious that it will be the opposite.
Mistruz, if you don’t know what rising prices are then any dialogue with you would be useless. But I will assume the question was rhetorical.
No, small fluctuations in the price are not rising prices. And no, prices will not reach $300 a barrel. Rising prices was what happened in 2009 after they reached a low of $37 a barrel. Rising prices would be if they did that again. But if they did that would very likely bring more oil back on line. But if those rising prices fail to bring production back to the previous peak then we will have very likely reached peak oil.
I’m amazed how some people still talk about “rising prices” when it’s obvious that it will be the opposite.
It is obvious that prices will continue to fall? Thank goodness that we have such wisdom reading this list when most of us mere mortals are not so sure about it. But you can continue to be amazed because I think prices will rise again in a few months…. give or take.
Hi Mistrzu,
So how low do you think prices will go?
You think it is unlikely that prices will rise above $50/b, long term? You are sadly mistaken. Oil will be above $75/b within 12 months, when the peak arrives in 2020 (or perhaps by 2017) then oil prices will continue to rise, probably to $120/b, at that point we might see an economic crash, it depends how steeply oil output declines, I think we might muddle through until 2030 to 2035 (unless a major war breaks out), then we will see Great Depression 2.
I don’t see why it’s obvious to you that prices should fall. Oil people don’t work for food, dude.
The depletion rate is the rate that we consume remaining recoverable reserves, and remaining recoverable reserves are always depleting, i.e., it’s a one way street. But production can increase, stay flat or decline, and an increase in production correlates to an increase in the depletion rate.
The most compelling example I can cite of the enormous difference between rates of change in production, versus depletion, is the Six Country Case History*. From 1995 to 1999, their combined production increased by 2%, but over the same four year period they had already shipped 54% of their total cumulative volume of post-1995 net exports (CNE).
In regard to rates of change in production, IMO actual global crude oil production probably peaked in 2005, while global natural gas production and associated liquids, condensate and natural gas liquids, have (so far) continued to increase:
http://peakoilbarrel.com/jean-laherreres-bakken-update/comment-page-1/#comment-534101
And a link to a related comment:
http://peakoilbarrel.com/texas-rrc-oil-gas-production-2/comment-page-1/#comment-539428
*Major net exporters that hit or approached zero net exports from 1980 to 2010, excluding China:
http://i1095.photobucket.com/albums/i475/westexas/Slide2_zps55d9efa7.jpg
John, depletion and decline are two entirely different things. Every oil field in the world that is producing oil is also being depleted, every year, by the amount of oil that the field produced that year. That does not mean that oil field is declining by that same amount. Production in any field may be increasing while the field is being depleted by from 2, 3 or more percent per year.
Depletion rate is what happens below ground. It is how fast the oil in a reservoir is being depleted, or pumped out. Decline rate is what happens above ground. It is how fast a field’s production is declining. And that number could be zero or even a positive number. But the depletion rate is always a negative number. Unless oil is being created faster than it is being pumped out, the number cannot possibly be positive.
Back in the early part of this century Saudi Arabia found most of its fields declining by an average of 8 percent per year. But they found a fix, massive infill drilling. The below was written in 2006.
Saudi Arabia’s Strategic Energy Initiative
Scroll down to “Saudi Oil Field Depletion Rates”. That should read “Saudi Oil Field Decline Rates”. Some folks are continually confusing decline rates with depletion rates.
Without “maintain potential” drilling to make up for production, Saudi oil fields would have a natural decline rate of a hypothetical 8%. As Saudi Aramco has an extensive drilling program with a budget running in the billions of dollars, this decline is mitigated to a number close to 2%.
So Saudi Arabia managed to get its decline rate down to almost 2% by massively increasing its depletion rate. And by bringing new fields on line they managed to more than replace the 2% decline they were suffering in their older fields. They brought on Shaybah, Khurais, and Manifa.
So Saudi Arabia has managed to actually increase production while their older fields were declining by greater than 2% per year while their depletion rate is likely upwards of 8% per year or possibly greater. Similar things have also been happening in many other oil producing nations.
Hi Ron,
In Twilight in the Desert on page 378, Matthew Simmons says the Saudi 2P Reserves in early 1979 were 178 Gb and on p 379 that an estimated 33 Gb of undiscovered reserves (in 1979) had been discovered by 2005. So total 2P reserves including reserves eventually discovered were 211 Gb in 1979. Using BP data to subtract oil produced from 1979 to 2014, the depletion rate would be 4.4% in 2014 if there had been no reserve growth.
Using BP data to subtract oil produced from 1979 to 2014, the depletion rate would be 4.4% in 2014 if there had been no reserve growth.
I think you mean the depletion rate would be 4.4% per year from 1979 to 2014. There is just no way you could know exactly what it was in 2014… or in 1979, only that the average depletion rate was 4.4% for those 35 years.
It stands to reason that if you produce the same amount every year, or nearly so, then your depletion rate must increase each year. That is you are producing the same amount of oil every year from an ever depleting resource.
Therefore I would submit that in 1979 the depletion rate was well below 4.4% and in 2014 it was well above 4.4%. Because if the average was 4.4% over the 35 year period then it could not possibly be otherwise.
Hi Ron,
I have assumed there were 211 Gb of reserves in 1979 and no reserve growth. Each year production is subtracted from reserves (note by using BP data I overestimated the reduction because NGL is included in the production numbers. Using BP’s Stats in 2014 Saudi output was 4.2 Gb and 2P reserves (subtracting 1970 to 2013 cumulative output of 111.5 Gb) of 95 Gb. The depletion rate in 2014 is 4.2/95=4.4%. The average depletion rate from 1979 to 2014 was about 2.2%.
Well hell, I would say that a 4.4% depletion rate is really pretty alarming. That takes you down over 50% in just 16 years.
Goddamn, that is absolutely scary! That ain’t nearly enough time to get those so-called “renewables” up to spped.
Hi Ron,
As you said decline rate and depletion rate are not the same thing. Saudi Arabia is only one country and the reserves I used ignore reserve growth. Note that Saudi Arabia claims to have 267 Gb of reserves, this might be 3P reserves and 2P reserves would be about 190 Gb. That would mean depletion in 2014 was about 1.9% (using EIA C+C output data for 2014).
My main point was that your 8% depletion rate estimate was not correct, it is 4.4% at most, and more likely to be about 1.9%.
Edit:
I just re-did the calculation using EIA C+C output data for KSA and the depletion rate in 2014 with no reserve growth would be 3.3%. If we assume output remains at 2014 levels until 2030 (not very likely, it will fall) depletion would be 7% in 2030 and reserves would fall from 107 Gb to 51 Gb, assuming no discoveries or reserve growth.
The “no reserve growth” assumption does not match what has happened in the US or the UK.
Well perhaps. But Saudi Arabia themselves were the ones who said their decline rate was 8 percent. And they were the ones who said that infill drilling had gotten that decline rate down to just over 2%.
Soooo…. what can we infer from that?
I think you should forget about reserve growth. Reserves don’t grow. Previous reserve estimates that may or may not have been too low may be updated. But you should call it “more accurate reserve estimates”, not reserve growth. Again, reserves don’t grow. And I do hope, I mean I really do hope, that you know that.
Hi Ron,
Yes I do. Most people know that “reserve growth” is a revision of reserve estimates, and I certainly would not insult your intelligence by assuming you did not know that. Some people are more polite than others.
You had said earlier that the depletion rate was 8%. Perhaps you misstyped.
You said (bold added by me):
So Saudi Arabia has managed to actually increase production while their older fields were declining by greater than 2% per year while their depletion rate is likely upwards of 8% per year or possibly greater. Similar things have also been happening in many other oil producing nations.
I meant depletion rate. If their decline rate was 8% and they started pumping much faster to get their decline rate down to 2% then they had to dramatically increase their depletion rate. Perhaps it was not that high but 4.4% is still an alarming rate.
My point about “reserve growth” is that is a very erroneous term. There is no such thing as reserve growth and people should just stop using the term because it gives the impression that they really believe it. I would never use a term that I knew was an impossibility. Of course I was being sarcastic when I suggested that I hope you knew better. Of course I know you know that reserves do not grow.
But then that begs a very serious question… why do you still use the term?
Hi Ron,
Every term that refers to a physical measurement is always an estimate so when someone says “reserve” it is always an estimate, nobody has ever or will ever know exactly what the level of reserves are.
As to “growth”, this is commonly understood as something getting bigger.
That is exactly what has happened to reserve estimates.
For example, in the US from the end of 1979 until the end of 2009 there was an increase in the estimates of US reserves (aka “reserve growth.)
Proved plus probable (2P)reserves were about 51 Gb at the end of 1979 (proved reserves times 1.7). From 1980 to 2009 there were 18 Gb of cumulative discoveries and 70 Gb of cumulative output.
So reserves in 2009 should be 51+18-70=-1 Gb if there was no increase in reserve estimates over the 1980 to 2009 period (no reserve growth). The proved plus probable reserves at the end of 2009 (assuming 2P reserves=1.7 times 1P reserves) were 35 Gb, an increase of 36 Gb. Reserves may not “grow”, but there was an increase in the estimate over the 1980 to 2009 period. Most people use the shorthand “reserve growth” to refer to these increases in reserve estimates.
Note that the “reserve growth” could be eliminated if we assume 2P reserves are 3.45 times 1P reserves.
Oh! Reserve estimate growth. Well why don’t they call it that instead of reserve growth? It is the estimate that grows, not the reserves.
Oh well, the misuse of the English language is rampant.
Hi Ron,
Just as you do not refer to C+C output estimates, I leave the word estimate off as many people know that every measurement is an estimate with some degree of uncertainty.
My “misuse” of the language is no different from yours.
JohnH Wrote:
“The consensus seems to have been that depletion would run at least 2% a year, and this report suggests more. Well, it has now been ten years since the plateau around 2005, implying that the world should have been down by 15-20 million barrels a day by now. My question is this, even allowing for the additional 6 million added by the US, Canada, and Iraq in the last few years, why is the world not down 10-14 million barrels a day by now?”
Simple: Horizontal drilling and other advanced recovery has delayed production declines. Fields are depleting faster then 2% per year, but the newer tech has permitted extraction to remain stable or increase. Although they did it with a heck of lot of drilling and infrastructure investment. Big Oil spent more $4T since 2005 to keep conventional oil production flat. Another words, depletion and extraction are running at two different rates, for now. At some point, the curves will cross.
When horizontal drilling runs to a conclusion, and we will see much, much higher depletion rates. Instead of a natural bell curve decline, will might just see something like a cliff (Depends on how far they can press it). It probably would have been better if newer tech was not not used to artificiality prop up extraction rates since the shallower long term decline curve would have bought more time. Since total production increased, it permitting BAU to continue rather then permitting the global economy to adjust over a longer period. In my opinion, the world set it’s house on fire to stay comfortable for a wee bit longer.
Of course, its economic growth that keeps the debt bubble at bay. Perhaps if oil production followed depletion rates, the debt bubble may have popped earlier and created a global depression instead of deferring it.
1. The biggest issue with peak oil predictions is the lack of clear data as to the remaining reserves.
2. The shale oil desperation and hype was not taken into account by peak oil predictions. The fact that we are even going there is proof in itself that we are moving into last ditch territory.
3. Enhanced recovery methods have enabled for example Saudi Arabia to continue pumping. However when the peak finally happens there, the decline will be sharp.
In the big scheme of things it is not that important to predict the date by the day. We know peak oil will happen. We know we have created a civilization that is utterly dependent on oil. We therefore know that fundamental changes will come our way when oil production finally does decline.
We have Jeffs ELM. Rocksmans POD. LTO .. Now SOD… Shale Oil Desperados
Depletion rate is MANAGED, it doesn’t just happen. In many cases it’s managed to allow production to decline. The USA has been somewhat of an exception, because prior to the 1970’s the field rates were restricted using allowables. Most USA states also imposed well spacing rules. These weren’t fully optimized, which led to infill drilling (mostly to optimize water flood performance).
OPEC nations also manage production. This was quite evident in field performance, but today they seem to be straining to sustain production and the cash flow they require.
In other cases we see production impacted by facilities limits, for example North Sea fields are usually designed to plateau for a few years. This causes an odd looking “decline curve”.
But if you study the subject in detail you will see that oil fields do decline. So how gave we been able to sustain and increase production? We simply slowed down activity, which allowed prices to increase, and the higher prices allowed development of previously non commercial fields. If you look at the production curves for Norway, United Kingdom, Indonesia, etc, you will see that in spite of higher prices, they could not keep up.
So the question really should be: what’s left out there we can tap to produce enough to offset the production decline we KNOW is taking place? Not that much. I happen to have been in the oil business for 40 years, but I can’t disclose details. What I can do is point out that Shell has spent billions of $ to set up and drill the Burger prospect in the Chukchi Sea offshore Alaska. This sends a clear signal that very intelligent and well trained managers and technical professionals feel the prospect is worth the risk, even though it will require $80 plus per barrel prices to be commercial (and $100 plus per barrel to have justified the exploration expense). Thus one of the few remaining giant fields we visualize requires very high prices to fly.
So what else is out there? Heavy oil? Most of it requires $100 per barrel. Deep water? Deep water won’t increase beyond this year’s rate unless oil prices increase beyond $100. Shales? Most of them require $80 per dollar or more.
And what happens after we get the better shales, the better heavy oil, and the little bit of deep water oil that’s out there? We will need higher prices.
But higher prices imply more inputs. More steel, more cement, more chemicals, and more people. And as the amount of stuff we demand increases we see our prices go up. Which gets us on a spiral. To make matters more complicated we have to account for response time. Let’s say Shell gets through the regulatory hurdles….getting to first oil will probably take 7 to 10 years after they delineate the field. A large heavy oil field will take 7 years if it requires an upgrader. The only “quick response” we have is the USA light tight oils, with a much smaller potential available in Argentina’s Vaca Muerta, and possibly in Western Siberia.
Those who think we can keep this endlessly and brag about technology or getting smarter are peddling. The truth is all that fancy technology and smarts costs a lot of money. Simple physical properties of rocks full of tiny holes located thousands of feet below the surface, and fluid properties limit what we can do.
good post, thank you.
I am well aware of the major additions to all liquids production since 2005. Some sources even quote numbers in the 95 million barrels per day range. Most reports of conventional production, however, only show the US, Canada, and Iraq, plus a little bump by Saudi Arabia and Russia, as increasing over that period. For the conventional total to go from 72 to 76 million barrels per day implies virtually no decline in 10 years for the rest of the world. This is not what most authors were expecting, and I have seen little in the way of explanation as to who or how this was accomplished.
I’m not differentiating conventional versus non-conventional.
I’m attempting to differentiate actual crude oil production (generally defined as 45 API gravity and lower crude oil, from all sources), versus liquids associated with natural gas production–condensate and NGL.
As noted above, in my opinion despite trillions of dollars in upstream capex, it’s very likely that actual global crude oil production has been approximately flat to down since 2005, while global gas production and associated liquids have so far continued to increase. To answer your question directly, actual crude oil production probably peaked, while global gas production has clearly not peaked.
Hi JohnH,
One area of difficulty is that there are different definitions of “conventional oil”. For some authors the division is based simply on API gravity. For example Jean Laherrere divides crude plus condensate (C+C) production into two parts C+C less extra heavy oil (XH) and XH where XH has an API gravity of 10 degrees or less. Colin Campbell has a much more restrictive definition of “conventional” oil.
Jeffrey Brown would like to exclude condensate and consider crude only, but we don’t have very good data for that except for OPEC and Texas.
High oil prices have resulted in investment in enhanced oil recovery and new onshore and offshore developments which have added to output. The oil industry has been more resilient than many peak oilers thought possible in 2005 or 2008. Also high oil prices were tolerated better by the World economy than many expected, but demand did grow more slowly due to high oil prices. The peak in oil output(C+C) will arrive, but maybe not until 2018 to 2020, if NGL is included, the peak in C+C+NGL may be in 2024.
For what it’s worth, we also have the EIA’s estimates of US C+C by gravity, from 2011 to 2014:
Hi Jeff,
Yes but we do not have a good estimate for the World. Better to focus on C+C because we have fairly good data.
I’m reminded of the old joke about the drunk looking for his keys late at night under a streetlight. He lost his keys down the street, but the light was better under the streetlight.
Hi Jeffrey,
Well you can make your estimate of crude oil output for the World, and some may believe it. Ron’s focus on C+C makes more sense to me, much easier to get people to take it seriously when there is relatively good data to back up what you are saying.
So, if a patient is critically ill, should the doctor focus on what can be easily measured, or should the doctor focus on what is actually wrong with the patient, even if the diagnostic data are less than ideal?
In any case, I think that we can all agree that a probable “Undulating plateau” in actual crude oil production, despite trillions of dollars in upstream capex since 2005, does not fit your worldview.
The available data:
Following are links to charts showing normalized production values for OPEC 12 countries and global data. The gas, natural gas liquids (NGL) and crude + condensate (C+C) values are for 2002 to 2014 (except for gas, which is through 2013, EIA data in all cases). Both data charts show similar increases for gas, NGL and C+C from 2002 to 2005, with inflection points in both cases for C+C in 2005. My premise is that condensate production, in both cases, accounts for virtually all of the post-2005 increase in C+C production.
Global Gas, NGL and C+C:
http://i1095.photobucket.com/albums/i475/westexas/Global%20Gas%20NGL%20C%20amp%20C_zpskb5bxu6d.jpg
OPEC 12 Gas, NGL and C+C:
http://i1095.photobucket.com/albums/i475/westexas/OPEC%20Gas%20NGL%20C%20amp%20C_zpsox3lqdkj.jpg
Currently, we only have crude oil only data for the OPEC 12 countries and for Texas, although the EIA has some 2011 to 2014 estimates for actual US crude production (note that what the EIA calls “Crude oil” is actually C+C).
Also following is a link to OPEC 12 implied condensate (EIA C+C less OPEC crude) and OPEC crude only from 2005 to 2014 (OPEC data prior to 2005 was for a different set of exporters than post-2005). Obviously, data quality is an issue, and the boundary between actual crude and condensate is sometimes fuzzy. In any case, we have to deal with the data that we have.
OPEC 12 Crude and Implied Condensate:
http://i1095.photobucket.com/albums/i475/westexas/OPEC%20Crude%20and%20Condensate_zps12rfrqos.jpg
As of 2014, OPEC and the US accounted for 53% of global C+C production (41 MMBPD out of 78 MMBPD). Implied OPEC condensate production increased by 1.2 MMBPD from 2005 to 2014 (1.2 to 2.4). The EIA estimates that US condensate production increased by about 1.0 MMBPD from 2011 to 2014. I’m estimating that US condensate production may have increased by around 1.2 MMBPD or so from 2005 to 2014. Based on the foregoing, increased condensate production by OPEC and the US may have accounted for about 60% (about 2.4 MMBPD) of the 4 MMBPD increase in global C+C production from 2005 to 2014.
Combining the US and OPEC estimates, the US + OPEC ratio of condensate to C+C production may have increased from about 4.6% in 2005 to about 10% in 2014. If this rate of increase in the global condensate to C+C ratio is indicative of total global data, it implies that actual global crude oil production (45 and lower API gravity) was approximately flat from 2005 to 2014, at about 70 MMBPD.
In other words, the available data seem quite supportive of my premise that actual global crude oil production (45 API and lower gravity crude oil) effectively peaked in 2005, while global natural gas production and associated liquids, condensate and NGL, have (so far) continued to increase.
If it took trillions of dollars of upstream capex to keep us on an “Undulating Plateau” in actual global crude oil production, what happens to crude production given the large and ongoing cutbacks in global upstream capex?
Dennis, I don’t focus on C+C because I think it makes sense. I focus on C+C because no one tracks Crude only except OPEC, Mexico and Norway. I would use crude only if it were available for every nation.
Hi Ron,
It makes sense because that is the data we have.
Hi Jeff,
Doctors act on those factors which they have good data on. They try not to guess except in emergencies.
Thanks for both of your replies, and for your invaluable contributions to the peak oil community over the years. While Saudi Arabia has had the money and expertise to maintain its production, it seems remarkable that the rest of the world has done as well as it has. It will be interesting to see how well they can keep it up as the world economy rolls into recession.
… it seems remarkable that the rest of the world has done as well as it has.
I don’t find it remarkable at all. Old oil fields have very low lifting costs. Every major oil country in the world can afford massive infill drilling and they have taken full advantage of the process.
Of course the USA exhausted their old fields many years ago. We were the original “infill drillers” and started the process years before we peaked in 1970. In California I have seen pump jacks only a few feet apart. But they were idle, the oil below them pumped out many years ago. And that was in 1959.
But then came the shale revolution and all that it wrought…
I remember one of the EIA forecasts for US production from 2006 or thereabouts, it showed growth in tight oil as this teeny tiny sliver that would maybe amount to 750 kb/d in 2030 or something pitiful. According to this graph our production would grow, of course – mostly courtesy UDW. No one foresaw tight production as much of anything to write home about.
Without the tightoil input I’d warrant we’d have seen bona fide shortages by now; or sustained super high prices impacting demand/economic growth. As it happens we had merely high prices and sluggish overall growth in production.
Hi KLR,
Very true that nobody saw LTO coming in 2009 or so. Without LTO oil prices would definitely be much higher, but we also might have seen more oil sands development and deep water drilling if oil prices had been very high (say $125/b or more from 2011 to 2015.) The high oil prices would also have reduced oil demand growth. Impossible to determine how it would have played out, but the LTO boom may be over soon (2018) and it will be difficult to replace that oil as it declines. The peak will be evident by 2020 to 2025. Oil prices will be well over $100/b by then.
The peak will be evident by 2020 to 2025. Oil prices will be well over $100/b by then.
hahaha
Hi Ron,
You may not be surprised, but the general consensus at the oil drum in 2008 or so was that it would be impossible to stem the decline. I was in agreement with that assessment at the time and I don’t remember you dissenting from the consensus view at the oil drum.
Hindsight is 20-20.
I haven’t a fucking clue as to what the hell you are talking about. I remember a lot about folks thinking the peak was in 2005 but I don’t remember anyone saying that 2008 was the peak.
Hi Ron,
I guess you weren’t paying attention.
http://www.theoildrum.com/node/5177
Obviously I was not paying attention to that particular post. You will notice I had no comments on that post.
Please keep in mind that I called peak in 2015 back in the summer of 2014, well before the price collapse or any decline in production. In fact production was still rising fast at the time.
Of course I could be wrong. I don’t see why you get so paranoid about calling peak. People make predictions all the time that are wrong. So what? I say 2015 will be the peak because I have been following every oil producing nation for years and I believe that there will be more oil in decline, post 2015, than oil increasing. It is that simple. I am 95% confident that I am right. But there is still a chance that I am wrong. So what?
Personally I’m not concerned with the precision of the peak oil date. To me peak oil is important only to the extent that it changes economic and lifestyle behavior. Until people, companies, and nations acknowledge that from some point on there will be less oil becoming available each year and we must plan accordingly, the peak oil concept doesn’t mean much in the greater scheme of things.
And as people have pointed out here, we likely won’t know we’ve hit peak oil until some point after it happens and it becomes obvious.
HI Ron,
I think it is rather likely you will be right about this year being the peak.
Are you willing to share your opinion as to how long it will take the MSM to acknowledge the peak?
Of course I will share my opinion on that because I really don’t have an opinion on that. But now that you mention it, I will give it some thought.
Thought……
About a decade or so I suppose.
Hi Ron,
If wrong, it will be only one among many incorrect predictions(not by you, but by many peak oil predictions by others). It won’t really matter, I think there might be a near term peak, but it will be surpassed as oil prices rise. My prediction is 2018 to 2020.
I thought Art Berman’s report, posted near the end of Ron’s last post, is a very good one, worth reading.
A lot of it touched on the shale mal investment, and how it continues due to ZIRP and hype.
That leads me to a specific question, which I think Enno, Freddy or others can answer.
I read some Seeking Alpha articles on shale now and then. It never ceases to amaze me, the hype spinners of shale on that site. In particular, those touting the likes of SD, HK, Magnum Hunter, Linn Energy, and many others that are trading at penny stock levels.
In particular, there is a nice guy over there named Michael Filloon who has a big following. He writes articles that tout increased production rates in the Bakken, and now seems to have also moved to the Permian Basin.
Every once in a while over there in the comments, I do one of my simple calcuations of a Bakken well assuming a certain production rate and certain (low) oil and natural gas price, which always shows the well big time underwater after 60 months, and even worse if interest expense is added.
I try to shoot for what I think is a decent Bakken well, 220K to 250K BO in 60 months, 220K-250K mcf gas in the same time frame, 100% gross working interest, 80% net revenue interest (20% royalty) 10% severance tax, $14K per month non down hole repair OPEX, $100K annual down hole repair OPEX, $2 per BOE g & a.
No one ever questions any of my expense assumptions, even though from looking at Bakken well lease operating statements, those can vary quite a bit depending in particular on amounts of produced water, how it is handled, and down hole failure rates.
However, I am always criticized as to the 60 month production estimates, and usually someone refers me to Mr. Filloon’s articles, which from my experience never go past 6-12 months, other than to mention the dreaded 1 million plus BOE EUR’s that apparently almost every LTO well will achieve after most of us are dead and gone.
Have new wells really gotten much better in the Bakken? Seems like from what I read here, the answer is not much. There is suspicion that new wells are not being properly choked, in order to achieve high IP/early months production, which will likely hurt in the long run.
I guess, for the future, when I get ticked off by yet another Bakken, “Look how Shale R Us is kicking it in the Bakken at $30 oil” article on Seeking Alpha, I would like to be able to use what the people here think would be the best 60 month oil and gas cumulative production amounts.
Also, if anyone has any better suggestions on OPEX, G & A, or net revenue interest (i.e. royalty burden percentages) please advise as well.
I probably just need to quit reading the hype, but it is interesting that Mr. Berman seems to think it is still alive and well and is still, even at sub $40 oil and sub $2 gas in the field, leading to mal investment in the LTO patch. Given that there are articles daily about companies that have .30 stock prices and billions of debt, with recommendations to buy such companies’ equity, Mr. Berman may well be right.
I suppose if we have to live with low oil prices until all the shale locations have been drilled up, that will take many years. It will really be interesting to see the endgame.
I did read an article over lunch about O & G financing in the Oil & Gas Reporter. It looks like, yet again, banks may let a lot of loan covenants slide this fall.
Why do shale companies insist in digging the hole even deeper? It is ridiculous IMO.
I continue to be a proponent of OPEC and Russia targeting $75 Brent, setting that price and adjusting every month, with the threat of abandonment of the target if North American production beings to grow.
I think LTO is such an investment hoax, it will continue to draw money in at $35 or $70. At least at $70, the rest of us who are just trying to mind our own business do not need to worry about the shale hoax.
Michael Filloon is a nice guy, but he has his analyses backwards. From a few nice wells, and company presentations, he draws his conclusions about a whole play or even US shale production. I have never seen him looking at all the available data for a certain play. Only if you look at all the wells in an area in a certain time frame, can you see what is really happening. On average (over all well locations in the play), an operator can only expect an average well. This point seems to be lost on him.
In the following 2 charts I show what is happening in the Bakken (July 2015 data). I show both the average Middle Bakken (MB) well, and the average Three Forks (TF) well, per year in which it got flowing. I chipped off a few data points at the end to include more data (except for 2015), but anyway there are no major differences between years. The point is: these charts include all MB & TF wells (that are currently not confidential), so there is no selection bias. I only include oil, as nobody drills for gas in ND.
In 2015, from what I can see so far (as for confidential wells this is not provided), the split between MB and TF wells is 56 %vs 44%, which was close to 80%/20% in 2008 to 2011. As TF wells are clearly worse, it appears that operators are forced to go for TF wells as well, as MB starts to slowly run out.
Despite improvements in both MB wells, and TF wells, as the focus is slowly shifting to TF, the average Bakken well is not getting much better. Fracs are larger, and also more costly (Continental mentioned a significant increase in completion cost for 2015). Do you see any proof that this makes a big difference in the long term?
On the longer term, there is no proof what these wells can do, and you understand the economics way better than most, incl definitely Michael. From a NPV point of view, it also doesn’t really matter probably what these wells do after year 8 or so. This is because by far the most profit comes from the early rapid flow, when OPEX/BOE is still low, and the time value of money still high. I see clear discrepancies between actual well results, and the results provided in investor presentations by the same companies. Caveat emptor!
Very nice stuff, Enno. Very interesting that 2013 is converging to 2010 after a better start. It chimes with some of our statistical research suggests that IP gaming increased after January 2013 – early month production increases but at the expense of later production.
Having trouble posting the graph, but just did some work to show the percentage difference from the 2010 benchmark of later years. The trends are clear – they are all regressing towards 2010’s cumulative figure, despite beating it early on.
gwalke,
Thanks for your comments, and I fully agree with you. It is a pity that there seems to be such a promotion culture among the public shale companies, but I guess that is what you get with the incentives involved.
If you want to post a picture, I recommend the png format, and make sure the size of the picture is below 50kb. Then there should be no issue.
If you want to post a picture, I recommend the png format, and make sure the size of the picture is below 50kb. Then there should be no issue.
Enno, you have it exactly backwards. The graph below is 43K in Gif, 56K in Jpg and 77K in Png. Png takes more space than any of them, almost twice as much as Gif. That’s why Gif pictures suffer some color distortion. The graph below was posted as a Gif.
What exactly do I have backwards??
I didn’t say png is the smallest format, but it’s still very efficient. But almost all of the graphs I post are png, which means no loss in quality (which jpg will cause), and support of more than 256 colors (which gif can’t).
Well excussssse me. I thought you were explaining the best way to make sure your graph gets posted. If bluehost is limiting the size of graphs it is allowing then the best way to get a graph posted is to make it use as little memory as possible. Png graphs use far more memory space than the others so they are more likely to get rejected.
OK let’s see if this worked. This is the percentage difference in cumulative production for average wells by year, with 2010 as a benchmark. As we can see, the most recent years look swell in that initial stage, but are all trending back towards 2010 levels as time moves on.
and the average for TF wells.
The above applies even more here, as high front month production ends up producing converging or lower cumulative production. As an industry, they are frontloading production and claiming that the gains will be felt across the decline curve – and they are lying.
So, based on these graphs, can someone answer the following questions:
Since 2008, what has been the average annual increase in well performance for MB wells?
Since 2011, what has been the average annual increase in well performance for TF wells?
Hi Enno,
Nice charts, thanks.
Can you remind us what it looks like for all MB and TF wells taken together? For the MB at 12 months it looks like 2014 is about 10% better than 2012, for the TF its about the same, the split is roughly 50/50 so I would think the combined MB/TF average well was about 5% better in 2014 vs 2012 (and 2015 looks similar to 2014 so far). Is that approximately correct?
Hi Dennis,
At the moment, that would not be a trivial exercise, as I had the above graphs ready. But it is indeed just a weighted mix of the above 2 charts.
The wells represented in these 2 charts, constitute about 85% of the overall ND oil production.
Thanks Enno.
shallow sand said:
Well it’s not like we haven’t seen this movie before:
shallow sand,
I fail to understand what all the wailing and gnashing of teeth is about. It’s clarion what’s going on here. What more is necessary for you to see what is happening before your very eyes?
The emotional distress you exhibit very much reminds me of something Reinhold Niebuhr observed:
From the same program linked above, here’s another telling segment:
Glenn: I hope that SS reads your comment. In essence, it is my philosophy. You can only make a lot of money when every one else is wrong. But, you have to be right when that happens – which is not all that unusual for smart people.
Sir John Templeton: You can’t earn above average returns doing what everyone else is doing.
But if there are 1000 things people are not doing, and only 1 will get you an above average return, and it’s totally random . . . . . . .
Everyone learns to manage from the same cookbook. Pretty much everyone who rises high at a company isn’t stupid. But companies still failed pre bailout. Results being dependent on smart decisions vs random decisions . . . not a lot of evidence of it. The list of CEOs hired from a previous spectacular success to then fail miserably is long.
Gets longer in a recession.
Well, at least the Clown Bus is getting smaller:
Glenn. Slept on your words. I’m going to try to take a break from this. I’m really very lucky in total. As I said before, 2003-2014 was a very good run, more than we deserved. Also, very lucky to quit buying while we were ahead. I am aware of many sales 2012-2014 that were financed almost 100% with the assumption of at least $80 oil for thru 2018. We are talking $100K+ per barrel.
I guess the hope on the oil is to live for another day. People that hung on through 1986-1999 were rewarded 1999-2014 and many sold out and retired. If this is a ten or so year down, ok.
I’m not so sure what is clarion. There is a lot of gloom and doom here, so maybe end of the world as we know it is what you mean?
Hi shallow sand,
Clarion it is that bankers are in the business of creating debt, and sometimes that can become very pernicious.
Debt is their product, just like yours is oil. If they don’t create new debt, then there is no way to grow and expand their business.
The rub is that debt, for the aggregate economy, is a double-edged sword. It can be thought of like white blood cells. A little debt, under the right circumstances, is good, even necessary to spur on growth in the real economy. Too much debt, however, is deadly.
The finance sector, needless to say, is loathe to admit this. To do so would dampen its growth prospects. One always has to keep in mind a key fact: the finance sector’s product is debt, and for it to grow it must produce more debt.
The onslaught of producing grotesque amounts of debt began in earnest in the U.S. in the 1980s. From the graph I have attached below, one can see that in 1985 the finance sector garnered only 10% of the nation’s corporate profits. By 2003 it’s share had grown to more than 30%, and has since fallen back to about 20%.
But the finance sector, needless to say, is not happy with the loss of this part of the nation’s profit pie. It would like to garner a much larger share of the profit pie. Blowing debt bubbles in the oil and gas sector, in the EMs, and in other sectors which produce primary materials is its way of maintaining and attempting to grow debt, and thus its profits.
Keep in mind that these inordinate profits of the finance sector are profits that other sectors — manufacturing, mining, retail, IT, transportation, etc. — are deprived of.
But depriving productive sectors of the economy profits is only part of the harm that a bloated finance sector causes. For as it grows and consumes an ever-increasing share of the nation’s profits, it also begins to capture and exert growing influence in other areas of the society and culture which lie outside the economic realm: in the intellectual, religious, social, political and military realms. Thus an overgrown finance sector has a corrosive effect on the very knowledge, values, morals, and ethics that underpin the society.
For instance, we know that maximizing aggregagte utlity is the holy grail of classical economics, of capitalism. But it is quite clear that an overly-indebted economy is an impediment to achieving this goal. It thus becomes incumbent upon “the lords of capital and their hired liars and bumsuckers,” as Orwell called the assortment of economists, evolutionary scientists, preachers, etc. which financiers gather around them, to create “facts” which are, in reality, defactualized.
As Neibuhr noted:
[T]he intelligence of privileged groups is usually applied to the task of inventing specious proofs for the theory that universal values spring from, and that general interests are served by, the special privileges which they hold.
This is what is clarion to me, but maybe not so much to others.
http://www.yardeni.com/pub/ppphb.pdf
Here’s a graph from Kevin Phillips’ Bad Money which shows the grotesque amount of debt the U.S. has built up since the 1980s.
As Phillips notes, when he uses the phrase “bad money,”
Money is “bad,” in the historical sense, when a leading world economic power passing its zenith — before the United States, think Hapsburg Spain, the maritime Dutch Republic, and imperial Britain just before World War I — lets itself luxuriate in finance at the expense of harvesting, manufacturing, or transporting things. Doing so has marked each nation’s global decline….
“Bad” in the sytemic sense further applies to letting a financial elite elevate, expand, and entrench itself as a country’s GNP- and profits-dominating sector. Doing this so hurridely has wound up institutionalizing runaway public debt and private debt, gross speculative biases, tenfold and twentfold leveraged gambling, unchecked and barely regulated “product” innovation, and a tendency toward periodic panics and instability…. As for the financial sector’s behavior in such circumstances, surely there must be some applicable variation of Lord Acton’s famous thesis about the greater the power, the greater the abuse and corruption.
The growth of the financial industry has been a boon for its highly-paid managers.
According to New York University economist Thomas Philippon, “total compensation of financial intermediaries (profits, wages, salary and bonuses) as a fraction of GDP is at an all-time high, around 9% of GDP.”
http://www.tcf.org/blog/detail/graph-how-the-financial-sector-consumed-americas-economic-growth
Great post.
I said great post, but didn’t indicate which post I was referring to and it got buried down the thread.
It was this post.
Debt is their product, just like yours is oil. If they don’t create new debt, then there is no way to grow and expand their business.
shallow sand,
In my view it is important to understand what kind of game is currently going on. It is clear that many shale companies are not sustainable when oil prices are below 50 USD/barrel. So, the strategy of many companies is to woo as many private investors as possible with stories about flooding the market with cheap – but economical – oil and gas through high efficiency. At some point many companies will go bankrupt and the small investors will be holding the bag. Yet, the companies will still produce and the smart money can come in buying debt free companies, which are much more competitive. This has happened already with Samson, where 10000 small investors have lost 7,2 bn. Yet the company is still producing under new owners, who own now are much better company. So, it is very important to be out of the sector and wait until the storm is over.
Is it only me who were surprised by the EIA today? Lower 48 flat and Alaska +19.000/day
the weekly numbers have a very high error margin (as the EIA explains), so I would not read too much in them.
Unfortunately the market does, but it does some crazy things so. Can someone answer what differs in the data collection/projections/calculations between the API numbers and the EIA? Thanks
Agreed. I’ll take a figurative chill pill.
This post was a reply to Glenn and clueless. Somehow it ended up here.
I would not be TOO surprised if the spot price of oil falls down to the twenty dollar range – for a VERY short period of time, maybe a few weeks. There could be bad economic news and people who are stuck with big inventories and incoming deliveries might have to have a fire sale – but fire sales by their very nature are short lived affairs.
Now let us suppose we are the ministers running a nationalize oil company, and our direct day to day expenses are forty dollars a barrel, and we are getting thirty five. We might want to keep producing and selling in order to prevent civil disruptions in our country, to avoid laying off men, mothballing equipment, maybe damaging some wells permanently. I am not too sure about that last but the hands on guys indicate it does happen.
It is perhaps possible to make up that five bucks by deferring maintenance, raiding certain accounts such as ones holding retirement funds, or by selling some assets such as a water treatment plant or something.
Immediate panic could be avoided, and there would be a strong hope that prices would soon go back above day to day break-even .Relationships with buyers and shippers would be maintained.
BUT- suppose the price DOES drop to twenty bucks- the loss would be so great that we as ministers or managers would be COMPELLED to just shut in our oil, excepting maybe a little for domestic consumption or some delivered to close allies and friends for reasons having to do more with the alliance than the money. We might swap some for grain or meat if we are food importers.
But in the main we would HAVE to shut down, pretty soon, because we would be losing our pants as well as our shirts by continuing to produce. Losing the shirt is one thing, the shirt PLUS the pants is another altogether.
I am guessing but my guess is that a very significant portion of the oil produced on a day to day basis is produced on an ongoing cash expense basis that exceeds thirty to forty dollars. This portion is something I can only guess at -twenty percent? thirty percent? Maybe ever forty percent ?
It seems extremely unlikely that ANYBODY or any combination of anybody’s has the ability to increase production enough to make up for the loss of five or ten million barrels per day.
Doesn’t it seem reasonable to predict that a price below thirty bucks would result in millions of barrels a day being shut in on fairly short notice?
So I believe there is basically a near zero chance that oil will go below thirty five or forty bucks for any significant period of time. Hundred car and five hundred car freeway crashes do happen of course- and something similar by analogy could happen in world oil markets forcing prices WAY down for a LITTLE while.
http://www.nytimes.com/2015/09/24/sports/baseball/yogi-berra-dies-at-90-yankees-baseball-catcher.html?_r=0
I would never have predicted that.
From Bloomberg:
Oil Drillers’ Credit Lines to Shrink as Banks Revalue Assets
http://www.bloomberg.com/news/articles/2015-09-23/oil-producers-credit-lines-to-shrink-as-banks-revalue-reserves
Oil producers in the U.S. are about to see their credit lines shrink, just when they need the money most.
The latest round of twice-yearly reevaluations is under way, and almost 80 percent of oil and natural gas producers will see a reduction in the maximum amount they can borrow, according to a survey by Haynes and Boone LLP, a law firm with offices in Houston, New York and other cities. Companies’ credit lines will be cut by an average of 39 percent, the survey showed.
Lenders are using $48 a barrel to value assets in the third quarter, down from $77 at the end of last year, according to a quarterly bank survey from Macquarie Group Ltd. And reserve growth has slowed because companies are spending less on drilling. The redetermination, which takes place around April and October, comes as investor appetite for energy company debt is fading.
Whiting Petroleum Corp. may see the maximum amount it can charge on its credit line lowered to $3.75 billion from $4.5 billion, James Volker, the Denver-based company’s president and chief executive officer, said in a Sept. 9 presentation.
The biggest risk is to borrowers that have already tapped their credit lines. If the borrowing base is cut to less than it already owes, the company will find itself abruptly facing a large repayment.
The biggest risk is to borrowers that have already tapped their credit lines. If the borrowing base is cut to less than it already owes, the company will find itself abruptly facing a large repayment.
That’s default territory.
wait there’s only 1.4 TB oil but 3.2 TBOE of gas/condensate in the 733 largest oil fields? really? i thought there was more oil than gas in the ground…
There is. I don’t bother with BOE, it’s a bullshit number. Look at the molecules and their mass. There’s more mass in oil. This gets complicated, gas recovery factor is a lot higher, it moves better from source to trap, and it also escapes the trap a lot easier. But if more means mass, there’s more oil mass.
i am talking about BOE in the ground, a unit of energy, and the most relevant metric. the numbers given here are obviously wrong. the 56 giant fields have 786 GB oil and 917 GBOE, but the 738 large fields have 1.4 TB oil and 4.7 TBOE, not even counting the gas only fields? i think they accidentally multiplied gas/condensate by a factor of 10.
So you are talking about the BOE in place? Not recoverable?
yes. keep in mind these are the giant OIL fields, not gas fields. i believe it is thought that there is more original extractable oil in place than gas, especially because we’ve extracted so much more oil. less is known about gas, and reasonable people don’t assume massive quantities of gas if we don’t actually know what’s available. what is absolutely certain though is that we have used up a lot more oil than gas, and the numbers quoted in the article are not consistent with this fact.
My comment up the thread on actual crude oil versus liquids associated with gas production, condensate & NGL:
http://peakoilbarrel.com/jodi-data-and-giant-field-depletion/comment-page-1/#comment-539573
RBN has a new current production chart by natural gas region. This would be a lot more useful if they defined the regions. The difference between Utica region and NE PA production is rather striking, especially as there are currently around 9 rigs working NE PA, depending on where you draw the boundary, and around 19 currently working OH according to Baker-Hughes, who say their data is from RigData. Their location data shows all of them in the EIA Utica region.
The current EIA “Drilling Productivity Report”, on the other hand, for some reason reports the current number of Utica rigs as 5.5. I believe that I have figured out how to calculate the number of rigs drilling in the Utica area, as reported in the EIA report.
Using the spreadsheet data, take the change in output over the previous month, add the monthly decline for that month, and divide by the reported rig productivity. This will give the number of rigs for 2 months prior. For example, for the August 2015 rig count, B106=(H108-H107-G108)/F108. This works back to Jan 2015, but not before then. I assume prior reported rig counts are actually measured and not calculated values.
In other words, the EIA rig counts reported for the Utica region for 2015 are exactly the rig counts necessary to match their smoothed production and rig efficiency model, with a 2 month delay. The connection to the actual number of rigs remains mysterious.
Month Baker-Huges Ohio EIA Utica Rig Count Calculated EIA Rig Count
Jan 45 25.6 25.5990949835
Feb 37 21.25 21.2509381696
Mar 31 18.0 18.0001687556
Apr 26 13.75 13.7497686263
May 24 12.6 12.6007535201
Jun 20 10.5 10.500347427
Jul 19 7.2 7.199513278
Aug 19 5.5 5.4998439337
Blaine
There may come a time, hopefully sooner rather than later, that the distinction between the Marcellus, the Utica and the Upper Devonian formations are more clearly identified.
Some analysts are projecting that Utica output will soon surpass the Haynesville to become the second largest in the country after the Marcellus.
Interestingly, there is a deeper formation, the Trenton Limestone (sometimes referred to as Trenton Black River) that has a very long and productive history. Several of Shell’s wells in Tioga county target both the Utica and the Trenton on their permits.
In 2006, a well, the Stoscheck 1, targeted the Trenton and produced 8 Bcf its first 18 months.
This well still puts out 600,000 cfd and is located across the border in NYS.
Thank you, Blaine. I have been disturbed by this weirdness for some time.
From the footnotes at the footnotes at the end of the September 2015 EIA Drilling Productivity Report:
3. The monthly average rig count used in this report is calculated from weekly data on total oil and gas rigs reported by Baker Hughes.
Obviously this is a lie. There are 14 gas directed rigs in the Utica according to the last Baker Hughes report. EIA says that one rig will add 7,484 per month. Those units are Kcf/d. That should add 104,776,000 cf/d. Legacy decline for October is projected by EIA to be 44,715 Kcf/d and total production is expected to be roughly 3.5 Mcf/d lower, an extremely modest decline. However, 104.8 Mcf/d of new production is a lot higher than the 44.7 Mcf/d decline and would actually project a total Utica production of 60.1 Mcf/d higher.
So either the EIA does not have a clue about how productive the rigs are or they don’t have a clue about how much gas will be produced. They obviously don’t care that their published rig counts radically mismatch Baker Hughes. What should we do to figure out what is really happening?
EIA uses only the total, and ignores the gas/oil label, so their rig number should be 19.
Mostly the EIA is just rehashing the state data. You can go download the OH numbers directly. It’s only available quarterly, so most recent are Q1 and Q2 2015, and I had a look at these.
The rig count is just wrong. The other numbers don’t look off by that much. Obviously the rig count being off will throw the rig productivity high and the production projections low. I’m only seeing around 5% monthly decline in the larger wells which are off plateau, which is relatively low.
The rig count was up really high for a long time without much production to show for it, which seems hard to square with the claimed high productivity. On the other hand CHK had 490 flowing wells in OH in 2Q 2015, more than half of the wells in the state, and mostly in Harrison, Jefferson and Columbiana counties. The average flow was 1866 mcf and 49 barrels “oil” per day. None of these are that old, and the decline rate isn’t that high either. The same stat for the non-CHK wells gives 3287 and 65. I think I can figure out where the wasted drilling effort went.
Flow from OH should gradually approach ~4.5 bcf/day at the 2q rate of ~100 wells/quarter. At 19 rigs, it should definitely hold over 3.0, although it’s hard to say by how much without a better wells/rig month number. The EIA decline projection for October and later is just wrong, and is based on their faulty rig count.
The recent OH production numbers look better to me than Marcellus excluding NE PA, which is about twice as good as the OH numbers. Once you take NE PA out, the average for the rest of the Marcellus drops quite a bit. Of course, OH starts looking worse if you put in more activity in the northern counties again.
This comment is intended for OFM who asked about EV’s and the rate of improvement of Lithium batteries.
My own opinion is that the current improvement rate is on a 7 year cycle. And that we are at least 2 cycles away from EV’s being truly viable (for BAU consumers). But I do not believe we have 15 years more of BAU.
Here’s a quote from Tom Murphy of DoTheMath website entitled Peak Oil Perspective
“A decline in conventional oil production represents a liquid fuels problem. Crash programs in solar, wind, or nuclear infrastructure—besides suffering from the Energy Trap phenomenon—do not address the fundamental problem. Replacing a fleet of vehicles with electric cars or plug-in hybrids will take decades to accomplish, amidst decline and hardship.”
Unlike the ‘EVangelists’ with their automatic praise or the ‘Deniers’ with their automatic put-downs – Tom Murphy seems to understand the problem. That is why I like this article My Chicken of an EV – http://physics.ucsd.edu/do-the-math/2015/08/my-chicken-of-an-ev/
“I am not yet personally convinced that we will see an EV revolution. Gasoline price fluctuations are a short-term killer of long-term planning. Batteries still do, and likely always will, disappoint. I am learning similar lessons on the nickel-iron battery front. We may have to face the fact that gasoline has been the ultimate transportation fuel, and the economists’ picture of universal substitutability may not apply. If EVs can never really outperform gasoline in cost, ease/simplicity, convenience, and robustness—and if they remain expensive to own and maintain, from where will the prosperity derive for us to all have such marvelous toys?”
And for people who are tempted by the low cost of used EV’s or are interested in setting up a futures market in these I suggest you look carefully at the page Battery Capacity Loss
http://www.electricvehiclewiki.com/?title=Battery_Capacity_Loss
Thanks Islander Guy,
I have read Murphy’s blog on a regular basis for some time. My own wild ass guess is that battery costs fall in half at about the same rate as your estimate- mine being the average of the five year optimists and the ten year more conservative sort of thinker.
Murphy’s analysis is sound and thorough – as FAR AS IT GOES. But it DOES NOT take into account the possibility that gasoline prices may spike to much higher levels and STAY up. Furthermore low gasoline prices are only slowing the ADOPTION of pure electric and plug in hybrid cars- which also slows the SCALING UP of battery manufacturing capacity.
My personal opinion is that low gasoline prices have hardly even SCRATCHED the paint on the battery RESEARCH juggernaut.
There are literally tens of thousands of engineers, chemists , physicists and other scientific and business types working feverishly on battery development and this work shows NO signs of slowing down so far as I can tell.
I am NOT an engineer by any means, except the self educated tinkering type- but I have made a career out of not having a career, and my non career has involved automobiles and trucks off and on as a mechanic, besides most nickel and dime farmers being pretty good mechanics as a matter of necessity.
EXCEPT for the battery, building an electrified automobile is a perfectly routine job, and actually easier, and cheaper too, than building a conventional car. Any auto assembly line could be as easily converted to electrified cars as to any other new or different model.
Public policy may result in the building of pure electric or plug in hybrid cars being MANDATED right across the board. This might sound far fetched, but virtually every major manufacturer in the world is devoting substantial resources to the possibility that for one reason or another the age of the electric car is HERE.
Now you will SELDOM hear it mentioned in forums such as this one, but there IS an EXTREMELY impressive reasons why various governments should FORCE the adoption of electrified autos and light trucks.
We hear all the incredibly ignorant bullshit some people peddle about price not mattering, and money only being a problem so long as you are not willing to spare the pixie dust etc etc.
BUT IN REALITY, there always comes a time when CHICKENS come home. Oil exporters are NOT going to sell their oil for Euros or yankee dollars or ANY currency just to put the checks under the mattress. EXPORTED OIL from Saudi Arabia to say GERMANY means REAL GERMAN GOODS must eventually make their way to Saudi Arabia- or that German real estate belongs to Saudi princes, that German companies belong to Saudi princes.
If a government mandates the sale of plug in hybrid cars such as the Chevy VOLT, or pure electric cars such as the Nissan Leaf, then it WIPES out the need for ninety percent of the oil that will be needed for new cars from that day forward. WIPES IT OUT. This obviously enough does not solve the legacy fleet problem of course- but it does mean one older gas hog gets scrapped or demoted to third string status for every new electric that hits the road.
If anybody questions whether the auto industry believes in peak oil, I urge them to think about the fact that Ford just brought out their best seller with an ALUMINUM body.
Ford did not go to the enormous expense involved because Chevy owners are displaying bumper stickers that read “This is Chevy country. On a quiet night you can hear the Fords rusting”. Sarcasm light blazing.
BMW has announced that the companies ENTIRE vehicle line will be electric or hybrid within the next few years.It is rumored or speculated in the gear head press that GM is looking at aluminum pickup trucks.
Now let’s look at this from the pov of an entire country that has a self sufficient nationalized oil industry that is slowly going to hell in a hand basket – which is the ONLY possible LONG TERM place the oil industry can possibly go, unless you consider coal to liquid technology is the same thing as OIL , or you consider biofuels etc to be the something as OIL.
If NATIONAL oil production is expected to decline at a couple of percent per year, and you and I are the economics advisors/ planners/ little tin gods, call us what you please, then we would have EVERY reason to push for the adoption of electrified transportation. We could see to it that our country remains SELF SUFFICIENT in oil for a LONG TIME if we put the pedal to the metal on electrifying our auto and light truck fleet.
Notice I have not even MENTIONED environmental considerations.
I have TRIED to post comments several times questioning Murphy’s economic assumptions at his blog- NOT his physics assumptions. They NEVER get past ”Awaiting Moderation”.
I have never found any reason to question Murphy’s physics. NONE at all.
His physics are part of the reason I am convinced the world as a whole is headed to hell in a handbasket- but hopefully not for a little while yet.
If the USA were to put just twenty percent of what we Yankees spend on the MIC into renewable energy and efficiency technologies, we really could be energy self sufficient, and regain our status as the preeminent nation of the world in economic terms.
The Rechargeable Revolution: A Better Battery
http://www.nature.com/news/the-rechargeable-revolution-a-better-battery-1.14815
For the first time the possibility of battery energy densities near liquid fuels are being proposed. Still pie in the sky, but the fact that it is even being seriously thought about is revolutionary. Considering that an electric car is far more efficient than an ICE, the batteries only have to reach about 1/6 the energy density of gasoline to be equivalent in net energy per kg.
Meanwhile in the real world prices keep going down while energy density rises.
The world is set to almost double the mpg of cars by and before 2025. The US is, of course the last dog in the race but is still set to double it’s mpg in passenger cars. That alone should knock off 25% to 30% of demand for oil.
“That alone should knock off 25% to 30% of demand for oil.”
If technological improvements reduce demand on oil products, with oil price dropping further, then won’t long term oil supply be threatened by the lack of incentive for exploration?
It’s sort of an ironic situation in which concerns for peak oil driving improvements in technology and alternative energy sourced vehicles further impedes the future of oil by reducing demand, and at some threshold forces a descent from peak. But maybe that’s the face of a transition, or at least the attempt to make a transition to a civilization less dependent on oil.
Stilgar,
A transition, yes, an attempt, no. It will be a forced reaction, not a cognizant effort to do good.
You overestimate humans, I’m afraid. We are an intelligent species, but we are not very smart.
Excessive human population is the obvious dilemma. Since we are not smart enough to control our numbers ourselves, Mother Nature aka the Laws of Physics will do it for us, sooner or later. Best not to be here later.
Get the goody out of every day. Enjoy the nice things in life, especially those provided by BAU. They may not be here long.
Jim
Stilgar, demand has to descend along with the descending production. It won’t hurt the oil industry, since the oil industry will be on the descent anyway. If you think those relatively small, highly expensive, high tech plays will give more than a few extra years of very expensive oil, then please show me the big fields.
If EVs can never really outperform gasoline in cost, ease/simplicity, convenience, and robustness—and if they remain expensive to own and maintain, from where will the prosperity derive for us to all have such marvelous toys?”
I think you are not taking into consideration the possibility that there are disruptive technologies in the wings that will drastically reduce the need for private ownership of all those expensive and marvelous toys. We as a society will be pooling those toys. Think Uber, electric bicycles, buses, trains and a few smart golf cart like EVs. Sure there will always be a few who will be able to afford the high end EVs like the Teslas. The idea that the masses will be owning private automobiles long term, seems to me to be a highly unlikely proposition. But then again, I happen to be in a city right now where it is literally impossible to drive anywhere at certain times of the day.
BTW I really like Tom Murphy but I’m not sure he takes paradigm change into consideration. Though to his credit in his presentation “Growth Has an Expiration Date” he does state unequivocally that in the future we will not continue to use energy the way we have until now because the laws of thermodynamics do not allow it. So either way, no expensive toys or ponies for most people on the planet.
Edit: someone in the comments to Tom’s post added his personal experience with an electric motorcycle.
https://ptruchon.pagekite.me/wiki/blog/2015-03-30/electric-zero-motorcycle
I believe electric motorcycles ( and electric scooters too) will eventually become VERY popular- but for now you get DAMNED little for your money when you buy a motorcycle of any sort.
Park one next to a car that sells for the same price and the difference will be obvious even to a republican.
There is probably very little room for the price of a new conventional car to come down, but if the market for motorcycles ever becomes TRULY PRICE COMPETITIVE- meaning tens and hundreds of thousands of the same MODEL ( think Civic or Impala) are sold every year the price of them will probably fall by two thirds.
Incidentally I used to ride both scooters and motorcycles and still ride on rare occasions. You are somewhat safer on a motorcycle than on a scooter everything else equal. They handle better and are less likely to throw you on account of a pot hole or curb or loose gravel or wet pavement etc.They stop better, and you have a better chance of managing a successful emergency maneuver to avoid a car.
Scooters keep you a lot cleaner and dryer if the road is wet due to the floorboard keeping water throw by the front wheel off your pants and shoes.
I got an idea: an electric scooter with a built in pedal generator driven by a young passenger sitting in a reclining position, which supplements a 10 kg battery pack.
I vote with you on this one, Fred. Mass private ownership makes no sense, and is certain to change to what you say.
Of course fleet operators look to the bottom line, where EV’s shine.
So where does all that put the guys still betting, despite huge losses of late, on distant holes in deep hard frozen rock?
BTW, I inherited my good electric power tools from father in law, all of them are at least 60 yrs old, work perfectly, and show absolutely no sign of age — unlike me — and that endless trail of passed-on ICE’s I have left behind me .
“My own opinion is that the current improvement rate is on a 7 year cycle. And that we are at least 2 cycles away from EV’s being truly viable (for BAU consumers). But I do not believe we have 15 years more of BAU.”
I would tend to believe that we are already four to five years into the first of the two cycles needed for “EV’s being truly viable (for BAU consumers)”. I base this belief on the announcements from automakers, GM and Tesla in particular, that they will be $35k cars for sale, capable of 200 miles on a charge by 2017. Renault/Nissan could probably join that party by coming out with a 200 mile capable offering that, is only slightly more expensive than the Zoe/Leaf currently being offered.
Will these cars arrive in time to make a meaningful impact on oil consumption, allowing some semblance of BAU to continue for the ten years needed to complete the second cycle? That, to me, is the question.
Odd to me that all the above chatter about EV & BAU does not point at one monster rock hanging over all – the quite likely possibility of some sort of HUGE environmental catastrophe, forcing the end of ff’s regardless of any petty money or convenience bothers therefrom.
I know this sounds nuts to those here present, but my own experience tells me that if I were forced to get on without any petroleum from right now on, I, and lots of people here, could do it and live to tell the tale. Of course, I live in the deep boonies, dam few people close by, and lots of those used to living mighty close to the ground.
As for the city people, well, look at the cities around the world that right now use a very small fraction of a standard US city, and have done so for centuries. And Cuba.
And on top of all that, the Pope says BAU is a sin. End.
For anybody that knows-I keep seeing figures thrown out about the so called average new car costing so and so much in the USA. Who computes these figures and HOW?
They seem on the high side to me.
I have checked dozens of articles on the net without finding a single one that specifies whether this is a numerical or median average,
And actual sales prices are generally substantially discounted from MSRP prices – whether this is taken into account or not is never mentioned, or else so rarely and in such fleeting fashion as to be of no real use to a person who wants to know what the “average car” actually costs.
China is exporting record amounts of diesel.
http://www.bloomberg.com/news/articles/2015-09-23/china-commodity-deluge-extends-to-diesel-as-glut-shrinks-profits
http://www.wsj.com/articles/energy-lending-caught-in-a-squeeze-1443050639
Several industry officials said the meeting, held at Wells Fargo’s offices in downtown Houston, was the first of its kind. The bankers and regulators sat around tables in a large room with a screen displaying the OCC’s agenda that largely focused on examining and rating the loans, people familiar with the meeting said.
The banks were concerned because a review of their loans by regulators this spring left many reserve-based loans rated as riskier than the banks had considered them to be. They spent much of the meeting explaining why reserve-based loans are similar to lower-risk, asset-based loans, some of these people said. The bankers also questioned why the OCC considers an energy company’s total debt when assessing reserve-based loans, which generally get paid off ahead of other debt in the event of a restructuring.
“We disagree with the regulators,” said Francis Creighton, executive vice president of government affairs at the Financial Services Roundtable, an industry trade group. “These are good loans, they have a history of performing…we think their analysis is incorrect on this.”
Mark to Market – or Alice in Wonderland ?
I suspect that the outcome of all this is that the banks will be served up a tripple dip cone of regulatory forebearnance, crowned with a generous portion of chocolate, with a big red cherry topping it all off.
After all, as one disgruntled lawmaker put it, the bankers “own” Washington.
To be forced to write down those bad energy loans wouldn’t be too good for those bank profits and balance sheets.
And any honest regulator who makes a genuine effort to defend and represent the public interest will be demonized, persecuted and drummed out of public service, and their pathway to future fortune via the revolving door will be shut closed.
The loan quality will be allowed to deteriorate until it is no longer possible to obscure the reality, at which time the government will swoop in to buy up all the bad loans, at face value of course, if some more opaque way of making the bankers whole cannot be devised.
How many times have we seen this same movie play out over the past 33 years?
Six days ago, under the second non oil open thread, someone posted a link to a thinkprogress article, Half Of California’s Electricity Will Come From Renewable Energy In 15 Years. One of the things that caught my eye on re-reading the article this morning was this little tit-bit:
“After the Assembly passed the bill, it had to go back to the Senate for final passage because one key component got stripped out. On Wednesday, following intense lobbying from the oil industry and the defection of a group of moderate Democrats, the bill’s advocates decided to abandon a key component of the bill that would have set a 2030 goal of cutting petroleum use in cars and trucks by 50 percent.”
My question, is there a single person here who thinks it is impossible for oil production to fall to 50% of current levels over the next fifteen years?
When answering please bear in mind what Ron wrote in a post further up. I quote:
“Well hell, I would say that a 4.4% depletion rate is really pretty alarming. That takes you down over 50% in just 16 years.
Goddamn, that is absolutely scary! That ain’t nearly enough time to get those so-called “renewables” up to speed.”
I’d really like to try some of the dope that these “oil industry” guys are smoking! It must be way better than anything else the world has ever seen, for allowing people to escape reality. They actually think “a 2030 goal of cutting petroleum use in cars and trucks by 50 percent” is going to be a problem for them? Methinks they are going to have many other problems by then!
I am in island boy’s corner- and Ron’s.
Low oil prices are going to last about as long in terms of the future history of oil as a snowball on a hot stove.I feel for the guys in the industry but we had three different years that my expenses ran almost as much as usual without ANY revenue coming in from our our farm-I mean ZERO revenue rather than just low revenue. The land payments, the fertilizer, the pesticides, the fuel, property taxes , repairs etc all had to be paid just the same. The only avoided expense was the cost of harvesting the non existent crop.
The people hands on in the oil biz will survive too- one way or another. Any who pass thru my part of the world are welcome to stop for a free meal and a bed for the night- any who comment here I mean.
We survived. Some of our neighbors went broke. I eventually quit due to not being able to scale up at my age and considering the family situation.
According to Battery University, a ten thousand dollar lithium ion battery only has a hundred dollars worth of lithium in it.
So- it seems reasonable to me to think maybe there is PLENTY of lithium out there-for the next decade or two at least- at a much higher cost of course. If it goes up twenty times, that is still only a couple of thousand bucks worth.That ought to make mining a lot of currently second class ores some place or another quite profitable for somebody- especially if the ore also contains other pricey minerals as well .
I know plenty of people who are using a couple of thousand bucks worth of gasoline every YEAR to get to work. Of course I they do have longish commutes.Well paid jobs are scarce in my neck of the woods.
It will also make recycling cheaper than mining new.
First, account for a world wide market. The ones sucking wind when oil hits $160 per barrel will be Jamaicans and Turks. Second, a decline rate for existing production is offset (partially or completely) by new production. As prices increase we go frantic trying to produce oil to make sure we can rip you off while the going is good.
Ahhh! Provided that Fernando is not being highly sarcastic with his comment, he has revealed his hand in a manner of speaking. His problem with renewables is not so much that they cannot work but, more likely that they can, providing an alternative should the industry he represents ever try to rip off it’s customers in the future. Without alternatives, those customers would either have to pony up or do with out some modern conveniences like electricity in the case of many islands.
Things make a lot more sense to me now, having read this comment!
Yes, Islandboy, Fernando is a reasonably intelligent guy, a bit ideologically misguided perhaps but certainly smart enough to read the writing on the wall.
He has spent his entire life supporting and gaining his sustenance from a paradigm which is no longer sustainable. So naturally he is resistant if not outright hostile to what he perceives as a threat to his long held world view.
Deep down he knows that renewables and even current battery technology work just fine as long as you adjust your expectations… he will almost certainly live to eat crow on his climate change denialism. Who knows he might even have to come around on his theory that communism is still a major threat to our industrial civilization. Though I’m not holding my breath on that one!
My question, is there a single person here who thinks it is impossible for oil production to fall to 50% of current levels over the next fifteen years?
It is not impossible, but it would be disastrous if it did. If we were to have a worldwide economic collapse then production could easily fall to 50% of current levels and that would be a disaster. But yes, it is impossible for oil to fall to 50% of current levels without an absolute disaster crashing world economies.
Dream on, it just ain’t gonna happen because we make better batteries and build a lot of solar plants and wind generators. Though a lot of people here think it could very well happen. The cornucopianism on this blog is just getting out of hand. 😉
Oh, and even if the peak is 2015 there is no way we will be down 50% in fifteen years. That would be a decline of about 4.5% every year. I am pessimistic but not that pessimistic.
I believe in better batteries that will soften the crash. But the crash is coming , without a doubt.If oil supplies are off by fifty percent in fifteen years, I might live to see the shit hitting the fan fast and furious myself.
Now if production drops only a couple of percent a year- and the third world STAYS the third world- and birth rates fall faster than expected- and we get some Pearl Harbor Wake Up Events starting soon and often- well , we have a shot at getting by with two percent less oil year after year for a long time. I don’t have any problem envisioning half or more of the new cars sold ten years from now being smaller plug in hybrids if the price of oil shoots up and stays up- which seems rather likely to me.
Even a piddly twenty miles of battery range could just about eliminate the need to buy gasoline on a regular basis for tens of millions of drivers here in the US alone.
It would cut the need for gasoline in half for tens of millions more.
A lot can change in fifteen years. People will be buying some sleek sporty little cars that seat two fore and aft and get over a hundred mpg without a diesel and without a battery imo.
All that is necessary for such cars to be in dealer showrooms or at least in shows as concept cars is that the safety nazis be banished and for oil to hit oh maybe one twenty or one twenty five a barrel. It would help if Uncle mandated the production of a few of them as well- the auto companies might then discover that they sell like ice water in hell to people who NEED a cheap running car.
Ron, buy some chips and get scaling…LOL..got semi-conducting properties?:
http://www.theenergycollective.com/comments/user/403236
“The metric you have overlooked is computer technology scaling. The better and cheaper computer chips and computer memory get, the better analytics get, the better solar placement gets, the better weather prediction gets, etc etc.
For fossil fuels, that increased computer efficiency is all going towards finding more resources to drill. That methodology’s scaling potential is largely over, there’s only so many economical reserves out there no matter how much computation you have to look for it.
The economics of semi-conductors have become so powerful that every subsequent technology that gains access to their scaling will beat all other technologies.
Lighting technology recently aquired the same upgrade. LED lighting is a semi-conductor that emits light, that’s it.
If it doesn’t have semi-conducting properties, it will be obsolete soon.”
Ron Wrote:
“Oh, and even if the peak is 2015 there is no way we will be down 50% in fifteen years. That would be a decline of about 4.5% every year. I am pessimistic but not that pessimistic.”
All depends on how long horizontal drilling holds out in the super giants. I could see Production down near 50% in 15 years. Super Giants are the backbone of cheap production. My guess is that at least some of them will run water out in the next five years. Once the Cheap Oil is gone, its hard to believe that the world can replace it with non-conventional oil production. I believe that prices will become very volatile, leading to lots and lots of demand destruction contributing to production declines. I also don’t see sufficient investment to avoid a steeper decline. The low oil prices is causing Oil majors to cut Capex and the smaller drillers are heading into bankruptcy, which will lead to a production gap at some point. This gap will likely have severe economic ramifications.
Economically, the World is close to a tipping Point. ZIRP for 7+ years. The Emerging world is now under crisis (China, Brazil, etc) as well as the EU (now even more with the flood of refugees). The ME is also a powder keg ripe for a major war (Sunni vs Shia). In my opinion, 15 years seems like an eternity for the world to keep it sh*t together. Every year that goes by there is a new crisis in the Asia, South America, the Middle East, and Europe. So far only the US, Canada, Australia, and India have managed to keep BAU going.
FWIW: In my opinion, Now is the time to plan and begin to implement self-reliance. Move to some place rural where there are plenty of resources should things not go as planned by the collective World bureaucrats. Very often in history, crisises usually get much much worse before they get better.
Sooner or later you all will come to a realization we are in deep trouble, Better to consider all options, rather than gamble on miracles. I hate to have to say “I told you so.” Better to be a day early than a minute late, when you have no options left.
Today’s WSJ – Search fracking-firms-that-drove-oil-boom-struggle-to-survive
“The market has gone from cutthroat to nearly nonexistent in some oil-and-gas fields. So far this year, the amount of fracking work has fallen about 40% from a year earlier, and the price of a frack job has fallen 35%, according to Spears & Associates, a consulting firm for oil-service companies.”
For all of the barrel counting and depletion rate disputes on this site, no one ever seems to even mention or even think about the relationship between oil and US dollar. I believe the fall in oil prices is directly linked to the increase in the value of the US dollar. The success, or false success, of the massive money printing by the Fed (QE1-3) and a zero interest rate policy have caused other countries to imitate the practice and place the Fed in a box. If they raise interest rates the US dollar appreciates, if they don’t they lose credibility. My point is that what happens to value of US dollar has a huge effect on oil prices.
dmg555 said:
Except the central banks of some countries, like China and Mexico, are spending large chunks of their U.S. dollar reserves to buy up their own currency in order to defend it from further devaluation.
The “currency war” theory breaks down pretty rapidly upon closer scrutiny.
See for instance:
Or see this:
It is possible that the fall in the price of oil and other primary materials is one of the causes of the rising dollar, instead of the rising dollar causing the fall in the price of oil and other primary materials.
What happens to the prices of oil and other primary materials can have an effect on the value of US dollar.
“It is possible that the fall in the price of oil and other primary materials is one of the causes of the rising dollar, instead of the rising dollar causing the fall in the price of oil and other primary materials.”
If memory serves, the sequence of events was the end of QE3 was immediately followed by increases in the value of the dollar, followed quickly by dropping oil price. The end of QE3 probably acted as the catalyst for perception of a steadier economy including increased currency valuation.
Meanwhile, back in Texas and North Dakota wells were being drilled and fracked in enormous quantities, lifting those two states’ combined production higher than Venezuela+Kuwait’s.
That’s the way I see it.
It’s as simple as world oil production (supply) growing faster than world oil consumption (demand).
Those little green bars on the EIA chart below pretty much tell the whole story. They shifted to the plus side Q1-2014 and have grown taller and taller with each successive quarter for the past six quarters.
Do you see any change in inflection of the consumption curve over the past five years?
I sure to heck don’t.
The change in inflection came in the production curve, beginning in Q1-2014.
This is what caused the low oil prices.
The low oil prices in turn sent shock waves through global currency and credit markets. This is so because many emerging economies depend on the dollars they earn from the export of oil to pay for imported goods and also to make the payments on their dollar-denominated external debt.
Don’t know what consumption inflection you’re looking at.
Look at mazamascience.com/OilExport. That’s the right one.
..
The taper began in December 2013 and ended with a final $15 billion purchase in October 2014.
http://www.bloombergview.com/quicktake/federal-reserve-quantitative-easing-tape
The Fed tightening monetary policy can without a doubt cause destruction of global oil demand, which in turn can cause oil prices to fall. That was the case back during the 1980s.
However, I don’t see any evidence of that being the case in 2014.
..
The EIA forecasts production exceeding consumption for the future to keep prices down. The production turn around in early 2016 doesn’t make any sense.
some thoughts on the conflict in Syria….
“In every crisis situation such as the one taking place in Syria as we speak it’s often quite difficult to determine the main underlying cause(s) which triggered it. And that’s certainly true in this country in which at least 8 nations and numerous terrorist groups are, in one way or another, engaged in the proliferation of that country’s raging war.
It’s no secret that the U.S. and some of its allies are doing everything in their power to remove Syria’s Assad regime. But why do they and their leaders feel so strongly that it is must be done, why is it so important to them? Why does President Obama continue to insist that Assad must go and why does he believe that he has the right to interfere in the internal affairs of that country? The standard answer to these questions is that it’s a part of the process to hunt down and destroy ISIS terrorists who have infiltrated that country and are causing great havoc within it.
It appears that Mr. Obama’s agenda is very similar to that of Bush/Cheney when they decided that Saddam Hussein had to go. They invaded, occupied and literally destroyed that country, sending many Iraqis to their deaths and millions into exile. One thing is certain; where there is an issue involving gas or oil anywhere in the Middle East you can bet that the chances of some conflict erupting are very great and you will find the U.S. government right in the middle of the action.
This situation is very complex and there is much confusion over who initiated this civil war; who is the most responsible and the most guilty, and how and it will ever be resolved. We must not just accept the usual explanations that are offered up by the controlled national media but, instead, think deeper about the most plausible underlying causes.
With that in mind let’s turn our attention to the vast oil and natural gas reserves and the transit systems that are used to deliver these resources to other countries. When we speak of pipelines it should be understood that a tremendous competition currently exists for delivery of natural gas to many of the European nations.
The country of Qatar has substantial reserves of gas which it badly wants to sell to these European countries, to take the business away from Russia, the current major supplier, and prevent Iran from doing the same in the future. The favored, most expeditious route for the Qatar gas pipeline is via Saudi Arabia, Jordan, and Syria, to Turkey and then to Europe. The problem is that Assad, who initially signed off on the routing this pipeline through Syria, did an about face and backed out of the deal.
Quite likely Assad did it because he decided to align himself with the planned development of the competing Iran,-Iraq-Syria pipeline. That move on his part is why many geopolitical experts say that this clash between Syria and Iran (with Russia in the background) on the one side and Qatar/Saudi Arabia and the U.S. on the other, was the main reason why this conflict erupted. ”
http://www.opednews.com/articles/Underlying-Reasons-for-the-by-michael-payne-Assad_Competition_Control_Crisis-150924-275.html
Maybe. Obama, like Clinton and Bush II, has a lousy foreign policy touch. I miss Ronald Reagan & James Baker.
“Janitor Jim” was invaluable in cleaning up Reagan’s messes, and helped with Bush Senior also.
He had talent.
And didn’t end up indicted like a lot of the rest of Reagan’s administration.
Yep. Most people can’t remember Baker. He’s the last senior civilian official who had his crap put together. Colin Powell had it when he was a general, but he lost his marbles when he worked for Bush.
from ezrydermike:
But before the U.S. can use ISIS terrorists as a pretense to intervene in the internal affairs of a country, it must first create the ISIS terrorists.
The U.S. strategy in Latin America is identical to its strategy in the Middle East, and has been explained as one in which “the United States first creates chaos, and then intervenes to administer it.”
The only difference is that in Latin America “terrorism” comes dressed up as drug lords and not as muslim extremists.
But the U.S. has not done a very good job of “administering” the chaos it creates. After creating drug lords and muslim extremeists, these Frankensteins have a way of turning on their creator.
After Al Qaeda Declares War on ISIS, US Unsure Which Terrorists To Back
THE PENTAGON — The US Department of State is in absolute chaos following Al Qaeda leader Ayman al-Zawahiri’s declaration of war on ISIS, according to sources. The Pentagon remains deadlocked days later, as sources say its foreign policy experts remain unable to decide which of the two groups the US should rush supplies and military advisers to.
“If there’s one thing we’ve learned in the last hundred years,” Secretary of State John Kerry said in a statement following the declaration, “it’s that funding and supplying terrorist groups never backfires. Look at the thriving, first world nation Libya has become in just the last five years… And Afghanistan … well, it’s Afghanistan. This strategy will work here, too. We just need to figure out who will turn on us slower.”…
“Usually we expect a gap of twenty, thirty years at least before we have to start killing people we trained,” Defense Logistics Agency analyst Richard Teller said, on condition of anonymity….
Still, despite hours of planning meetings and hundreds of thousands of dollars poured into think tanks around the Beltway to help solve the problem, the question still remains: who is going to get the goods?
“It sure as shit isn’t going to be the Iraqi government,” Teller said. “We’re not fucking stupid.”
Read more: http://www.duffelblog.com/2015/09/us-unsure-which-terrorists-to-back/#ixzz3mhKPs84a
For those who don’t know, The Duffel Blog is satire.
And it doesn’t get much more explicit and in-your-face than this:
2012 Defense Intelligence Agency document: West will facilitate rise of Islamic State “in order to isolate the Syrian regime”
http://www.moonofalabama.org/2015/09/with-us-unwilling-to-fight-the-islamic-state-russia-deploys-troops-to-syria.html
“One of the things that preceded the failure of the nation-state of Syria and the rise of ISIS was the effect of climate change and the mega-drought that affected that region, wiped out farmers, drove people to cities, created a humanitarian crisis,” O’Malley told Bloomberg TV on July 20.
Two months later, O’Malley repeated his argument in an interview with the progressive radio show Democracy Now! on Sept. 10: “Their government could not take care of the basic needs of families in those conditions. Civil war rose up as a result of protest and repression … then the vacuum to that led to ISIS. So these are the cascading effects that happen in a world that’s very, very connected and in a world where climate change is now creating extreme weather conditions, prolonged droughts.”
…
Our ruling
O’Malley argued that “the cascading effects” of climate change contributed to the rise of ISIS
The O’Malley campaign referred us to a credible March 2015 study that supports his point. According to the study, a drought in Syria in the 2000s displaced millions of refugees and added to discontent that eventually erupted into war. While the study does not mention ISIS by name, the authors say O’Malley is simply taking their argument one step further.
Experts agreed that the drought, spurred by climate change, was one of many factors that led to the Syrian conflict. O’Malley’s phrasing suggests he understands this and is careful not the overstate it.
We rate his claim Mostly True.
http://www.politifact.com/truth-o-meter/statements/2015/sep/23/martin-omalley/fact-checking-link-between-climate-change-and-isis/
Climate change in the Fertile Crescent and implications of the recent Syrian drought
Significance
There is evidence that the 2007−2010 drought contributed to the conflict in Syria. It was the worst drought in the instrumental record, causing widespread crop failure and a mass migration of farming families to urban centers. Century-long observed trends in precipitation, temperature, and sea-level pressure, supported by climate model results, strongly suggest that anthropogenic forcing has increased the probability of severe and persistent droughts in this region, and made the occurrence of a 3-year drought as severe as that of 2007−2010 2 to 3 times more likely than by natural variability alone. We conclude that human influences on the climate system are implicated in the current Syrian conflict.
http://www.pnas.org/content/112/11/3241.full
Drought is currently contributing to economic problems and political unrest in Brazil. A large part of the problem is deforestation in the Amazon region. Climate change is real and it is caused in part by human activity. Burning fossil fuels isn’t exactly helping either…
https://www.ted.com/talks/tasso_azevedo_hopeful_lessons_from_the_battle_to_save_rainforests
Exxon and other fossil fuel companies knew about the consequences of climate change back in the 1980s, who knows maybe more and more people around the world will start to wake up to what is going on in the world…
http://www.ucsusa.org/news/press_release/fossil-fuel-company-deception-climate-warming-exxon-0511#.VgSLg_lViko
We have met the enemy and he is us!
Pogo.
Climate change, even if it really is caused by humans as the taxpayer supported science theorizes, does not cause droughts, that much is a pure false equivalency. Droughts are caused by a low incidence of atmospheric water vapor, which is caused by low evaporation rates upwind from the drought areas. Increased heat, such as that taxpayer supported climate change theory supposes we now have, also does not cause droughts. Heat causes accelerated evaporation, which creates cooling and passes moisture downwind until it is either absorbed into biomass or absorbed into the ground and lost to the chain of evaporation and precipitation. Drought areas lie at the far end of a broken chain, caused by insufficient water vapor at the source, such as we see in California with the effect of cold sea water yielding little vapor. Another factor is atmospheric density, where we see major vapor plumes falling right back into their source waters because there is no other sustainable vapor source to maintain the heat and pressure required for the Aquarian conveyor to transport water. To suggest that humans can possibly have a role in altering any of these natural processes is pretty preposterous, if you think about it.
Aside from funneling stacks of taxpayer cash into academic institutions, The major shortcoming of the unproven anthropogenic climate change theory is neglecting to understand energy and transportation of energy, oddly enough.
To suggest that humans can possibly have a role in altering any of these natural processes is pretty preposterous, if you think about it.
Hmm, maybe you have a point. Ok, I thought about it… and I’ve concluded that you are either a paid troll or an absolute idiot, maybe both. Please crawl back under the rock where you and your ilk normally lurk.
The idea is that increased CO2 increases temperatures, which in turn puts more water vapor in the air, which causes MORE precipitation. The increased CO2 also helps plants to breathe more efficiently, thus saving their water. The increased CO2 raises temperature north of 60 degrees latitude, which in turn causes vegetation growth. The overall vegetation cover has increased over the last 25 years.
The overall vegetation cover has increased over the last 25 years.
You obviously must be living on a very different planet than the one I’m from!
http://www.climatenewsnetwork.net/disaster-looms-amazon-rainforest-destruction-continues/
SÃO PAULO, 12 December, 2014 − The relentless destruction of Brazil’s Amazon rainforest will endanger the global climate unless it can be stopped and restored, says a new report by a leading climate scientist.
In an eloquent, hard-hitting scientific assessment report entitled The Future Climate of Amazonia, Dr Antonio Donato Nobre, a researcher at Brazil’s National Institute for Space Research (INPE), traces the climatic potential of the world’s greatest remaining rainforest.
Then again, perhaps Dr. Nobre is just another one of those Climate Change Hoax perpetrators getting rich off the vast sums of taxpayer funded research. Oh wait he’s not in the US, oh, the conspiracy is global and it’s really probably a communist plot to overthrow the world!
In case you might be able to put aside your preconceptions for a moment then read the actual report . The people who put it together actually know quite a bit more about this than you seem to.
http://www.ccst.inpe.br/wp-content/uploads/2014/11/The_Future_Climate_of_Amazonia_Report.pdf
Scientists are still trying to reason out the role of CO2 within the global warming theory: At a given temperature, all molecules vibrate from heat. CO2 and many of its cousins happen to get rid of some of their heat by IR radiation. However, Nitrogen and Oxygen, the biggest components of the atmosphere (they make up a significantly greater share of the atmosphere than CO2) can’t do this. So, how do N2 and O2 cool down? Either more slowly than CO2 due to this lack of IR radiation inability or faster than CO2 through collisions (several billion per second). From this, we are able to infer that CO2 is actually a cooling gas, while O2 and N2 are the opposite. Of course, the main problem for the politicians who have decided to involve themselves within the science is that, contrary to CO2, they have no feasible mechanism to regulate atmospheric O2 and N2. As a result, these two gases, as well as some others, barely get any mention within the media whenever the topic of global warming comes up.
Dennis just invented a whole new physics. But much like Disneyland, it’s all pretend.
Care to explain in greater detail? Be sure to also mention what, if any, scientific credentials you have. I personally have a degree in earth systems and suspect I have taken more scientific classes over my six years at the university than anyone else in this forum, but if you want to challenge my understanding of what I know to be the truth as to the mechanisms of molecular interactions within the atmosphere as they relate to the whole global warming hypothesis, then please do go right ahead.
Scientists are still trying to reason out the role of CO2 within the global warming theory:
No Dennis, they aren’t. Svante August Arrhenius had pretty much figured it out back around 1896. The mechanisms are quite well known and understood.
As for the current atmospheric composition of roughly 78% N2 and 20% O2 it has been pretty much that for quite some time.
There is still some speculation as to how we got the N2 but it was probably from meteorite bombardment when the earth was only about a billion years old. As for the O2 that has been a long drawn out process starting back around 3.5 billion years ago when cyano bacteria started photosynthesis. You may be right, too bad there were no politicians back then to pass laws capping O2 production…
See attached graph below:
Bill Nye Aptly Compares Climate Change Denial To Cigarette-Cancer Link Denial « He points out that the consensus on GW is stronger that for cigs and cancer, not that this will help but I thought it a striking fact to point out.
I don’t have a horse in this game – or any game – release carbon, smoke, drive around, froth at the mouth, it doesn’t really matter much.
Ron, these comments from Dennis Melges are so lame that it is hard to presume that even he believes them. Banning him could only remove absurd noise from our shared comment stream.
I’ve concluded that you are either a paid troll or an absolute idiot, maybe both.
I think the “absolute idiot” is the correct diagnosis.
Never attribute to malice that which is adequately explained by stupidity.
Glad you cleared that up for me Ricky Bobby. I was almost starting to get concerned.
Hey Ricky buddy, I think you had a typo in your name there! Although the “r” key is a bit far a away from the “n” key, shouldn’t it have been Moron instead of Monon?
More water is evaporating but it is rising up higher into the upper troposphere where it lingers instead of falling and also becomes another greenhouse gas feedback mechanism.
http://www.dailymail.co.uk/sciencetech/article-2710178/Global-warming-seven-miles-Researchers-say-rising-levels-water-vapour-high-Earths-atmosphere-intensify-effects-climate-change.html
no taxpayer funding for these scientists….hmmm
http://insideclimatenews.org/news/18092015/exxon-confirmed-global-warming-consensus-in-1982-with-in-house-climate-models
“Syria peak oil weakened government’s finances ahead of Arab Spring in 2011”
http://crudeoilpeak.info/syria-peak-oil-weakened-governments-finances-ahead-of-arab-spring-in-2011
http://www.zerohedge.com/news/2015-09-24/shale-partys-over-closed-bond-market-means-restructuring-inevitable
However, the situation is even worse than that, as The Wall Street Journal reports, banks are clashing with regulators over loan reviews that could crimp the flow of new credit to the oil patch.
The dispute is focused on the relatively narrow issue of loans secured by oil and gas companies’ reserves, but it highlights the much broader point of how postcrisis regulation of the financial industry is affecting sectors far from Wall Street.
On one side are the bankers who have been grappling with the plunge in oil prices and the need to shore up billions of dollars in credit extended to the energy industry. On the other are regulators eager to prevent another financial crisis while not knowing what it might be.
Caught in the middle are the small- and medium-size exploration and production companies that rely on credit lines that use their energy reserves as collateral. Banks are now beginning their fall reviews of the quality of that collateral and worry regulators could ding them for making loans the banks think are prudent.
…
“We disagree with the regulators,” said Francis Creighton, executive vice president of government affairs at the Financial Services Roundtable, an industry trade group. “These are good loans, they have a history of performing…we think their analysis is incorrect on this.”
Regulatory bailout cometh.
Can you just see the oil guys and their lenders in the room with the SEC people pointing at the rules, which they all knew about for years, and saying . . . go and sin no more.
The reply will be fists onto tables and “YOU ARE DESTROYING THIS COUNTRY’S ENERGY INDEPENDENCE WITH YOUR BULLSHIT BUREAUCRACY!” Then the Fed monitors in the room make some phone calls and next thing you know the rules are bent.
Watcher Wrote:
“The reply will be fists onto tables and “YOU ARE DESTROYING THIS COUNTRY’S ENERGY INDEPENDENCE WITH YOUR BULLSHIT BUREAUCRACY!” Then the Fed monitors in the room make some phone calls and next thing you know the rules are bent.”
Don’t think so! There is a war on Carbon emissions. Obama is focusing his remaining term on Climate change. New executive orders and new EPA regulations coming to Oil & Gas Industry, to crush domestic production. Here is one:
Texas Frackers Freak Over Proposal to Cut Gas Pollution
http://www.google.com/url?url=http://www.dallasobserver.com/news/texas-frackers-freak-over-proposal-to-cut-gas-pollution-7621011&rct=j&q=&esrc=s&sa=U&ved=0CBwQqQIoADADahUKEwi8oqX4q5PIAhUK1IA
KHdmqCzE&sig2=bjcW6SPcWeHCNjRg2fQHjw&usg=AFQjCNGQzzTRfKtBFVT-4saXZZ7GxUhqUQ
“During a hearing Wednesday at Dallas City Hall, and at hearings in other cities throughout the week, the EPA is taking comments on its new proposal to force frackers to limit how much methane leaks out of their new wells. Under the EPA’s plan, oil and gas companies would have to cut their methane emissions by around 40 percent”
Also:
President Obama Unveils New Power Plant Rules In ‘Clean Power Plan’
http://www.npr.org/sections/thetwo-way/2015/08/03/429044707/president-obama-set-to-unveil-new-power-plant-rules-in-clean-power-plan
“Key elements of the Clean Power Plan include a requirement that would cut the power industry’s carbon pollution by 32 percent below 2005 levels in the next 15 years. ”
“The final version of the EPA’s clean power plan requires somewhat deeper cuts in power plant emissions than a draft version made public a year ago….The final rule does provide a somewhat more flexible timeline for power companies, with the deadline for action pushed back two years to 2022”
[Basically Every new and existing Coal power Plant will need to reduce emissions to 1,400 lbs CO2/MWh] by 2023, which no existing Coal plant can meet. Either they switch over to Carbon capture or shutdown. My guess due to the costs of CCS, most will shutdown. That said, its possible that this rule will be reversed or delayed before 2023. There is no way the US can convert 340 GW of production in about 7 years! The US gets about 32% of its power from Coal, the same amount the new EPA is proposing to reduce emissions by]
For 2015, about 18GW of Coal fired plants will be closed, and for 2016, 20 GW will be closed. I would imagine Electricity prices will start rising between 5% and 12% per year as these plants shutdown. More jobs depending on low electricity prices will be shipped overseas.
There is no way the US can convert 340 GW of production in about 7 years!
Well if that is true than I guess people will just be forced to use a lot less energy. I can think of many ways to accomplish that, of course none of them will maintain BAU. But I do believe that might actually be a good thing in the long run.
Fred Wrote:
“Well if that is true than I guess people will just be forced to use a lot less energy.”
Some people will use less energy, Other in countries that do not see carbon regulation will increase consumption as energy intensive production relocates. I suppose as Western jobs losses mount, there will be falling demand for some production. Although less regulated nations will see a rise in consumerism which may increase domestic consumption (larger middle classes in Asia).
FWIW: Just increase demand on NatGas production, pulling forward another crisis as NatGas production falls.
http://www.bnsf.com/about-bnsf/financial-information/weekly-carload-reports/
BNSF weekly report has the number of petroleum cars about 1600 less than the same week of 2014.
[…] peak oil barrel […]
Methane release in the Arctic:
http://onlinelibrary.wiley.com/doi/10.1002/2015GL065013/abstract
That dreaded positive feed back loop rears its ugly head….
Another 90 million barrels of oil and condensates delivered again today. They better be there or something will go wrong soon.
Same for tomorrow, then the next day, after ten days, 900 mi!!ion barrels will have been consumed in one way or another.
Burning it is the choice that most make. Planting and harvesting crops is the bread and butter of it all, so oil consumption begins there, in keeping with Rudolf Diesel’s dream of using bio-oils for fuel and lubrication, crude oil needs to be removed as a source of fuel from personal transportation choices. In essence, all electric, electric hybrid vehicles, no gasoline available for the car you drive. It’ll be a battery powered automobile. Think kerosene lamps to light bulbs.
Of course, pickup trucks will still have diesel or gasoline engines, farmers will need the power of a diesel fueled engine far more than a technician working on a computer, software won’t grow a cob of corn, John Deere can.
Down in Louisiana, corn growers have 300 bushel corn per acre.
Yields are now three times what the 1950s corn crop would be.
Oil would be the largest contributing factor, those auxiliary inputs make all the difference in the world. Fuel oil, pesticides, herbicides and fertilizers do more than what otherwise would be expected. Don’t count the costs and emissions because they don’t count.
As long as the resource base can provide the food and fiber necessary to support us all, overshoot can last a while before the collapse, which appears to be happening in some areas due to too much conflict. Once oil begins to decrease in availability, it is all she wrote, the nascent stages of collapse will make a mad rush to complete collapse, it will go from ludicrous speed to plaid.
As long as the beer can be brewed and drank in copious amounts, all will be well. Once the beer is gone, you have to hop in your car and drive to the nearest beer depot for some more. ?
Fuel and oil and all the byproducts for agriculture and shipping, electricity for personal transportation. Probably no more commercial airlines to haul people ten thousand miles to stay five nights at a resort on some island in the middle of the Pacific.
Have to begin to conserve the oil, too much is being consumed, waste which can be avoided.
Cut back to 60 million per day, decrease the supply, production, the price will increase. Problem solved. You’ll have your hundred dollar oil quicker than you can say Jack Robinson, a lot of drive-offs and theft of oil too. More than one way to obtain oil, if you can’t buy it, it can be stolen. Hundred dollar oil creates a lot of problems.
At 60 million bpd, it won’t deplete the oil as fast, a win-win. Profitable oil prices and collapse sooner than later. A Catch 22, damned if you do and damned if you don’t. One helluva note.
A problem that persists, the old depletion. After 100 days of consumption, 9000 million barrels, 9 billion barrels are gone, never to return. It’s something to behold.
Caterpillar restructuring and job cuts – Business Insider: On Thursday, the industrial giant announced plans for it to cut as many as 10,000 jobs as part of a restructuring plan in the face of what it called “a convergence of challenging marketplace conditions in key regions and industry sectors — namely in mining and energy.”
Shallow,
on Seeking Alpha there is a new good comment on the article of Michael Filloon:
“Michael, thanks for a great article. Your work makes me think in a different way. Still, I agree with some previous critiques… it might be more accurate to say that larger/improved fracs are extending the period of flush production rather than to say that they lessen decline. I don’t think we have a handle on long term decline at all in this play. When you look at older wells (five or more years), most are below 100 bopd and many are under 40 bopd. These deep complicated wells don’t pay much below 40 bopd and their economic limit may be 25 bopd. So, what meaning does an EUR of 600,000 plus barrels have if the well trickles half its life.” …
Of course the economic limit will very much depend on future oil prices. But the average ND well seems to hit 25 bopd after 10 years or so, having produced about 300 kbo by that time.
It’s actually pretty amazing that the oil price slump came at the worst possible moment for ND operators:
– from the data, it looks as if the sweet spots are starting to run out (this can be seen from the peak in new MB wells which happened in 2012, and the ever greater ratio of TF/MB wells, and the fact that wells are not really getting any better during the last years)
– it came after a major run-up in rigs and new wells during 2012-2014, and the resulting huge cash flow outspend to put money in the ground. The critical price period for all shale wells is the first 1-3 years, given the large initial flow and the fast declines.
So the slump hit exactly when the operators expected to earn their return on their massive recent investment.
I think you got to admire the logic of OPEC 🙂
To illustrate the above point.
Enno, do we have a typical or standard directional drilling plan used by these Bakken developers? Where do they usually kick off from the vertical, and what’s their build rate?
I got no clue Fernando 🙂 I just like to analyze the overall public data which is so nicely provided by ND.
A link to, and excerpt from, one of my previous comments about “Net Export Math” and “Net Cash Flow Math.”
http://peakoilbarrel.com/us-oil-production-finally-starting-to-decline/comment-page-1/#comment-530205
As you know, there is a “Survivor bias” here. One has to consider the wells that are plugged & abandoned, or in a non-producing status prior to being plugged & abandoned, prior to the 10 year mark.
Venezuela update: the bolivar exchange rate is at 757 bolivars per USD. Several agencies have warned hyperinflation will likely exceed 150 to 200 % per year in 2015. The regime continues heavy handed repression. They have driven 20 thousand Colombians out of Venezuela, declared the equivalent of martial law along the Colombian border. The border remains closed.
The Guyana government says they noticed Venezuelan troops making incursions into its territory. They started moving troops into the border areas and called on the UN to stop Venezuelan aggression.
The Maduro regime seems to be seeking an external conflict or war to justify cancelling elections due in December. The problem they face is the enormous advantage the opposition has over Maduro’s party (over 30 % in some polls, a 65 % opposition to 35 % pro Maduro imbalance it too large to overcome by cheating). The regime controls the electronic voting machines and the judiciary, but they seem to be scared to rig a victory when the people know the regime is disliked or hated by a large majority.
I keep hearing about people trying to flee, or planning to flee after the December vote. Quite a few talking heads are warning the international community that Venezuela may face very large and violent disturbances or civil war by late 2015 to early 2016. This in turn could lead to a collapse of oil exports.
The Libyan case history is probably relevant. Recent annual production (total petroleum liquids + other liquids, EIA, millions of barrels per day):
2010: 1.8
2011: 0.5
2012: 1.5
2013: 1.0
2014: 0.5
Incidentally, one can’t help but wonder if what Europe is experiencing in regard to migrants and refugees from the Middle East and North Africa is a preview of what may happen in the Americas if civil unrest/civil war gets much worse in South and Central America. Of course, it’s already happening in the Americas, but my point is that it could get a lot worse.
More fuel to the South America Crisis:
$90B Dollar-Denominated Debt Likely Spells Doom For Petrobras
http://oilprice.com/Latest-Energy-News/World-News/90B-Dollar-Denominated-Debt-Likely-Spells-Doom-For-Petrobras.html
This currency’s collapse is astounding
http://www.cnbc.com/2015/09/23/this-currencys-collapse-is-astounding-trader.html
1. Venezuala, 2. Argentina, 3. Brazil (Three strikes and your out!)
I believe these three S.A. nations “had” the leading economies of the region (Argentina was the #1 in the World about 100 years ago).
Well guess what, the opportunities for niche market and non traditional Brazilian exports are actually looking really good for a change. As for Petrobras, well I wouldn’t be investing in any oil companies anywhere in the world right about now, though I’m sure there are many who might still disagree with me on that point. And while times may be tough, neither Argentina and certainly not Brazil should be compared to Venezuela. Venezuela is an out and out economic basket case. I have a hunch Brazil will survive.
EU chief fears union will COLLAPSE over migrant crisis
http://www.express.co.uk/news/world/607595/Migrant-crisis-EU-lost-control-borders-danger-collapse
Fernando:
Off topic and you may have heard this: Schlumberger has pulled out of the Eurasia deal.
The EIA’s latest Electric Power Monthly was released yesterday. Below is the graph of the output of US solar thermal and solar PV plants since January 2012.
Ron, I think that the planet will be saved. As you know VW screwed with their diesel engines. However, much to my surprise, every victim that has been quoted in the various news media, has stated that the PRIMARY reason that they bought the car in the first place was the outstanding EPA emission results. Personally, I have never met anyone who even knew what their vehicles’ EPA emissions results were, let alone have the testing results be the primary reason for buying a particular vehicle. So, it is good to know that apparently everyone (except me) really is involved and has pollution control foremost in their thoughts.
And here is the monthly electricity generation as a percentage of the total by source. At 139,997 GWh his appears to be a post 2008 record for the monthly amount of electricity generated by natural gas (see table 1.1), unless it gets adjusted downward like the figure for July 2012, which was adjusted downward from 140,202 GWh to 138,863 GWh in later issues of the EPM. For the month of July natural gas generated just slightly more than coal generating more than coal for the second month ever.
Just in case anybody wonders why I am posting this electricity information on a Peak Oil blog, I have been looking back at the data and observing some patterns.
1) Peak US electricity consumption occurs between the months of June and September, ostensibly due primarily high air conditioning loads during these sumer months.
2) Use of NG fired generation also peaked during the same summer months, due to the increased use of gas :peaker plants” to satisfy the increased demand
3) Not really old data, over the past three years solar (thermal but more so PV) has been growing fast and the peak of solar production appears to coincide with the the peak demand.
If it continues to grow at current rates, I see PV eventually being able to take the over role of peak mid day generation from natural gas “peaker plants”. PV with batteries or solar thermal with storage could obviate the need for natural gas “peakers” during the evening hours, after the sun has set but when, electricity loads are still relatively high. I sense that, there is a real possibility that solar may eventually result in a significant dip in the demand for NG during the summer months, when demand for natural gas by utilities has traditionally been at it’s highest.
Natural Gas often comes out of the same holes in the ground that oil does. Nuff said?
Maybe I will beat Alex this week! Smiles
Baker Hughes rig count is out.
http://phx.corporate-ir.net/External.File?item=UGFyZW50SUQ9NTk1NjE4fENoaWxkSUQ9MzA1NDkzfFR5cGU9MQ==&t=1
US Land down 6
GOM up 2
Horizontal down 11
directional up 3
vertical up 4
Permian, Eagle ford and Haynesville down 3 each
Total for shale plays down 14
It appears the horizontal shale plays are dropping, while more conventional wells have a slight increase. Eagles Ford, seems to be in a sustained down turn, as it has been loosing several rigs each week lately.
Baker Hughes Rig Count
Did anyone notice that if you total the Major State Variances above the total comes to a -4, but if you total the Major Basin Variances you get a -14?
Along the lines of my post about US electricity generation further up:
UK DECC announces renewable energy generation record in Q2, 2015; Installed solar PV capacity exceeds 8GW
“This is an increase of 8.6 percentage points when compared to a year earlier. Renewable electricity generation rose by 51.4 per cent in Q2; 2015 compared to a year earlier. Solar PV generation rose by 115 per cent, from 1.5 terawatt hours (TWh) to 3.2 TWh, due to increased capacity, now exceeding 8 gigawatts (GW; “
What bearing might this have on oil?
Plug-In Electric Car Sales In UK Up By 71% in August, Exceeds 1% Market Share
“August is typically one of the slowest month for car sales in the UK, although in relation to previous years it still brings solid growth of some 71% more plug-in electric car registrations (879 total).
Market share of plug-ins stands at 1.11%, which is third highest ever.
In August, approximately 578 registrations were PHEVs and 301 BEVs.”
Absolute numbers are less interesting than the growth trends. Conceivably the confluence of these two trends may eventually have an impact on UK oil demand.
Graphic that should have been attached to the post about UK renewable electricity generation above.
and so now China…..
On Friday, Chinese president Xi Jinping will announce that China will start the world’s largest carbon trading system by 2017, according to a statement released Thursday night by the White House.
http://www.motherjones.com/environment/2015/09/china-cap-and-trade-carbon-xi-obama-agreement
My two cents worth is that if Peak oil really is happening do we really think it would not be hidden from us by the goons. After 26 years in the financial business one thing I know for sure is that everything is managed including the media and most certainly the markets. Deep Capture of regulators is the rule and when things like the IRS scandal come out they are swept under the rug. IMO things are about ready to reach a tipping point and I’m not sure most are ready for what is coming. It would be ironic if at the same time the petro-dollar is on the ropes and business around the globe is collapsing that Peak Oil decided to kick in.
Hi Don,
What is your take from the “financial side” with the debt load building to a tipping point? Any insights how long the merry-go-round will stay spinning?
Thanks
Amazing how hated Trump is now think of how 36 support him and know that is how many hate the GOP. Imagine how well the GOP would do if they earned the respect of those 36 back. checkout saianarchy.com if you going to vote for Donald Trump or Hillary Clinton. we also have the biggest hilary clinton email dump here: http://saianarchy.com/email-leaks, and we expose the excutive ordre made secret by obama here: http://saianarchy.com/executive-order-leaks