A guest post by Ovi at peakoilbarrel
Below are a number of oil (C + C ) production charts for Non-OPEC countries created from data provided by the EIAʼs International Energy Statistics and updated to January 2021. Information from other sources such as OPEC, the STEO and country specific sites such as Russia, Norway and China is used to provide a short term outlook for future output and direction for a few countries and the world.
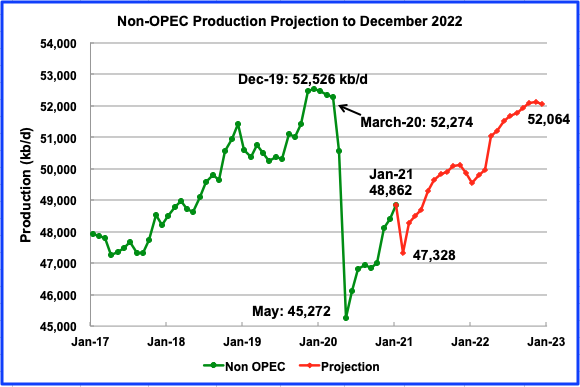
Non-OPEC production continued to climb from the May 2020 low of 45,272 kb/d. January’s output increased by 448 kb/d to 48,862 kb/d from December. The January increase was primarily driven by output increases from Brazil (147 kb/d) and China (164 kb/d). From May 2020 to January 2021, production increased by a total of 3,590 kb/d or an average of close to 450 kb/d/mth.
Using data from the April 2021 STEO, a projection for Non-OPEC output was made to December 2022 (red graph). Output is expected to reach 52,064 kb/d, which is lower than the previous high of December 2019, by close to 500 kb/d. February 2021 output is projected to drop by 1,534 kb/d due to the disruption caused by the major snow storm in the L48 U.S. states.
Ranking Production from NON-OPEC Countries
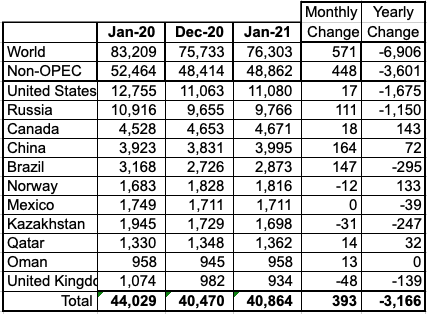
Above are listed the worldʼs 11th largest Non-OPEC producers. They produced 83.6% of the Non-OPEC output in January. On a YoY basis, Non-OPEC production decreased by 3,601 kb/d while on a MoM basis, production increased by 448 kb/d to 48,862 kb/d. World YoY output is down by 6,906 kb/d. As noted above, the January increase was primarily driven by output increases from Brazil (147 kb/d), China (164 kb/d) and Russia (111 kb/d), countries with the largest monthly increases.
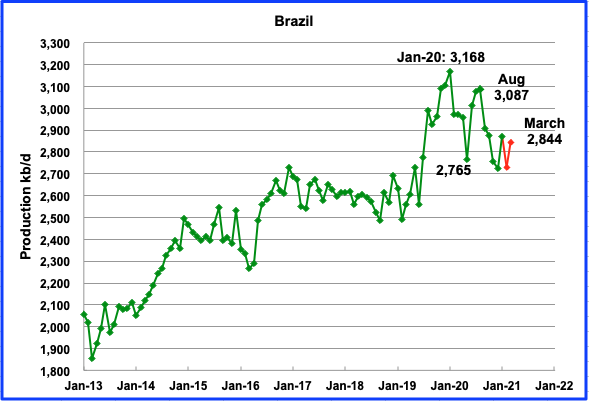
The EIA reported Brazilʼs January production increased by 147 kb/d to 2,873 kb/d.
According to this source February’s output dropped by 8% from January to 2,730 kb/d and then recovered to 2,844 kb/d in March, according to this source (Red Markers).
Covid is a continuing issue on Brazil’s oil platforms according to this source.
“The virus is also hitting output at Petrobras. Production slowed last week at two platforms at the major Marlim Sul oilfield after an outbreak, a branch of the national FUP oil union told Reuters.”
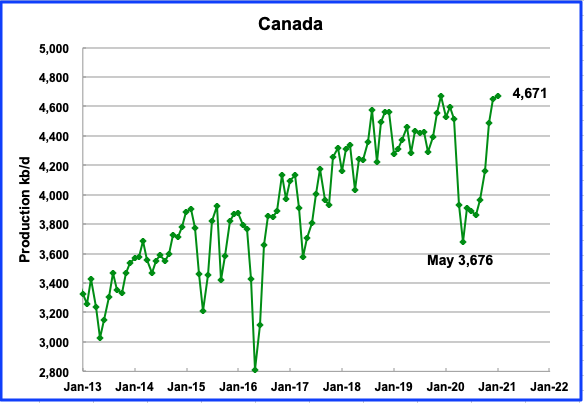
January’s output increased marginally by 18 kb/d to 4,671 kb/d. This is a new record. The EIA’s January output is 192 kb/d lower than the production reported by Canada Energy Regulator (CER). Typically, the difference in output between the EIA and CER is closer to 290 kb/d with CER being higher. Not clear why the gap is lower for January.
Oil exports by rail to the US in January were 195.5 kb/d and decreased to 111.9 kb/d in February.
According to the EIA, imports from Canada remained at steady to record levels.
“Voluntary OPEC production cuts have been contributing to reduced U.S. crude oil imports from OPEC so far in 2021. Comparatively stable U.S. crude oil imports from Canada, however, have been mostly the result of longer-term trends. Between 2005 and 2020, U.S. crude oil imports from OPEC members decreased rapidly, but imports from non-OPEC members remained relatively high. In particular, U.S. crude oil imports from Canada more than doubled to average 3.6 million b/d in 2020, which was more than the combined total of crude oil imports from all other countries.”
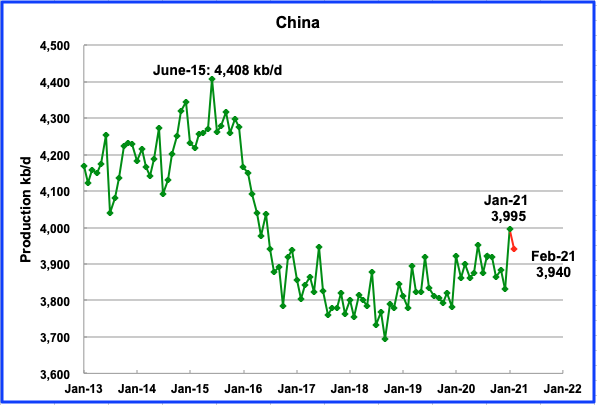
Chinaʼs January output increased by 164 kb/d from December to 3,995 kb/d. This source reported combined crude output for January and February 2021 to be 32.08 million metric tons. Using the EIA January data, February output was estimated to be 3,940 kb/d.
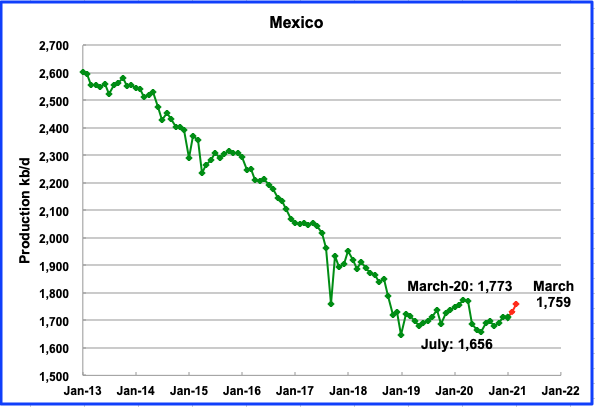
Mexicoʼs production was flat in January at 1,711 kb/d. Data from Pemex shows that March production increased to 1,759 kb/d (Red markers). According to S & P Global, Mexico’s oil production is expected to remain at around 1.7 million b/d for 2021 and 1.75 million b/d for 2022, in spite of the new fields it finds and brings online.
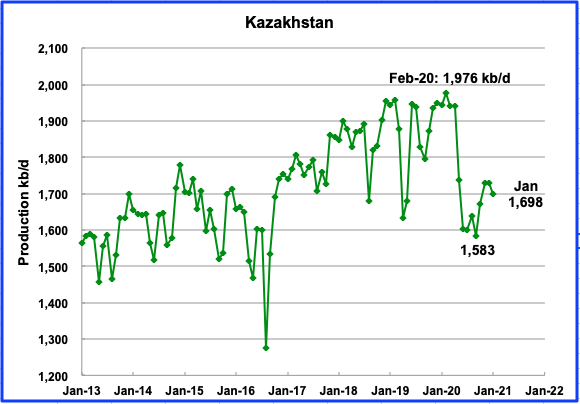
Kazakhstan’s output dropped by 31 kb/d in January to 1,698 kb/d. Their OPEC + partners gave Kazakhstan permission to increase their output in April. According to OPEC, production is expected to increase in February.
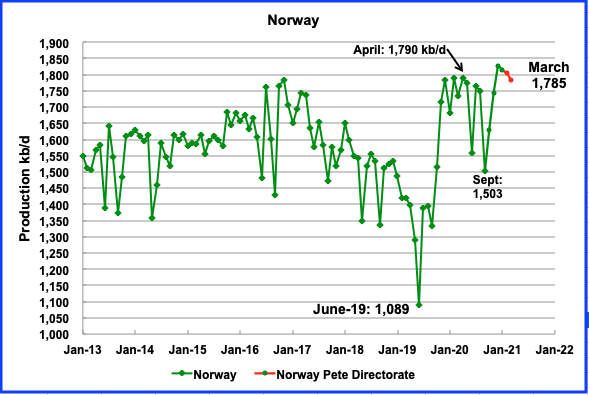
The EIA reported that Norwayʼs January production was 1,816 kb/d, a decrease of 12 kb/d from December. The Norway Petroleum Directorate reported that production in March dropped to 1,785 kb/d.
Norway expects its oil production to increase by 19% by 2024: “Norway eyes 19% oil production increase to 2024 on Sverdrup success, new projects” Crude output is expected to average 2.07 million b/d in 2024 and roughly the same level in 2025.
I wonder if this estimate includes the average decline rate of 150 kb/y that was happening pre Johan Sverdrup in the period November 2016 (1,785 kb/d) to September 2019 (1,332 kb/d).
“State-controlled Equinor said in November Johan Sverdrup output, which has become a major feedstock for Chinese independent refineries, could rise beyond first-phase levels of 500,000 b/d by the middle of this year thanks to increased water injection.“
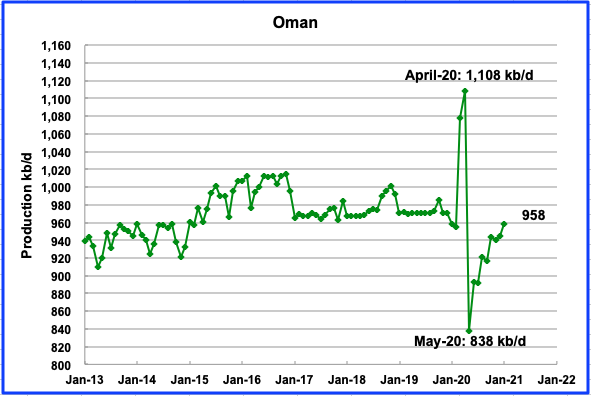
Omanʼs January production increased by 13 kb/d to 958 kb/d.
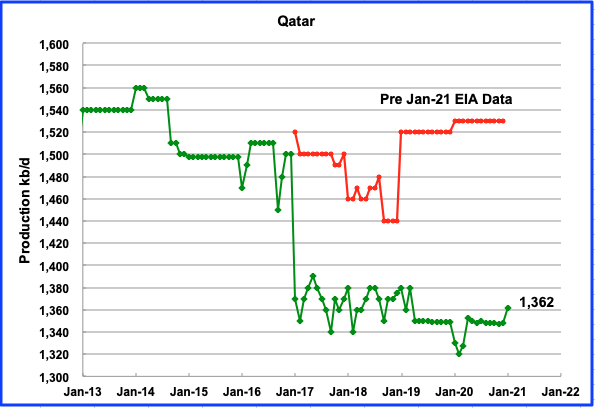
Qatar’s output was drastically revised down by the EIA in its January 2021 report. The red graph represents the EIA’s assessment of Qatar’s production from January 2017 to December 2020 from according to its December report. Clearly they must have a new source for Qatar’s production data. December’s 2020 production of 1,530 kb/d was revised down to 1,348 kb/d in the January report, a decrease of 182 kb/d. January’s output increased by 14 kb/d to 1,362 kb/d.
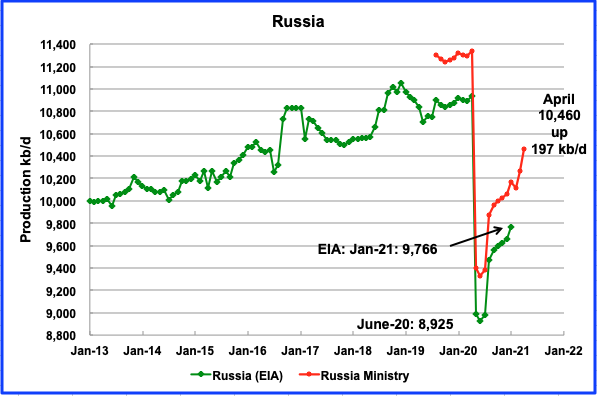
According to the Russian Ministry of Energy, Russian production increased by 197 kb/d in April to 10,460 kb/d. Russia’s OPEC + partners gave Russia permission to increase its production in April by 130 kb/d from the March level of 10,263 kb/d. They exceeded that quota by 67 kb/d.
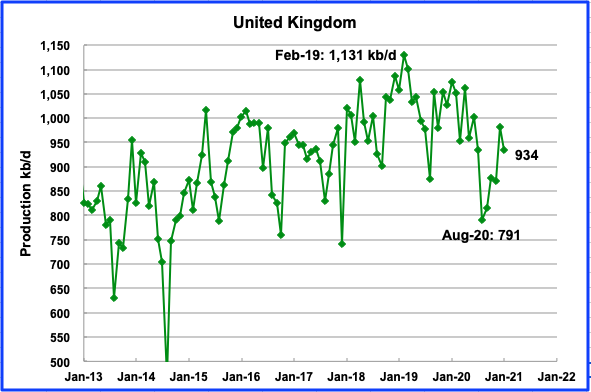
UKʼs production decreased by 58 kb/d in January to 934 kb/d.
According to OPEC: “In 2021, the UK’s oil and gas industry is anticipated to struggle to recover from an investment crunch due to the COVID-19 pandemic and, in the longer term, will have to manage a prolonged decline in output. Hence, some projects have reportedly been deferred, such as the Seagull project, which was deferred to late 2022.
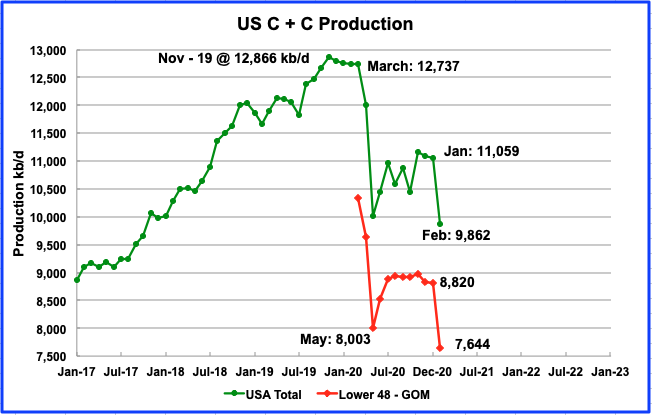
U.S. February production decreased by 1,197 kb/d to 9,862 kb/d from Januaryʼs output of 11,059 kb/d. The decrease was due to the severe winter storm that hit the four US southern states, Texas, New Mexico, Louisiana and Oklahoma.
In the onshore lower 48, production decreased by 1,176 kb/d, red graph. The reported 1,197 kb/d decrease in the US total output contains an additional 20 kb/d drop from the GOM.
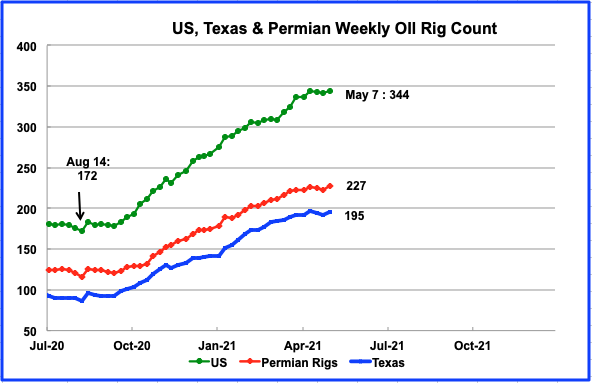
Rig additions continued in the US from the August low of 172 to mid April. For the week of May 7 the rig count increased by 2. Texas and the Permian added 5 while Eagle Ford dropped by 2.
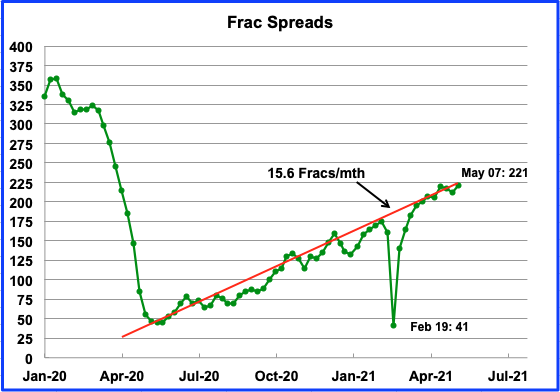
In the week of May 7, 9 frac spreads were added and reached a new recent high of 221. There is no indication of a change or slowing in the rate at which frac spreads are added each month.
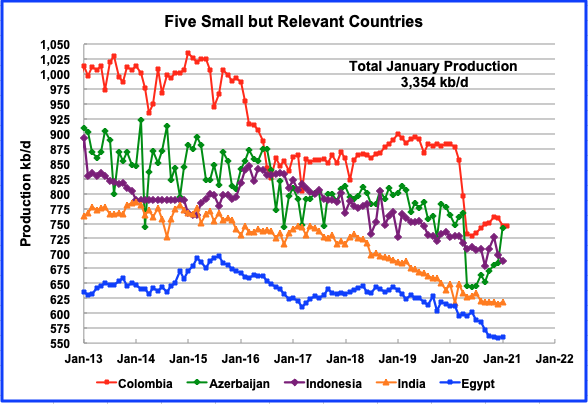
These five countries complete the list of Non-OPEC countries with annual production between 500 kb/d and 1,000 kb/d. Their combined January production was 3,354 kb/d, up by 39 kb/d from Decemberʼs. Azerbaijan’s output appears to be recovering.
World Oil Production Projection
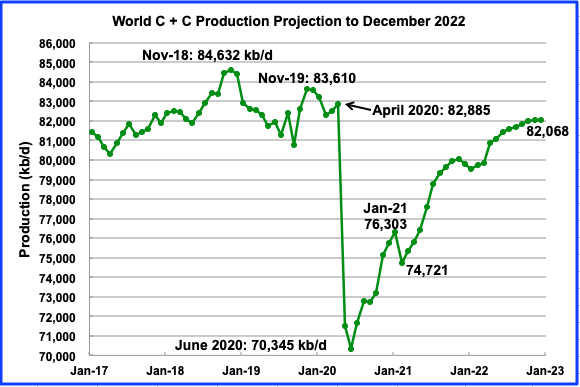
World oil production in January increased by 571 kb/d to 76,303 kb/d according to the EIA. The November 2018 peak was increased by 139 kb/d.
This chart also projects world oil production out to December 2022. It uses the April STEO report along with the International Energy Statistics to make the projection. It projects that world crude production will reach 82,068 kb/d in December 2022. That is 11,723 kb/d above the June 2020 low.
Another interesting fact to note is that the EIA increased the peak production in November 2018 by 139 kb/d. The increase comes primarily from revisions to Saudi Arabia (173 kb/d) and Bahrain (159 kb/d) offset by decreases of 70 kb/d by both Qatar and Kuwait and Uzbekistan (32 kb/d).
101 responses to “January Non-OPEC Oil Production Climbs Again”
Thanks Ovi. Your work is always appreciated.
I don’t understand the numbers in the first chart. It has US production in January 2020 at 10,442 mb/d when I was expecting something near 12,700 mb/d.
SCHINZY
Thank you very much. Glad you are awake. Not sure how it happened but it is fixed. Luckily it was just the whole January 2020 column that was incorrect.
Do we have any inside information on this gasoline pipeline stoppage?
Watcher , this is a what i have .
https://www.reuters.com/technology/colonial-pipeline-halts-all-pipeline-operations-after-cybersecurity-attack-2021-05-08/
Too add ,
https://www.zerohedge.com/technology/clocks-ticking-colonial-pipeline-restart-after-72-hours-it-gets-really-tough
Complexity and connectivity are the Achilles heel of industrial civilization .
Good BBC article
Biden declares state of emergency over fuel cyber-attack https://www.bbc.co.uk/news/business-57050690
Who are the Vendors for the SCADA systems? Rockwell, Honeywell, Siemens? Think twice about public facing gear from publicly listed companies, it’s too costly to be honest about many exploits. I deploy routers from MikroTik, Tools built in to watch connections/traffic live. Simple to re-flash everything if you get suspicious. Lessons learned from the latest exploits of Solarwinds and M$ Exchange is the more you know you realize the wider the net. Blaming nation states for your own stupidity could result TEOTWAWKI. Building fault tolerant systems can reduce downtime, but who holds the keys? Covid wars is now ramping up into I N F R A W A R S
“Complexity and connectivity are the Achilles heel of industrial civilization .”
How about foolish interdependence?
-Using Grid Power for refinery & pipelines
-UL1741 Grid Inter-tie Prevents most Solar Customers from using his own “System”
Fukushima survived the events just fine. The Final outcome was due to loss of power.
Interesting because it comes from Karl Denninger who is a peak oil denier . His take on the pipeline .
https://market-ticker.org/akcs-www?post=242356
Denninger is an idiot. When Obama released his long-form birth certificate, Denninger said it was fake. It was fake because, he said, all the information lined up perfectly in the right place on the pre-printed lines. He said the information would normally be typed in on a typewriter and therefore typewriter lines never line up perfectly with the pre-printed lines. If they do line up, then it must be fake. What a genius the man had to be to figure that out. He was a birther because the damn print was placed correctly on the lines.
The damn fool had apparently never witnessed a secretary filling in a pre-printed form. He obviously had no idea what a typewriter carriage relief lever does. You flip it, the form can now be moved by hand and lined up perfectly, then the carriage relief lever is flipped back again. That’s what the damn leaver is for.
Yields on the US 10 year formed a bullish hammer within consolidation on Friday. Suggests that yields are headed to 2% or above. It suggests that the move higher is now. Higher yields will lead to stronger dollar. Might be the beginning of where price inflation becomes a drag on economy as yields rise on debt. And as long as price inflation continues yields will rise.
Might put a cap on oil price in near future. Maybe we get another $5-$15 rise in oil price before credit blows up due to rise in yields.
As the cost of credit rises due to price inflation. If you borrowed money at rock bottom interest rates and you now have to rollover debt at a higher interest rate that is a problem for corporate USA.
Anyone that doesn’t believe that there will be a huge price to pay for the policy response of Covid-19 is kidding themselves.
Even just on a relative basis. When you expand monetary and fiscal policy by that much in one year. Things tighten on a relative basis as what comes next in the years after is less support.
HHH , the FED will not (cannot) raise interest rates as this will lead to an immediate market meltdown . It will continue jawboning and printing in an effort to kick the can down the road . Prolong the meltdown , that is all it can do . Inflation in the near term because of supply chain constraints and free money , deflation after the meltdown .
Raise interest rates , stronger dollar , outflow of USD from the Eurodollar markets to the US . Result , dollar shortage in the rest of the world making it difficult to service USD denominated debt and higher domestic cost for all imports for the ROW . Result , inflation , social unrest , sovereign defaults and collapse of the financial system . The FED cannot risk this . The FED is now between ” a rock and a hard place ” . Limited choice . Where will the crisis start ? Earlier I thought it would start in the currency markets , now I think it will start with the crash in the cryptocurrency sector . Fake currency (USD or better FRN) to buy another fake (crypto) currency . What could go wrong ?
FRN is Federal Reserve Note. All currency is printed by the FED and not by the Treasury .
https://www.rigzone.com/news/wire/argentina_shale_producers_contend_with_patagonia_blockades-28-apr-2021-165287-article/
Vaca Muerta news. Health workers blockading roads into the shale region and hitting natgas output, as winter arrives.
All of Latin America has a tough few years ahead until Covid gets under control. Protests against political corruption and inequality were raging prior to the economic meltdown from Covid. Now things are much worse. Columbia is seeing raging protests for ten days now. Hard to see how oil production can grow in the region for the foreseeable future.
https://www.msn.com/en-us/news/world/explainer-bloody-protests-in-colombia-leave-at-least-26-dead/ar-BB1gvqdl
Mike S on shale oil wells are turning into shale gas wells and GOR ratio . Another nail for shale .
https://www.oilystuffblog.com/forum/forum-stuff/is-light-tight-oil-getting-lighter
Thanks for this link HH. This is a real bombshell!
HH, from your link:
WTI compliant production is now just 8% from New Mexico (from 31% three years ago) and just 7% in the Bakken, where GOR has nearly doubled over the latest months. There is less ‘real’ WTI crude oil as the condensate and super light factions are soaring.
Why? Why would shale production get lighter and lighter? What has changed? My guess is the sweet spots, where the heavier stuff is, have just petered out. So now they are out in the shale riff-raff area, so to speak, where the lighter stuff is.
Does anyone else have a different explination?
Reservoirs reaching “bubble point”. As reservoir pressure decreases gas expansion takes over.
You are describing much larger conventional reservoirs. Shale is a different animal altogether. Conventional reservoirs have many wells pumping from one reservoir. In tight oil source rock reservoirs, each well has its own tiny reservoir, an area where only that well pumps from.
The new shale well reservoirs are just finding much higher gas to oil ratios in each new well, in each new tiny reservoir dedicated to that well only. It is not because they have reached their “bubble point”.
Thanks for the reply Ron,
In your original post your question was “Does anyone else have a different explination[sic]?”
So I offered one.
The jury is still out, there is a lot of discussion about Dmin, GOR, multi-phase reservoirs and phase behavior in nano-perm reservoirs.
Not sure I can totally agree with your statement “In tight oil source rock reservoirs, each well has its own tiny reservoir, an area where only that well pumps from.” as there is a great deal of chatter about interference particularly in the “child well” scenario.
I think we may be able to find common ground in that nano-perm reservoirs deeply delay any possible gas expansion, it’s a mobility issue. In fact , I believe that to some extent nano-perm reservoirs can become “gas locked” for some time , hence oil production declines as GOR does not significantly increase, but eventually the mobility ratio takes over and GOR inevitably increases. It has taken many years, but my opinion is we are reaching that point.
At any rate, we I believe we can agree that GOR is rising and that is not good for shale wells.
Your original post was, as you say, “MY GUESS” that the good stuff has petered out and now the lesser gas-prone acreage is being drilled, with which I cannot disagree. Again, just offering my opinion pursuant to your request.
Love the blog, been a lurker since the Oil Drum days and read the blog daily.
JAM
JAM, the terminology you are using, “bubble point”. only applies to conventional reservoirs. I don’t know what a “nano-perm” reservoir is. I Googled it and got nothing about reservoirs at all.
Probably means nanno darcy perm, which is a valid description of the super low perms in the resource plays.
JA Mike, goodonya. Of course the bubble point phenomena is not limited to conventional reservoirs:
https://www.linkedin.com/pulse/controversial-theory-proven-valid-bubble-point-death-rages-lapierre/
Ron, the credit is for Mike S , he always hits a homer . Their have been two very misleading definitions that have led to misreporting or say smoke and mirrors .
1 . BOEPD . This means nothing and it means everything .
2. Shifting the goalposts for what is oil . From crude to C and C and on too all liquids . What next methane farts from cows ? 🙂
Hole in head,
GOR increases for tight oil wells as they get old. During the pandemic fewer tight oil have been completed and as expected,
GOR has increased. I am surprised that Mike is surprised by this. It was expected, based on completion rate.
Hole in head,
US has used crude plus condensate since the EIA was created. I never use boepd for tight oil scenarios, only barrels of crude plus condensate. There was a time when lighter oil such as Tapis received a premium price as refining costs are low and the percentage of high value fuel like gasoline is high.
Dennis ,
1. BOEPD ; It is not your fault . I just pointed out that it creates confusion plus smoke and mirrors . For a layman would be difficult to discern between BOPD and BOEPD . I am not questioning your wor
2. Post Mike S ; No, obviously Mike S is not surprised and neither am I or others who follow peak oil . We know that as fields age the depletion rate, decline rate, GOR, WOR will increase . What is important is that instead of generic terms like ” lot ” and ” little” he has given figures that exhibit the depth of the problem . I had in earlier posts clearly stated that GOR and WOR problem is underestimated , just like economic damage by Covid .
3. Some thought . In light of the info that LTOS has provided about children wells, is the rig count relevant ? Would not using rigs to extract oil via children wells be an exercise of ” shifting money from your left pocket to your right pocket ” . All comments welcome .
P.S : In 15 years I have not met a single individual who knows the difference between BOPD and BOEPD .
Ron,
As fewer tight oil wells get completed GOR increases and the overall product becomes lighter. As tight oil wells age the GOR increases, this has always beeb true. The difference is that typically completed wells have increased over time, recently the reverse has been true, so a higher percentage of total output comes from older wells with higher GOR and the GOR for the basin spikes, as that happens API gravity increases and the average product is lighter.
Good point Dennis.
No, not good points. Its just “statistical” bullshit and word salad. I suggest folks go back, one more time, and read LTO Survivor’s real life explanations for why well productivity is declining in the Permian. The point in my observations posted on my personal blog was that GOR is going up…in earlier vintage, NEW children wells because of over drilling and there appears to be a direct correlation in that to lighter oils and more abundant NGL’s that are not now worth as much. I don’t “say” I use shaleprofile.com, I actually use it, like the graphic below.
Mike,
I used the same graph, there is little evidence that average new well productivity is decreasing based on the public information at the shale profile blog.
I do not have access to the paid site.
Despite anecdotal evidence, does shale profile show significant decrease in average well productivity?
The last review by Enno showed a very small decrease when normalized by output per lateral foot.
Mike,
Notice the GOR for average well over time in top panel has not changed much over time and also notice that as any tight oil well ages the GOR increases. Also notice that fewer wells were completed in 2020. A little thinking leads to a simple explanation for GOR increase in bottom panel.
As oil prices go up and completion rate follows, GOR for the Permian basin will decrease.
mike,
From
https://shaleprofile.com/blog/permian/permian-update-through-december-2020/
Here is a chart including all wells completed since 2010 in Permian basin.
For my model scenario for 2010 to 2030, GOR increases from about 3.4 in 2019 (12 month centered average) to about 3.9 in 2025 and to 4.15 in 2030. It is expected that GOR will increase over time especially as completion rate decreases (starting in 2031 in my scenario where oil prices are flat at $75/bo (in 2019 US$) from 2022 to 2040.
Ron,
… always beeb true, should be … always been true in my comment above.
Does this mean that the long tail in the profile of shale wells consists mostly of natural gas, condensate, and natural gas liquids? If so, long term US oil production estimates could be significantly overestimated.
Frugal,
No it does not imply that. The scenarios I do are based on C+C output only, the economics are based on all fossil fuel produced (including natural gas at $1.25/MCF and NGL at 25% of crude price per barrel) the natural gas and NGL assumptions are quite conservative relative to actual prices. Recent prices for natural gas have been about $2.80/ MCF, and NGL is priced at more like 50 to 60% of the price of WTI crude.
My estimates of tight oil output includes only C plus C.
From shaleprofile.com
https://shaleprofile.com/blog/permian/permian-update-through-december-2020/
There is a great chart showing that Permian well productivity per 1000 lateral feet has decreased since 2016, this data cannot be downloaded without a subscription. I use well count and output data that shaleprofile provides for free.
Note the decrease in productivity over the past 4 to 5 years is not very large, and average productivity is still much higher than 2015 and earlier.
Click on chart for larger view or go to oroginal shaleprofile post for higher resolution image.
This is true
LTOS , oh la la la . :-0
Two months ago ” semi conductors” were the new oil . Today “copper” is the new oil . Sad but we are running out of old and new oil . Oil is the master resource .
https://www.zerohedge.com/commodities/record-highs-copper-new-oil-could-be-double-here
It’s all about Battery eChem.
Wonder if there is enough Cobalt to use the Nickel for High Energy EV Batteries? Perhaps LFP eChem will overtake Nickel Oxide for EV next year.
Cobalt which is a NeuroToxin is not even on the RoHS list. https://www.rohsguide.com/ Makes Crude look Green.
According to Rystad, Big Oil runs out of reserves in 15 years due to cuts in Capex:
https://oilprice.com/Energy/Energy-General/Big-Oil-Is-In-Desperate-Need-Of-New-Discoveries.html
Stephen , I would cut that by 50% . 7 yrs 6mths . Why ? Reserves do not have to go zero to run out of economical oil . Just like 80% of our body is water , loose 25/30% and death beckons . Ask anyone who has survived cholera .
I think I will go out on a limb ,make it 5 years . The world will be in panic mode by then even if their is pumpable oil .
Thanks for the link Stephen. The article was originally published in the Oil & Gas Journal so it should be taken seriously.
Dwindling reserves
Massive impairment charges saw Big Oil’s proven reserves drop by 13 billion boe, good for ~15% of its stock levels in the ground, last year. Rystad now says that the remaining reserves are set to run out in less than 15 years, unless Big Oil makes more commercial discoveries quickly.
The main culprit: Rapidly shrinking exploration investments.
Global oil and gas companies cut their capex by a staggering 34% in 2020 in response to shrinking demand and investors growing wary of persistently poor returns by the sector.
The trend shows no signs of moderating: First quarter discoveries totaled 1.2 billion boe, the lowest in 7 years with successful wildcats only yielding modest-sized finds as per Rystad.
And from that same article, Exxon Mobil says it will hold production at their 2020 level through 2025.
During the company’s 2021 Investor Day, CEO Darren Woods outlined the company’s energy transition strategy, including plans to trim production growth and boost cash flows in a bid to support a growing dividend. Exxon revealed that it plans to hold production flat from 2020 levels through 2025 at 3.7M boe/day, good for a 26% cut from the 5M boe/day estimate for 2025 it released just a year ago.
In other words, it’s going to be really hard for Big Oil to continue with business as usual despite an oil price recovery.
A gas run in the USA – the hacked pipeline problem worsens:
https://www.zerohedge.com/commodities/gas-run-has-begun-fuel-stations-run-dry-amid-hacked-pipeline
The pipeline is still not running on full capacity at the moment.
According to OPEC MOMR, OPEC output was 25.08 mb/d in April. Furthermore, call on Opec is projected to rise to 29.54 mb/d in the fourth quarter.
29.54 – 25.08 = 4.46
We will soon find out how much sustained spare capacity there is…
Pollux,
Doubt it will be a problem, though OPEC is likely overestimating nonOPEC output, so more than 5.5 Mbpd maybe needed by 2022Q2, then we may see oil prices spike, depends on pandemic and demand.
Worldwide spare capacity is highly suspect. It will take ever increasing amounts to capital and much higher product prices to preserve our way of life(good or bad depending on your point of view) as we know it today.
Our lifting costs have went up considerably since last year.
One example is electric motors. Those have a decent amount of copper in them. There have been two price increases this year.
It didn’t pay to rewind them. Now it does again. We mostly use 3 and 5 HP electric motors on our pumping units, which is another example of our small footprint.
Of course, getting them rewound isn’t easy to do. Two men doing that in the county, both in their late 50’s. They need more help, as does everyone. Huge labor shortage here.
Shallow sand,
Would think it is easier to take at $60/bo, rather than $40. Hope things are going well.
LTO survivor,
My guess is that OPEC and Russia can bring output back to 2018 average levels when there is demand. How high do you think prices need to be, my guess is you believe $85/bo is needed, if demand rebounds as fast as IEA expects and supply is inadequate we will see $85/bo in short order, within 6 months of supply constraints becoming obvious, probably less than 6 months.
LTO survivor,
Yes OPEC spare capacity is likely overstated. I use actual production that has been achieved as recently as 2018 when OPEC may have been producing at capacity, I also focus on 12 month average output as I believe that is a better metric. When the World peaked in 2018 US output was about 11.2 Mbpd for 12 month average. So we may be able to reach previous peak for world imo.
Just noticed the small difference between Nov 2018 and Nov 2019 only 20 kbpd, future revisions might change peak date for monthly output.
Dennis
If you are referring to the world chart. There is still a 1 Mb/d difference between 2018 and 2019.
Yeah, I get 1,022 kb/d
Nov-18 ……… 84,632
Nov-19 ……… 83,610
Difference .. -1,022
Correct, I misread chart.
A reminder from yesteryear. Shale has always had suspect API mixture. Some years ago the chief honcho in NoDak stomped his feet and insisted Bakken shale oil had the same API as WTI. 39.something.
Then times changed. Accumulation at Cushing of oil from Bakken and Permian began to quietly create pressure to change the definition of WTI’s API. And then it happened. Assays began changing the definition of WTI. Latest Platts blahblah says 41.4.
Similarly, or maybe in alignment with this, the constituent yields have been suspect. “Diesel poor”. More foot stomping. There was also an issue of vapor pressures and exploding train cars. I recall a specific Assay from . . . some company I’ve forgotten, starts with an M (Marathon?). . . they rushed an assay out because some doods were testifying in Congress about the exploding train cars and the new assay announced all was well and no need to shut off shale.
Moral of the story is transition of shale liquid up the API spectrum is nothing new.
“The Texas Independent Producers & Royalty Owners Association has welcomed the passage of a new bill, which seeks to prohibit companies that divest from, boycott, or sanction the fossil fuel industry from doing business with the state of Texas. “
Time for Elon to relocate Gigafactory 5 from Austin to Mexico 🙂
It is very interesting/amusing to see the panic from the East Coast elites regarding the unavalilibility of dirty climate changing fossil fuels for their way of life. A world without enough fossil fuel will be a very dimly lit world. Depletion never sleeps and taking capital away from the industry will only hasten the dislocations caused by a lack of hydrocarbons at an affordable price.
I agree that it will be very disagreable. And Matthieu Auzanneau, head of The shift project, says that while it is not about reducing carbon dioxide emissions to mitigate future global warming, Mad Max is in the sweeping vehicle, to name the social and economic disadvantages linked to latent oil shortages, which are inevitable. He and others are advocating a kind of direct democracy to give people a choice of what will be removed to save energy for other things to improve the social acceptability of energy austerity. Antidepressants have a bright future ahead of them.
I recommend regenerative agriculture rather than antidepressants. See https://www.ted.com/talks/johann_hari_this_could_be_why_you_re_depressed_or_anxious
and
https://www.oneearth.org/regenerative-agriculture-and-food-systems/?mc_cid=5301af7f2d&mc_eid=6d08de598c
Schinzy , I recommend spending time with friends Johnnie Walker and Jack Daniels . 🙂
“Depletion never sleeps and taking capital away from the industry will only ,,,”
Who took the capital away?
I thought the lack of investment in future projects is purely an oil industry decision made by the guys in the big buildings in Dallas and Houston, and other such places.
There’s also the fact that when you have less income from sales, you have less cash to invest in oilfield exploration and development. As far as I know, that’s the current problem of shale oil as the different companies did reduce their investment (I read that the companies had reduced the share of their investments from 120% to 80% of their cashflow). Beyond this, oil companies are no longer able to find more than half of what is consumed annually in the world for the past 15 or 20 years, despite spending for this hundreds of billions of dollars on oil research each year. That’s a geological problem. And to avoid the crash of the corporation, the guys in the big buildings decide to invest in new activities. That’s the logic of BP and RDS.
Yeah, and you didn’t even mention OPM, other people’s money. Most of these companies are heavily leveraged. And when OPM dries up they are out of business. That’s why they are filing for bankruptcy. They cannot find any “greater fools” to give them more money when they have lost that of their current bondholders.
I think a resurgence of oil exploration and known field development will occur in a few years, as global demand fully recovers and the diminished investment over the past few years begins to show up in the form of poor supply outlook.
Some people think demand won’t recover (H in Head for example), as the global economy enters terminal depression.
I suppose that is possible, but is not the most likely scenario- yet anyway.
And the replacement of oil with electricity for transportation will not happen quickly enough to prevent a liquid fuel relative shortage in this decade. Deployment/replacement is too slow.
With this scenario in mind I expect to see the price of oil considerably higher, enough to spark another round of eager E &P in this decade.
Hickory,
I agree with your assessment. Possible we see oil prices at $80 to $100/bo (Brent in 2020 US$) by 2023 or 2024, imo.
“Progress in vaccinating the world against COVID-19 means the world’s economic recovery and demand for oil will outpace the output of top producers, the International Energy Agency (IEA) said on Wednesday “The anticipated supply growth through the rest of this year comes nowhere close to matching our forecast for significantly stronger demand beyond the second quarter,”
https://daily.energybulletin.org/2021/05/iea-sees-oil-demand-recovery-outpacing-growth-in-supply/
HOLE IN HEAD
IGNORED
05/07/2021 at 12:24 am
Demand and supply issues . I do not see any pickup in demand for atleast 2021 . A simple analysis :
Demand side ;
Latin and Central America ; No chance . Argentina, Venezuela , Ecuador, Chile, Peru ,Colombia etc are all broke . Brazil is epicentre of Covid .
Europe : Double dip recession . All major economies have extended their income support programs till September . Germany till end of December . Spain , France , Italy , Greece have 20% of GDP from tourism . Not coming back . Same for UK .
Africa : Does not count .
Middle East ; Yes , the high oil prices will help the sovereigns , but only to the extent that they will not be digging a deeper hole than they are in .
India : Covid Collapse . Second wave will probably peak in a fortnight and a third wave is expected in October . All traffic in and out is closed .
Myanmar thru Cambodia ; All in limited or extensive lockdown as the Indian variant has travelled into this region .
Australia : Self isolation and now they picked up a fight with their biggest trading partner China .
New Zealand : Same as Australia minus the fight with China .
Japan : Lockdown 3 in action . More than 50 % chance that Olympics will be cancelled .
China : If the trading partners are in lockdown then China is also in lockdown . Oil import was down by 11% in April .
USA : Weak recovery and even this will decline once the stimulus checks effect wears off .
Supply :
All countries are past peak ( no one is going to acknowledge it ) . In the last 10 years all growth has come from shale and that party is over .
So now we are in a position where there is no pickup in demand and no growth in supply . Checkmate .
Collateral damage of Covid :
https://www.argusmedia.com/en/news/2210740-lng-vessels-diverted-from-india-as-covid-hits-demand
Weak recovery in USA
https://zensecondlife.blogspot.com/2021/05/all-signs-point-to-weak-recovery.html
China imports
https://oilprice.com/Energy/Crude-Oil/Chinese-Oil-Imports-Dropped-11-In-April.html
Third wave covid
https://www.theguardian.com/world/2021/may/06/covid-third-wave-inevitable-in-india-say-health-experts
Only the facts , gentlemen . Since this post , Israel and Palestine fighting , colonial pipeline hack and inflation at 4.2 % . Wait a few months when the ” pent up demand” narrative cracks . Just for your info the Indian variant of Covid is now in 44 countries as per WHO . Hope is not a strategy .
IMF has different expectation
https://www.imf.org/en/Publications/WEO/Issues/2021/03/23/world-economic-outlook-april-2021
economic growth at market exchange rates in chart below (click image for larger view.)
Dennis,
I wouldn’t put too much stock into any institutional forecasting and projections. The economic environment and the world in general is in uncharted territory.
So as we always say no one knows what will happen next.
Dennis , my opinion about IMF and WB is known . Bullshit crap . These are dumping ground for failed politicians and bureaucrats to earn hefty salaries and pensions at taxpayer expense . Checkout .
Iron Mike,
Yes nobody knows what will happen, not Hole in head, you, me, or IMF, that is simply their baseline projection, odds of correctness is zero.
Direct link to IEA oil market report for May 2021, summary below
https://www.iea.org/reports/oil-market-report-may-2021
Hole in Head.
Thats a good summary of the why one could believe that the oil demand won’t pick up for 2021. I could add some more reasons, but you have done a good job of it.
But the next year or two thereafter the world economy has a strong chance of oil demand recovery to pre-covid levels, thinks I.
Of course there are two many wildcards in the supply/demand equation to know how things will settle. The unraveling/collapse of the financial system is the one that seems to be the biggest threat, and that could happen any day, or never. I’d be a liar to say that I understood how it it all works, or doesn’t work. Not my line of work or natural understanding.
Since everybody likes predicting and it is cheap and non threading i though i should show you a new chart I have put together from the latest STEO. It is their supply/demand outlook for All Liquids out to 2022. I have subtracted the demand/supply numbers to show the net balance.
According to the STEO we are in a net supply deficit up to July 2021 and then it bounces back and forth out to December 2022. Overall from July 2021 to December 2022, it looks like there is a net deficit. So if US output does not pick up after July 2021, we could see a slow tightening supply market and a gradually rising oil price.
Who wants to bet that the EIA STEO crew has got it right. I hope they do.
Double click on picture to make it bigger,
Ovi , I am a skeptic as far as official data or projections are concerned . Read this and you will understand why . The problem is this is all what we have to base and work on for decision making . GIGO .
https://www.zerohedge.com/markets/hubris-backing-forecasts-should-be-great-concern-not-comfort
Suggestion ; A new movement is needed MDGA ( Make Data Great Again ) . 🙂
HH
No reason to be wary of official models. Just because they are official doesn’t make them right or wrong. I take it all with a grain of salt. In this case I generally agree that the supply demand situation will tighten in the second half of 2022 and going forward, provided things improve in India and US output doesn’t takeoff.
The EIA personnel are constantly being asked for projections by the politicians so they develop a model into which they can plug numbers. That is the best they can do. The outcome depends on the level of knowledge of the person putting in the numbers.
Luckily next month they can update their models and everybody forgets about the previous prediction. I will be watching the December 2022 number and watch how it changes with time. Will it shrink or grow. The change is probably a better indicator of the direction things will be taking.
This comment was copied over by someone at Seeking Alpha, except that Anonymous left out the first paragraph.
From IEA:
OECD industry stocks fell by 25 mb to 2 951 mb in March, reducing the overhang versus the 2016-2020 average to a marginal 1.7 mb.
April data for the US, Europe and Japan show that industry stocks fell by a combined 5.8 mb in total, led by crude, NGLs and feedstocks in the US.
So stock levels are currently (probably) below 2016-2020 average.
IEA sees major oil demand rebound of 6.5 million b/d between Q1 and end-2021
https://www.spglobal.com/platts/en/market-insights/latest-news/oil/051221-iea-sees-major-oil-demand-rebound-of-65-million-bd-between-q1-and-end-2021
“London — The International Energy Agency on May 12 forecast a major rebound in oil demand of some 6.5 million b/d between the first quarter and the end of 2021, and said likely supply growth, by the OPEC+ group and others, would be “nowhere close” to the expected demand increase.”
The cat is out of the bag…
System problem . Refinery will decrease utilisation capacity as it has run out of storage space at the same time will
import diesel to meet shortfall . This is a universal problem now . What to do with the jet fuel and other components if all you can sell is gasoline and diesel .
https://indianexpress.com/article/business/commodities/facing-low-margins-demand-yorker-refiners-reduce-run-rate-7312761/
Unintended consequences .
https://www.spglobal.com/platts/en/market-insights/latest-news/oil/051321-waf-crude-sellers-scramble-for-buyers-as-indian-refiners-step-back
Few Signs of Recovery for U.S. Oil Production, OPEC Says
By David Hodari Updated May 11, 2021 5:12 pm ET
American oil production is set to drop again this year, with the shale industry’s output showing few signs of recovery despite a broader pickup in economic activity, the Organization of the Petroleum Exporting Countries said Tuesday.
In its closely watched monthly market report, OPEC cut its forecast for the amount it expects production from its noncartel counterparts to increase in 2021 by 200,000 barrels a day to 700,000.
Canada, Norway, Brazil, and China will drive that overall increase, but persistently low capital expenditure and the unexpected winter storm that Texas suffered in February mean U.S. supply is expected to fall by 100,000 barrels a day this year after dropping 800,000 barrels a day last year, the cartel said.
Despite its forecast for a rise in supply from outside the cartel this year, OPEC said in its report that “uncertainties persist particularly with regard to levels of investment which is expected to determine the non-OPEC supply outlook for the years to come.”
Oil prices swung between small gains and losses before closing slightly higher on Tuesday as traders weighed signals that the Colonial pipeline—hit last week by a ransomware attack that threatened its ability to supply oil products to the U.S. East Coast—could have most or all of its regular service restored by the end of this week.
The rest of the article is behind a Wall Street Journal pay wall.
Ron,
I also expect US output will be lower in 2021 than in 2020 for average annual output and US peak will be 2019 unless tight oil ramps quickly in 2022 and 2023 in response to high oil prices (more than $80/bo in 2020 US$). I do think it likely that US output can return to the 2018 average level of 11 Mbpd.
Ron , the BS crap “Canada, Norway, Brazil, and China will drive that overall increase, but persistently low capital expenditure and the unexpected winter storm that Texas suffered in February mean U.S. supply is expected to fall by 100,000 barrels a day this year after dropping 800,000 barrels a day last year, the cartel said. ”
Canada : Pipeline issues plus CC issues cannot increase .
Norway : New fields just enough to cover decline rates . No increase or marginal .
Brazil : Manpower not reporting because of Covid . Most production is salt basin offshore , difficult to ramp up .
China : ???? What the heck ? Does an increase in local output in the world’s largest importer really count .?
Mr Hadari is putting on his thinking cap .
HH
In the post under Norway it states
“Norway expects its oil production to increase by 19% by 2024: “Norway eyes 19% oil production increase to 2024 on Sverdrup success, new projects” Crude output is expected to average 2.07 million b/d in 2024 and roughly the same level in 2025.”
This is a well explored field and their numbers should be pretty accurate. As I note after that, does their projection include decline.
As for Canada, the big guys don’t need exploration money, it’s more maintenance and capital and they had blow away numbers for Q1. They are paying down debt, buying back shares and paying their dividend. At this time pipelines into the US are not an issue unless they are shut down. The Trans Mountain pipeline has cleared most legal hurdles and is expected to be in operation by 2023. In terms of increasing production, I think a reasonable number to use is 100,000 b/d/yr, primarily oil sands for about five years. I think
Ron
The full article can be looked at here.
https://www.morningstar.com/news/dow-jones/202105116151/little-sign-of-post-pandemic-recovery-for-us-oil-production-opec-says
The OPEC Monthly Oil Market Report said the world oil supply fell by 150,000 barrels per day in April.
World oil supply
Preliminary data indicates that global liquids production in April decreased by 0.15 mb/d to average
93.06 mb/d compared with the previous month, and was lower by 6.45 mb/d y-o-y.
While the IEA Oil Market Report – May 2021 sais the world oil supply rose by 330,000 barrels per day.
World oil supply rose 330 kb/d to 93.4 mb/d in April and will increase further in May as the OPEC+ alliance continues to ease output cuts. Based on the current agreement, global oil production is set to grow by 3.8 mb/d from April to December. For 2021 as a whole, world oil production expands by 1.4 mb/d year-on-year versus a collapse of 6.6 mb/d in 2020. Canada leads non-OPEC+ with growth of 340 kb/d while the US is set to contract by a further 160 kb/d.
That’s a difference of just under half a million barrels per day, (480,000 bpd). That’s a huge difference. Which one should we believe? Which organization has the most credibility?
If the OPEC report is correct, then they will postpone the increase in their own production, which will suit some of them with their own decrease in production. What would be interesting is the detail of the increase / decrease in production. Without it, we can argue for weeks.
Enno Peters latest North Dakota data.
Shale Profile
Despite the March uptick, the outlook is not good for tight oil production in the state, with only 14 rigs running (source: Baker Hughes). This can be best viewed in our Supply Projection dashboard:
Tight oil outlook in North Dakota, based on the current rig count and well/rig productivity.
I cannot post the graph, file too large, but Enno, based on the current rig count and well/rig productivity, is predicting a continual decline in North Dakota oil production. His graph shows North Dakota production dropping to approximately 900,000 barrels per day this year.
hence, a drop of 100 kb/d to the end of 2021, just for North Dakota.
JFF , my post ” So now we are in a position where there is no pickup in demand and no growth in supply . Checkmate .”
Now in ,
https://www.zerohedge.com/economics/nfib-data-says-its-only-economic-recovery
A rebound is not recovery . If with trillions in printed money the system cannot get to “even” status then there can be no growth in demand and at the same time depletion, decline and GOR ,WOR are not sleeping. The world is caught between a rock and a hard place . Let us see who wins .
Underestimating the Covid damage .
https://www.energyinfrapost.com/platts-cuts-indias-2021-oil-demand-by-28-sees-crude-topping-70/
An interesting one here
THE BAKKEN, A SNAPSHOT FROM 40 000 FEET AS OF END 2020
https://runelikvern.com/2021/05/10/the-bakken-a-snapshot-from-40-000-feet-as-of-end-2020/
Survivalist , excellent find . Muchos Gracias .
I posted this here because it concerns an energy company .
https://www.khaleejtimes.com/business/aviation/british-firm-cairn-energy-sues-air-india-to-enforce-dh441-billion-arbitration-award
New posts are up
https://peakoilbarrel.com/opec-update-may-2021/
https://peakoilbarrel.com/open-thread-non-petroleum-may-15-2021/