A post by Ovi at peakoilbarrel.
Here I am again reporting on out of date US February oil production from the EIA April report after the world oil environment has been turned on its head. Fortunately the EIA also has some forward looking reports that make use of more current data to provide projections for a few months out. Also the EIA has a guesstimate for weekly oil output which certainly provides an indication of the direction of production over the next month. Also there are reports on rig counts that indicate activity in oil basins and provide clues on where oil output is going. Down, Down, Down.
All of the oil production data for the US states comes from the EIAʼs Petroleum Supply Monthly. At the end, an analysis of a three different EIA monthly reports is provided. The charts below are updated to February 2020 for the 10 largest US oil producing states (Production > or close to 100 kb/d).

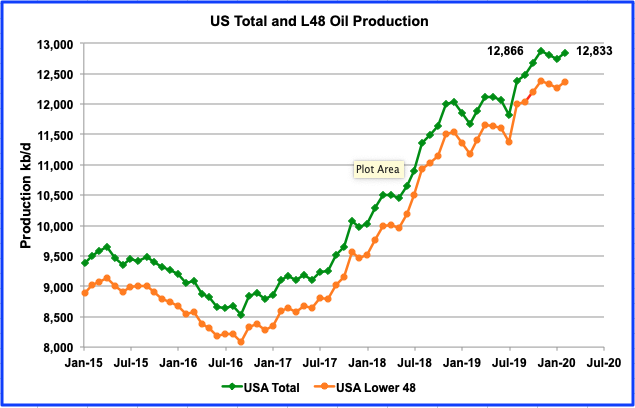
The May EIA report shows US production increased in February by 87 kb/d to 12,833 kb/d from 12,746 kb/d. For the lower 48 states only, production from January to February increased by 92 kb/d. From July 2019 to November 2019, output grew from 11,823 kb/d to 12,866 kb/d, an increase of 1,043 kb/d or an astonishing average rate of 260 kb/d/mth or 3,120 kb/yr. This astonishing rate begs/raises a few questions.
- Is it this stunning production rate of 260 kb/d/mth that lead Saudi Arabia to call for an OPEC + meeting for March that subsequently resulted in the split with Russia which resulted in the launching of Saudi Arabia’s Shock and Awe attack on the world’s oil markets?
- Will the November 2019 output of 12,866 kb/d be recorded as the new US Peak Oil date?
- Will US oil companies again challenge OPEC’s market share in the future or will they be content with taking a portion of the yearly growth, when growth returns? I have often wondered where we would be today if the US had limited their production to 2/3 of the yearly demand growth and let OPEC and Russia compete for the remaining market share. US unlimited production has only led to lower oil prices along with the demise of many US oil companies and less oil in the ground for the future.
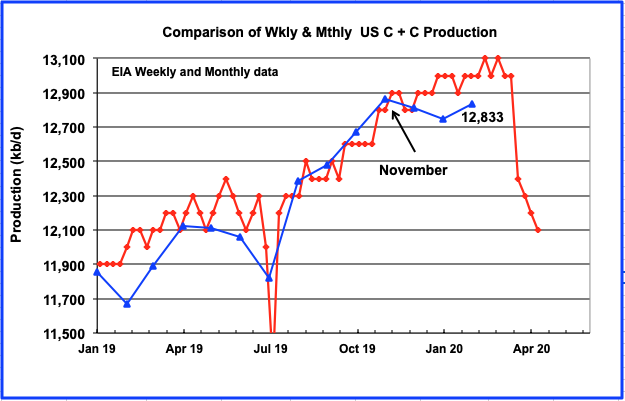
In an attempt to provide the latest production estimates for the US, above is a comparison of the EIA’s weekly and monthly production data. The weekly data is updated to the week ending April 24 and the monthly up to February 2020. While the weekly and monthly numbers are in reasonable agreement from August 2019 to November 2019, there is major divergence after that. Clearly there is some speculative oil production information coming from the EIA’s offices responsible for prediction weekly oil production. Regardless, they got the direction right for February but are 167 kb/d too high. The STEO is predicting output of 11,900 kb/d for May which appears to be where the weekly data is heading.
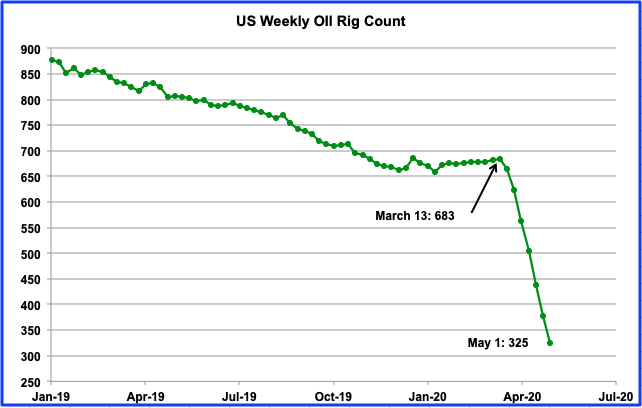
An indication of where US oil production is headed can be gleaned from this chart, showing the US weekly oil rig count. Data is provided by the weekly Baker Hughes rotary rig count report. From March 13 to May 1, 358 rigs were taken out of service, a drop of 52.5%. According to the Drilling Productivity report, each rig was capable of producing 730 bbls/d in April. So as of May 1, 260 kb/d/mth of new production is being shelved which will result in a very steep monthly production drop, as indicated in the previous chart.
Ranking Production from US Oil States
Listed above are the 10 states with production previously greater than 100 kb/d. This month Utah fell below 100 kb/d but will be retained for continuity. These 10 accounted for 10,371 kb/d (81%) of production out of a total US production of 12,833 kb/d in February 2020. US year over year production again exceeded 1,000 kb/d by 164 kb/d. Not shown in the table is the GOM which produced 2,023 kb/d in February and would rank it between Texas and North Dakota.
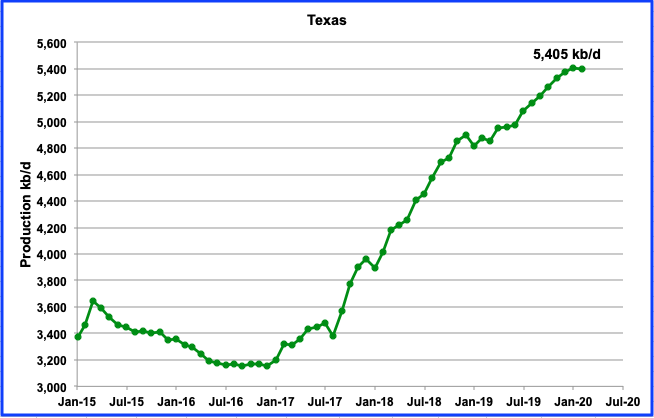
February production in Texas dropped by 5 kb/d to 5,400 kb/d from a revised 5,393 kb/d in January. There is a definite hint of slowing output in Texas.
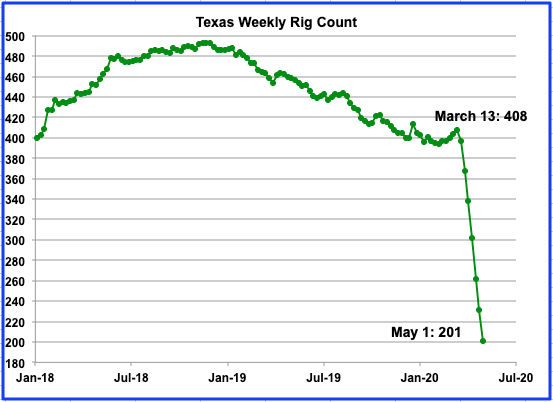
The rig count in Texas on May 1 was down to 201 rigs, a drop 207, or 50.7%, from 408 in the week of March 18.
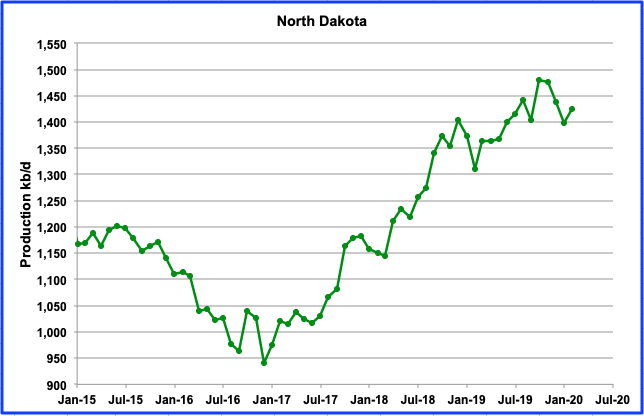
North Dakota’s oil production has been dropping since October 2019 however it increased by 27 kb/d in February to 1,425 kb/d.
According to this report, North Dakota is now drilling wells outside of its core areas. BISMARCK, N.D. (AP) — North Dakota’s oil production may peak within five years as companies finish drilling the most prolific portions of the state’s oil patch, state and industry officials told lawmakers Tuesday.
“Mineral Resources Director Lynn Helms, the state’s top oil regulator, said about 20% of drilling activity is now outside of the “core” areas of the western North Dakota’s oil producing region.”
“The end of (core area-drilling) is on the horizon; we can see it from here,” Helms told the Legislature’s interim Government Finance Committee.
From January to early March the number of rigs operating each week has remained almost constant as it wandered between 51 and 53 but by the week ending May 1, the number had dropped to 26.
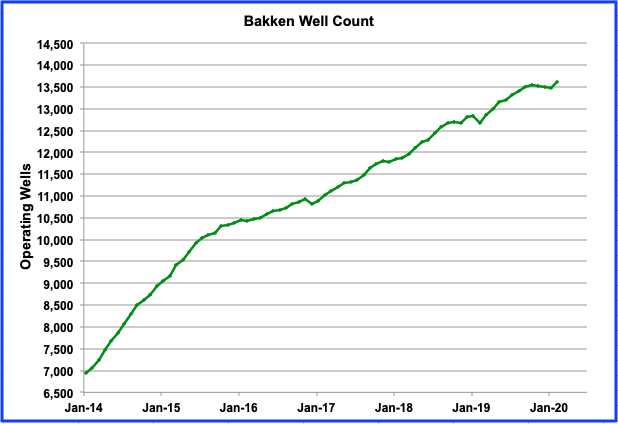
The number of producing wells in the Bakken started to decline in October 2019 from a high of 13,555 to a low of 13,482 in January 2020. However In February there was sharp jump to 13,616. It will be interesting to see what happens in March. We can expect a sharp drop in production and drilling in North Dakota, according to this report.
“Continental Resources Inc, the company controlled by billionaire Harold Hamm, stopped all drilling and shut in most of its wells in the state’s Bakken shale field, three people familiar with production in the state said on Thursday.”
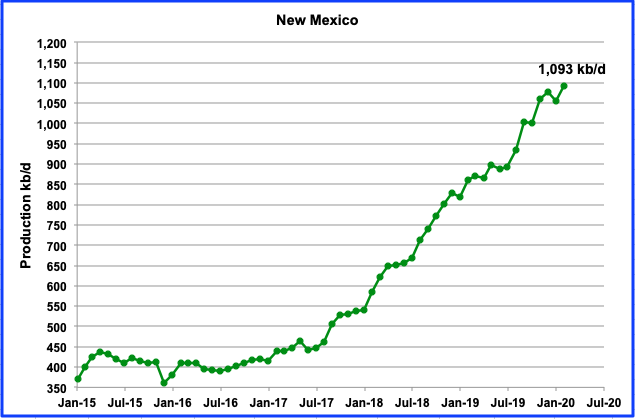
While January was the first month that New Mexico’s output declined, February resumed the upward trend. Output increased by 37 kb/d from 1,056 kb/d to 1,093 kb/d in February. While Texas has been getting all of the attention regarding its production growth, New Mexico has also increased its output and recently has exceeded the critical 1 Mb/d. On a YoY basis, New Mexico has increased its output by 232 kb/d, same as last month.
New Mexico’s production is expected to drop in March according to this report. “New drilling in the Permian Basin in southeastern New Mexico is screeching to a halt, and many producers are starting to shut in existing wells to await better times. That, in turn, foreshadows a double whammy on the state budget, as government revenue tumbles from plummeting oil prices and forthcoming production declines.”
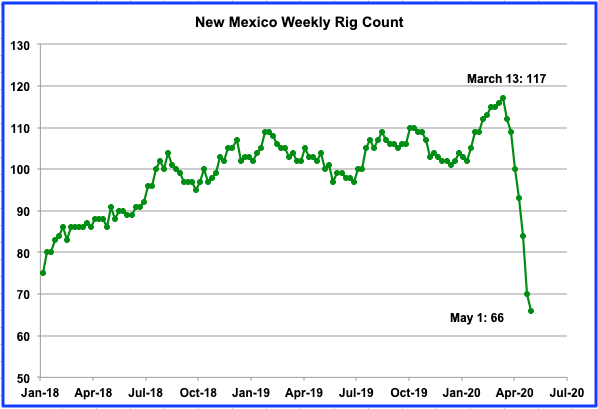
In New Mexico, the rig count fell from 117 to 66 from the week of March 13 to May 1, respectively. This should result in a production drop starting in March.
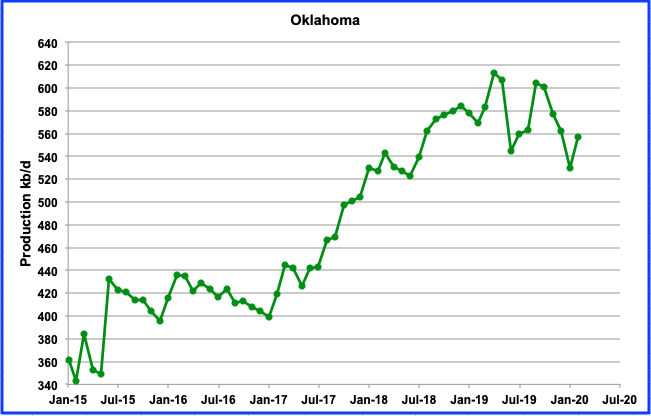
Oklahoma output rebounded in February after declining for four months in a row. Output increased by 27 kb/d to 557 kb/d. In early January, Oklahoma had 50 oil rigs in operation. In the week ending May 1, there were 13, a drop of 37, or 74%, from the beginning of the year.
According to this report, “The Oklahoma Corporation Commission approved an emergency order on April 22 that allows oil producers to stop or reduce production without losing their leases for non-production. One Oklahoma producer who testified that he operates about 600 wells in the state said he is currently losing $200,000 monthly by producing from economically challenged wells.”
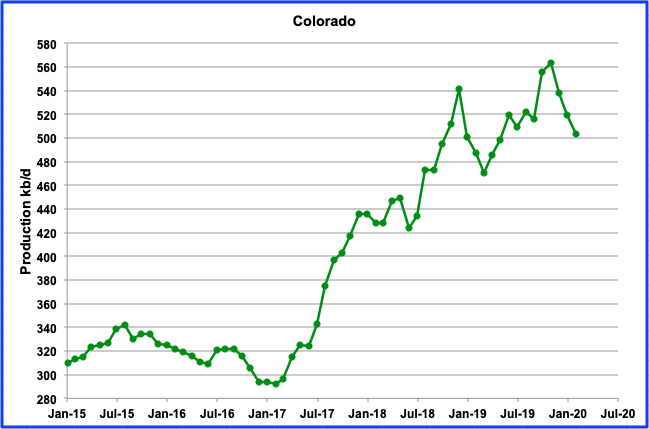
Colorado production declined by 16 kb/d in February to 503 kb/d from 519 kb/d in January. From the peak of 563 kb/d in November, output has dropped by total 60 kb/d. New environmental regulations may be beginning to take their toll on drilling activity and the resulting oil output decline. The current low oil price can only add to the drilling industry’s difficulties. However some operators have hedged their output and will continue to operate according to this report. Regardless, Colorado’s oil producers seem to resemble a tale of two cities.
“The oil and gas industry has been hit hard, including in Colorado. Halliburton and Liberty Oilfield Services have laid off workers in Colorado. Occidental Petroleum, Colorado’s No. 1 oil and gas producer, and Noble Energy, the No. 2 producer, recently announced cuts in spending and employees’ pay and hours. Denver-based Whiting Petroleum said on April 1 that it is filing for bankruptcy.”
On the other hand, “Denver-based Highpoint Resources, which operates exclusively on the northern Front Range, has not shut any of its wells. Bill Crawford, the company’s chief financial officer, said Highpoint has hedged its position in the market, meaning it has contracts locking in the price it receives for future production. About 95% of Highpoint’s production is hedged at $58 a barrel for the rest of this year.” Smart company! ???
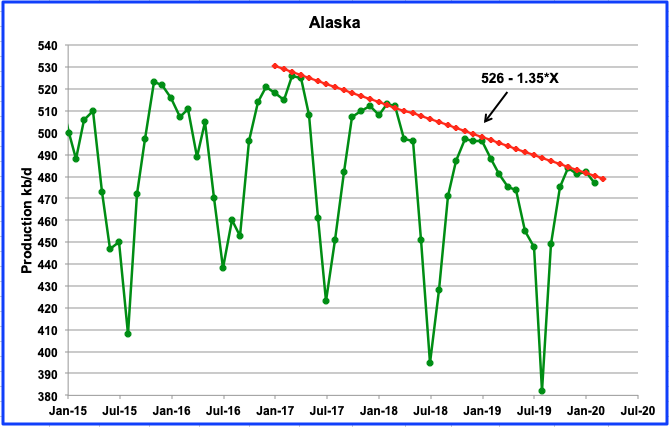
Alaska’s output continues its slow decline as shown by its annual peak production months of November, December and January touching the downtrend line. February was down by 5 kb/d to 477 kb/d. The line continues to show a decline rate of 1.35 kb/d/mth or 16.2 kb/d/yr.
An expected 20 kb/d increment near the end of the year will mostly be offset by the estimated yearly decline of 16.2 kb/d. However, the Corona virus is causing rigs to be shut down according the this report. “ConocoPhillips is demobilizing its rig fleet on Alaska‘s North Slope to try to minimize the risk of workers contracting COVID-19, a spokeswoman said Wednesday”
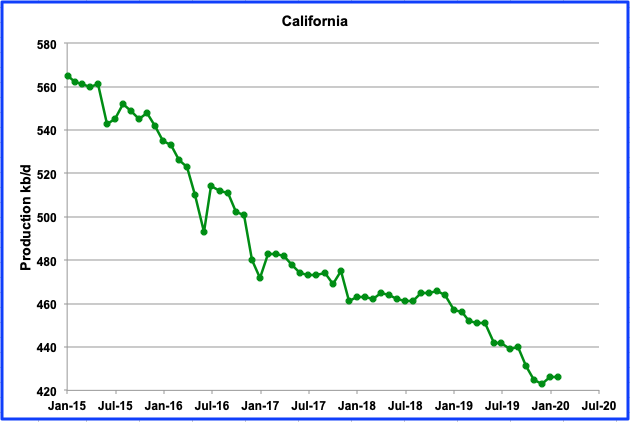
California’s slow decline has taken a pause. February production was flat at 426 kb/d and had an increase of 3 kb/d in January to 426 kb/d.
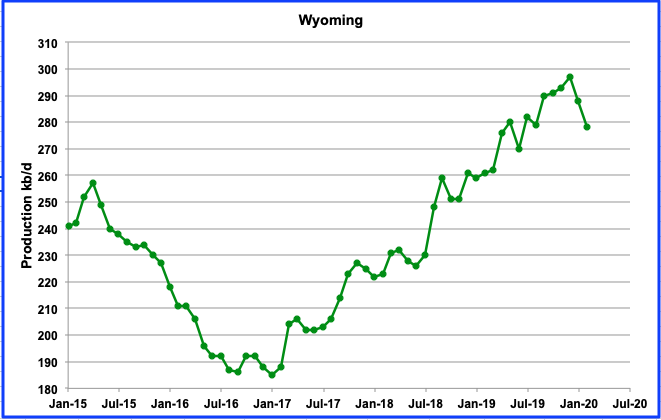
Wyoming increased its output from January 2017 to December 2019 and reached a new high of 297 kb/d in December 2019. However in January and February it had two successive drops. In February 2020 output dropped by 10 kb/d to 278 kb/d. Wyoming, like other states, is being impacted by low oil prices and the virus according to this report.
“Even with an agreement in place, the demand decline has been so sharp, and so deep,” University of Wyoming economist Rob Godby remarked. “The problem is really the coronavirus. There is so much oil on the market right now, and so much to go into storage, that really the only way to slow this down is to actually shut in wells.” Shutting in productive wells can prove costly, and there’s no guarantee activity will return to Wyoming down the road, he added.
Steve Degenfelder, land manager at Kirkwood Oil and Gas, LLC welcomed the decision by OPEC to limit production, but noted the Casper-based company will still be facing challenges in the days ahead. “We have shut in some high cost production and will consider more as time goes on,” he said.
During the week ending May 1, Wyoming had 4 oil rigs in operation, down from a high of 19 during January.
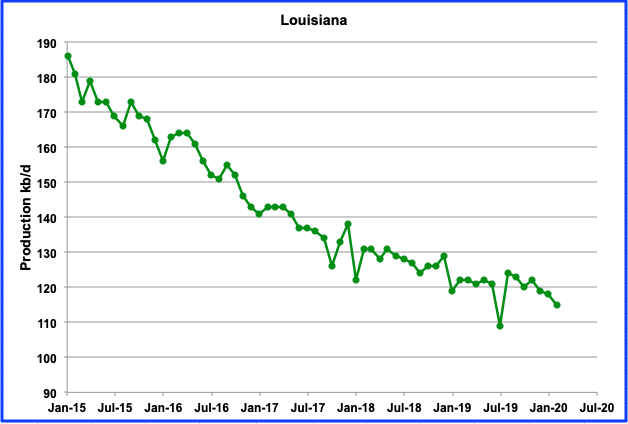
Louisiana continues its slow steady decline. After rebounding from a new low output of 109 kb/d in July 2019, the decline has begun again. February output was down by 3 kb/d from January to 115 kb/d. Louisiana’s oil rig count has had a slow decline from the beginning the year to the week ending May 1. In January, 22 rigs were operating while there were 16 in April/May.
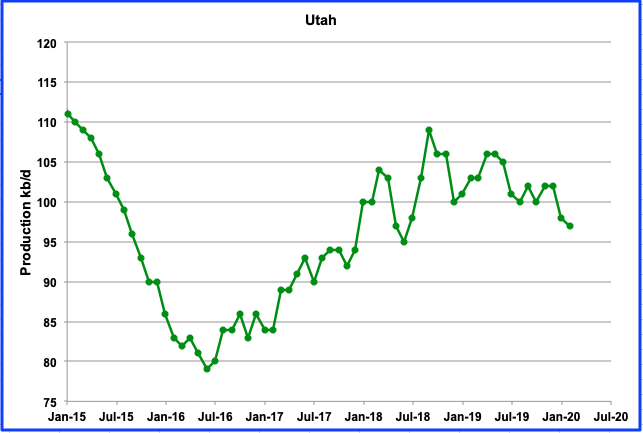
Utah’s output was holding steady since July 2019 at slightly over 100 kb/d due to its new conventional field but is now giving indications of entering a new slow decline phase. February production fell below 100 kb/d to 97 kb/d, a drop of 3 kb/d from January 2020. The last peak occurred on September 2018 at 109 kb/d.
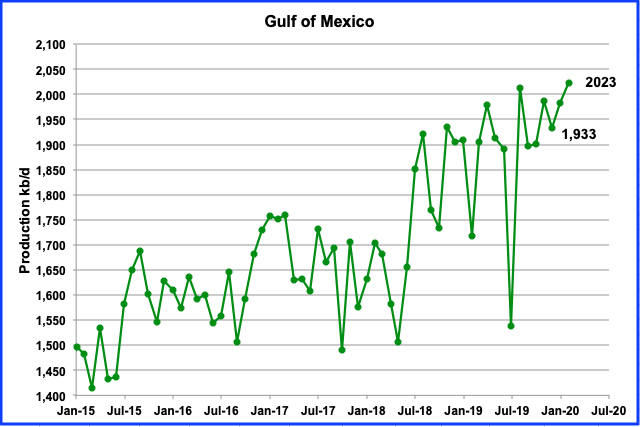
The GOM’s output continued to rise in February and exceeded 2,000 kb/d again. The last time it exceeded 2,000 kb/d was August 2019. February production increased by 41 kb/d to 2,013 kb/d.
UPDATING EIA’S DIFFERENT OIL GROWTH/DECLINE PERSPECTIVES
1) DRILLING PRODUCTIVITY REPORT
The Drilling Productivity Report (DPR) uses recent data on the total number of drilling rigs in operation along with estimates of drilling productivity and estimated changes in production from existing oil wells to provide estimated changes in oil production for the five key tight oil regions.
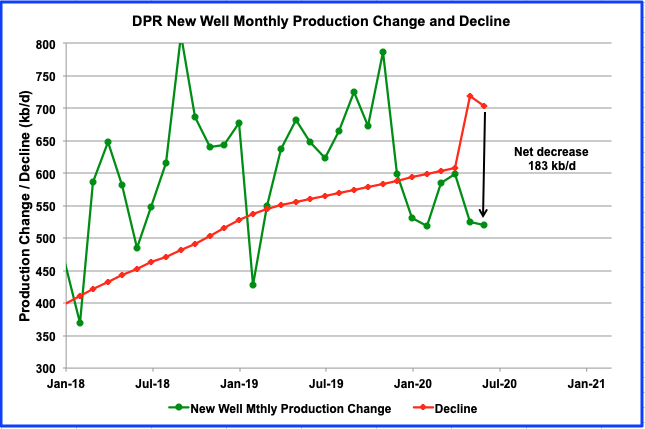
This chart shows the monthly change in new well oil production and the decline from all previous producing wells for the onshore L48 states. The difference between the two gives the projected output increase for all tight oil basins.
There has been a major change in the output projections from the March to April DPR reports. The chart shows the dramatic increase in the decline rate for March and April relative to February. For April 2020, the March report projected an increase of 17.5 kb/d. The new April report has revised the March increase to a decrease of 194 kb/d. For May, the decline rate is projected to be 183 kb/d.
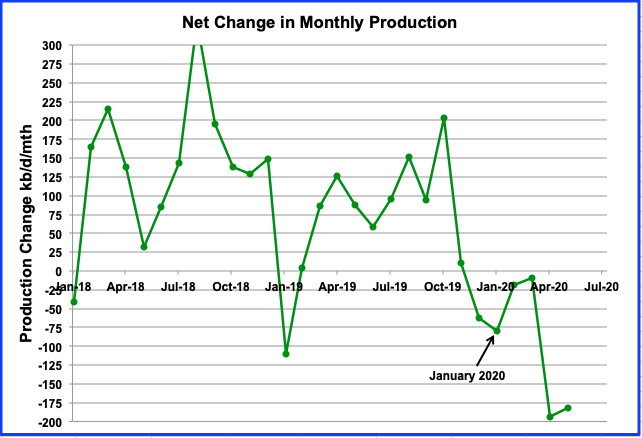
Above is the DPR net growth chart updated to May 2020 and shows the difference between the monthly change in new oil well production and the decline from all previous producing wells for the onshore L48 states. The April report indicates that oil production from the LTO basins and associated conventional wells has been in decline since January 2020. Output came close to no change in March but didn’t quite make it.
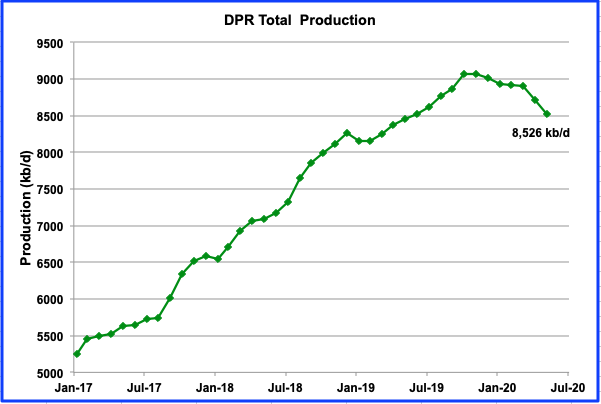
Above is the total oil production from the 7 basins that the DPR tracks. Note that the DPR production includes both LTO oil and oil from conventional wells. LTO oil and conventional oil output peaked in October 2019 at 9,062 kb/d. The projected May output is 8,526 kb/d, a drop of 536 kb/d. Note the increased rate at which production starts to drop in March.
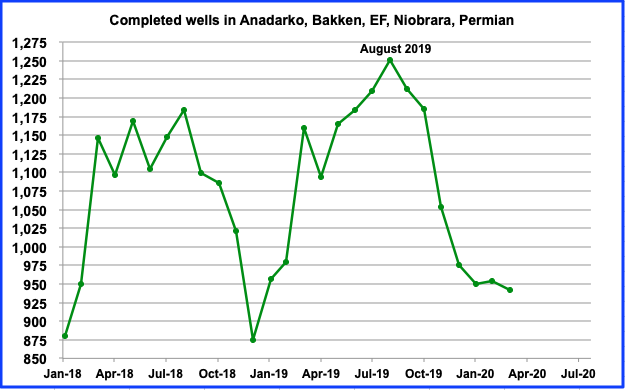
From August 2019 to March 2020 completed wells dropped from 1,251 to 942, a drop of 309. There appears to be a temporary pause in completion from January to March.
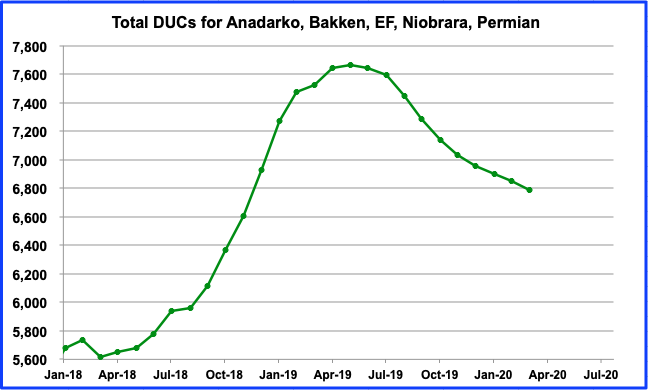
It is interesting to note that the number of DUCs is dropping very slowly. During March, only 62 DUCs were completed. Does this indicate that the majority of them are dead ducs? ????
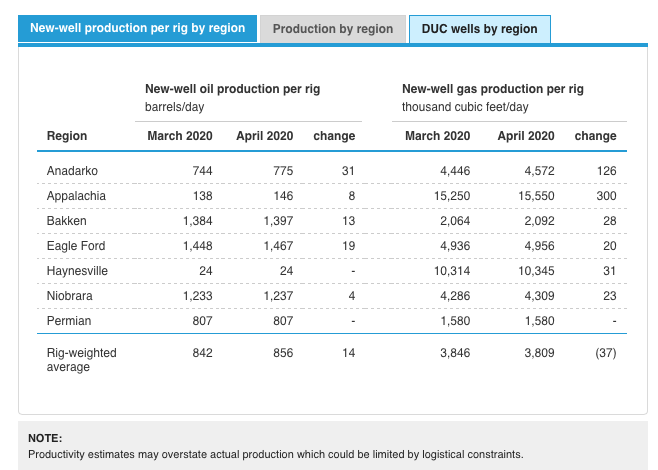
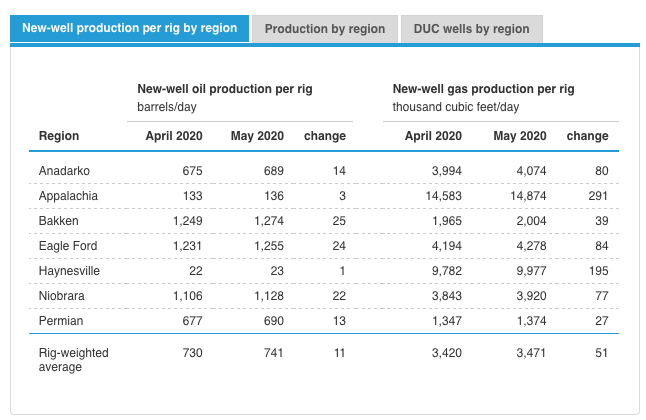
Above are two tables from the March and April DPRs. Compare how the New-well oil production per rig has dropped for each region in going from the March to April reports. The March/April productivity was close to 850 b/d/rig while April/May dropped to 735 b/d/rig. This seems to imply that in April and May, the rigs were moving into lower productive regions. Is there some other explanation?
2) Light Tight Oil (LTO) Report
The LTO database only provides information on LTO production from seven tight oil basins and a few smaller ones.
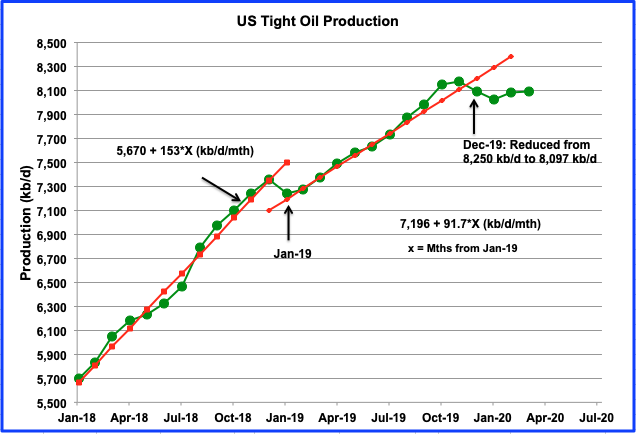
There was a significant downward revision to the LTO data in the April 2020 report. The December 2019 output was reduced from 8,250 kb/d to 8,097 kb/d. March output is 8,096 kb/d up 7 kb/d from 8,089 kb/d in February.
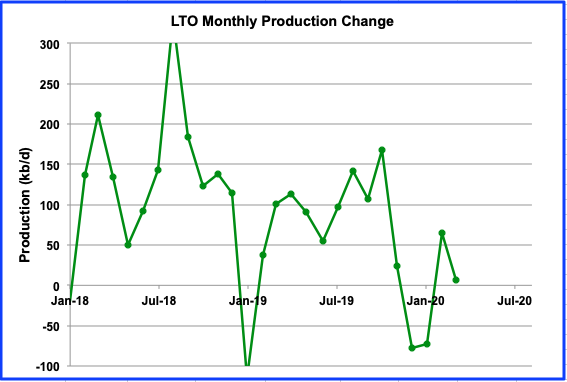
This chart shows the monthly addition to LTO output. It recovered to an output increase in February and March from decreases in December and January. The production increase in March was 7 kb/d.
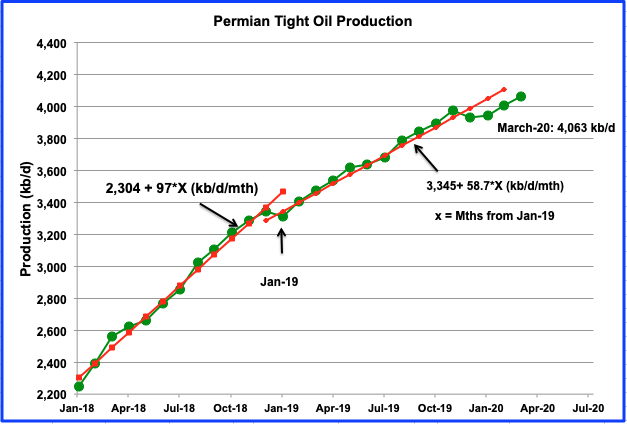
The Permian is the largest contributor to US tight oil growth. The average growth rate for 2019 is 40% lower than 2018. While output may be slowing, output from January to March continued to grow at 59 kb/d/mth, virtually continuing at the average trend of 58.7 kb/d/mth from January 2019. Output in March reached a new high at 4,063 kb/d. Will it slow in April as rigs are retired.
3) Short Term Energy Outlook (STEO)
The STEO provides projections for the next 13–24 months for US C + C and NGPLs production. The April 2020 report presents EIA’s oil output projections out to December 2021
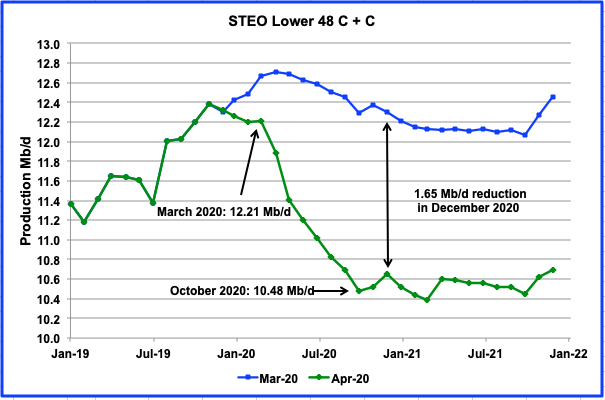
The chart compares the April 2020 STEO C + C projections with those in the March 2020 report. In the April STEO report, the estimated output for December 2020 has been reduced by 1,650 kb/d from the March report. From March to October the STEO is estimating that output would fall at an average rate of 250 kb/d with largest drop occurring over the first two months at a rate of 400 kb/d. Also note that the GOM increase in late 2021 is smaller.
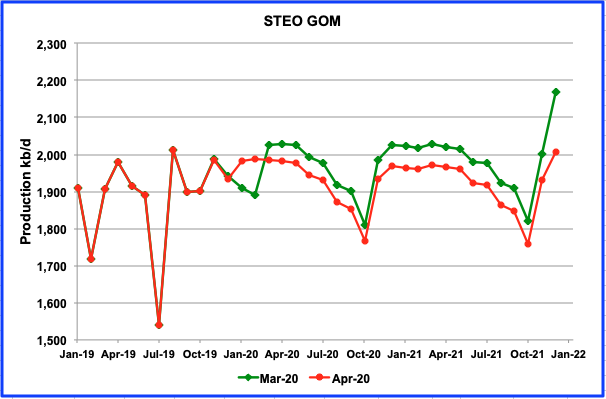
The increase in output from the GOM in December 2021 has been reduced by 167 kb/d. Could this be due to projected lower capex associated with the current low oil price environment?
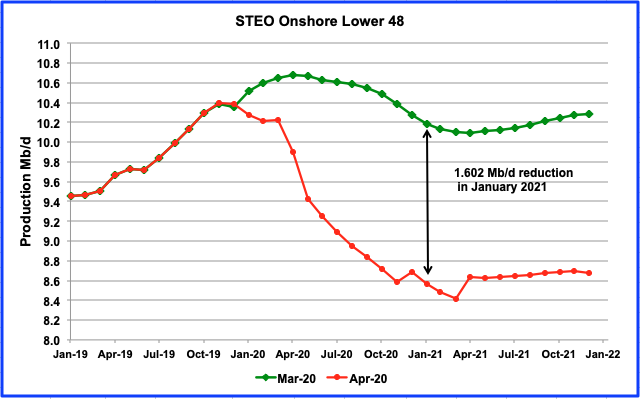
This chart compares the April 2020 STEO projection with the March 2020 report for the Onshore L48. The revisions in April STEO report project that the onshore L48 output will be down by 1,602 kb/d in January 2021 as compared to estimates in the March report. The April report estimates that by December 2020, output is expected to be down from 10,230 kb/d in March to 8,680 kb/d in December, a drop of 1,550 kb/d.
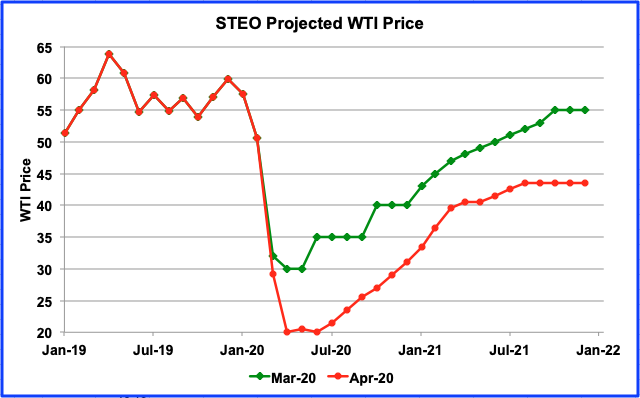
Above is a comparison of the EIA’s March and April projected price environment over the next two years. The settled price for WTI on May 1, 2020 was $19.69 for the June contract and $22.33 for July, close to the EIA estimates. The contango has been reduced to $2.64 today from $5 a few weeks ago.
World oil Production
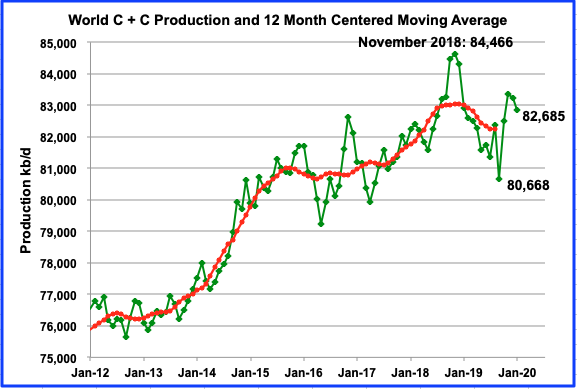
World oil production fell by 850 kb/d from 83,235 kb/d in December to 82,385 kb/d in January. The likely hood that the date November 2018 will be recognized as the date for World Peak Oil is increasing, in light of today’s slowing world economy and the time it will take to recover, possibly up to two or three years. In the mean time, new discoveries are few and small and old fields keep declining 24/7.
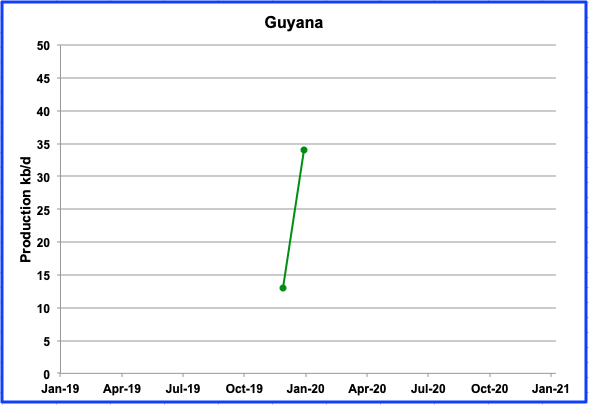
Check how fast Guyana’s production is increasing. Output in January jumped to 34 kb/d. It went from 13 kb/d in December to 34 kb/d in January, an increase of 21 kb/d or 161%. Almost puts the Texas Permian to shame. ????? .
260 responses to “Is November 2019 the New US Peak Oil Date?”
On World Oil I expect there could be a new peak, one such scenario below.
The extraction rate is for conventional C C which excludes tight oil and oil sands resources, the output curve includes separate tight oil and oil sands shock models which are added to the conventional C C shock model to get total World C C output. Peak for this scenario is in 2028 at 85 Mb/d. Arelatively slow recovery from the current economic crisis is assumed with output of World C C not returning to 2018 level until 2026.
Obviously this one of an infinite number of possible future scenarios, odds of it being correct are 1 divided by infinity, or zero.
Despite the lack of new discoveries there are a lot of undeveloped reserves and at higher oil prices a certain level of possible reserves as well as contingent resources that may be reclassified as reserves at higher oil price levels. By 2024 oil prices are likely to be above $70/b and by 2027 likely above $100/bo in 2020 US$ in my opinion.
I think it’s a more political thing:
Can the countries with big reserves develop them (Let’s say oil price > 50$):
– Iraq
– Iran
– Lybia
– Venezuela
If all of them can develope their oil, we’ll see a new peak. Each of them can increase their current production by an important amount, given the right political setting.
All of them failing, and we won’t see a new peak – just not enough reserves in the other countries to counter decline and replace an Iraque / Iran.
Dennis,
You and I will continue debating this issue. I would find your model much more palatable if you can explain by what process and or mechanism the velocity of money and hence inflation would increase to raise the demand for oil to $70-100/b?
Prior to the covid-19 event both M1 and M2 velocities seem to be in terminal decline, with M2V being at the lowest level ever. Oil prices only rose due to geopolitical tension, and not due to demand (especially from 2016 onward if memory serves me correctly).
https://fred.stlouisfed.org/series/M1V
https://fred.stlouisfed.org/series/M2V
In my opinion the velocity of money and inflation have a correlation to oil prices (And other equities/assets). I will quantitatively check this shortly.
So explain how the m1v and m2v can turn around and -> increase inflation and -> increase demand for oil -> cause oil price increase -> oil production to increase ? And then you have to extrapolate that to OECD and emergent economies oil consumption as to why you think it will increase.
I don’t see any particular reason why that would happened. We could have a possible bounce back after covid-19 and just go back to the normal anemic inflationary environment, one that we were accustomed to prior to covid-19. Seems more probable to me currently.
Iron Mike,
Supply will grow less quickly than demand driving the price of oil up. Note that I am talking about real oil prices in constant US$, the level of prices overall does not really matter in this context and the velocity of money is relatively unimportant, all the declining velocity of money tells us is that central banks are pushing on a string in trying to increase economic activity by using monetary policy, increasing money supply simply results in more money sitting in bank accounts and has very little effect on economic activity, that is the reason that the velocity of money has become lower.
As for the reason that oil prices have been low for most of the 2015 to 2020 period is simply a matter of over supply of oil, today oil prices are so low that oil output will decrease and eventually balance the oil market. The lack of investment in the oil industry over the past 5 or 6 years will eventually result in a shortage of oil, in addition tight oil output growth will diminish severely over the next 5 to 10 years (after it recovers to 7 or 8 Mb/d after the recession/depression.) Most of World growth in oil output from 2015 to 2019 was from tight oil output growth (about 85% of all annual output growth). Oil output might recover quickly so that oil is again oversupplied, but I doubt this will be the case, I expect a slow oil output recovery in a high oil price environment (again real oil prices).
Keep in mind that neither of us is clairvoyant. My expectation is the the World economy will recover relatively quickly once a safe vaccine for covid19 is available and widely distributed (18 to 36 months.) This is a matter that will depend on fiscal policy, monetary policy is ineffective when real interest rates are zero or lower.
If the economy never recovers as you seem to believe, then oil output could remain low forever. I would put the odds of that scenario at about 1 in 20.
“all the declining velocity of money tells us is that central banks are pushing on a string in trying to increase economic activity by using monetary policy, increasing money supply simply results in more money sitting in bank accounts and has very little effect on economic activity, that is the reason that the velocity of money has become lower.”
My understanding is different from this- In short, the low velocity of money is due to less spending within the country, for services and goods (including oil, airline tickets, restaurant meals, ect). Demand for most things is down. The central bank adding liquidity is an attempt to reverse the declining velocity of money, but that tactic has become much less effective over time, and can only do so much to reverse a big event like this.
Hickory,
Velocity of money is defined as nominal GDP divided by quantity of money. V=GDP/M or MV=GDP. Monetarists policy assumes V is relatively stable and that and increase in M will lead to an increase in GDP, they are wrong. Often GDP is unchanged and the increase in M simply decreases V. That is what we have seen in general from 1985 to 2019 as V gas continued to fall. This is the Reagan revolution in a nut shell, reduce taxes on the wealthy and increase wealth disparities in the nation, now a larger proportion of income goes to the wealthy. The wealthy spend a smaller proportion of their income, it simply sits in their financial accounts waiting for retirement or death, this decreases the velocity of money, because much of it is sitting idle in the bank accounts (and money market accounts) of the wealthy.
Volcker finally abandoned the right wing delusions, and the velocity of money became reality again.
Secrets of the Temple gives a blow by blow account.
Dennis,
the level of prices overall does not really matter in this context and the velocity of money is relatively unimportant,
This is what i have an issue with. I think it is extremely important.
Firstly oil is denominated in USD. So a strong USD implies lower oil prices. Strong USD->deflationary scenario due to the low velocity of money.
Secondly low economic activity shown by the velocity of money implies low demand.
Again why would that trend change ? Monetary policy has reached it’s limits and M1V has been declining since 2008. And coincidentally we haven’t seen $120/b oil since then. In fact it hasn’t come anywhere near that price for a while now. Yes there has been an oversupply in the market, only because velocity of money is perpetually declining. In other words the market isn’t absorbing all the production. Due to low activity.
Unless that mechanism changes and inflation plagues the USD thereby lowering its purchasing power, oil prices will not rise higher than $65-70/b in my opinion. Barring geopolitical conflict.
I think interest rates will remain low for the foreseeable future. Which has an impact on commodity prices including oil.
I agree with what Hickory said in his last sentence, i’ll rephrase, how would that big event reverse. If central banks have failed….what would cause it to reverse?
Bearing in my this is a worldwide phenomena, not just in the U.S.
Iron Mike,
Velocity of money has little to do with real economic output. The strength of the dollar is determined by international trade, international capital flows and policies of central banks worldwide. Aside from a short period during the GFC, there has not been a deflationary environment, just low inflation rates. Real GWP is what matters and the velocity of money has very little relationship with GWP (Gross World Product, with real GWP in constant dollars).
Your thinking that the velocity of money is important is incorrect.
Since 1981 as Money Velocity has decreased World GDP has increased, the R squared for 1960 to 2018 is about 29%, essentially no correlation. Also over the 1981 to 2018 period World real GDP grew fairly steadily at 2.93% per year.
In any case the price of oil is determined by supply and demand, I expect World real GDP and oil consumption to grow, regardless of the velocity of money. Chart below shows the relationship of Oil production and World GDP from 1983 to 2018. World real GDP determines demand for oil and oil price is determined by the balance of supply and demand for oil on World markets (undersupply results in price increases and oversupply results in oil price decreases, what determines oil supply is complex (geology, technology, politics, weather, war, etc).
Dennis,
Since 1981 as Money Velocity has decreased
Can you show me the data for this please.
Lets look at more recent times. The M1V has been declining since 2008. I think the reason for this is because again all that money is stuck in asset and equity. So world GDP figures are worthless to me if all that money is stuck in the stockmarket/housing/savings or other asset classes. Velocity of money shows real economic activity which requires energy such as oil.
We aren’t going to see eye to eye so we’ll agree to disagree and as usual time will tell.
Iron Mike,
The money supply that modern economics follows most closely is called MZM, as describel below:
The velocity of money is the frequency at which one unit of currency is used to purchase domestically- produced goods and services within a given time period. In other words, it is the number of times one dollar is spent to buy goods and services per unit of time. If the velocity of money is increasing, then more transactions are occurring between individuals in an economy.
The frequency of currency exchange can be used to determine the velocity of a given component of the money supply, providing some insight into whether consumers and businesses are saving or spending their money. There are several components of the money supply,: M1, M2, and MZM (M3 is no longer tracked by the Federal Reserve); these components are arranged on a spectrum of narrowest to broadest. Consider M1, the narrowest component. M1 is the money supply of currency in circulation (notes and coins, traveler’s checks [non-bank issuers], demand deposits, and checkable deposits). A decreasing velocity of M1 might indicate fewer short- term consumption transactions are taking place. We can think of shorter- term transactions as consumption we might make on an everyday basis.
The broader M2 component includes M1 in addition to saving deposits, certificates of deposit (less than $100,000), and money market deposits for individuals. Comparing the velocities of M1 and M2 provides some insight into how quickly the economy is spending and how quickly it is saving.
MZM (money with zero maturity) is the broadest component and consists of the supply of financial assets redeemable at par on demand: notes and coins in circulation, traveler’s checks (non-bank issuers), demand deposits, other checkable deposits, savings deposits, and all money market funds. The velocity of MZM helps determine how often financial assets are switching hands within the economy.
Chart below uses annual average data from link below.
https://fred.stlouisfed.org/series/MZMV
Dennis,
Thanks for the info. As soon as WTI reaches $70 /b barring geopolitical tension, I will admit defeat. Until then, lets see what happens.
Iron Mike
Note that I do not expect a fast recovery just that eventually the economy will recover. It might take 5 to 10 years so I do not expect 70 per barrel in 2020$ before 2025 and perhaps not until 2030. Much depends on the economy and predictions are difficult.
One ramification of of the decline in velocity of money from 3.5 to 1.3, is that you get much less bang for the buck when applying stimulus to the economy in times of crises or contraction. Its a manifestation of gradual, and severe, weakening of the the financial system.
Hickory,
It is simply a matter of who the money goes to. If it is tax breaks for the wealthy or bailouts for big business or banks (which amounts to a similar effect) then the money can just sit in bank accounts and the multiplier will be low.
An alternative is to put money in the hands of low and middle income citizens such as unemployment benefits, welfare and snap benefits, aid to state and local governments, and aid to small businesses (defined by annual revenue of less than 5 million rather than number of employees) then the money goes to people who will spend the money rather than simply save it and it is far more stimulative.
It is much less a weakening of the financial system and much more about unequal distribution of income.
There was a time when there was a progressive tax system to reduce unequal income distribution, that ended with the Reagan revolution and it has been downhill since.
“It is simply a matter of who the money goes to”
Yes Dennis. That simple line says so much about the history of human civilization.
Imagine how the tens of millions of slaves in human history feel about that issue.
In our recent past (since the mid 70’s) the large majority of the wealth growth in the country has gone to top 5-10%. It was a big change trend that was in place after WWll-
https://www.cbpp.org/research/poverty-and-inequality/a-guide-to-statistics-on-historical-trends-in-income-inequality
What I see is the wealthy (measured by net worth, not income) generally sequestering wealth in the form of art, luxury items, gold, off shore accounts, real estate, rocket ships, yachts, sports teams, lobbying to protect their assets, security and such. Much of this does not circulate in the general economy. Most of the spending by the lower 98% of net worth individuals does circulate and results in a healthier velocity of money.
The policy implications of this simple idea are huge, if we focus on them.
Dennis.
I agree there is no good reason that the $400,000 th dollar on the 1040 is taxed at the same rate as the $400 million th dollar.
I think the same should hold true for capital gains.
I also think there could maybe be some kind of capital gain tax differentiation.
Should the farmer who wants to retire and sell out and has a $2 million capital gain pay the same rate as the hedge fund manager who has a $20 billion net worth?
Same deal with the estate tax. The estate tax was attacked because a few years ago, small business owners, farmers etc would hit 55% rate fairly quickly.
Just keep graduating these rates till people like Buffet, Gates, Bezos, etc are paying 60-70% on dollars over $50 million. (Just a suggestion, I am sure there are ways to determine what the actual rate should be).
There is no reason a self employed person with AGI of under $1 million pays the same or more than these multi billionaires.
Huge issue that is always glossed over in the 30 second media sound bytes.
Dennis
What assumptions are behind the drop from 83 to 65? That’s 22% drop. In looking at the BP annual report and checking total reserves vs discoveries, total reserves kept on climbing even though the discoveries were small and appreciating that the world consumes close to 35B barrels each year, I found that over the last five years, the BP World reserves kept on climbing even though discoveries were small and minimal. My only thought was for this to happen, a lot of fields we’d bring reworked with horizons wells so they didn’t suffer the decline associated with vertical wells, however looking at the latest 2019/BP report, it appears that total world reserves are near or at peak.
Considering that the annual decline rate is close to 1 to 1.5% and guessing it will take five years to recover, I find it difficult to see how we will be able to exceed the November 2018 peak.
Just another opinion.
Ovi, BP does not do surveys of world proven reserves, they just ask every country: How much oil do you have left in the ground? That country then declares their proven reserves and BP dutifully reports that number.
The bottom line, BP’s estimate of world proven reserves are not worth a bucket of warm spit.
Let me see?
Mike Pense vs BP’s Estimates
Tough call but I’d have to go with BP.
SW,
Quite a lot of the BP estimate is OPEC reserves, these are not audited, you can believe what you wish, but Ron is correct that the BP reserves are likely overstated, they might match with 3P reserves very roughly. See estimates in Twilight in the Desert.
I don’t doubt for a moment that BP’s estimates are bogus. It is just that when you are comparing degrees of bogosity well, the bucket of warm spit wins. I figured that Ron, like myself is old enough to remember Lyndon Johnson describing the Vice Presidency as “A bucket of warm spit”
Who’s Mike Pense?
Have I misspelled his name? Oh my!
Ron
I would tend to agree with you, if we are talking about the increases in the 80s and 90s. However I think, starting in 2010 when we saw a dramatic fall off in discoveries, (See attached) things must have changed. Even if BP just called and a country tried to increase their reserves, they would have asked for an explanation.
Two basic questions. Have you found new oil? Are you going to recover more from the wells you already have?
Note that from 2012 to 2016 there was hardly any change in the BP world reserves. The bump from 2016 to 2017 was a combination of US (11) and SA (30). I assume the SA increase was related to the work done as part of their IPO.
Also note that double 1,730, puts world reserves in the 3500 range, half way between Dennis’ 3050 for conventional and 4,000 including oil sands.
So I am not inclined to totally ignore the BP estimate. I think there is more than an ounce of truth in their numbers. Let’s see what they come up with this coming June.
Really Ovi? BP’s estimate matches OPEC’s almost exactly.
OPEC Share of world crude oil reserves, 2018
However, that is OPEC’s 2018 estimate. Look for the above estimate of Saudi reserves to be revised upward in the very near future. Obviously BP called Saudi Arabia for their latest estimate and Saudi advised them that their reserves had been revised upward. And BP replied: “OK”. And that was that. Either that or BP is an even greater liar than Saudi Arabia.
BP raises Saudi oil reserves 12% in first big change in 30 years.
BP has raised estimates for Saudi Arabia’s crude oil reserves by 12%, marking the first major change to the country’s estimated reserves since 1989.
In its benchmark 2019 Statistical Review of World Energy, BP recalibrated some Saudi gas reserves as oil, allowing Riyadh to close in on Venezuela’s top spot as the world’s largest reserves holder.
BP said Saudi Arabia’s proved oil reserves were revised to 297.7 billion barrels at the end of 2018 from 266.2 billion a year earlier, only slightly behind 303 billion in Venezuela.
Canada was third with 168 billion barrels, followed by Iran with 156 billion and Iraq with 147 billion.
Ovi, those numbers are laughable. OPEC says the total Non-OPEC proven reserves are 308 billion barrels or 20.6% of the world total. In other words, over 60% of the world’s oil comes from 20% of the world’s oil reserves. Do you believe that Ovi? Do you really believe that?
Ron
In my reply I said “ However I think, starting in 2010 when we saw a dramatic fall off in discoveries, things must have changed. Even if BP just called and a country tried to increase their reserves, they would have asked for an explanation.”
Below is an updated chart with the OPEC reserves added. As you can see from 2011 to 2016, the OPEC reserves hardly changed. (I must admit that is a good trick considering they pump close to 11 Bb/yr)
The only change came in 2016 when SA added 29.8 B barrels. Where did come from. I checked the Saudi Aramco IPO and here are some quotes.
“The Company retained independent petroleum consultants, D&M, to independently evaluate reservoirs the Company believes accounted for approximately 85% of the Company’s proved oil reserves”
“The Company chose this scope because of the overall scale of the Kingdom’s reserves and the concentration of deposits in the major reservoirs that were assessed. Further independent assessment of the Kingdom’s smaller reservoirs would have taken several years to complete. D&M’s reserves estimation of 209.1 billion barrels of oil equivalent reserves for the reservoirs it evaluated was within 1% of the Company’s internal estimation for the same reservoirs for the same Concession time period.
“As at 31 December 2018G, the Kingdom’s reserves in the fields the Company operates consisted of 336.2 billion barrels of oil equivalent, including 261.5 billion barrels of crude oil and condensate, 36.1 billion barrels of NGLs and 233.8 trillion standard cubic feet of natural gas.
So they had an independent petroleum consultant review their reserves before issuing the IPO. I am not prepared to comment on the accuracy of the consultants numbers.
Regardless of whether you or I believe the BP numbers, the OPEC reserves have been essentially constant as are those of the Non-OPEC countries. It’s the trend in the BP numbers that may be more important than the actual numbers.
So I don’t see any significant change in world reserves in the future. I think they are very close to the peak.
All I was trying to say Ovi, was that I do not think BP would have demanded an explanation. In fact, in the vast majority of cases, they would have taken their data from the country’s published reports. There would have been no phone call at all.
Not that BP does not desire accuracy, they most certainly do. It’s just that they are well aware that these numbers have political overtones and simply do not desire to get involved in a public battle over every country’s proven reserves claim.
Ovi,
The 3050 Gb scenario includes conventional oil (2800 Gb), tight oil (90 Gb) and oil sands(aka extra heavy oil) from Canada and Venezuela (150 Gb). The extraction rate is for conventional oil only (separate models are done for tight oil and extra heavy oil and the total is added to the conventional model. Chart below gives total C+C, conventional only and tight oil and extra heavy models (right axis), no extraction rate, this is a revised model (2920 Gb) with an assumed decrease in extraction rate after 2045 (extraction rate decreases from 5.6% in 2045 to 2.35% in 2100 and to 0.1% by 2200.) I assume we transition gradually away from crude oil use over that 155 year period.
I remember doing this calculation a while back:
Non-OPEC reserves = 308 billion barrels
Non-OPEC production = 50.37 million barrels/day
OPEC reserves = 1189 billion barrels
OPEC production = 30.25 million barrels/day
(50.37 million barrels/day / 308 billion barrels) / (30.25 million barrels/day / 1189 billion barrels) = 6.4
In other words, non-OPEC produces 6.4 times more oil per barrel of reserves than OPEC.
So either OPEC is extraordinarily incompetent at producing oil, and/or they have really bad oil fields, and/or their production cuts are very effective, and/or they’re lying about their reserves.
Frugal,
Alternatively, OPEC has a lot of proved undeveloped reserves that they choose not to develop at present because it would result in an oil market that is oversupplied.
Also the extra heavy oil reserves in Venezuela and Canada should be excluded, so at the end of 2018 we have:
OPEC=981 Gb
non-OPEC=325 Gb
I do agree that OPEC reserves are likely overstated, but my guess is by a factor of 2 rather than a factor of 3 as Ron often claims. The difference in R/P ratios is due to a difference in the level of development of reserves in OPEC vs non-OPEC nations.
Alternatively, OPEC has a lot of proved undeveloped reserves that they choose not to develop at present because it would result in an oil market that is oversupplied.
Really now? And just which countries have these proved but undeveloped reserves?
Yes, there are a lot of very tiny undeveloped pockets of oil scattered around the Persian Gulf area. But the reason they are undeveloped has nothing to do with fear of oversupplying the market. They are so small and so remote that it would be uneconomical to develop them. And at any rate, the total reserves in all these tiny pockets would not be significant.
I am sorry to have to keep pointing this out to you Dennis, but you keep insisting that these “proven but undeveloped” fields exist. But there is not one whit of evidence that these massive proven but undeveloped reserves exist.
But the very serious flaw in your logic is that these fields remain undeveloped for fear of oversupplying the market. For the last 80 years or so, every oil-producing nation on earth has tried to maximize its oil production. This includes all OPEC nations.
Saudi Arabia shut down production in Khurais in the 1960s because of low pressure and the remote desert location and the low price of oil made it uneconomical to remedy this problem. But the spike in the price of oil early in this century changed all that and a massive water injection system was installed and the field came back online in 2009.
Manifa had far more serious problems. Its oil is heavy with vanadium and hydrogen sulfide, making it virtually unusable. But the very high price of oil combined with falling production in Ghawar and Saudi’s other super-giant fields made it mandatory that the Manifa be developed. Saudi had to build their own refinery designed to handle the contamination. It was estimated in 2011 that Manifa would cost $17 billion and another $90 billion expanding its refining and petrochemical assets. I have no idea what the final cost was but I would bet it was much higher than their 2011 estimate.
But Saudi Arabia has no more mothballed fields to bring back online. Nor are there any other such giant fields anywhere in the Middle East that can be brought online. No Dennis, I am sorry but those huge proven but undeveloped fields do not exist anywhere in OPEC.
Of course, there is the heavy oil in the Orinoco basin, but that is another story.
Ron,
As I have pointed out before, I said reserves, not fields. Often as a field is developed and knowledge improves along with the development of new technology the estimates of reserves and what can be produced profitably will change. So there may be reserves that will require new wells to be drilled in order to access.
It is also possible that 100% of reserves have been developed (though this is not the case in the US and I doubt it is the case anywhere in the World.
In the US at the end of 2016 there were 17.3 Gb of proved non-producing crude reserves. See
https://www.eia.gov/dnav/pet/PET_CRD_NPROD_DCU_NUS_A.htm
Total crude reserves at the end of 2018 were 43.8 Gb, so 39% of US proved reserves were “non-producing”. for total crude reserves see
https://www.eia.gov/dnav/pet/pet_crd_pres_dcu_NUS_a.htm
I would suggest that for OPEC nations the percentage of non-producing reserves is higher than the US as some OPEC nations seem to limit output to prevent oil prices from crashing.
As neither of us have much data for OPEC, we can only speculate, so we will simply continue to disagree.
US proved reserves estimates have grown over the past 40 years, an assumption that there has been no growth in OPEC reserves seems a bad one from my perspective.
I did a post on this 5 years ago
http://peakoilbarrel.com/us-oil-reserve-growth-2/
little has changed since then.
Often as a field is developed and knowledge improves along with the development of new technology the estimates of reserves and what can be produced profitably will change.
The first Saudi field, Dammam #7, was discovered in 1938. The very last, Shaybah, in 1968.
Dennis, you need to get real. These very old giant fields have already undergone all the technological development they will ever undergo. There is no more “reserve growth” left in any of the very old Saudi giants. Their “reserve” has already undergone all the growth it will ever grow.
Ghawar, for instance, has undergone massive infill drilling with horizontal wells, some of them MRC wells, that skim the top of the reservoir. That is the last “technological development” this old supergiant will ever undergo. It is currently pulling up a lot of water. And that percentage is increasing.
Alternatively, OPEC has a lot of proved undeveloped reserves that they choose not to develop at present because it would result in an oil market that is oversupplied.
Exactly which proved reserves does OPEC have that they’ve decided not to develop at the moment? If these undeveloped reserves actually existed, wouldn’t OPEC nations tell the World about them? Most of them don’t have any compulsions about bragging.
I grant that Orinoco hasn’t seen much development yet, but that’s because Venezuela can’t, not because they chose not to.
Using your numbers that exclude extra heavy oil we get:
(50.37 million barrels/day / 325 billion barrels) / (30.25 million barrels/day / 981 billion barrels) = 5.0
Still way too high of a ratio to be real.
I do agree that OPEC reserves are likely overstated, but my guess is by a factor of 2 rather than a factor of 3 as Ron often claims.
If this is the case, then the OPEC vs non-ratio will be 2.5 instead of 5.0, which is still too high. It really should be close to 1.0 unless those proved but undeveloped reserves make up a much larger share of the total reserves in OPEC countries vs non-OPEC countries. And this claim requires evidence.
If insufficient evidence for this claim exists, then this suggests that OPEC overstates their reserves by a factor of > 4, not 2 or 3.
Frugal,
OPEC limits output, non-OPEC nations mostly doe not (until very recently). An assumption that the R/P ratios must be the same everywhere, is not born out by looking at the numbers for individual non-OPEC nations, it varies from place to place.
You can assume what you want, does not make your assumptions correct.
Lack of data makes it impossible to answer the question.
Ron,
Technology used in oil fields is continually being improved, as far as I know not many fields are still using 1938 technology, so discovery date of the field is unimportant. Lots of US fields were discovered earlier than Saudi fields, US output is higher. Does this mean Saudi reserves must be less than US reserves?
Is that what you are suggesting?
I doubt it, but this suggests then that R/P ratios will be different in different countries.
Also note that the important reserve number is proved plus probable reserves (2P reserves) rather than proved. That is the best estimate. For non-OPEC this is likely about 470 Gb, OPEC Reserves a good 2P estimate is probably about 650 Gb.
There is likely to be reserve growth as technology progresses and as oil prices increase.
An assumption that the R/P ratios must be the same everywhere, is not born out by looking at the numbers for individual non-OPEC nations, it varies from place to place.
We’re not talking about R/P ratios for individual nations, we’re talking about R/P ratios for two large blocks of nations, OPEC and Non-OPEC. Any differences between individual nations are smoothed out by averaging all the nations in each block.
It’s unrealistic to believe that the R/P ratio should be 5 times greater for one block of nations versus another block of nations. Are the two block really that different from each other in how they produce oil?
Technology used in oil fields is continually being improved, as far as I know not many fields are still using 1938 technology, so discovery date of the field is unimportant.
Dennis, below is a drawing of Haradh, the southernmost field in Garwah. Because the rock is so tight, they are using Maximum Reservoir Contact wells. You can see the water injection wells on the periphery of the field. There is no oil beyond this periphery. This is the latest technology. Haradh will never experience any further reservoir growth. Ditto for the rest of Ghawar. Ditto for Saudi’s other very old supergiant fields.
You are simply mistaken, very mistaken, about Saudi having large amounts undeveloped reserves. And anyone who knows anything about Saudi oil reserves will tell you the same thing. I have no idea why you are so fixated on Saudi, or OPEC, having large amounts of undeveloped reserves. All I can say is you are so badly mistaken.
I will have nothing more to say on this subject, (today). 😉
Frugal,
Yes the groups are very different, one group produces all it can, the other group limits production to keep oil prices from crashing.
I agree that the OPEC reserves are inflated,
I use a conventional C+C assumption of 2800 Gb (includes any future discoveries and reserve growth that might occur in the future. This would correspond to 2P, reserves and then some additional quantity of possible reserves and contingent resources that is likely to be produced in the future.
So through the end of 2018 about 1335 of conventional C+C has been produced, that leaves about 1665 Gb to be produced if the 2800 Gb estimate is correct, 2P reserves for non-OPEC are roughly 470 Gb and for OPEC perhaps 650 Gb (both these estimates exclude extra heavy oil from Canada and Venezuela). These three (1335+650+470) add to 2455 Gb, which would imply new discoveries plus reserve growth of 345 Gb over the next 180 years.
Just as two nations will have different R/P ratios, two groups of nations would also be expected to have different R/P ratios, particularly when one group produces as much as possible and the second limits their production in order to keep oil prices high.
Also the World Petroleum Assessment by the USGS in 2000 (20 years old, very much in need of an update) had conventional oil technically recoverable resources plus cumulative output at about 3000 Gb, my mean estimate is 200 Gb less than this and also consistent with Jean Laherrere’s 2018 World URR mean estimate.
Ron,
Nowhere did I say Saudi, I said OPEC, I imagine each OPEC nation has internal 2P estimates that are revised over time as technology, prices, and their level of knowledge of their oil resources changes over time. US reserves have grown, and this has likely happened everywhere in the World, but the data from OPEC is not good, so any estimate is speculative.
Here’s a graph from OPEC’s website:
World Proven Crude Oil Reserves 2009-2018
From 2009 to 2018 non-OPEC added 24.6 billion barrels of reserves while OPEC added 186.2 billion barrels of reserves.
186.2/24.6 = 7.6
So OPEC is 7.6 times better than non-OPEC at finding new reserves and 5.0 times worse at producing oil from these reserves.
Your link was broken Frugal, but I fixed it.
Thanks Ron.
Frugal,
Most of that was Orinoco belt resources. If we exclude oil sands in Canada and Orinoco reserves,
we have for non-OPEC 270 Gb in 2005 and 325 Gb in 2018 (an increase of 55Gb or 20%) and for OPEC 933 Gb in 2005 and 981 in 2018 (an increase of 48 Gb or 5%).
Most of that was Orinoco belt resources.
Naw, that was my first thought. But after doing a bit of research I found that Venezuela increased its reserves to that astronomical number in 2010.
That increase is mostly Iran and Iraq in their race to have the second-highest OPEC reserves. Plus a bit more from other OPEC nations doing their thing to increase their reserves as well of course.
Ron,
The majority of Iran, Iraq, Saudi increases happened before 1990, from 2005 to 2018 the increases (using BP Statistical Review of World Energy) in OPEC conventional reserves (excludes Orinoco) were actually less than the increase in non-OPEC reserves (excluding changes in Canadian oil sands reserves). On a percentage basis, the OPEC reserve increases were 4 times less than the non-OPEC increases.
The Venezuelan Orinoco reserves increased from zero in 2005 to 261 Gb in 2018. Total OPEC reserves increased from 933 Gb in 2005 to 1242 Gb in 2018 an increase of 309 Gb, the Orinoco reserve increase accounts for 84.4% of the OPEC increase in reserves over the 2005 to 2018 period.
Oh well: WORLD’S LARGEST PROVEN CRUDE OIL RESERVES BY COUNTRY (2010)
Last January 20th (2010) Venezuela’s Oil Minister, Rafael Ramirez, said that his country had already surpassed Saudi Arabia to become the nation with the largest proven crude oil reserves in the world, at 297 billion barrels.
Ron,
I use BP data from
https://www.bp.com/en/global/corporate/energy-economics/statistical-review-of-world-energy.html
Most of Venezuela’s “proven reserves” for the Orinoco basin are unlikely to ever be produced, probably no more than 75 Gb will be produced, best estimate about 60 Gb total. My recent Oil shock model has extra heavy oil URR of about 150 Gb from 1965 to 2250 (output from Canadian oil sands and Orinoco belt), probably 90 Gb from Canada and 60 Gb from Venezuela. Cumulative extra heavy oil production through the end of 2018 was about 17 Gb, and the model has cumulative extra heavy oil output of 140 Gb through 2100.
My estimate is that much of the proven reserves of extra heavy oil (424 Gb at the end of 2018) will never be extracted, about 291 Gb will be left in the ground.
Ovi,
I assume there will be severe Worldwide economic disruption due to the pandemic, US consumption of C+C fell by over 33% in April. I expect the drop in World output for the year will be somewhat less, the 65 Mb/d is simply a guess. Note that the oil not produced will remain in the ground and can potentially be extracted later, wells not completed now can also be completed later. When oil prices go from $20/bo to $100/bo, there will be many more resources that are profitable to produce.
I expect the new peak between 83 and 87 Mb/d for World C+C will be reached some time between 2025 and 2030, the precise path of output is unknown.
Note that the USGS estimated World C+C URR at about 3000 Gb for conventional resources in 2000, they expect unconventional (they call these continuous resources) to be about 1000 Gb. So about 4000 Gb of C+C for total URR, my estimate is only 75% of this and is quite conservative. For conventional I have 2800 Gb for conventional and for unconventional (tight oil and oil sands) about 250 Gb.
Also note that my current estimate for URR is very close to that of Jean Laherrere, historically his estimates have been quite conservative.
Ovi,
An alternative scenario that matches the 9% decrease in oil consumption for 2020 predicted by the IEA (I have assumed production for the year also falls by 9%). This scenario peaks in 2028 at 84 Mb/d and URR is lower than the previous scenario because I assume in this case extraction rate falls after 2050 as we gradually move to other energy sources for transportation, URR is 2920 Gb, cumulative C+C output through 2019 is about 1400 Gb and cumulative C+C output reaches 1660 Gb at the peak in 2028 (57% of URR). The assumption that the output curve must be symmetrical may not be correct.
Well, the Nov 2018 C+C world peak will stand.
Hightrekker,
Perhaps correct, I only pay attention to annual average output, the 83 Mb/d level of 2018 is likely to be exceeded in the future in my opinion, probably before 2030, I would put the probability at 60%.
The change in productivity per rig is simply to align current tight oil estimates with rig estimates in the DPR, it is simply a model calculation, output per rig (lagged by 2 months) just depends on the output divided by the rigs. The model simply takes total rig count, a better model would look at gas rigs and oil rigs separately and apply each of those counts to a separate oil and gas model, also the counts in the DPR do not seem to match the data from Baker Hughes very well, they also seem to include vertical wells which seems to be a mistake if we are trying to model tight oil.
There are a bunch of problems with the EIA’s DPR model, their “new well oil production per rig” metric is not particularly useful, it can change depending upon the ratio of vertical to horizontal rigs (the horizontal rigs are far more productive) or a change in the ratio of oil rigs to gas rigs (gas rigs don’t lead to much oil output and oil rigs to a lesser extent tend not to increase gas out put by that much (Permian basin may be an exception, but much of the gas produced is flared there).
So bottom line little can be gleaned by changes in rig productivity as reported by the DPR.
The well completions given in the DPR are also problematic, the best data for completion rates is at shaleprofile.com, but they are currently accurate only through about June 2019, after that a model is needed to estimate completion rates, using well profile estimates and tight oil output estimates from the EIA (not from DPR).
Dennis
I don’t understand the first statement in your reply. Attached is a similar table as in the original post above, for February 2017. At that time, average output in the Permian was 664 bbls/rig. In March 2020 it was 807 bbls/rig.
According to previous discussions on this site, productivity increases were related to increases in well length, addition of laterals, number of fracks, sand load, well spacing, etc. Then production per foot appeared to provide additional insight into productivity. So it was these physical improvements that allowed the Permian to go from 664 bbls/rig to 807 bbls/rig. Somewhere along the line I think I read that output per linear well foot had peaked.
As for oil and gas rigs affecting the productivity, the DPR does distinguish between the two.
If I take this statement at face value “output per rig (lagged by 2 months) just depends on the output divided by the rigs, with which I agree. Not sure about the two month lag. Is it the two months associated with the peak LTO output that occurs in the second month of production as shown in the shale profile charts?
So in the post table above, the Permian March number, 807 bbls/rig, reflects what was happening in January 2020. Also the revised April 2020 number, 677 bbls/rig, reflects what was happening in February. From your chart below Frac spreads were still over 300 in February.
Nothing seemed to change in February. So I still don’t understand what could cause such significant drop.
Ovi,
The drop is just a model adjustment, the new well Rig productivity is a calculated number, the DPR gets a bunch of numbers wrong because their model is not very good, well completion numbers are wrong, rig productivity is wrong, output is often wrong and then later revised.
The change from March to April, may be due to a significant revision in output from the March to April report.
Bottom line the drop is not real, it is an artificial drop due to a change in the model. Note that output from the model has been revised significantly in the past few months, the new well productivity per rig had to be revised to match. The change is likely not real, the March model estimate was wrong, April was revised to better reflect reality.
Also keep in mind that new well productivity per rig can change based on what the rigs consist of, the DPR takes total rig count and does not distinguish between oil rigs and gas rigs and between horizontal rigs and vertical rigs. So even if the new well productivity was unchanged, the new well productivity per rig can change if there is a higher proportion of vertical rigs (the vertical wells are lower productivity) or gas rigs (gas rigs tend to produce more gas and less oil) so the amount of new oil produced per rig can change based on the kind of rigs that are running. Assuming the ratios of these various rig types to the total rig count will remain stable seems to be an underlying assumption of the DPR model, it is a very poor assumption as can be seen by simply looking at the Baker Hughes data.
Also if you compare the EIA data for rig counts with Baker Hughes data the numbers don’t match very well, there are just so many problems with the DPR, I simply ignore it, it just is not very useful.
Ovi,
The main point is that new well productivity depends on two factors. Factor one is the average productivity of newly completed wells and factor two is the average number of completions per rig.
You suggest factor one is likely to be the explanation for the change in new well productivity per rig and ask if there could be another explanation. The alternative explanation is a change in factor 2 which can be explained by changing proportions of gas rigs to oil rigs and/or the proportion of horizontal to vertical rigs as well as changing rig efficiency as rigs are added or rigs are stacked, it can also depend on the ratio of frac spreads to drilling rigs.
The data from shaleprofile.com suggests that the actual average well productivity in the Permian basin has been flat to slightly rising over the 2016 to 2019 period, it is too early to evaluate 2020 average well productivity (not enough data), but I suspect any changes in average new well productivity for horizontal oil wells has been minor, if anything I would expect high grading would tend to increase average new well productivity, but the best guess is continued flat average new well productivity.
Frac spread count
https://twitter.com/PrimaryVision/status/1256381399965356035
a snip from 13:43 of video below.
Below I estimate oil focused frac spread count by looking at the relative proportion of horizontal oil rigs (HOR) and horizontal gas rigs to the total horizontal rig (HR) count and dividing up the total frac spread (FS) count between gas frac spreads and oil frac spreads (OFS).
By my estimate the OFS count has fallen by almost a factor of 10 in the past 5 weeks from 205 to 21.
The gas rig count has fallen much less rapidly because we have not seen the same crash in natural gas prices as we have seen in the price of crude oil, so we assume the gas frac spreads have not decreased very much (in comparison to oil frac spreads).
If we consider 4 week average OFS count that has fallen from 243 to 82 in the past 5 weeks, I expect this 4 week average will be under 20 in 4 weeks time and may fall to zero by June 2020.
Frac spread @ 47 down 8
Total US rig count @ 374 down 34
Oil rigs @ 292 down 33.
All numbers are new lows.
WTI @ $24.74
Brent @ $30.97
US Big Oil is losing money during this time, but I can’t imagine that Big Green has stopped advancing its tech. After this pandemic, the market may reboot with the two of them on more even footing and Big Oil won’t have as much political muscle (read: money) to impede them. This whole thing may have a net effect to speed up the adoption of green tech where it can replace oil.
Why do you think there will be an after?
Waah waaahhh.
Ron and shallow.
In the previous thread you were speculating about Alaskan production and TAPS flow.
Alaska has the best data (to my knowledge) in the world and is never more than a few DAYS old.
TAPS flow rates
https://twitter.com/AlyeskaPipeline/status/1254782807835987970?s=20
Production
http://tax.alaska.gov/programs/oil/production/ans.aspx?4/1/2020
The assumptions in this post are on the low side for actual production however if as Shallow says wells are to be shut down it will show in the data within a few days.
Lightsout. Thanks for this info!
Dennis or Ron – I suggest you just ban this chap’s email and ip addresses, then the original log in names should be unaffected.
Concerning BP Reserves. I went and looked at a footnote below their table and Ron’s comment up above about it being a rubber stamp for official sources looks partially and maybe even mostly correct, but not entirely. There’s a lot of wishy-washy words, but the bottom line is they go to secondary sources and what they call third-party sources as well as official sources. They even mentioned the Oil & Gas Journal as a source for their reserves information. Surprising.
George Kaplan wrote:
Dennis or Ron – I suggest you just ban this chap’s email and ip addresses, then the original log in names should be unaffected.
George, when I deleted the post you replied to, your post disappeared also. But this guy uses different email addresses. He is a pro and knows how to get around anything. In this case, he used my email address even though it said “0 approved”.
But the crap he posts are links to stupid right-wing posts. All I can do is delete them. But everyone should know that when I delete them their replies to such posts will be automatically deleted also.
This person is probably using a commercially available VPN (Virtual Private Network)
Like NordVPN (which costs 3 bucks a month)
https://nordvpn.com/
You can dynamically change your IP address at will and block cookies (the way to track people you on internet)
As far as changing email addresses that is trivial as well….just type in whatever one you want.
Not much you can do about it, for free…
Ron,
Perhaps you can use an alternative private email address for your comments (that does not get sent out in bulk emails) and then ban your own email address (the one that is widely known).
Okay, I might try that. I will see if this guy persists in his nonsensual right-wing posts. Such deception is so very typical of a Trumpite. Why are Trumpites so damn dishonest?
“use an alternative private email address for your comments ”
Dennis, do you also think others should change their email address. Its seems as if anyone is vulnerable to this hack.
Hickory,
No need, only Ron and I can see the email you use on POB, this person is using Ron’s email and names that are familiar to fool the system, a few of these may continue to slip through, we will try to delete as we catch them. Mostly we need to be careful about revealing our email addresses on the forum, if it is a concern you could create an email that is never revealed that you only use here, but that might just cause more headaches, let’s try this for now.
Can you deal with the astroturfers that show up too?
NAOM
Not sure what that is.
People are free to disagree or ignore the comments of others.
https://en.wikipedia.org/wiki/Astroturfing
Many just turn up once or twice so ‘Ignore’ won’t help much but they tend to derail discussion which is their intention. Their current target is lifting the lockdown and may well be linked to groups supported to the deVos family who are sponsoring many groups that are driving the open up protests.
NAOM
Too much work to deal with Astroturfers, if we ignore them, maybe they go away.
U.S. Oil Market Setting Up For Another Crash
With the USO ETF (ETP) doing a 1:8 Reverse Split, the BRAINDEAD Retail Investors have come in glorious fashion, buying via a record number of account holders. Furthermore, with the USO ETF now holding about 1/4 of the futures contracts, it will be interesting to see who is left holding the BAG when someone has to take delivery and store the oil.
While 30% of USO ETF holders liquidated positions over the past two days, there are still 145,000 account holders. Will be interesting to see how this plays out.
With the U.S. oil companies selling their oil via the futures, they don’t care who the hell buys the contract, they are covered. So we are going to see a similar MARKET DISASTER when the oil price went to a negative $37. However, it may not take place during the June Contract (May 19th expiration), but most likely during the July Contract (during early June).
As U.S. inventory levels continue to build over the next 2-3 weeks, along with the 40 million barrels of oil heading our way, not including the floating inventory already off the coast of Texas and California, the oil market will destroy the BRAINDEAD Retail USO Investor and Amateur Futures traders.
steve
When will Texas be a Net Oil Importer?
Bakken down 405K/day and falling fast:
Helms said total production curtailed came to 405,000 bpd as of April 24, when the latest data was made available, up from 295,000 bpd reported three days earlier. Producers shut 6,200 of the state’s 16,000 wells, up from 5,000 over the same period.
https://www.reuters.com/article/us-global-oil-shale-north-dakota-insight/like-watching-a-train-wreck-the-coronavirus-effect-on-north-dakota-shale-oilfields-idUSKBN22G1C2
Stephen,
I expect frac spreads in the tight oil plays may fall to zero in May and tight oil completions will be zero.
Based on shaleprofile.com data, if all wells producing less than 100 bo/d were shut in at the end of February, that would have reduced output from 1400 kb/d to about 1000 kb/d. At the end of February there were 10,918 wells producing less than 100 bo/d in North Dakota of 15,780 total wells. Note also that at the end of February only about 14000 of the 15780 wells were producing, so if 6000 of the producing wells were shut in that brings us to about 8000 producing wells, so there are likely about 1100 of the wells that were producing less than 100 bo/d at the end of February, that are still producing if Helms estimates are accurate. Of course the numbers change over time so estimates are rough. In any case a severe drop of 29% in a short period. If the same happens for US tight oil in general, we would see US output drop from 8000 to 5700 kb/d, but note that prices are lowest in the Williston Basin, so we would be likely to see thing shut down there first.
It also depends on how much of output has been hedged, not sure we have a good estimate of that number.
Dennis,
The reason Harold Hamm is shutting in most of his production in the Bakken because NONE OF IT is hedged. Continental Resources is the poster child of what’s wrong with the U.S. Shale Oil Industry.
steve
Steve.
Why wouldn’t companies just cash in the hedges and shut in?
If I was hedged and could do that, I would.
Surprising how once you are shut in, things don’t seem so bad. Employees will be the issue once PPP runs out during June.
However, if the entire US onshore would just not complete a well in May, and shut in the 90+% of wells that can be safely shut in from now till after Memorial Day, this glut would have a large chunk removed.
Shallow,
The situation in the U.S. oil patch is quite a shame. While I realize there are real people behind all these companies, service and etc, no one ever thought about how fragile shale oil production is as an energy source.
And, unfortunately, it’s not just the oil industry that will be in a depression, but also the U.S. economy. With oil being the number one driver of economic growth, most analysts fail to comprehend what is taking place in the United States and world.
steve
“The mass of men lead lives of quiet desperation. What is called resignation is confirmed desperation.”
— Henry David Thoreau, Walden
Dennis.
I suspect the largest drop in percentage terms over 2020 may not be in North Dakota, but instead in Oklahoma.
Enno Peters made his first Oklahoma post, which showed what I expected. Oklahoma shale as an oil producer is a lot of hype, with little to back it up. The wells are expensive, more than other basins, which also doesn’t help.
Rig count has fallen from over 100 one year ago to 15, soon to be near zero.
Also, of the 500K BOPD, around 150K are from stripper wells. After Texas, Oklahoma is the next largest stripper well State both in terms of wells and barrels (although CA might be in the ballpark, I don’t know as much about CA production).
Many stripper wells in OK have been shut in. Add that to a large decline from unconventional wells, it wouldn’t surprise me to see OK hit a low between 100-200K BOPD.
Shallow sand,
Thanks for the heads up, I usually think in terms of the big 4 basins, Permian, Bakken, Eagle Ford and Niobrara. I wasn’t aware Mr Peters had done an Oklahoma blog post, a pretty minor player at only 400 kb/d, though Niobrara is only a bit bigger at a peak of about 600 kb/d.
I agree Oklahoma does not look viable based on well profiles, though I don’t know what the well costs are like there so more analysis would be needed to make a good judgement. The fact that the rig count has dived, suggests it will need high oil prices for further investment. Of course in the present oil price environment there is not any well in the US that makes much sense to produce unless a small amount of production is needed to protect the well. Even in those cases the economics may point to shut in.
Shallow Sand
Out of curiosity, what was so extra revealing in Enno’s Oklahoma post that wasn’t evident in the Oklahoma chart and comments shown in the original post above.
The EIA January/February report shows production in the 530 to 560 kb/d range. Enno is at 384 kb/d from horizontal wells. Add in the 150 from strippers and you get to 534 kb/d. I didn’t know they had so many strippers in Oklahoma.
Ovi,
There is a lot of information in the shaleprofile blog posts, for example the cumulative well profiles as shown in the chart below, maybe 80 kb at 36 months won’t pay for much, at $60/bo at wellhead and assuming 36 month payout we would need a well with full cycle costs of only $2.6 million for a profitable venture, my guess is these wells cost 2 times that amount, so it explains why rig counts have fallen so fast in Oklahoma, you cannot get this level of information from EIA data. The well profiles are under the well quality tab at shale profile, there is also completion data(see well status) and much more, all available for free.
Dennis
I reported on the drop in rigs from January to May 1 and they were down to 13 rigs, a drop of 75%. Also reported on how the Oklahoma Corporation had given the oil companies permission to shut their wells without losing the lease rights. So pretty obvious that output is going to drop precipitously and you could see it starting in the chart.
What tweaked my curiosity was this statement, “Enno Peters made his first Oklahoma post, which showed what I expected”. What was the new piece of information that showed what he expected?
So as I am curious what that extra information was that showed what he expected?
I am not implying that I present all the relevant information. I certainly appreciate information from our participants who are in closer contact with local issues.
I have a vague recollection that SS made a comment, possibly 6 months back that Louisiana was going to drop. I did a bit of digging and found that the Louisiana LTO basin had complex geology that stymied the hopes for a Permian Jr.
As I said, just curious
Ovi,
I am just commenting on what I found interesting, also this is Enno’s first post on Oklahoma so it is new information from a source besides the EIA, some of the EIA data in the DPR does not agree well with Baker-Hughes data and also the completion data is different from the data at shale profile, generally I find the shale profile data to be more accurate.
Another BLOW to Bakken Producers.
North Dakota Light Sweet Crude = NEGATIVE $0.98 a barrel.
steve
Steve:
Plains All American, through its subsidiaries, whacked most everyone onshore lower 48 effective May 1. The same applies for June, although things may get a little better.
This is why you see so many commitments to shut down in May and June, regardless of what happens to WTI in May and June.
Shut ins and complete stoppage of well completion activity will drop US May and June oil production by quite a bit, I predict.
We won’t know the true extent until later in the summer, given reporting lags.
North Dakota will be a good early indicator, as will Alaska. The other states are slower to report.
I guess I should be all doom and gloom, but I guess I just have decided there is no reason to be that way.
I think we hit peak worldwide oil output in 11/18, and it will take a huge amount of CAPEX to get back there.
We can turn our wells on and off, if it weren’t for our employees, this wouldn’t be a big deal to us.
The oil traders (IMO) are going to go way overboard here, as are companies like Plains and their customers, the refiners. The oil price has went way below operating costs, and will stay there too long, creating the possibility of a huge slingshot in the other direction.
Then again, one has to be an eternal optimist to operate stripper wells. My future view may be all wet.
Shallow,
I imagine turning off and on Stripper wells is not that much of a big deal, but correct me if I am wrong… doing the same for Fracked Horizontal Wells is a different monster entirely?
I believe those who manage stripper wells are going to be in the best shape when the oil market recovers, whatever that is going to look like.
However, with $57 trillion of U.S. household wealth tied to Stocks, Mutual Funds, 401ks, and Pension Plans… I don’t believe Americans or Analysts realize a 20-25% collapse in oil demand is destroying this $57 trillion financial ponzi scheme.
Why? Well, a typical ponzi scheme needs new investors funds to continue business as usual. The U.S. $57 trillion Financial Ponzi Scheme (not including the M3 money supply) needed oil production growth (demand) to continue business as usual.
We must remember, oil production growth allows GDP Growth. Without economic growth, or a 20-25% decline, there is no way to generate enough surpluses to prop up the Financial Markets.
No one sees this coming. This is why the Fed is now also buying JUNK ETF’s and JUNK BONDS, the CRAPPIEST financial assets, along with MBS & U.S. Treasuries.
steve
Autos:
“Sales collapsed in the second half of March, and in April were at the lowest level in 50 years – even lower than at the depth of the Great Recession.”
Steve.
There has been some discussion about how the use of locally sourced sand may come back to bite Permian shale operators in the behind.
Apparently it may not be able to hold fractures open due to very high bottom hole pressures that will build during shut in.
Stripper well operators with debt will be hurt much more than those without debt. I suspect stripper well production is not levered like shale.
Shallow,
Closure pressure on proppant within a hydraulic fracture goes up as the well’s BHP goes down. The highest closure stress is at pumped off conditions. When you shut the well in it builds BHP and it reduces the closure stress. The problem comes when you turn the well back on and reduce the BHP. It is mostly referred to a cyclical stress and I agree that the cheaper proppant will not hold up as well.
Regards,
This shutdown damages the wells stuff doesn’t matter. The oil remains underground. If money is not an issue, you can redrill 50 feet away, refrack/recomplete and oil will flow. Should not even call it “re” because it’s the first time for that well.
Eventually, money is not an issue, btw.
If it’s there you go get it. There is no choice. The “company” that goes and gets it doesn’t have to be privately owned. Equinor goes and gets North Sea oil for Norway.
Watcher,
I look forward to the day when money does not matter. Unfortunately that has not happened for me yet, and even if you repeat this a million times I still have to pay for things I need such as food, electricity, etc. On the day that WTI went negative I filled up my car and the gas station still charged me for it!
PS: In my limited experience with Equinor I noticed that even they ran economic projections and seemed to be concerned with making a profit.
And more Energy from that Tankful is rejected out the Radiator than actually used.
It doesn’t matter if you spent meaningless, imaginary substance to pay for your gasoline. What matters is that negative pricing made it 100% clear that it is imaginary in value. This is forever. The truth of what happened will always exist. It can never be denied.
Well, that’s not true. It can be denied. By the delusional.
If you have to have the oil, and you DO have to have the oil, you will go get it regardless of the numbers applied to a substance created from thin air by central banks. Exactly where do we think the money comes from the Fed uses to lend the TRILLIONS in US debt to be incurred this year?
Well for this collapse / step down / depression – watcher has already been proven correct. congress and the Fed stepped up immediately and made every mega-corporation instantly whole and vaccinated against the crises within weeks. You, and the rest of us, simply don’t matter. Excess labor, extra mouths to feed, essentially disposable, even the essential workers.
Socialize the risk
Privatize the profits
Nobody is investing now. When oil demand comes up again, oil price will raise. Depletion and rust never sleeps – and lots of oil countries can’t afford investing right now.
And with oil price at 80$, there will be money to refrack the well – and it will even make money then.
Steve
>We must remember, oil production growth allows GDP Growth.
That’s just plain ridiculous.
LOL,
Alimbiquated says, “That’s just plain ridiculous.”
Funny, it took centuries before most humans believed that the EARTH wasn’t the center of the solar system. You can blame the church on that BLUNDER. Nothing has changed today in regards to IGNORANCE.
Anyhow, it’s been proven OVER and OVER again that the annual increase or decrease in oil production growth is the main driver of global GDP growth.
Maybe if you want to LEARN SOMETHING new, try watching this video:
https://www.youtube.com/watch?v=WGd7EkMhLcU
But, if individuals want to remain IGNORANT… it’s a free world.
steve
Steve,
You have cause and effect reversed. The global economic growth causes the increase in demand for oil which in turn leads to higher production. If that energy need is met by nuclear wind and solar powering electric cars including plugin hybrids then the economy grows without oil demand increasing and your link is broken.
If that energy need is met by nuclear wind and solar powering electric cars including plugin hybrids then the economy grows without oil demand increasing and your link is broken.
If! No, it will not be met by wind, solar, or nuclear. How many long haul trucks are battery powered? How about aircraft, or ships at sea, or tractors in the field, or combines, or construction vehicles such as backhoes, bulldozers, and other such? No, just a few passenger cars and a precious few at that.
According to Fish’s comment yesterday, in 2019, 133,241 TWh of energy (96.4%) of energy was generated by Oil, Coal, and Natural gas. 4,980 TWh (3.6%) was generated by nuclear, wind, and solar. Only 2,335 TWh (1.69%) was generated by wind and solar.
I know it is very easy to play (If) Dennis. But we are dealing with reality here. Any increase in energy demand will be met by oil, coal, and natural gas, not wind or solar. Sure wind and solar will increase somewhat, a tiny fraction of 1% of the total.
That’s primary energy and not final consumption. Most of that “energy” generated by FF is wasted as heat in boilers, trucks, cars, etc., You dont need 1 on 1 substitution. Lawrence Livermore Lab gives a detailed split on used and wasted energy every year for US if you are interested in a deep dive.
For example, it is estimated that US annual electricity demand will go up 2000 TWh from 4000 TWh to 6000 TWh if ALL transport is electrified. Assuming roughly that US is 1/5th of all crude demand, the whole world will require somewhere in the ballpark of 10000 TWh. This is roughly 1/5th of the crude oil energy from that chart.
Next, coal generation worldwide is on a undulating plateau oscillating between 9500 to 10500 TWh for the past 6 years (2014 – 2019). That’s the useful energy we got. Let’s take the average and say 10000 TWh which is 1/4th of the number from that chart.
Same for natural gas too. While it’s true that the primary energy from FF is in the ballpark of 130,000 TWh, to replace it from renewable electricity, we need only somewhere in the ballpark of 30000 TWh per annum. Still huge and still a big challenge but this is the right perspective and magnitude. Now the 5000 TWh from nuclear, wind and solar and another 4000 TWh from hydro doesnt look too small does it?
That’s primary energy and not final consumption.
No, it is energy generated or produced, whichever term you choose to use.
T Shyam wasted heat is not recorded or counted anywhere. A coal-fired power plant is from 32% to 42% efficient. A combined-cycle natural gas plant is from 55% to 62% efficient. The rest wasted. But only the power generated, or horsepower generated is ever counted in terawatt-hours.
So X amount of oil, or coal, or natural gas generates X amount of terawatt-hours of electricity or whatever form of power you are generating. Wasted heat does not generate any terawatt-hours of electricity.
Ron,
You can find all the data on coal here:
https://www.carbonbrief.org/mapped-worlds-coal-power-plants
Coal DID NOT generate 42,000 TWh in 2019. It generated 9843 TWh.
Worldwide coal fleet is only 2100 GW. It cant generate more than 18000 TWh even if they are running flat out (100%) for crying out loud. And the CF was only 54% last year.
http://peakoilbarrel.com/eias-electric-power-monthly-april-2020-edition-with-data-for-february-2020/#comment-702184
There you go Ron. This comment settles it. GF has clearly stated in the reply that it is primary energy whatever his source is.
Coal DID NOT generate 42,000 TWh in 2019. It generated 9843 TWh.
Okay, I am going to need your math on this one. Nowhere in the link you posted is there anything that indicates your above figures.
Oil is measured in barrels, coal in tons, natural gas in cubic feet. They are not measured in terawatt-hours. Only the energy they generate can be measured in terawatt-hours. Energy is energy generated. That is just common sense.
It is there on the corbonbrief link I posted. An interactive graph (4th picture) gives the total worldwide coal energy generated along with total coal plants capacity, load factor, emissions. Everything is available. It is even split into top 10 individual countries and the change over time for each country is also available. In 2019, 9843 TWh of coal power was generated by a fleet of 2100 GW coal power plants with a load factor of 54%. Its all there.
Ron the point is that much less wind and solar is needed to replace the energy used to produce those TWh of electricity currently produced by coal and natural gas.
Gonefishing’s chart may have converted all of the energy from fossil fuel into TWh, not the proper way to do things. US BP data for electricity
coal-10000 TWh
natural gas-6200 TWh
oil-800 TWh
total electricity-26600 TWh
If we take total oil consumed in 2018 and convert to TWh (ignoring thermal losses) we get 54219 TWh, for coal it is 43869 TWh, and for natural gas about 38483 TWh.
The problem with each of these figures are that it does not account for thermal losses, so for oil it should be 16265 TWh when we account for the thermal losses for an ICE vehicle, for coal 15354 TWh when we account for thermal losses in the use of coal, and for natural gas perhaps 17317 as not all natural gas is burned in combined cycle power plants, traditional biofuel is about 30% efficient so that would be 3220 TWh.
Absolutely true that wind, solar, hydro, nuclear, and biofuel proportion is small.
For fossil fuel we have 48936 TWh, and for everything else about 12780 TWh, so about 21% of total energy use (excluding thermal losses) is from non-fossil fuel.
solar and wind power output are growing pretty fast (30% for solar and 15% for wind) over the past 5 years. If those rates of growth continue or accelerate, fossil fuel use will diminish over next 30 years.
In 2018 about 68 Mb/d of middle and light distillates were consumed and of this total about 26 Mb/d was gasoline, about 38% of the total middle and light distillates and 31% of C+C output, much of the gasoline use can be replaced with EVs over time, or simply eliminated.
Iron Mike,
No it doesn’t work that way because for solar we are not measuring the energy of incident light but only the amount of energy generated. So 706 TWh solar production in 2019 means 706 TWh of electricity generated and sent to the power lines. Ofcourse the energy which was incident on the panels would be 4 or 5 times that but 706 TWh was produced and transmitted.
On the other hand, 42000 TWh of primary energy from coal means 42000 TWh of energy could have been generated by coal if we would have burnt all that coal in boilers with 100% efficiency. In other words, all the coal mined last year had 42000 TWh of energy within them. We could extract only roughly 10000 TWh from it.
I will stop posting on this thread from now on. I mean it’s not that this is some state secret or some highly classified information. Coal generated 10000 TWh energy last year from a fleet of 2100 GW. Period. It’s all over the place and can be verified easily from multiple sources of very reliable information. Neither is it a very complicated physics that only PhD’s can grasp. It’s pretty straight forward, intuitive and I thought a highly educated and energy oriented blog like this would understand it pretty fast. 42000 TWh cant be generated from 2100 GW fleet in a year. Its theoretically impossible. 1 year is only 8760 hours.
Okay, I concede. But the link still stands. Wind and solar are next to nothing when compared to fossil fuel. And no, not even five billion people will ever live on this planet again without fossil fuel.
The long term carrying capacity of planet earth is likely less than one billion people. And that will be after we have killed off every other species of megafauna living today.
But not to worry. Rats, mice, and other small vermin will survive.
Ron,
No no no.. US produced 966 TWh from coal in 2019. 10000 TWh is the global number. Come on Ron, the US data gets posted every month by Islandboy. The total electricity market of US itself is only 4000 TWh. Coal cant contribute 10000 TWh in US.
And the BP statistical review clearly states it as primary energy. It cant be any clearer. I know I said I wouldnt post again and I am sorry but I am really not going to post again in this thread anymore. It’s so elementary. If you still think coal “produced” 42000 TWh last year, so be it. I dont care anymore.
T Shyam,
You are correct. Ron the usage of the word primary is the pre-efficiency calculation. They should have put the final consumption by source to include the efficiency calculations.
Dennis,
US BP data for electricity
coal-10000 TWh
natural gas-6200 TWh
oil-800 TWh
total electricity-26600 TWh
I think those stats are from BP but for world electricity generation in 2018.
Iron Mike,
Correct, those numbers are 2018, doubt they changed much in 2019, though solar and wind might be a bit higher.
Ron,
Just talking about oil here, so you have moved the goal posts a bit by talking about total energy use.
light vehicles use a large proportion of C+C in much of the World, currently gasoline use in the US gas been cut by 40%, and World demand is expected to fall by 10% in 2020 by the IEA, and estimate you believe is too low. I actually am agreeing with you that demand for oil will fall for multiple reasons, in much of the World coal use has fallen and production of coal peaked in 2013 at the World level. Yes natural gas will be used to produce electricity, until it becomes more expensive than wind and solar which will gradually replace it.
Using BP data electricity produced by sources other than coal, oil, and natural gas accounted for 35.8% of electricity produced in the World in 2018. Coal is becoming more expensive relative to natural gas and wind and solar and very little new coal power will be installed, it will gradually be replaced by cheaper resources, then the same will occur for natural gas.
Dennis,
With all due respect, all the information you have presented in regards to Solar & Wind is totally BOGUS and SHYTE.
I gather YOU DID NOT WATCH the video.
Wind and Solar can’t replace Fossil Fuels. Anyone who believes that, also believes in the ENERGY TOOTH FAIRY.
steve
Steve,
The future is unknown, the data on electricity produced by varios fuels is straight from BP Statistical review of World Energy.
Are you talking about the video that used information on solar and wind from 20 years ago?
The technology has come a long way in 20 years and wind and solar are the cheapest forms of energy in many locations, as fossil fuel depletes it will become relatively more expensive while at the same time the cost of wind and solar will continue to fall, the economics is fairly straightforward.
In short I disagree strongly.
Growth rates of wind and solar have been strong and this is likely to continue.
You have two variables that are correlated, World GDP and oil consumption, that is all. You assume oil consumption growth causes World GDP growth, I assume the reverse. If the energy provided by oil is provided by some other form of energy, it could be natural gas, nuclear, coal, wind, solar or hydro or any combination of those six sources then powering EVs and/or electrified rail then oil use can be reduced while economic output continues to grow.
That some don’t see this being possible suggests little imagination from my perspective.
Steve,
Look at BP Statistical Review and Wind and Solar electricity production from 2011 to 2018 as well as total electricity generation growth over the same period.
For all electricity generation for the World in TWh the growth rate from 2011 to 2018 was about 2.44% per year, for solar it was 30%/year, and for wind it was 15% per year. If we assume these rates of growth continue until 2030 and that the output from hydro and nuclear remain flat at the 2018 level, then 100% of 2030 electricity output would be covered by wind, solar, hydro, and nuclear power. It is possible that higher growth of electricity output might occur as more EVs come to market.
As a quick back of envelope calculation, lets say there are 250 million Tesla model 3 like cars on the road in 2030 and each of these cars are driven 15,000 miles per year on average at 250 Whr per mile. That would be 3750 kWhr per vehicle and 937.5 TWh, for 500 million such light vehicles at 15k miles per year it would be 1875 TWhr and for a billion such vehicles it would be 3750 TWhr. Today heavy vehicles use about half of all fuel in the US so for all land transport we might need 7500 TWhr to 10000 TWhr. We will not reach this point until 2035 to 2040, plenty of time to grow electricity output that much between 2030 and 2040, also possible we may drive less due to social changes such as telecommuting and online shopping. Miles travelled per capita may decrease over time.
Steve,
The proper way to compare is either Real GDP to oil consumption or GDP per capita vs oil consumption per capita.
Fairly basic stuff. Oil and GDP correlate well since 1983, if we look at 1965 to 2018, not so much, there was a paradigm shift in 1979, it could happen again in the future, perhaps very soon.
Hi Shallow,
what has Plains All American done since May,1? Have pricing rules changed?
Thanks, Dean
I have been told that Plains slashed a few posted prices and eliminated a lot of bonuses to posted prices effective 5/1/20, because the contracts they had with producers required 30 day termination notices. Those letters were sent late March, effective 5/1/20.
Probably why Williston light sweet went negative despite higher NYMEX WTI.
Some cups runneth over!
https://twitter.com/maindataUK/status/1256919917854707712
3 million children died of hunger last year.
https://www.theworldcounts.com/challenges/people-and-poverty/hunger-and-obesity/how-many-people-die-from-hunger-each-year
and the year before and the year before, and the world hardly blinked.
3.5 million die from disgusting poisoned water.
https://www.theworldcounts.com/challenges/planet-earth/freshwater/deaths-from-dirty-water
and the world put 0.001% of it’s GDP into saving these lives.
A virus comes along that can kill a few hundred thousand rich old people per year and these rich people engineer the total shutdown of the world, at the cost of What? $30 trillion $40 trillion by the time all is counted?
How many poor people and people with small businesses have been destroyed by this. How many on the breadline in Asia, Africa and South America will die.
The virus does not kill healthy people, it kills people who have underlying health conditions most of which are self inflicted.
Obesity, is self inflicted, every person I know who is overweight eats lots more than they should and they hardly ever do any exercise at all. Obesity causes high blood pressure, diabetes, heart disease and strokes.
2.8 MILLION people die from obesity each year.
Why are we spending $30 trillion saving rich fat old people while 3 million children die because they have never eaten enough food?
My friends want to work, they are fit and healthy. If the virus is so bad, why are the rich telling us that it is still OK for food pickers to work, and food processors to work and food retail assistants to work.
COVID death rate for fit, healthy people is 0.02% even less than flu.
If you don’t want to die of COVID you stay at home
Great post. Agree 100%
“The virus does not kill healthy people, it kills people who have underlying health conditions most of which are self inflicted.”
Wrong, just, simply, wrong.
NAOM
Can you show some documentation to show that this comment is wrong. All the data I have available supports this statement.
The virus does not kill healthy people, it kills people who have underlying health conditions most of which are self inflicted.
The statement is just so goddamn stupid it needs no refutation. This virus often kills very healthy people. It sometimes kills infants. It wipes out old people in nursing homes.
And to say that most underlying health conditions are self-inflicted is by far and away the stupidest thing I have ever read. Is congestive heart failure self-inflicted? How about juvenal diabetics? But does it really matter? No one lives a perfectly healthy lifestyle, no one! That statement sounds like something a heartless dumbass Trumpite would say? “Yeah, it’s their own fault so let them die.”
How exactly does COVID-19 kill people?
When the coronavirus enters the respiratory system, it replicates, attacks, and destroys healthy lung cells. Our bodies are programmed to fight this, but, ironically, the immune response meant to protect us can cause more damage.
Attacking the virus creates inflammation. When that occurs, more lung tissue can be compromised, which can make a person more susceptible to pneumonia.
My understanding of the virus attack from reading how it works is as follows.
It gets into your system via the mouth and nose and then heads for the throat. If it stays in the nose and throat region primarily, you have have a mild response. If it can migrate down to the lungs, that’s when it gets more serious.
Not a doctor
Ovi,
Yes.
That’s why it is important to wear a mask in busy places like supermarkets and public transport. Masks prevent most lunginfections.
I don’t understand why countries don’t learn from especially China, Hong Kong, Singapore, S-Korea, Japan and Austria
“Attacking the virus creates inflammation. When that occurs, more lung tissue can be compromised, which can make a person more susceptible to pneumonia.”
Ron,
That’s correct. And overreaction of the immune system can cause a cytokine storm. Young and healthy people can die because of that. Or seemingly healthy people, who have f.e. low vitamin D plasma levels.
The Spanish flu pandemic killed mostly young, healthy adults, because of a cytokine storm.
All the data I have available supports this statement.
From “COVID-19: Damage found in multiple organ systems” (https://www.mdlinx.com/internal-medicine/article/6870)
From A subset of patients with COVID-19 who had been previously healthy and had no underlying cardiac problems are now developing severe, sudden inflammation of the heart muscles as a result of a direct attack by the virus. This inflammation can cause rhythm disturbances and muscle damage, interfering with the heart’s ability to effectively pump blood throughout the body.
That’s just for starters. There are lots of similar articles, not to mention the widely reported incidences of stroke and blood clotting in younger cases.
The excess death statistics (https://www.washingtonpost.com/investigations/2020/05/02/excess-deaths-during-covid-19/ ) suggest that more people are dying from Covid than official reports indicate: there is probably a huge pool of unreported cases. Since deaths in Nursing Homes are the most likely to be tested and recorded as Covid, it is possible (and in my opinion, likely) that the old and feeble are over-represented in the current uncorrected count. We don’t know how many of the excess deaths fall outside the “old with pre-existing conditions” range.
To summarize: We don’t know enough, and some of what we know is probably incorrect. We should not be basing policies affecting the health of millions on bad data and bad science. Until we know more, we should be exercising extreme caution.
“The virus does not kill healthy people, it kills people who have underlying health conditions most of which are self inflicted.”
is an obviously false statement, two false statements in fact. There is a lot of data to support that those statement are false, and it’s not hard to find and understand it if you have high school. So, lets save ourselves a few yards of rubbish and not degrade this fine blog with such utter nonsense.
The others have given you plenty of material. I suggest you read the reports on infections and some of the scientific, but lighter weight, reports too rather than Republican/Conservative propaganda. The information is out there and easy to find so I won’t waste my time doing your looking for you. Oh, and if you spread this sort of misinformation you may well be contributing to 1 or more peoples’ death.
NAOM
Wayne will come to find out, very slowly if he is lucky,
that the passage of time is self-inflicted.
There is, of course, only one way for a person to prevent it.
Your choice.
hey Wayne, the current worldwide death rate for all known cases is 6.9%, as of today.
Lets acknowledge that the eventual true death rate will be much lower, since many exposures result in asymptomatic outcomes.
Lets guess that instead of 6.9%, it is 10-fold lower. Thats 0.69%
7.8Billion times 0.69% = 53,820,000 deaths (not a few hundred thousand as you indicated)
Nothing to sneeze at. Put it in your equation.
btw- about 20% of deaths in the usa have been at below age 64, thus far.
The first question that comes to my mind is what percentage of that 20% (below age 64) had pre-existing conditions? We need accurate data. According to NAOM if you post bad info on this blog it will kill people.
Thanks,
If people do things because of bad info it can have serious impact which is why posting information from conservative cheergroups is a bad idea when it comes to serious diseases such as Covid-19. For example taking bleach or medication that has not been prescribed. If people get the idea that they are young, healthy, and so will not be affected then a significant number of them will be in for a very bad time. Even if 1/2 of the number that Hickory mentions, ie 10%, had pre-existing conditions, a number I feel is too high, then that still means over seven and a half thousand deaths. That doesn’t even start to cover those who recover from the virus and are left with long convalescence periods or long term lung, heart, kidney, brain damage either.
NAOM
The first question that comes to my mind is what percentage of that 20% (below age 64) had pre-existing conditions?
No one knows. We don’t know, and will probably never know, the early numbers, because there weren’t autopsies or tests to determine who died of what.
Now that that’s out of the way….are you stupid enough to dive into a swimming pool if you don’t know how deep it is?
Anyone who says we have to open now doesn’t care if you live or die. They know nothing, and they either don’t know they know nothing, or they are wearing masks and keeping their distance.
And not telling you.
Quiet One. We don’t know. Asthma and high blood pressure, for example, are common, doesn’t make you expendable.
I should also mention that once 60-70% or so get exposed, the virus should peter out [herd immunity] unless it mutates.
Unless > until
Hickory,
Thanks for the reply. In my state (Colorado) they give statistics by decades so I cannot compare to 65 and under. I see that 60 years and under account for less than 9%, and above that age it truly does go up fast. The 60-69 group accounts for 13%, and over 50% of the deaths come from people 80 years or older. On the opposite side the age group of 19 and under accounts for 0.21% of the deaths, and that one teenager did have a per-existing condition it was reported on a local newscast.
As for pre-existing conditions I have not seen it reported (and have not looked very hard), but I find it hard to believe there are not decent estimates of what the percentages of deaths occur with pre-existing conditions. It has been widely publicized for weeks now that elderly and those with pre-existing conditions should take extra precautions. I guess I am surprised if this has not been narrowed down by now.
Finally, I absolutely am not one to set policy for other people and I want nothing to do with that argument. However, at some point the states and countries around the world will decide to open up and have been doing so. I think that means that statistically some people will be expendable.
Lloyd, of course I would not dive in a swimming pool without knowing the depth. However, it is pretty good darn easy to figure out how deep a pool is. At least it always has been for me.
NAOM, I guess I am old enough that I am very skeptical of the internet. I would also never drink bleach.
Lloyd, of course I would not dive in a swimming pool without knowing the depth. However, it is pretty good darn easy to figure out how deep a pool is. At least it always has been for me.
Excess U.S. deaths hit estimated 37,100 in pandemic’s early days, far more than previously known
https://www.washingtonpost.com/investigations/2020/05/02/excess-deaths-during-covid-19/
“I think people need to be aware that the data they’re seeing on deaths is very incomplete,” said Dan Weinberger, a Yale professor of epidemiology who led the analysis for The Post.
Only about two thirds of the US excess deaths are reported as Covid, so your statistics are, essentially, meaningless. You can’t tell how deep the pool is.
And until there is consistent testing and reporting, you won’t be able to figure out how deep the pool is.
Lloyd,
I cannot argue that the data is still early and incomplete. However, I pretty much think you are essentially “blind” if you can’t see something from the data at this point.
Cheers,
I cannot argue that the data is still early and incomplete.
Then why are you arguing?
However, I pretty much think you are essentially “blind” if you can’t see something from the data at this point.
To which I say: you are a short-sighted moron who doesn’t do his research and refuses to back down when called out.
So fuck you.
Cheers!
Lloyd,
The data is early and is still coming in, but it overwhelmingly points to the fact that this pandemic horribly affects old people and young healthy people are much less affected. I guess you see it differently and on that we disagree.
@Quiet_one
Don’t forget that the young and healthy people are still badly affected and are still up against a fearsome disease. Survivors may still have to face up to long term or life long damage. Recuperation may take weeks or months. Only 1 example of many but one young and healthy individual lost a leg.
NAOM
PS did some digging and you really need to be early 20s and below to benefit from lower death risk from Covid-19. 75 is only about 10x the rate of 20-40. Cardiovascular conditions are the worst with diabetes following, neither of those need be attributed to lifestyle.
Above may vary with sources used and countries.
Quiet One- “Finally, I absolutely am not one to set policy for other people and I want nothing to do with that argument.”
I am with you on that. Not my career choice.
But I do think those policy decisions should be made by serious adults who base the analysis on the best data, science, and advice of experts as they can find. Not just their hunch, or based on their personal economic or political aspirations, if you catch my drift.
“I guess I am old enough that I am very skeptical of the internet. I would also never drink bleach.”
Good to hear it. Unfortunately others are not so it is best to be cautious over what information you spread.
No, the statistics are not complete but that doesn’t mean they should be ignored. Part of that reason is that the government has been trying to play down and hide what has been going on, particularly by withholding tests. Another factor has been that the effort has been put into fighting the disease, the epidemiology will follow up behind.
What is clear is that those nations who acted early and acted hard are in a very much better position than the USA. It did not mean people needed to be expendable
How would you decide who is expendable? That one is overweight, get him up against the wall. That one has blood pressure, get him up against the wall. That one doesn’t look right, get him up against the wall. It is a small step from deciding some are expendable to putting them into a ward just to die. It is a small step to go from there to giving them a poison. It is a small step to refusing them entry to the hospital. It is a small step to refusing care at home.
This has happened before and must never happen again.
NAOM
NAOM,
I do not know of anyone who disagreed with the stay at home order once they understood the concept of not overwhelming the medical system. At this point however, all reports I hear are that this is not currently a concern with the caveat that it can change again going forward. I actually have confidence in my government, the people running the health care system, and citizenry to not overwhelm the medical system now that the disease is not quite as novel. I know others will disagree and that other parts of the country did get overwhelmed.
Also, I could not reply to your more recent comment above because it was too many levels down, but I have tried to attached a screen shot of the statistics I see in Colorado. The overall case numbers change and are updated for missed reports everyday, but this distribution of deaths by age group is changing very slowly at this point. These statistics are put out by the Colorado Department of Public Health everyday.
Curious. In this time frame, as in right now, what hedges would producers be applying?
Would they be betting up or down, and by how much? I think SS recently said that hedging is a real bother and difficult and you never know if you’ve guessed right or not, and so many small players don’t hedge. So maybe the question is two-part, who hedges, and which direction right now?
As for financial consequences of what has taken place and what has been done in response to what has taken place, the world is going to cooperate. In this case the word world refers to central banks. Once again they will not be operating in their national interest. They’ll be operating in a fashion they believe undercuts systemic risk. This has been going on for about 11 years.
For example, it is a global risk of disintegration were the Japanese yen to collapse in value. So in general that is not permitted. No matter how well deserved it is not allowed. It will become astonishing that the US dollar will not reflect a country running a nearly 30% deficit to GDP ratio. That cannot be allowed and it won’t be.
The disconnect between economics and finance is going to grow. Tourism is about 8% of global GDP. That’s not much. Losing it will not crush economies by itself. The threat to GDP is the loss of consumerism. The rest of this year is going to ask the question of what happens when people just don’t buy stuff anymore.
Overall, it might be useful to just keep one overriding thing in mind. This crisis is economic. The crisis in 2008 was financial. They aren’t the same thing.
Watcher, I am in agreement with the post , but must add that there will be a tipping point when all the money printing , financial shenanigans will fail .It cannot go to infinity . No tree grows to the sky . What is unsustainable will stop . Of course ,timing it is the question . Any guess on the time scale ? My take it starts from July from where the wheels will start wobbling and if we land up to the end of the year without a collapse ( could be social,political,international trade ,financial etc) we will be lucky .
Shale oil in Argentina, probably the most likely place for shale oil to develop outside the US, is living up to its name of being a dead cow. Rig count fell from 38 in March to 0 in April. Argentina’s government is considering a price floor for oil of $45, but they are drowning in debt and there is no money for this subsidy, so it’s very unlikely to happen. So shale oil will likely remain a US phenomenon and it’s peak is almost certainly past us, as the level of financing seen in the 10s will not be repeated.
https://oilprice.com/Energy/Energy-General/Oil-Price-Crash-Hits-Latin-American-Drillers-Hard.html
Thanks Stephen for the info . This was on my mind to ask the relevant question . The shale story is over , and no one is going to put Humpty Dumpty back again .
hole in head,
The sentiment was the same in 2015 and 2016 when oil prices crashed. If oil prices remain under $30/bo for the long term you will be correct. Odds are low that oil prices will remain low for the long term (say for the next 5 to 10 years).
We will talk in 3 years at which time I expect US tight oil output will be rising and after 10 years (in 2030) will have surpassed the previous annual peak in 2019. This scenario assumes a very gradual recovery in tight oil output from a low in 2022 of 3.3 Mb/d (annual average output of tight oil in the US) to a new annual average output peak of 8 Mb/d in 2033.
One in infinity chance of being correct as usual, Dennis ?
Stephen
Of course, but I would put equal odds of a peak in World C+C output for the centered 12 month average output occurring either before or after 2029, with a 4 in 5 chance it will occur between 2025 and 2033. The precise path of output I have zero chance of predicting.
Stephen,
An alternative scenario is further down thread, my guess is that something that low or lower has only about a 1 in 20 chance of being correct. Though from an environmental perspective it might be preferable (assuming it would not cause other unforeseen environmental damage).
Thanks, Dennis, I was just yanking your chain a bit. We can all compare our thoughts in Dec 2019 of what our estimates of what the oil situation was going to be in 2020, and the reality of where it is today, and conclude definitively:
No one has a clue what the energy situation will be like in 2028.
I just don’t see investors jumping back on the shale oil bandwagon when it’s basically been a dumpster fire the last ten years. Find something else to throw their money away on like glow-in-the-dark nipple rings or massage parlors for cats…
Stephen,
If oil prices are under $50/bo in 2020 $ I agree, little tight oil output. At some point oil supply might become short and oil prices may rise to over $70/bo in 2020$, at that point there could be some tight oil output resurgence (though perhaps not to previous level).
On your main point, I agree nobody knows what happens in 2020, every year further into the future becomes more speculative, I just do the models with a certain set of assumptions (which change over time), in every case the assumptions are very unlikely to be correct.
Dennis, I have said this earlier that we have entered phase change . In phase change past experiences and events are immaterial . When a caterpillar becomes a butterfly it is no more a centipede . Referring to the human body,when a girl reaches puberty she is a woman . Phase change means no going back and putting humpty dumpty back again ,$ 80 oil,$ 1000000 oil is immaterial .
HIH,
Wayyy too pessimistic. Phase change? Come on… Have faith in humanity. This bump in the road is minor. We have adapted and will continue to adapt and change and conquer…. eventually evolving back to our happy place of late 2019. Like a marble rolling in a bowl, it always finds its center. And that center for humanity is comfort, convenience and control. With all of these, it require altering molecules, which means massive energy use. Phase change is for basic chemistry, not for humanity and its enduring spirit that can’t be quantified.
I live in central Texas…. traffic is back… parking lots are plump and yard parties are everywhere… and the general consensus among the non-politician people is that we are done quarantining. We would rather battle the disease facing it with dignity than sitting in the dark avoiding it. Fear has faded and so are our masks.
So says one person. I live in central Texas and there are plenty of people who do not agree with you, are still wearing masks and battle the ignorance of those you reference on a daily basis. Perhaps you forgot your /sarc notation.
Gunga, I have absolute faith that humanity will screw up this crisis more than it is already screwed up . Absolute faith, no doubts on that . In this age, the blind lead the dumb and deaf . Phase change has been explained in my earlier post so no need to elaborate . Texas is not the world . This is a worldwide crisis .There is no going back to normal because normal has left the station .
Disclaimer ; I am not a pessimist ,just a disappointed optimist . They are also called realists . 🙂
Hole in head,
I believe laws of physics are likely to apply, I also doubt market economics will no longer apply in the future.
Though I agree social structure might change, I expect such change will require 30 years to become apparent.
Hole in head,
Thinking on it further, I think one aspect that may be correct is that a new way of doing things, such as more telecommuting, more distance learning, less physical retail shopping, and less eating at restaurants etc may be changes that become permanent and tus would result in considerably less demand for transport and thus lower demand for liquid petroleum fuel.
I do expect demand will increase from current levels, but perhaps may never return to the previous level.
Perhaps this is part of the phase change you refer to and if so, that part makes sense to me. In addition I would agree these changes are likely to lead to other changes which I cannot predict, a “butterfly” effect as it were. 🙂
Perhaps your metaphor was supposed to suggest this, which I missed initially, if that was your intention.
Holeinhead,
If we assume no new tight oil completions in the future and extra heavy oil output remains flat at 2019 level until 2070, under a low oil price scenario due to lack of oil demand we might see a scenario along the lines below if my guesses for future convention extraction rates and C+C URR estimates are roughly correct (unlikely). In any case, if there is low oil demand over the long term due to changes in social behavior, the peak in World C+C output will have been 2018, this scenario would be my preference, but I like to be realistic, I am not that much of an optimist. 🙂
I call this the butterfly scenario.
Dennis ,of your three posts you have got some wrong some right .
First the butterfly effect the exact quote is “I knew the power of a single wish, after all. Invisible and inevitable, like a butterfly that beats its wings in one corner of the globe and with that single action changes the weather halfway across the world.” This is the original quote which means that a small event can set of a chain reaction to a much larger event .
Yes ,the corona virus would qualify for that though I would say it is a black swan(Taleb says it is not ).The butterfly example that I set out means phase change which is different . If you were to put up a picture of a caterpillar alongside with that of the butterfly anyone who is unschooled would say ^ not possible^, how can such a beautiful creature come from a hideous caterpillar . Absolute transformation . One crawls ,the other flies etc etc .
As to things like telecommuting ,online shopping etc , my view is that services support physical manufacturing . Yes basic services like barbers , shoe repairers etc can survive on their own but as you go up the chain to high tech services they must be supportive of some sort of a physical operation or production . You can order from Amazon(a service) but then someone manufactured the DVD ,someone printed the book, someone packed it ,someone delivered it to you . All the process from ordering to your getting the book was tracked by service sector but at the end of the day it was a physical operation that gave the need for tracking . Further not all operations of our daily life can be transferred to telework . Fruits and vegetables have to be handpicked , same with meat plants ,shelves have to be stocked etc . In my opinion telework is over hyped just like renewables .
I have earlier also posted that in my view in the current situation it is not going to be ^ demand and supply^ that will be the fulcrum but ^ affordability ^ . I still remember an interview of Matt Simmons where he said ^Before you see lines at the pump ,you will see an economic collapse ^ . During the depression a bag of potatoes was available for 25 cents ,the problem was no one had 25 cents . That is the direction where we are headed . The oil will stay in the ground because the public will not be able to afford it .
The world is going to have an economic realignment , the middle class will be decimated , instead of ^the upper middle class^ we will have ^ an upper poverty class ^, the ^ lower middle class^ will become ^lower poverty class ^ , the poor will become destitute and what the destitute will become is unthinkable . Not a pleasant scenario ,very depressing ,but then the doctor is not your friend .
Hole in head,
You assume what you try to prove. All the physical stuff you are talking about is called economic activity, seems you expect little of that will change, so I guess you are expecting that economic growth will cease, because economic growth leads to an increase in income and the general tendency of real prices to fall as goods are manufactured more efficiently leads to higher rather than lower affordability. The main problem is the elimination of the progressive income tax system and an unfair tax code that taxes the wealthy at lower rates for capital gains and dividend income (most of this income flows to the wealthy). Those types of income should be taxed at exactly the same rates as wages and interest income.
In any case the lack of affordibilty argument is completely unconvincing.
It seems to me that fewer people travelling to work and to stores to shop, might reduce fuel use for transport.
My expectation is a drop in economic output during the pandemic and a return to similar rates of growth (or possibly higher due to pent up demand) as the resent past (about 3% World real GDP growth).
I guess we simply see things differently, the transformation that you seem to envision, seems a temporary crisis which will lead to some change, but unclear that it will be transformative.
Regional Manufacturing Surveys in April…
New York (Empire): -78 (lowest ever)
Philadelphia Fed: -57 (lowest ever)
Kansas City Fed: -30 (lowest ever)
Richmond Fed: -53 (lowest ever)
Dallas Fed: -74 (lowest ever)
Here is Europe for you
Netherlands: 41.3 (lowest since 2009)
Ireland: 36.0 (lowest since 2009)
Germany: 34.5 (lowest since 2009)
Austria: 31.6 (all-time low)
France: 31.5 (all-time low)
Italy: 31.1 (all-time low)
Spain: 30.8 (lowest since 2009)
Greece: 29.5 (all-time low)
In Germany, whose economy is heavily dependent on manufacturing, and on exports of manufactured goods, the IHS Manufacturing PMI for April dropped to 34.5. This was 2.5 points above the low in December 2008 during the Financial Crisis.
No way out .
hole in head,
I agree the current economic conditions are extremely bad. An assumption that this will continue indefinitely is a poor one in my opinion. I do not expect as quick a recovery as occurred after the GFC, difficult to predict, but my WAG is that by 2025 World real GDP will have returned to 2019 level.
Dennis , just going by the indices you can see they are either ^ lowest ever^ or ^lowest since 2009 ^ . It took us 11 years from 2009 to Jan 2020 to be where we were before the virus hit . Your estimate to 2025 is way optimistic . Returning to my earlier observation ^ you have to cross the short and the medium term to get to the long term^ How are we going to get there ? It is one heck of a incline,from where we stand today .
You are missing out that the GFC 2008 was a liquidity crisis which was tackled by printing almost $ 16 -20 trillion . The current crisis is a solvency crisis . The world is just insolvent and QE infinity is not going to solve this . The IMF reported that about 80 countries have asked them for assistance ,so bad is the situation .
hole in head,
I don’ t think either of us knows what will happen. The various “sentiment” indices can change very quickly. The economy has been shut down, it will gradually be reopened as safely as is feasible, difficult to predict what happens. After the previous pandemic in 1918-1919 some nations experienced a period of prosperity (in the US the so-called roaring 20s), followed by the Great Depression.
Perhaps your predictions will be correct, I see many possible futures and do not know which will come to pass.
The future is unknown, whether short, medium or long term.
In the years following the GFC the IMF loaned money to 90 nations see
https://www.imf.org/en/Publications/WEO/Issues/2020/04/14/weo-april-2020
and
https://www.imf.org/en/About/effectiveness-of-imf-lending
in 2020 World real GDP is expected to fall by 3% and in 2021 World real GDP growth is expected to be 5.8% (IMF estimates). That puts 2021 World real GDP above 2019 real GDP by about 2.6%. This is a low growth rate over the 2020-2021 period of only 1.29% per year for real GDP, compared to the 2008 to 2018 average growth rate of about 2.5% per year (based on World Bank data). My estimate is far more conservative than the IMF estimate, of course the IMF and World Bank also do not know what will happen in the future.
hole in head,
“When a caterpillar becomes a butterfly it is no more a centipede.”
Is that really what you meant to say? Just curious.
Correct . Rectify me if I am incorrect . All improvements are welcome .
hole in head,
Centipede is an entirely different species to a caterpillar/moth/butterfly.
And just a suggestion, if you are writing long responses or comments, you should use paragraphs which make it easier to read.
Cheers,
Thanks Mike , I thought that anything which crawled with multiple legs was a centipede . Corrected the post on your guidance . Also noted your suggestion for paragraphs for future comments . Dank U(jij) wel as they say in my part of the world
Lets not have science get in the way of opinions.
Can you find yourself?
http://www.onezoom.org/life/@=93302?img=best_any&anim=flight#x264,y760,w1.0993
The IEA is predicting a huge recovery in the second half of 2020. I just don’t see it.
How Bad Is Oil Demand? Assessing Views Across Energy
After hitting a bottom in April, the IEA expected demand to gradually recover through the year. For December 2020, the IEA estimated demand will be down 2.7 MMBpd year over year or roughly 3%. All in, the IEA forecasted a record-setting 9.3 MMBpd decline in 2020 demand relative to 2019.
No chance we get back to that level of oil consumption by years end. Covid is everywhere and travel/leisure industry will no recover until summer 2021 at the absolute earliest. People are too scared to travel, and the economy is in the toilet globally. Business travel is gone until next summer too, as small meetings can be done online and conferences are just not going to happen until there’s a vaccine. Even a vaccine discovered today would take until next summer to get manufactured and distributed domestically, much less globally (probably 3-7 years until there’s a meaningful recovery in international travel).
It looks like humanity might have reached the point at which the Earth will finally reign us in?
I think (for WIW), that a major impediment to any return to business as usual will be the reluctance of many people ( my self included) to engage in any activity which entails close contact with people outside their safe clean bubbles.
A result of this reluctance will be that even if they open their doors and staff the counters, main street shops, malls and hospitality businesses will not get enough customers through the door for viable operation.
Online businesses with contactless delivery are thriving, including grocery deliveries. This will continue. Many white collar businesses have adopted work from home models which will be hard to unravel, and bricks and mortar offices for many professions are becoming redundant.
Education at home with a home-office parent to oversee progress is making the previous schooling system look bad.
Many things will not return to the way they were, and oil production will not be exempted from the impacts of these new ways of doing things.
If you think the home schooling thing is working out well across the board I have a bridge to sell you. Maybe a couple.
Shallow sand,
No doubt the distance learning is not as good currently, but it is also likely to improve over time.
Much office work can be done from home and much business travel can be eliminated. All of these will reduce oil demand.
So potentially oil demand might not recover to previous levels.
Things have been changing even bevore this crisis.
The young generation didn’t liked cars as much as generations before, and liked traveling in public transport even if it takes the double time.
It’s because of the smartphones – you can’t instagram and whatsapp while driving a car, so this is lost time (for them).
SS! How much? 🙂
Ok. I guess maybe all you guys like your lives of being cooped up in your house all day on your smart phone or laptop.
NO, we fucking hate it. What we like is saving precious lives.
You must live very lonely lives.
Why do you guys always attack the person and not their ideas or philosophy? Because we want to save lives and know there will be a price to pay to save lives, that means we live very lonely lives? How do you make that connection? No, that is the wrong question because there is no connection. The question is why do you say such a thing?
If I don’t get my kid back in school by the fall I’ll likely end up in the looney bin…
Stephen,
Much of the World is trying to reopen their economies. Let’s assume for a moment that the 2020Q2 estimate by the EIA is roughly correct. If we assume 2020Q1 was roughly 100 Mb/d then 2020H1 has average output of 88 Mb/d and the 90 Mb/d full year 2020 estimate implies 2020H2 average output of about 92 Mb/d. Both Ron and you agree this is too high, what seems more reasonable? Certainly I would expect something higher than 76 Mb/d, perhaps 85 Mb/d for 2020H2. Note that I agree the IEA estimate is likely too high, the question is by how much?
Fairly signif news of a virus variant, east coast virus not the same as west coast.
Got a good briefing. Think physics. The virus has no propulsion. No conscious effort to do anything. The variant (mutation) is just a change of shape of the little spikes around the sphere (as presented in artists conception, but it’s not a sphere). That spike shape is such that when it bumps into a cell with a compatible receptor shape, it will stay stuck to that cell. Then abrasion from pulse or respiration penetrates the cell membrane and in it goes, replacing genetic material. This new variant has spike shapes more compatible with human cells than the original version from China. Much more contagious.
The US East coast has this new variant (from Europe) and because it infects more readily, it becomes the dominant type. The west coast has the original strain out of China. Far less severe numbers.
This explains many differences in country results and even regions within countries. Human activities in response are rendered less important. Italy didn’t get devastated because they are incompetent vs S. Korea. They had a different variant than S. Korea. Similarly, NY vs Calif.
The people who want to get things re-opened are not insane. They just understand what $28Trillion means. The people who don’t want to take the risk are not insane, either. They don’t understand $28 Trillion or don’t want to understand it, and there’s nothing absurd about that choice.
But everyone who thinks the oil fields and economies in general will soon be back to normal needs to just look at that number. $28 Trillion. If we had a cure tomorrow, even tomorrow, we’d still be looking at 26T. Neither 26 nor 28T are normal. You can’t get to normal with a 35% deficit / GDP ratio.
Watcher
Do you have a link for that?
https://www.latimes.com/california/story/2020-05-05/mutant-coronavirus-has-emerged-more-contagious-than-original
The last part about the debt and debt/GDP ratio is well explained .Tks
Dennis, Ron and others.
Sorry for my rants. I deleted the posts.
I don’t know what the answers are.
shallow sand,
Feel free to rant, I missed your posts, darn.
Generally I find myself agreeing with nearly every point you make, and always learn something even when I do not agree. Note of course that when I do disagree, I later realize (at least 99% of the time) that you were right in the end. 🙂
Dennis.
There was mention above of at home school being a good thing, preferable to school before the pandemic, and I overreacted.
It has not been a good thing in my view. I have one child in college, a nephew in college, nephews and nieces in elementary school, middle school and high school.
I have seen how just six weeks of staying home has affected them and I feel bad for them. All are good students and were involved in many other activities. I don’t think the isolation has been good for any of them. The novelty has worn off.
Then I think that they are the lucky ones. So many kids are in a situation where school is the safest and best place for them to be. They now truly have nothing.
I’m not saying there are better alternatives as long as this virus is a threat. I just hope kids staying at home all day every day doesn’t become a norm. It might work for a select few, but most IMO it does not.
I also do not care for working from home. Some people like it. Not me.
There are some people that can work from home and are perfectly content to stay home the majority of the time. I got personal about that and the school issue; and I am sorry. That’s why I deleted the posts. Ron called me out and he was correct. I do think Ron might have jumped to conclusions about my views on the pandemic. But that’s ok. I can see how he could.
I also never thought I would see the court system impacted like it has been. What do you do with those accused of heinous crimes who have had their speedy trial and jury trial rights suspended? How are we going to require citizens to report for jury duty until there is a vaccine?
This pandemic has no good solutions. At first I was convinced that everything needed to be locked down. Now I am not sure. I really don’t feel like I know what the right answer is. I know some are convinced of one approach, some of the other. I’m not sure and I hate that. People are ignoring the stay at home orders in many areas. Urban, suburban and rural. The City of Chicago PD reportedly broke up over 1,000 parties/gatherings last weekend alone. Businesses are opening in the rural areas despite governors orders.
It’s going to get ugly I am afraid.
Shallow Sand
The NYT is sending a message to the US on the right way to deal with this virus and how to come out of the stay at home phase.
https://www.nytimes.com/2020/05/06/world/coronavirus-news.html?type=styln-live-updates&label=global&index=0&action=click&module=Spotlight&pgtype=Homepage#link-4a73a809
Germany, which showed the world how to mitigate a pandemic, has a hopeful message: We’re making progress.
Germany was a leader in the West in taking on the pandemic, and then a leader in the gradual, calibrated restarting of public life. Chancellor Angela Merkel had a hopeful message for the nation on Wednesday: It’s working.
Ms. Merkel announced the second major phase of lifting Germany’s lockdown, a milestone she said was made possible by the success the country has had in lifting some restrictions without allowing a resurgence of the virus. In that time, new infections have actually declined.
“We have reached the goal of slowing the spread of the virus,” the chancellor said after meeting with the heads of Germany’s 16 state governments.
“I think that we can say today that we have the very first phase of the pandemic behind us,” she added.
Chancellor Angela Merkel of Germany outlined plans for a wider reopening of public life in the coming days, citing a continued decline in new coronavirus infections.Michael Sohn/Agence France-Presse — Getty Images
In the next few days, she said, schools, day care centers, stores and restaurants will be allowed to reopen, and hotels will follow by the end of the month.
That is welcome economic news not just for Germans but for Europe, which is looking to Germany, its largest economy, to show the way out of the paralysis the pandemic has caused.
This is my observation. The word ‘education’ means “drawing something out”: drawing out that which is within you. If there is potential carpenter, or dancer, or painter or mathematician within child then that should be drawn out from the child during “education” years.
In ordinary education system n schools, colleges is not education in the literal sense even, because instead of drawing out what is within child it forces things from the outside upon child. It is imposition.
And what to tell then about online education? That is not education at all. It should be called Online memorizing and not education 🙂 . If child wants to learn about history or geography they can do on their own. All that can be done by a computer; the child can carry the computer. But that is not education.
So, I am for real education in the reformed schools where emphasis is on drawing out maximum potentiality from each child like drawing water from a well, not pouring something into the well.
Hint:
Education is not a capital investment.
Hint:
Real education is helping the person to be himself.
What that has to do with capital investment?
Shallow sand,
I agree with that post, I do not think the isolation is a good long term situation, by our nature most humans are very social and the isolation is not good for our mental health, some of us deal with it better than others. All my close relatives are college age or older, it definitely is not better for students in my view and for young people about to graduate it is a disaster (one of my children and several nieces and nephews are in university or graduate school).
Working from home is definitely not for everyone, but after the pandemic, for some occupations it could be 2 or 3 days at the office and other days at home, if it works, up to the individual and their employer, or that is one possibility.
Human contact is definitely needed, a skype or zoom chat is a poor replacement for real face to face contact, in my opinion.
Lots of ranting going on, we are all under stress, no apology needed in my opinion (though I did not see your original post). I like a variety of opinions and yours is valued highly by 99% of those who read this blog (that is a conservative estimate).
Today’s weekly EIA production guesstimate. Another weekly drop of 200 kb/d to 11.9 Mb/d. A total drop of 1.2 Mb/d from the week of March 13 to May 1.
Dear SS, nothing wrong with your comments. I would never suggest that one size fits all in regard to education or work arrangements. I’m just praying that the shutdown will give us and our masters a moment to reflect on the business as usual trajectory and somehow a few changes for the common good may be enabled. At the individual level it would be nice to imagine that many folk young and old will see and adopt a more harmonious way to live.
India’s power consumption down 23%
https://asiatimes.com/2020/05/indias-power-consumption-down-23/
And this is probably just the beginning.
Curious. Texas state revenue. 4% was from oil and natgas production in 2018. Surprised so low.
26% from sales tax. 33% from Federal cost sharing, which is about normal for all states. Joint funding for Medicaid and various other programs. The Federal portion is 33% of influx.
Lots of other revenue sources vaguely related to oil, but in terms of pure production . . . that’s not going to destroy their budget. Other things might, but not oil. If they had an income tax, then the employment loss (incl oil field losses) would crater their finances, but they don’t have one.
Spending is going to rise, but that’s what the stimulus package was for.
There is always the direct / indirect effect. It’s only 4% directly, but there is supply industry, good paid workers go into shopping malls, and mineral owners buy expensive cars. And so on – you have a halo effect. In Germany the car industry supports almost 7 times the jobs that are directly in the plants of VW, BMW and so on.
There is no income tax. Job losses do not directly affect the Texas tax revenue. Now sales tax is a big chunk and if consumers do not buy things that will certainly affect revenue, but a lot of folks losing their job transitioning to unemployment benefits will make more money than they were making while working. This also was a weird part of the stimulus package.
So this will not reduce their purchases nor the sales tax revs.
Like everywhere, Texas is certainly not going to benefit from the virus, but their state budget looks like it will be far more insulated than states with no oil at all.
Plans to replace the Navajo coal plant with solar are moving forward.
https://www.greentechmedia.com/articles/read/navajo-power-spower-funds-raised-solar
The point is to reuse the transmission capacity. You often see announcements of renewables being built at or near the site of older power plants. Cheerleaders for renewables love the symbolism, but the point is cost reduction. It is also one reason why anxiety about covering pristine landscapes with solar are overblown — pristine landscapes tend to lack the needed transmission capacity. Brownfield sites are ideal.
The solar capacity at Navajo is much smaller that the previous coal capacity. “Huge” solar projects are small by comparison to traditional power plants. The main problem tends to be land acquisition. If it is successful, there will probably be followup projects. For solar, economies of scale don’t matter much upwards of a hundred megawatts or so, as long as transmission is available. This points to another key economic benefit of renewables projects: They tend to be small, technically simple, and fast to implement, so the risk of failure is low.
Alimbiquared,
Thanks, they have plans for about 750 MW which is about one third of the capacity of the coal power plant, my guess is this may have been the utilization rate of that plant (33%) before it closed so they are just aiming to fill the demand. Perfect situation to site these plants near the transmission lines if the Navajo nation believes it is in their best interest. The politics is complex, I think, as Native Americans have gotten very poor deals in the past, so a tricky path to navigate.
You guys are a total riot, getting confused by TWh, thinking it only applies to electricity.
Watch this bit of magic of coal or oil or natural gas burning.
100,000 BTU = 29.3 kWh or 3412.14 BTU = 1 kWh
The chart below should cause even more confusion.
Definition of a watt.
The watt (symbol: W) is a unit of power. In the International System of Units (SI) it is defined as a derived unit of 1 joule per second,[1] and is used to quantify the rate of energy transfer. In SI base units, the watt is described as kg⋅m2⋅s−3,
Guess what, it’s based upon:
When an object’s velocity is held constant at one meter per second against a constant opposing force of one newton, the rate at which work is done is one watt.
Steve,
I suggest you read through T Shyam’s posts above, particularly his remarks on the topic of the amount of usable energy produced by coal fired plants.
Gonefishing,
A strange unit to use for primary energy. BP Statistical review has about 582 EJ (exajoules)
1 EJ=1E18 J of primary energy consumption in 2018, it does not include traditional biofuels.
582 EJ=161,747 TWh. According to BP’s data fossil fuel accounts for 78% of primary energy use in 2018. Progress in reducing fossil fuel use has not been good.
We need to use less energy (better buildings, less travel, more efficient energy use) while also replacing fossil fuel use with other sources of energy, my view is that wind and solar would be best as replacements, though using as little energy as possible is the best choice.
Yes, a combination of both is the best.
And the numbers don’t need that big. 54000 TWH of oil can be replaced with round about 15000 TWH of electricity, either by electric cars or trains / busses. The same with coal, which main use is generation of electricity.
I drive a too big car, too. A small sedan would do it, too. Next time I replace it I will scale down a bit.
Keep in mind that a fair amount of the 54000 TWh of oil consumption is for air and water transport probably only about 38000 TWh is for land transport, I agree less energy would be needed for the electricity, if it were provided by wind, solar, and hydro, perhaps about 10700 TWh. I think it could take many decades to replace fossil fuel in air and water transport. Reducing use in land transport will be a good first step.
I think the point with the Global primary energy consumption chart is that anyone who thinks we are going to replace the big three (gas, oil and coal) with renewables (the small bits at the top) is completely delusional. And we need to increase the energy flows to grow the economy or just to stop it collapsing.
Good luck with that.
Richard
Richard,
The counter point is that much of that primary energy consumption is simply wasted as heat that is not put to any use. For oil about 70%, natural gas 55%, and coal about 63%, so the actual useful energy (so called exergy or work) is far less than shown in the primary energy chart. Much less energy is needed if it is directly produced electricity as in wind and solar power used to power electric vehicles, obviously this does not happen overnight, but if the growth rates of the past 7 years for wind (15%/year) and solar (30%/year) continue for about 12 to 15 years, all fossil fuel use for land transport and electric power can be eliminated. Growth rates will likely be slower than this so in reality it may take longer than 15 years, much depends on future relative prices for wind, solar, natural gas, oil, and coal. Those future prices are unknown, but trends suggest they will be favorable for the expansion of wind and solar power.
Regardless of that Dennis, those two slivers at the top, solar and wind, are still so tiny it is delusional to really believe they will replace oil, gas, and coal. Your counterpoint, when put in perspective of the total, even after deleting the waste, is still laughable.
Also, so-called “other renewables” wood, palm oil, ethanol, and other such destructive practices are destroying the planet. Does that not bother you?
You guys are living in a dream world, a very destructive dream world.
Ron,
The other renewables can be reduced, they have not really been growing that much. Much of land transport use of oil can be replaced with electricity with at least 65% less energy used. Natural gas that is used for space and water heating can be replaced with heat pumps (ground source in colder climates) reducing energy use by at least a factor of 3, wind and solar replacing most coal natural gas used for producing electricity would require about 60% less energy. In each case elimination of most of the thermal losses reduced energy use considerably. Currently you are correct, output from wind and solar is not that large, but on an exergy basis (where we only look at the useful portion of the energy burned, such as the work that turns a turbine to produce electricity or the motion of the crankshaft in an engine that eventually turns the wheels of a vehicle), the fossil fuel contribution is considerably smaller.
If solar and wind continue to grow at the rate they have grown for the past 7 years, they will replace most natural gas and coal used to produce electricity in 12 to 13 years (this assumes the growth rate in electricity output continues at the rate of the past 7 years.) Costs for wind and solar power continue to fall while the price of coal and natural gas are likely to rise as the resource depletes.
Yes delusional. Look at the graph carefully, really carefully. Your point about the waste is a strawman as renewables are not waste free either and you have to build them and pay for them.
Good luck.
Richard- all of the sources of energy have to be paid for and built, whether is is a nuclear reactor, the oil refinery, the copper mine and smelting, the pipeline, the turbine, the silicon, etc. That is part of the cost, not what the chart portrays. It shows energy consumption by source, simply.
Secondly, yes renewable have energy waste, such as transmission loss from a wind turbine to the hospital. Same transmission loss as from a coal plant to the hospital. Similar with vehicle friction on the road, regardless of where the energy to propel came from.
But the electricity loss is much lower compared to losses of burning fuel in a combustion chamber in a car or a power plant.
Straight up.
Richard,
For wind and solar, the output is electricity, just as it is for a coal or natural gas fired power plant. The chart takes all natural gas, coal, and oit consumption and simply converts to TWh, the fact is that only 33% of those TWh of energy from fossil fuel provide actual energy services, so take the fossil fuel energy and divide by 3, for the wind and solar in the chart the losses are no different than the electrical losses for a coal or natural gas power plant, probably about 5% transmission and distribution losses. So yes there are losses, but 5% is 13.4 times lower than the 67% average losses for fossil fuel.
Check the chart down thread for some education on the subject in a single chart.
Of course they need to be built and paid for, just as the coal and natural gas have to be continually paid for to run a fossil fuel power plant.
The reason wind and solar are expanding so fast is that they are cheaper than coal and natural gas in many places (Great Plains for wind) SW US for solar.
Oh its much worse than that too as someone drives one of those monster SUV’s down to the shop to buy a pint of milk.
I hope you are right about the solar and wind future. I just look at the world (the horror) and have trouble seeing it. The world is complex and more than a line on a graph.
Who was it that said optimists are lazy – they just see the result that they want.
I am not calling you guys optimists. But there are so many things broken that just changing to renewables will not change much.
Richard,
I agree much is broken, solutions need to be addressed one at a time. The fact that renewables will not solve all problems is fairly self-evident and is no criticiam at all. This blog is mostly focused on energy, so we talk about that, then it is claimed that we think that a switch to renewables is a panacea. I have never heard anyone on this blog make such a claim. Those of us who think a switch to renewable power (rather than burning coal, natural gas, and oil) is a step in the right direction have never said or even implied that such action would solve every environmental problem.
Other problems need to be addressed simultaneously, population, pollution, improved energy efficiency, less consumption, buying durable products that do not need to be replaced, but can be repaired, recycling, cradle to grave manufacturing, and hundreds of other issues (the list is very long). There is no single solution, everyone with half a brain knows this, it is so obvious it is not worth mentioning, in my opinion.
But it will.
Hi Dennis,
I think you are sort of making the same point as me.
But I never said you guys think or said switching to renewables would solve all problems. Thats just crazy. My point was that we will not replace the fossil fuel energy with renewables and keep our present lifestyles. And this is important because without an expanding economy (ie energy supply) the economy will crash (see outside window).
But this is just my opinion.
All best Richard
Most data we are working with is worthless. Certainly oil has numbers floating around that are completely unaudited. And they can’t be because governments have agendas.
The unemployment report out this morning has headline numbers read by many people and then within the report itself are details that will be read by 20 people in the entire country. You can go and read them yourself, or you can just accept the following: Roughly 8% of the report derived from estimates and adjustments that were invented in the past 20 or 30 days. Not the number itself. The invented methodology for estimate and adjustment.
They created techniques and the method of estimate with no verification or precedent. Those served to reduce the headline number that would have been 22% down to 14%. Market expectation going into the morning was 16%. Of course those market guys didn’t have any methodology already in hand, either. It did give BLS a target. Nice of them.
I noticed a report yesterday that KSA had “slashed discounts”. How very amusing. Someone must have spent a couple of hours on that phrase, to make it sound so consumer friendly.
^They created techniques and the method of estimate with no verification or precedent. Those served to reduce the headline number that would have been 22% down to 14%. Market expectation going into the morning was 16%. Of course those market guys didn’t have any methodology already in hand, either. It did give BLS a target. Nice of them.
I noticed a report yesterday that KSA had “slashed discounts”. How very amusing. Someone must have spent a couple of hours on that phrase, to make it sound so consumer friendly.^
Watcher ,you are always interesting ,but this one is a real sharp observation . Thanks for educating .
‘Slashed discounts… It’s not just good, it’s awesome-good. Awesome blossoms, here at KSA.’
Life is good.
“The energy mix is incredibly difficult to change overnight, so over the years these flow diagrams created by the Lawrence Livermore National Laboratory (LLNL) have not changed much.”
https://www.visualcapitalist.com/visualizing-americas-energy-use-in-one-giant-chart/
Longtimber,
Great chart showing only 33% of the energy is useful with about 67% “rejected”, ie thermal losses.
Ron, here is how my delusion works.
According to Lawrence Livermore Lab 2019 USA energy shown by Longtimber.,
the USA generates 100.2 Quadrillion joules, in order to consume 32.7 Quad joules of energy.
Solar production is 1.04 Quad, and in 2018 grew at 23% in this nation.
That 23% growth rate was achieved without much national effort, and utility scale solar has become downright cheap compared to other sources [https://www.lazard.com/perspective/lcoe2019]
So lets see what happens if 23% is kept up for 15 years- what do we get?
1.04 Quad become 23.21 Quad
Wind by similar calculation with 8% growth (2018) becomes 8.69 Quad
Thats about 32 Quadrillion Joules production capacity at yr 2035.
No need to burn that energy to use it, so waste (rejected energy) heat is largely avoided.
Sure there are things to say like-
transmission line losses, or inability to keep up the growth rate, or lack of will, or lack of resources.
All possibly true.
Or, perhaps those growth rates will prove to be easily beaten if we have the will.
Regardless, certainly possible for these sources to grow big if that is the program.
Depends what program we reach for,
or don’t.
So lets see what happens if 23% is kept up for 15 years- what do we get?
“The greatest shortcoming of the human race is our inability to understand the exponential function.”
Albert Bartlett
Never was there a more accurate example of the above quotation by Professor Bartlett than this above statement by Hickory. Nothing ever grows by the same exponential rate for very long.
Also, you guys never, ever, ever, talk about storage. The more wind or solar you have the more battery storage you will be needing. Unless, of course, you do exactly what you are doing right now. That is you just continue to use the coal, natural gas grid the vast majority of the time when wind or solar are not producing.
Yes, that old reliable grid will continue to be used until the fossil fuels that power it are all gone.
Ron,
Excess energy can be used to produce either hydrogen or natural gas during high wind and high solar output periods, so called “green gas”, then burned during periods of low wind and sun. Batteries and pumped storage can also be used, as can nuclear and perhaps a bit of natural gas. A widely distributed wind and solar network interconnected by a high voltage grid, has very little problem accomplishing this.
Lack of imagination my friend.
Lots of great battery developments this decade, likely will rival the 80s microchip revolution. For example Minnesota is shutting down a major coal plant and building wind turbines with extremely long duration battery system (150 hours vs 4 hours for Li ion). Stationary battery storage does not need to be small and can easily use common elements like sodium and zinc.
https://www.greentechmedia.com/articles/read/form-energys-first-project-pushes-long-duration-storage-to-new-heights-150-hour-duration
Stephen,
Yes batteries will be needed and they do not have to be Li-ion, but there are a variety of possible energy storage systems, including thermal energy storage, for a long time humans made hay when the sun was shining, we are sometimes innovative creatures. 🙂 Though we often miss unintended consequences.
Yes I agree, I’ve been keeping my eye on Energy Vault, they use vertical kinetic storage via an AI controlled tower of huge recycled cement blocks. Lots of possibilities for good or ill there….
https://energyvault.com/
Cement is the 3rd largest product for Co2.
Cement is the source of about 8% of the world’s carbon dioxide (CO2) emissions, according to think tank Chatham House.
If the cement industry were a country, it would be the third largest emitter in the world – behind China and the US. It contributes more CO2 than aviation fuel (2.5%) and is not far behind the global agriculture business (12%).
Ron,
The Growth in World consumption of oil and natural gas was at an average rate of 7% per year from 1930 to 1973, 43 years is a pretty long time. The rate of growth was limited by demand constraints. For solar and wind there is no such demand constraint until all coal, natural gas, and oil use for electricity generation has been replaced. For the past 7 years at the World level solar output has grown at 30% per year and for wind power output the growth rate has been 15% (2011 to 2018).
I agree it is not likely that these rates will continue for 15 years, it is likely they will gradually decrease. and eventually the increase will become linear rather than exponential and then the rate of increase will gradually decrease to a low level (replacement rate plus demand growth).
“Lack of imagination”
The demand side will have to adjust to a new norm. Imagine your local gas station selling gasoline from the hours of 9am to 3pm for 50 cents a gallon. Then from the hours of 3pm to 9am for 5 dollars a gallon. People line up for 10 minutes at Costco to save 25 cents per gallon.
It will take thousands of changes to our daily lives to adapt.
Reproduction has to change. Elan Musk needs to keep it in his pants or cut & tie.
“Also, you guys never, ever, ever, talk about storage.”
What?
On the other thread it is brought up often.
From last month- we had this article
https://www.greentechmedia.com/articles/read/most-promising-long-duration-storage-technologies-left-standing
And here is project under construction in Montana -$1B storage, that was posted last summer. Estimated Average Annual Energy: 1300 GWh
https://gordonbuttepumpedstorage.com/
Please don’t get me wrong.
I am not saying solar/wind are about to replace all fossil fuel in a decade or two- but they can grow to become big.
I am not saying vehicles are going to be all electric in this decade- but the trend will be firmly established, and many people will no longer go to the gas station, ever.
I am not saying we arn’t far behind the task when it comes to surviving depletion of fuel from fossil deposits- we are.
And I am saying we better get our ass in gear and buck up to task of transition, as best we can manage.
Unless of course our goal is to witness a slow motion economic disruption on a scale that makes this virus episode look like a preseason warm up game.
” Nothing ever grows by the same exponential rate for very long. ”
Of course not. I was not suggesting any increase rate of growth. Just the same rate of growth as 2018. World growth rate of solar was even faster last year at 30%, btw.
Regardless of this quibble, the actual growth in the solar capacity in this country over the next 15 years may be, on average, much slower or much faster than the recent years.
The growth in recent years have not been a priority for the country by any means, more of a lazy effort. It could be much, much faster if we had the intention.
The price is right. The technology is ripe. This country has a massive untapped resource.
And a million people can become net power producers.
Its a good compliment to the other energy sources we still are lucky to have.
” Nothing ever grows by the same exponential rate for very long. ”
Of course not. I was not suggesting any increase rate of growth. Just the same rate of growth as 2018.
Errrr, perhaps I need to quote Albert Bartlett once again.
“The greatest shortcoming of the human race is our inability to understand the exponential function.”
I said, “Nothing ever grows by the same exponential rate for very long.”
23% year after year is the same exponential rate. That just doesn’t happen except on very rare occasions. But if it is very high, like 23% for instance, it’s just impossible. Of course, it can for a few years, but a very few years. But for 15 years? No, that is just not going to happen.
It is certainly possible that solar installation will look like smartphones on this chart (blue line). And it is certainly possible that we are at the equivalent of 2007 on it. Or, we may choose to forgo the opportunity.
We do have a history of choosing very poorly.
https://www.marketwatch.com/story/one-chart-shows-how-mobile-has-crushed-pcs-2016-04-20
Not a chance. Yes, a lot of people will put solar on their roofs. But that process is going very slow. If it can be shown that it will save them a bundle of money then they will do it. But a lot has to change before that happens.
However, you are talking about solar replacing coal and natural gas. That is under the control of Wall Street. That is far, far removed from individual people buying smartphones. Your smartphone analogy simply doesn’t apply here.
I was at Moscone Center when Jobs introduced the iPhone.
Hint:
Smart people don’t have smartphones.
Ron,
Smartphones grew by 31% per year on average from 2007 to 2016. World solar power output grew at a 36% average rate for 9 years from 2009 to 2018.
I agree that rate may not be sustained, note for the past 7 years the average rate of growth dropped to 30.5%. For the past 5 years the rate of growth has been 28.2%.
Model below has growth rate for solar decrease each year by 1% from 28% to 10% over 18 years then remain at a 10% rate of growth, similarly the rate of growth of wind power falls from 15%/year to 10% per year over 5 years and the growth rate then remains at 10% annually.
Demand for electricity grows by 2.44% (average rate from 2011 to 2018). By 2045 all electricity can be provided by wind and solar in this admittedly simple scenario.
By 2035 half of electricity output comes from wind and solar.
Note that most of the growth in solar power is utility scale PV, not just solar panels on homes, that’s a small part of the market. Solar costs are falling fast, especially in high solar resource areas. The cost will continue to fall.
Dennis, if peak fossil fuel is seen as a reality by ‘the world’ in the later years of this decade, one scenario in response would be a big increase in growth rate of alternatives. It would a rational response, and likely with some urgency. If so, the assumptions you made in that projection would have to be changed in a very big way.
Hickory,
I agree the scenario may be conservative, note however that I believe the transition will occur mostly for economic reasons, I think natural gas may well be plentiful until 2035, but decreasing costs for solar and wind will keep stealing market share from natural gas and heat pumps may also reduce demand for natural gas for heat, so natural gas prices might remain low due to lack of demand. It is difficult to predict how this will play out. Perhaps growth of wind and solar will be either faster or slower than the scenario presented.
I hope it will be faster and that growth in electricity consumption might be lower due to greater efficiency in the use of energy in general due to buildings with less air leaks and better insulation, passive solar design, more efficient appliances and computers, etc.
Hickory,
Not sure growth would be much more than 10% long term, perhaps as high as 12.5%, but I doubt a 15% rate of growth could be maintained. Depends on costs, if the rate of decrease in cost continues then growth will be faster, but I think we will quickly get to the point of diminishing returns on cost reductions and costs will level out (maybe in 5 years or so). Again, difficult to predict.
Ron,
Also, you guys never, ever, ever, talk about storage.
My thoughts on storage are this:
No traditional energy source, fossil or nuclear, can compete on price with renewables. But storage is more expensive, at least now.
So, as you point out, although the fight against renewables already looks unwinnable, fossil fuels will survive as long as they can compete against storage. That will be the fossil fuel niche in coming decades. I predict that there will be massive innovations in storage in the coming decades, continuing the trend of the previous four. This will make it harder and harder for fossil fuels to keep up.
There is also another competitor, which is energy conservation. As the grid and other systems get smarter, this will be a bigger and bigger factor.
George Kaplan,
Please check your email.
Change is hard to swallow, and keep up with. Some things are astounding.
It is astounding how much oil has been brought to surface with fracking.
Changed the whole scenario.
And here we are in 2020. Who would thought that solar PV could have come down in price so much in 20 years, and that coal use in the USA only continues because of previously built infrastructure and coal burning plants still have a lot of life in them, and debt to pay back.
And it is hard to image that for 28 years now, the growth of PV has nearly exponential. Even before the price came way down.
From 2012 to 2016, China cumulative installed PV capacity grew from 7GW to 78GW.
We could do that to.
To be exponential growth on this graph, the line through the yearly dots would have to be perfectly straight. It is near so. No one knows how long this will keep up. Not forever. I bet the tend will fall off somewhat due to Covid, but also will bounce back in a few years. We’ll see.
“Worldwide growth of photovoltaics has been close to exponential between 1992 and 2018”
https://en.wikipedia.org/wiki/Growth_of_photovoltaics
Hickory,
Nice chart, I like to track solar output rather than capacity.
The early part of the curve was exponential (1990-2000), then was a double exponential from 2000 to 2010 and then exponential again from 2011-2018 with about a 30%/year growth rate over the final period. Over the 2000-2010 period output increased by a factor of 30.6 from 1.1 TWh to 33.7 TWh. That is an average growth rate over the 2000-2010 period of 40% per year.
For anybody who isn’t relying on solar the frac spread count just hit 47.
https://youtu.be/ZALnN_OHSkk
New posts up.
http://peakoilbarrel.com/us-gom-2019-summary-part-ii-reserves/
http://peakoilbarrel.com/open-thread-non-petroleum-may-10-2020/