A post by Ovi at peakoilbarrel.
All of the oil (C + C) production data for the US state charts comes from the EIAʼs Petroleum Supply monthly PSM. After the production charts, an analysis of three EIA monthly reports projecting future production is provided. The charts below are updated to August 2020 for the 10 largest US oil producing states.
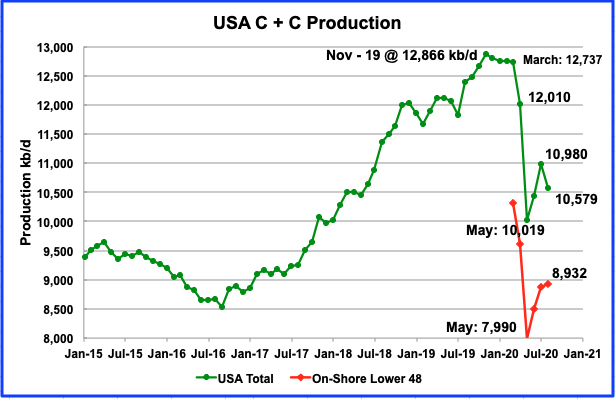
August’s US production dropped by 401 kb/d to 10,579 kb/d from July’s output of 10,980 kb/d. August’s drop was largely the result of a big drop of 453 kb/d in the GOM due to hurricanes. This can be seen in the August on-shore L48 production which increased by 33 kb/d from July to August to 8,932 kb/d.

The US continued to add rigs in October. The rig count increased by 10 to 221 in the week of October 30. The rig count reached a low of 172 rigs in the week of August 14. Since then 49 rigs were put back into operation even though WTI has been close to $40/bbl during that time and on October 30 December WTI futures contract settled at $35.79/bbl.
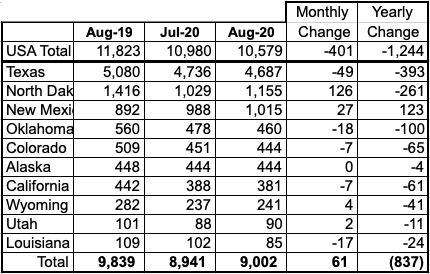
Listed above are the 10 states with production previously greater than 100 kb/d. Over the last few months, both Utah and Louisiana fell below 100 kb/d but are retained for consistency. These 10 accounted for 9,002 kb/d (85.1%) of US production out of a total production of 10,579 kb/d in August 2020. The only significant increase (>100 kb) came from North Dakota.
On an MoM basis August US production was down by 401 kb/d while on a YOY basis production was down by 1,244 kb/d.
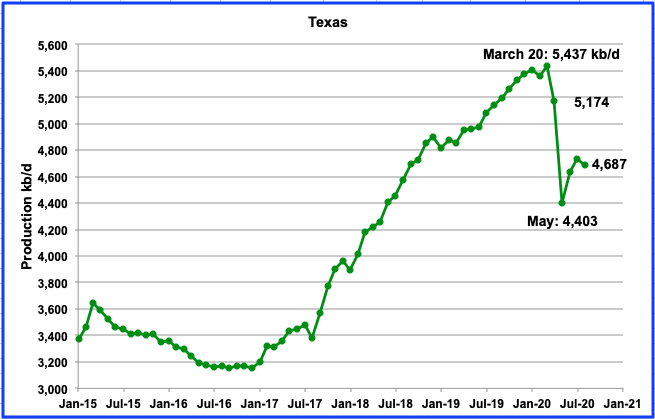
Texas production decreased by 49 kb/d to 4,687 kb/d in August.
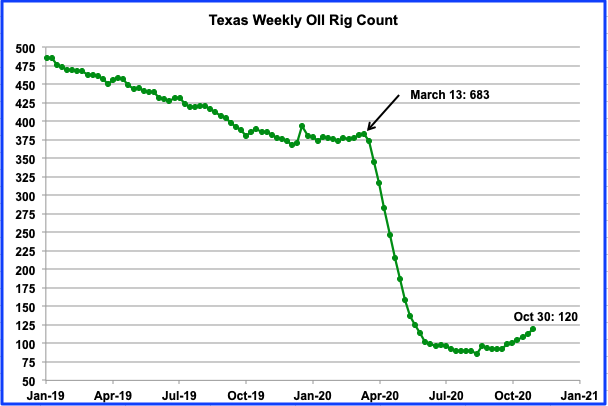
While rigs in operation dropped from March to August 14, production began to rebound in June from the May low of 4,403 kb/d. In the week of August 14, the Texas rig count bottomed at 86. During the week of October 30, 8 rigs were added. A total 120 rigs were operational during the week of October 30.
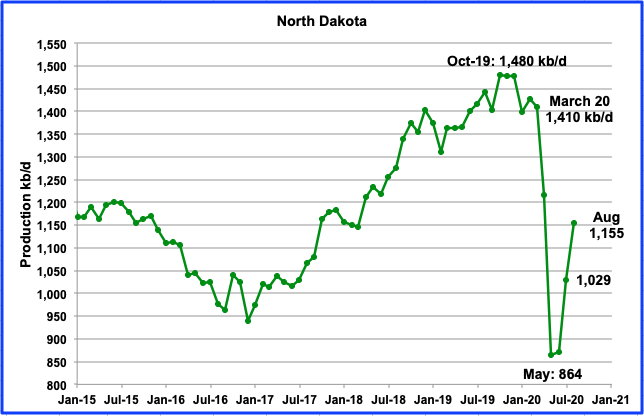
August output was 1,155 kb/d day, an increase of 126 kb/d over July. August’s output kept North Dakota as the second largest oil producing state after Texas.
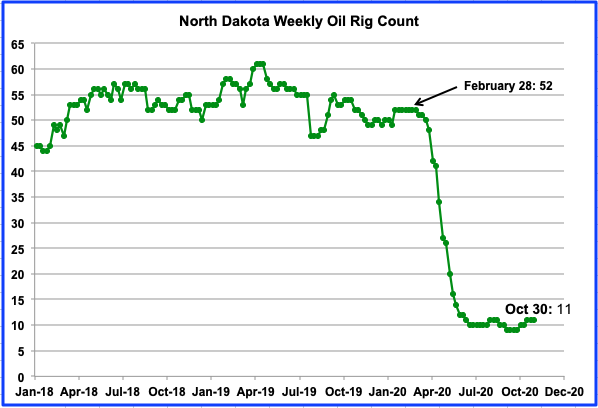
The North Dakota rig count has held steady at 11 for the last three weeks in October.
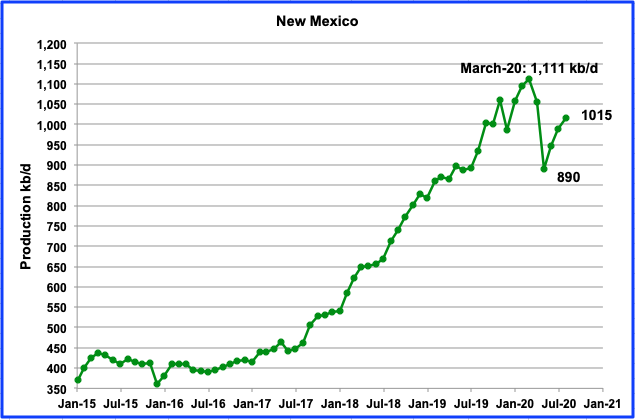
Augustʼs New Mexico production increased by 27 kb/d to 1,015 kb/d. New Mexico added two oil rigs in the week of October 30 for a total of 46.
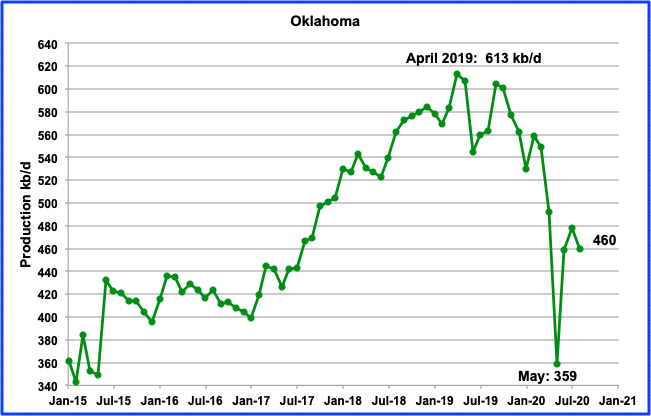
From a low of 359 kb/d in May, Oklahoma’s production rebounded in July to 478 kb/d. However August production dropped by 18 kb/d to 460 kb/d. Oklahoma added 3 rigs in October. In the week of October 30, 14 oil rigs were in operation. In January 2020, 50 oil rigs were in operation.
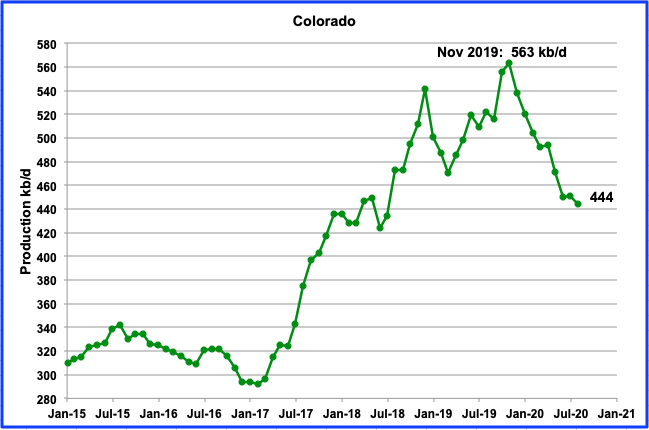
Colorado’s August output decreased by 7 kb/d to 444 kb/d. Coloradoʼs oil rig count dropped from 4 to 3 in October. In January, 18 were in operation.
It is not clear whether the low price of oil has lead to a slow decline in the number of rigs or whether it is related to the stricter drilling rules in force or possibly a combination of both. Regardless, Colorado appears to have entered a steady decline phase after its major rise that started in January 2017.
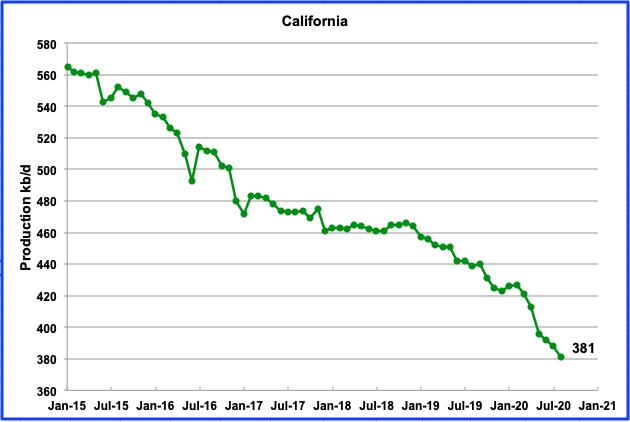
Californiaʼs slow output decline has accelerated since February. August production was down by 7 kb/d to 381 kb/d. Over the last 6 months production has dropped at an average rate of 7.7 kb/d. During the last 23 weeks, California only had 3 rigs in operation.
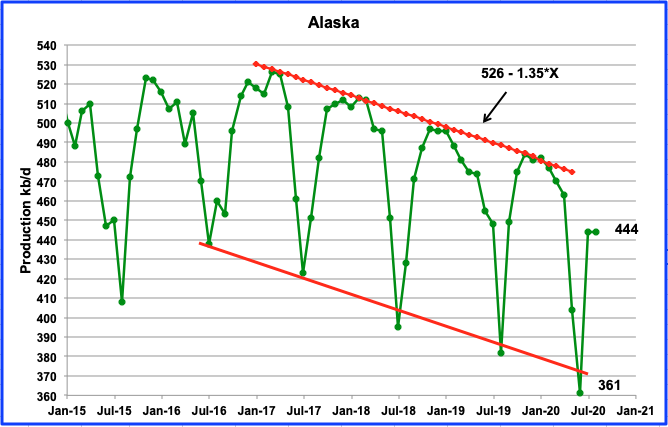
Alaska’s August output was flat at 444 kb/d. Typically August shows an increase but not always.

Wyomingʼs production in August increased by 4 kb/d to 241 kb/d. During the month of October, Wyoming added 2 oil rigs. In the week of October 30, 3 rigs were in operation, down from a high of 20 in January 2020.
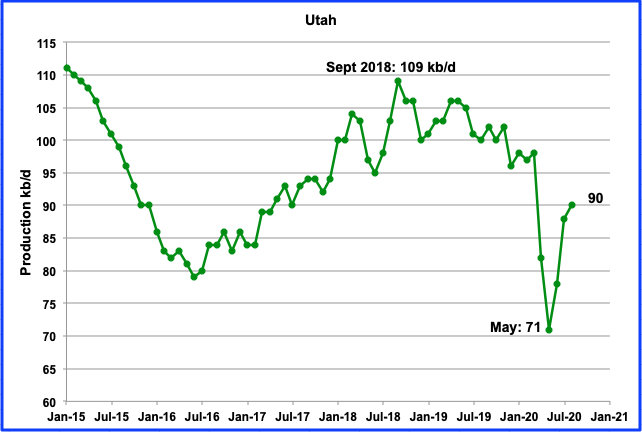
Utah’s production bottomed in May 2020 at 71 kb/d and rebounded to 90 kb/d in August. Three oil rigs began operating in Utah in October. No Rigs were in operation from weeks 18 to 41.

Louisianaʼs output dropped by 17 kb/d in August to 85 kb/d. In January 2020, on average, 22 oil rigs were operating. During the week of October 30, 13 oil rigs were in operation, a decline of 1 since September. At the low point in drilling activity, August, 9 rigs were operating.
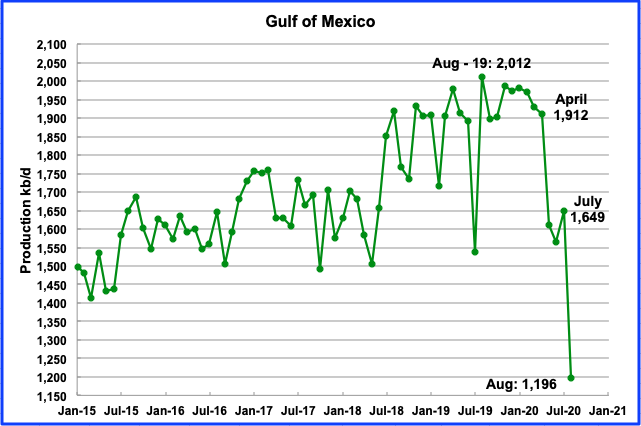
Production from the GOM fell to a new low of 1,196 kb/d in August , a drop of 453 kb/d due to hurricanes. If the GOM were a state, its production would rank second behind Texas.
UPDATING EIA’S THREE OIL GROWTH PROJECTIONS
1) DRILLING PRODUCTIVITY REPORT
The Drilling Productivity Report (DPR) uses recent data on the total number of drilling rigs in operation along with estimates of drilling productivity and estimated changes in production from existing oil wells to provide estimated changes in oil production for the five principal tight oil regions. The charts are updated to November 2020.

Above is the total oil production from the 7 basins that the DPR tracks. Note that the DPR production includes both LTO oil and oil from conventional wells/fields.
According to the October DPR report, LTO oil and conventional oil output bottomed in May 2020 at 6,883 kb/d. The projected output for November 2020 is 7,692 kb/d, down 78 kb/d from October.
The contribution from three of the DPR/LTO basins is shown in the charts below.
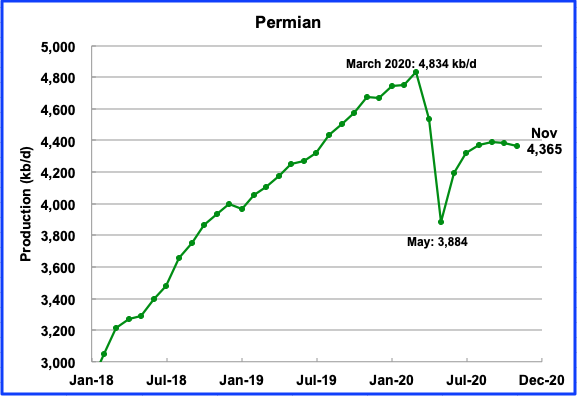
Permian output in November is projected to be 4,365 kb/d, down by 17 kb/d from October. Since the May low, the Permian has added 481 kb/d but the increases are slowing.

After bottoming in May, Eagle Ford’s output is expected to reach a local peak in July and then begin to roll over. In November, EF output is projected to drop by 34 kb/d to 1,014 kb/d.
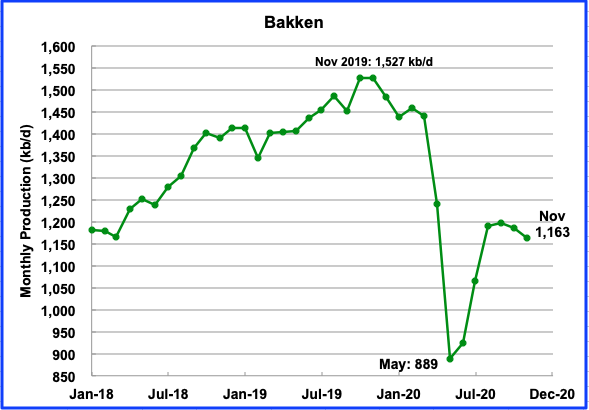
After the Bakken’s two big output drops in April and May, output began to bounce back in June. In November output is projected to be 1,163 kb/d a decrease of 22 kb/d from October.
2) LIGHT TIGHT OIL (LTO) REPORT
The LTO database provides information on LTO production from seven tight oil basins and a few smaller ones. The October report updates the charts to September 2020.
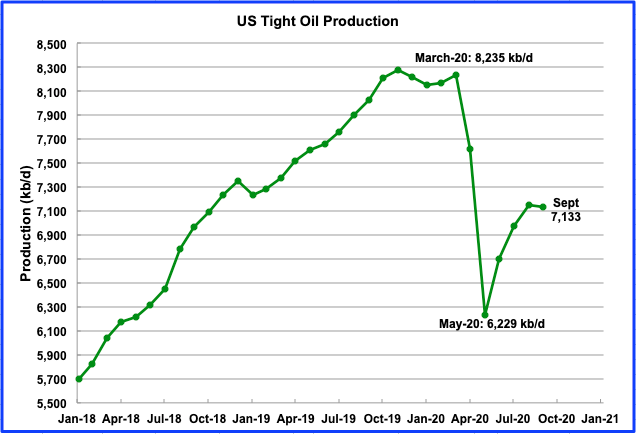
September’s LTO output is expected to decrease by 14 kb/d to 7,133 kb/d from August’s 7,147 kb/d. Note that the October report has increased the August estimates from the September report by approximately 190 kb/d, raising the August estimate from 6,957 kb/d to 7,147 kb/d.

Permian output in September is projected to be 3,815 kb/d, an increase of 14 kb/d from August. The October report has revised the Permian output for August up by 231 kb/d.
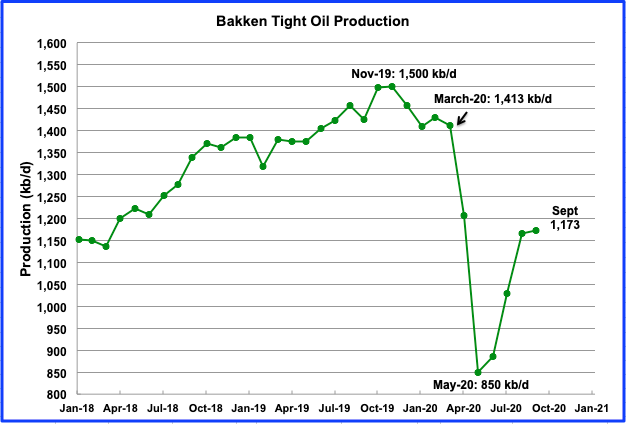
The Bakken’s September output is expected to be 1.173 kb/d, an increase of 7 kb/d from August.
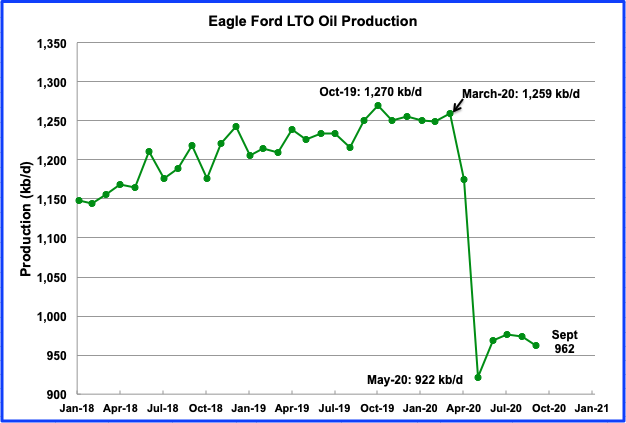
The Eagle Ford basin is expected to produce 962 kb/d in September. Output in September decreased by 12 kb/d from August. August output was revised down by 72 kb/d, 1,046 kb/d to 974 kb/d in the October report.
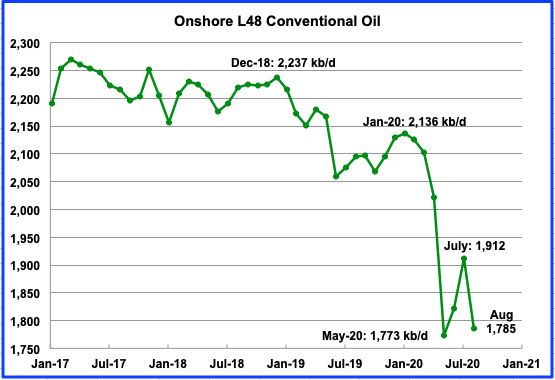
Conventional oil declined in the On-shore L48 to 1,785 kb/d in August. A drop of 127 kb/d from July.
3) SHORT TERM ENERGY OUTLOOK (STEO)
The STEO provides projections for the next 13–24 months for US C + C and NGPLs production. The October 2020 report presents EIA’s oil output projections out to December 2021
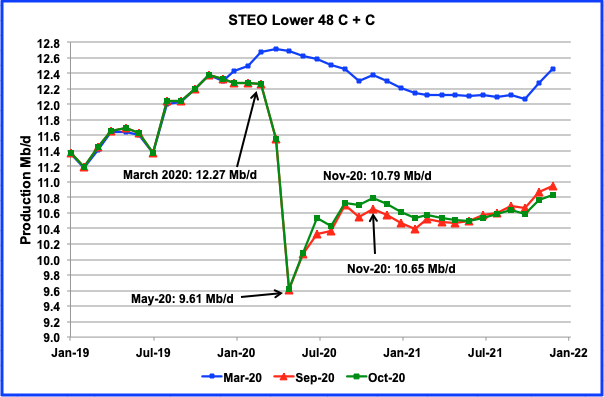
The October’s STEO report output projection is very similar to the one that appeared in the September report. From October 2020 to February 2021, output is projected to be approximately 125 kb/d higher than was expected in the September report. Note that the October STEO is not projecting any meaningful output increase after November 2020.
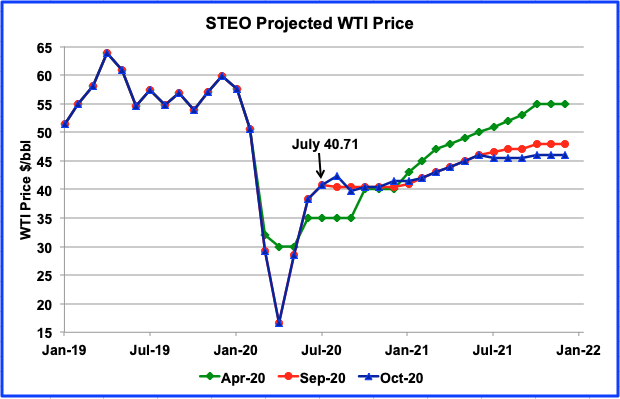
The October STEO is projecting an average WTI price from July to December of close to $41.00. From August to September WTI has been close to $40/bbl. However on October 30 December WTI futures contract settled at $35.79/bbl.
189 responses to “Hurricanes Impact US August Oil Production”
Dennis, to continue our discussion:
oil products are used for economic activity. They are used to earn money. So they have an internal value, depending how much money can be earned with them.
If oil products are cheap, there will be demand for them. If they are more expensive than the amount of money, which can be generated with them, nobody needs oil products.
This is total different than art products, more like food. But not the same as food, because some kind of infrastructure is necessary to use oil products.
People without oil consuming infrastructure have no need for oil.
Berndt,
Of course oil products are valuable, the question is how valuable? This depends on the individual consumer (the subject) and their consumer preferences, a gallon of gasoline is very useful for someone who owns an ICEV (most people in many OECD nations), if a consumer owns and EV or plugin hybrid, the utility of a gallon of gasoline tends to be lower.
Yes infrastructure will influence those consumer preferences, if there were no ICEVs, demand for gasoline would be lower, note however that the net energy used to produce, refine, transport, and distribute a barrel of oil is unknown to the consumer of oil products and has no influence on their consumer preferences. All the consumer sees is the price of the product relative to other products and they allocate their income on the products available in the way that they prefer. The price of the product will depend on the supply of the product and demand for the product and will settle at a price where the two are roughly equal, it is not determined by the net energy embodied in the product.
One might argue that lower net energy embodied in petroleum products implies a higher cost of production (assuming no technological breakthroughs that might reduce the cost of production), for oil producers this would require a higher oil price, ceteris paribus, in order to maintain profitability (at a higher cost of production). If oil prices do not rise, some higher cost oil producers will stop producing oil because they lose money at the current oil price due to higher energy input costs, thus we would expect oil supply to be reduced in this scenario. If we also assume demand for oil has not changed (or for the usual situation for most of the 1982-2019 period, that demand for petroleum products has increased), then the expectation is that oil prices would rise.
Note that for the period from 2010 to 2014 we had very high oil prices (about 108/bo for Brent on average in 2019 US$), since that time we have mostly had an over supply of oil output which accounts for falling oil prices. It is doubtful that the oversupply of the oil market will continue after the World begins to recover from the corona virus pandemic in 2022, if oil prices remain at around $40/bo in my opinion.
Dennis,
to find out which height of oil prices consumers can tolerate i prefer to look at data:
– One possibility would be to count the number riots caused by oil prices for differnt price levels. One example are the gilet jaune in France. But i have not access to a statistic for riots.
Too much work for me.
-Another one is to look at the number of car sales. These numbers are easily available. If the number of car sales goes down, the combination “Oil/Oil infrastructure” gets too expensive for the customers. The number of cars sold in the USA is not representative, because the USA is one of the richest nations of the world. The sales in poorer countries are more important.
Best is to look at a large number of countries. Here is a diagram.
At the begin of 2018, the oil prices got too high for car buyers. This happened at about 70 $/bbl. And i expect that this limit is time-dependent.
”One example are the gilets jaunes…” It is dificult to assign a specific cause to riots and pacific demonstrations. The causes of the current unrest in different countries are not only the price of oil or of something else. It’s generally a stagnant political situation along chronical misery and social frustrations (Liban, Algeria, Chile…). The starting point is always an increase of expense for poor people which brings quickly other demands.
Your chart is likely confounding a number of factors, when there is an economic downturn and unemployment rates are high and incomes low, sales of light vehicles decreases, regardless of the price of oil. Also there is no single “cost of oil” for any individual consumer, prices are variable nation to nation (depending in part on tax policy and subsidies) and individuals drive different amounts.
Can you explain how you calculate total cost of oil, some vehicles use gasoil and others petrol and the prices are different and we would need data on the mix of vehicles.
Maybe 2017 was the peak year for vehicle sales because consumers are waiting for a greater selection of EVs. If we use World gasoline consumption times the real crude oil price data (in 2019$) from BP stats for total cost and sales data from
http://www.oica.net/category/sales-statistics/
we get for 2005 to 2099 the chart below, there is not a strong relationship between “cost of oil” (as I have calculated it) and vehicle sales. R squared is 0.018, barely a relationship. The data tells us very little in this case.
Better correlation of World real GDP and car sales.
If we do a multiple linear regression of car sales on total oil cost and real gdp the tstat for total oil cost is 0.78 and p value is 0.45, for real GDP the tstat is 8.52 and pvalue is 1.95E-6. adjusted r squared is 0.838.
Dennis,
a description, how i set up the graphs, is written here, page 11:
https://limitstogrowth.de/wp-content/uploads/2020/01/Mar_2020_Thermo_EN_09.pdf
Oil prices (Brent) and oil production (C&C) are from EIA, last 3 months of oil production from MOMR using a formula.
Example June 2020: 40.27 $/bbl times 70427 kbbl/day gives 2.863 G$/day.
Car data for China and India are from CEICdata, USA from FRED, EU from ACEA. A car value in the diagram is always the average value of the last 12 months.
Monthly car data vary strong, so some averaging is necessary to generate readable graphs. EVs have similar purchase prices as ICEs, and are sold much less than ICEs. Up to now, i see no reason to separate EV and ICE data.
Because i use only values for oil and oil infrastructure, i have no confounding with non relevant data. For example, no correction factors for inflation, no correction factors for GDP. You have them (real GDP in 2010 US$).
The use of annual data (your diagram) instead of monthly data has the big disadvantage that very much information is lost. Your diagrams for car sales contain only one relevant point (2019), my diagrams have more than 20 after 2018.
I never evaluate data for single customers, i evaluate always economies (of nations or the whole world) .
Bernt
Monthly sales data is seasonal, clearly we would expect lower sales in 2020 due to severe drop in Real GDP.
I just did not have access to monthly data and found the annual data.
What is the r squared for your chart for 2005 to 2020 data?
My guess is that it shows no statistically significant correlation.
Berndt,
Thanks for the information. Using annual data for car sales from 2005 to 2019 and calculating total oil cost has you have done. The r squared is roughly 3%, if we use excel to run a simple linear least squares on the data, the significance F is 0.55, if the model was significant at the 10% probability level, then we would expect significance F to be less than 0.1, likewise for a 95% probability that the null hypothesis can be rejected we would expect significance F to be less than 0.05, typically we want significance F to be much less than 0.01 (99% probability that the null hypothesis, that is that the model is incorrect).
Likewise the t-stat for the coefficient (slope of line) is -0.61, we expect that for a statistically significant relationship that the absolute value of the t-stat at least 2.
Chart for data below using real oil prices (Brent spot price and CPI data from EIA used to calculate real oil prices) and World C C data also from EIA. Sales data as before, note that using a larger time frame than 2014 to 2020 as you have done makes sense to me. I only have World auto data 2005-2019.
Note also that for World real GDP vs. annual passenger vehicle sales the r-squared remains at about 0.85 using total oil cost as you have calculated it.
My theory remains a change in consumer preferences to EVs over the 2017 to 2020 time frame and consumers waiting for infrastructure (chargers etc) to build out and also waiting for greater choice in EVs (many new offerings are coming out) may have lead to delays in purchases of new vehicles, we will see if this is correct as the World economy recovers from the current depression.
Dennis,
that’s the craziest fit i have ever seen. If you want to fit vehicle sales data versus oil price data, you must include a function of time. And the result will probably be more complicated than a straight line.
How about this one, for the number of cars versus time ? The average car sales values are the same as in my previous graph and centered. Red dots are the monthly sales. I have applied a polynomic fit of second degree to the averages.
Berndt,
You are asserting a relationship between car sales and oil cost, the chart is the same as your first chart except using monthly data.
Fact is there is no statistically significant relationship, the statistics is straightforward.
A polynomial fit to a dataset over time tells us nothing, one needs a theory for why a particular polynomial is correct, otherwise we simply have a mathematical equation that is not meaningful.
Yes, passenger vehicle sales peaked in 2017. So? Sales will likely continue lower in 2020 and then will likely rebound.
Polynomial fits to time tell us very little.
Dennis,
1. I am happy with my diagram from 2:01 pm. The diagram you have set up shows that there is no relation between oil price and car sales, if time is neclected. I never expected that such a relation will exist for the years 2005-2019, if time is neclected.
2. The data in your diagram seem to have wrong year numbers attached to them. In my diagram, 2019 has clearly a larger sales number than 2015, in your diagram that is inverted.
3. The information content in both diagrams is different. In my diagram for the years
2016 and 2019 i see that the sales numbers go up in 2016 and down in 2019, in your diagram both years have the about the same car sales for different oil prices, and no information about directions.
4. Only the data for 2018 to 2020 contain info about decrease of car sales. In your diagram only the difference between 2018 and 2019 can contain the difference, that is too little.
Berndt,
Here is the data from link below
http://www.oica.net/category/sales-statistics/
year, pers. Veh. sales (M), total oil cost (B 2019$/d)
2005, 45.41, 5.28
2006, 47.96, 6.09
2007, 50.83, 6.55
2008, 49.98, 8.55
2009, 49.65, 5.38
2010, 55.82, 6.99
2011, 57.84, 9.48
2012, 60.94, 9.50
2013, 63.43, 9.11
2014, 65.71, 8.38
2015, 66.31, 4.56
2016, 69.46, 3.76
2017, 70.69, 4.58
2018, 68.68, 6.02
2019, 64.34, 5.29
If your theory depends on 2019 to 2020 changes in car sales during the worst depression since 1929, then you should find a new theory. 🙂
Here is a chart for both series vs time, it is pretty clear there is no relationship over the 15 year period from 2005 to 2019. Note that the data set I use is different from yours, so we would expect differences. The data set I use estimates annual personal vehicle sales for 144 nations and six continents and represents World personal vehicle sales.
Also it seems strange that you do not understand that a correlation between x and y is determined by a regression between the two variables. If you are going to propose they are related in a non-linear way then propose the relationship and we can test it, otherwise we have hand waving which convinces no one.
Dennis,
your diagram displays the OICA data correctly and shows a car sales maximum in 2017. My diagram is a little bit different, probably because i have a different data base.
But lets have a look on the whole thing:
The Second Law tells us that the total oil production energy has increased so much, that the oil age will end soon. As a physicist, i have no doubt that this is valid.
But the total production energy can’t get observed directly, at least i don’t know how.
99 percent of all people have never heard of the second law, most of them (the bulk) do not believe in the consequences.
We have several possibilities to observe indirectly the effects of the second law:
1. The averaged oil price must go down, and it goes down since 12 years. The bulk believes oil prices are somehow random products, this is not sufficient to convince them.
2. The oil production must go down. Data show its maximum has been in November 2018. The bulk sees only the COVID effects of 2020 and believes, the random effects of the oil price will lead to higher production in the future.
3. Oil consumption infrastructure must go down. Cars are an important part of the infrastructure. Data show that car sales go down since 2017. The bulk believes the sales decrease is a consequence of EVs and COVID.
Physics against ignorance. Data against faith.
Berndt,
I agree the oil age will end, but think both physics and economics will be factors. The oil will only be produced in free market economies if oil companies ca make a profit by doing so.
The idea that products cannot be produced profitably if their net energy or exergy is not greater than zero would seem to be false when one considers the electric power industry which is in the business of producing an energy carrier.
Energy is not the source of value any more than labor, there is no objective source of value. Value is in the eye of the consumer, it is subjective and cannot be measured, just like beauty or grace.
>The Second Law tells us that the total oil production energy has increased so much, that the oil age will end soon. As a physicist, i have no doubt that this is valid.
LOL
Berndt –
Based on my credentials as a random anonymous internet commenter, I can assure you that the fossil fuel industry has never “produced” any energy, because delta aytch equals delta aytch by the Zeroeth Law of Thermodynamics, or, as the saying goes, heat lost equals heat gained.
But yeah, if you pump a lot of oil out of the ground, eventually there won’t be any left. Nice catch.
In any case, the price in question was mostly determined by tax, not the underlying cost of oil. As I recall, an increase to €1.95 a liter, about $8 a gallon in American terms, was associated with the protests. Americans pay about $2, so unrest seems unlikely even if you believe the story that gilets jaune protest was about gas prices.
Berndt,
On peak oil in 2018, there have been many temporary peaks in the past, I agree there will be a final peak and perhaps it will be 2018, but I don’t think we will really know until 2025 to 2035 as I think we might be on an undulating plateau after the World economy recovers in 2023 or so to roughly the 2019 level of World real GDP, World C+C might surpass the 2018 level by 2025 or 2026 and peak at around 84 to 85 Mb/d in 2030 or so (2029 to 2031).
So mostly we just disagree on timing of peak oil. Clearly infrastructure for oil will also peak, as emerging economies become wealthier car sales may increase.
If we look at Europe and North America annual personal vehicle sales, the peak was 2007, for the World minus Europe and N America the peak was in 2017. Perhaps the part of emerging economies (including China and India) that can afford to purchase a personal vehicle has become saturated (like Europe and North America in 2007) and has started to decline, or people are waiting for EV prices to fall and delaying purchases.
The drop in annual car sales since 2017 is difficult to explain.
Berndt,
Car sales are an extremely poor indicator of the affordability of oil.
Enough said on that.
If you want a good indicator of the affordability of oil, just look at oil consumption trend at times when-
1- the price of oil is above its 3yr average price , and
2- the economy is not in recession
Then you have a clearer indication. Don’t forget to adjust for inflation and the relative strength of the dollar.
hint- people will pay a high price for energy, when considering the alternative
>internal value
This is pretty much the Marxist theory of value. It’s just bad economics.
>If oil products are cheap, there will be demand for them
Depends on your definition of demand. If you look at the demand curve, which underlies market economics, demand is the amount of money paid for a product. So when the price falls, demand falls, depending on the slope of the demand curve. You are using demand as a proxy for demand quantity. You might better say if oil is cheap demand is low.
You are right that demand requires infrastructure. That is one reason why rural electrification projects often fail — why build a power plant for people without any appliances?
Alimibiquated,
You are correct, when I say demand I mean the quantity of demand (Q) not P times Q.
Generally when someone says that high oil prices “destroys demand”, they mean the number of barrels that consumers are willing to purchase (assuming no change in the number of consumers or their preferences) will decrease due to the higher oil prices.
Thanks Ovi.
Your Welcome
The charts are a good depiction of what happens to an economy (and oil demand) when people refrain from wearing masks and adhering to simple social distancing measures during a pandemic.
A short piece on Exxon .2-3 minutes read some interesting info.
https://www.axios.com/the-fall-of-an-empire-56b9a744-aef6-4f33-b6d3-3d774bbd5c86.html
Hole in the Head, the author conveniently forgets which energy source got him into work, brought him breakfast and lunch and will no doubt be responsible for dinner.
Also comparing Exxon Mobil to Zoom and Tesla is farcical. Tesla makes more money manipulating it’s stock price than it does from selling vehicles. Zoom has a net income of $185m to justify it’s $139bn market cap.
Felix then had the cheek to bring Apple into the equation. Apple reminds me of Cisco during the dot com bubble. A market cap of $800bn which then fell to a realistic $300m.
At least with Exxon Mobil there’s price discovery and you can choose to invest or not on that basis. You can’t say that about many companies on the stock exchanges.
>Also comparing Exxon Mobil to Zoom and Tesla is farcical.
Bankers don’t see it that way. Their measure of value is the expected discounted future cash flow (or something similar). All they see is money. What in detail is farcical about this comparison?
>Felix then had the cheek to bring Apple into the equation. Apple reminds me of Cisco during the dot com bubble. A market cap of $800bn which then fell to a realistic $300m.
That was a fall of about two thirds. If Apples price were to fall that much, the company would still be five times the value of Exxon.
I’m no friend of Wall Street, but their attitude that money is money seems solid.
A lot of people seem to be stuck in the Marxist theory of “intrinsic value”. The idea is that if something has some “inner value”, like being “necessary”, or costing a lot to produce, then that should be the cost. But in a market economy things don’t work like that.
User Value VS Exchange Value.
The capitalist makes a profit on that exchange– without doing any of the work.
The essence of capitalism.
https://cla.purdue.edu/academic/english/theory/marxism/terms/usevalue.html
Right, the Marxist theory of value. Funny how popular it is in supposedly free market America.
Expected discounted future cash flow is old school for growth stocks.
It’s more about the story (otherwise Zoom would be not “worth” 130 billion – there is no limitless market to video conferencing software, and there is a lot of competition).
The rest is market mechanics – stock buybacks on credit, lot’s of millenials buying “story stocks”, cornering the market with help of the option market – it’s done a lot with Tesla so there are not many free to buy stocks. And completely silly investors – buying index ETFs. So the ETF brokers buy the index stock, regardsless of price.
This won’t work so good without peppering the whole cocktail with every week fresh billions of FED money. Remove the fresh money, and watch the collapse.
Nowadays stocks like Google, Amazon, Netflix are the crisis immune blue chips, and stocks producing something like Exxon, GM, Boeing, … are risk investment.
So Apple can go to 2,3 or 5 trillion of worth with no problem.
The companies you mention are so highly valued because they don’t pay taxes and aren’t subject to anti-trust laws. There isn’t any “new” economics involved, just good old fashioned corruption, or “free speech” as Republican judges would have it.
Illinois has oil production data for 2020 through September. It is a small producing state, almost all conventional. There actually is a small area where horizontal wells are being drilled that seems to be under the radar. These wells are being drilled in conventional reservoirs, and without them, the oil production would be much lower.
These are Illinois in barrels per day average by month:
1/2020. 23,864
2/2020. 23,270
3/2020. 22,671
4/2020. 16,109
5/2020. 11,987
6/2020. 23,025
7/2020. 22,123
8/2020. 20,979
9/2020. 20,735
Illinois is down 8.49% from 2019.
My guess is that Illinois and other states without shale will continue to slowly decline through the winter. If there is a cold winter, I could see many wells being shut in for the winter, as fighting the weather to barely make money, or more likely, lose money, isn’t much of a plan.
US better hope the “dumb” CAPEX keeps flowing to shale. It is really all we have left. Conventional has really fallen, Alaska appears in permanent decline, GOM doesn’t seem like it can grow much. And if one looks at shaleprofile, the most recent post shows something like 6 of every 7 barrels of US shale comes from wells completed 2015 or later. This means that the majority of current US oil production has likely been a money losing proposition.
Shallow Sand
Below is a chart for Illinois. The EIA rounds to the 1,000s. For August, they are reporting 20,000 b/d.
If you ever need a chart for some other state, let me know.
Hopefully I took this down correctly from shaleprofile.com.
July, 2020 US shale oil production 6,707,767 BOPD.
2015 and later – 5,987,534 BOPD.
2014 and prior – 720,233 BOPD.
Look at all that oil added to the market since 2015 at either a meager profit, or mostly at a loss!
No wonder practically every shale driller is broke.
Could the leadership of these companies have made a bigger mistake than adding over 61,000 new shale oil wells since 2015?
We may not survive, but at least we know it was because markets are so screwed up they funded this disaster, and continue to do so during the worst hit to oil demand in our lifetimes. Over 4,000 new shale oil wells added in 2020 through July!
When you look back at the whole shale experience up to now, it would be reasonable to think that a much slower and more sustained shale oil/gas production (maybe on the level of 4 Mbpd) would have been much better for producers (and consumers in the long run).
Yet, in this country we have no mechanism other than a screwed up market, to determine production. Its a free for all with very poor feedback mechanisms. Capitalism without intelligent guidance can be a very ugly game.
I agree.
On the other hand, industrial planning is very hard to do. Roosevelt tried to raise farm product prices (to reduce farm and rural bank failures), but he was trying to fight the fundamentals of falling production costs, which was trying to catch a falling knife. And if the US had done proper planning for oil production, we would have done things very differently and never allowed oil consumption to become nearly as large as it is. Defining that as a goal would have been a very tough fight with the oil industry, the car industry, the road building industry, etc.
Taxing gas at the pump is easy. Europe doesn’t seem to have had any problem doing it.
Well, those taxes were established many decades ago when European oil consumption was 99% imports. Look how hard it is to raise gas taxes in the US, which has been dominated by domestic oil companies (and car companies). Even unions are recruited to fight for road construction.
>those taxes were established many decades ago
The German government decided to increased gas and diesel prices by 8 euro cents a liter (about $0.30 a gallon) a month ago. It will take effect in 2021. They originally planned this at the end of 2019, but held back because of the virus.
I agree that America’s oil industry (not to mention the thoroughly the corrupt political system) is partly responsible for the low price.
It’s really dumb because a lot of the oil in imported anyway, so higher domestic retail prices wouldn’t hurt the local industry. America hasn’t been able to produce as much as it consumes since the fifties, so why should the industry worry about taxes reducing consumption? It would just reduce imports.
Therefore ”Free market” is a pure fiction and liberalism as an economical theory has to be discarded in the rubbish bins of history with all the rest of the pseudosciences. But, that’s only a dream.
What economic system would you prefer Jean-Francois?
Money creation is currently being rethought thanks to blockchain technology. Before there was money, religious authorities gave us our value system and distributed our wealth (see
https://en.wikipedia.org/wiki/Debt:_The_First_5000_Years and https://cassandralegacy.blogspot.com/2020/08/money-gods-and-taboos-re-sacralizing.html). Money is actually a religion. Money creation has a huge influence on our value system. For example the Romans (among others) minted coins with which they paid soldiers. A tax was imposed on
conquests forcing the conquered people to adopt the currency. This created a lively trade in what soldiers typically buy: sex, drugs, and rock and roll. Our system creates money out of thin air which pays people to extract oil. Imagine a system in which money was created to restore ecosystem services rather than extract oil. The values in this monetary system would
be completely different than what we have currently.
Examples:
Bitcoin: money creation through proof of (useless) work.
Idea: money could be created out of useful work. Similar to utility tokens in which money is created for computer services such as filecoin (token backed by online storage space), golem and fuelcoin (tokens backed by computer processing power).
Money could also be created to encourage “good” behavior such as solarcoin which encourages solar power and mobicoin which encourages sustainable transportation.
Another idea is the June. How does one finance a universal basic income? Well one could make the universal basic income the only source of money creation.
In any case, our system of money creation through interest bearing debt will soon be obsolete because it is very poorly adapted to chronic economic contraction. It also gives rise to vast inequalities, see
https://www.rollingstone.com/politics/political-commentary/coronavirus-fed-bank-bailout-disaster-976086/.
Schinzy , I acknowledge I have no idea about how bitcoin works , what I know is that it uses a lot of electricity . So does that mean ,no or even less electricity will result in no bitcoins . If the choice is between mining bitcoins and keeping your refrigerator running 24/7 or your air-conditioning running as in Phoenix , Las Vegas , Riyadh and Dubai what will be the choice ?
Bitcoin is an environmental disaster modeled after gold. It was intended to be a prototype. Today there are thousands of cryptocoins in existence the vast majority of which are superior in design to Bitcoin. A cryptocoin does not have to be an environmental disaster if the protocol is well designed. What I believe is interesting is the discussion of what the best possible money is. People talk about the influence of taxes on behavior and do not speak enough about the influence money creation has on relative prices and culture. Technical problems remain with respect to how blockchain scales, but I have much more confidence in money creation by a tamper proof program that everyone agrees on than in money creation by banks and central banks with the intent of making profit. Especially when I see how central banks abuse their power to make sure that stock markets never decline. If you owe $200,000 to a bank and can’t pay, you have a problem with the bank. If you owe $200,000,000 to a bank and can’t pay, the bank has a problem with you. The bank will find tricks to roll over the loan and push the day of reckoning down the road.
Money creating with Bitcoin, or Gold, is as schinzy said an eviromental catastrophe.
Beside this, a modern industrial economy can’t be created with a not inflatable currency like these – because of automatic deflationary phases killing every periode of growth. This was the problem all in the median age and beginning modern age, until “pseudo gold” currencies emerged which ware paper but the illusion to swap them in gold (or Bitcoins 😉 ).
It’s necessary – with bitcoin or gold you couldn’t expand credit enough to tap new energy sources like fracking gas and oil, or huge solar installations. Or fusion. You can’t even finance a war – that’s why many of the old wars had their supply logicstics( or their missing of it) by plundering, making the damage bigger.
What has gotten out of hand is the inablity to endure an economic crisis – so debt has gotten out of hand instead being cleaned out every now and then by defaults.
An economic system managed by people who are open-minded, able to take into account previous success and failure for their decisions, able to have a holistic way of thinking and willing goodness for the majority and attention for those who are left on the board of the road. A state administered economy doesn’t function. A ”free market” economy in its extreme version doesn’t function for the majority and provokes abyssal inequalities, social unrest and disorders. For example, uncontrollable pandemics like the cholera and tuberculosis in the mid 19th England : even if they had had the medical knowledges and the medicines, they would not have been able to cope with these diseases because of their liberal fanatism. While foreign countries banned the use of arsenic for dyes in the first half of 19th century, in England, they didn’t do this until … the beginning of the 20th century. The ”best” kind of economy is in Europe and I will not surprise you if I give the example of France. That’s a controlled kind of free market with the coexistence of collective form of corporation (scop) and classical form (patron de droit divin). That could be improved by introducing german like co-management. There is a strong frame of legislations and regulations to protect consummers, employees, employers and corporations. And there is a strong redistribution system which is smoothing inequalities. And with all of this, there is still enough room for entrepreneurial adventures.
True, the free market is a fiction, at least in its most extreme anti-government form. For example, a free market only works if there are rules about property which are enforced by the government. The free market also fails if complete information is lacking, and suppliers have a strong incentive to lie, So government intervention is necessary. Free markets only work if externalities are considered, and only governments can provide that. And of course collusion between suppliers can only be dealt with by trust busting.
It’s a useful fiction though. But like a flower garden, it needs tending.
SS , if you have been following my exchange with Dennis , I have said that a fall in shale oil production will be rapid because of lack of OPM (other peoples money) and high decline rates . I would not be surprised if we are back to 2014 situation rapidly . Why ? Investors and corporations are wising up . Conoco + Concho boss says they are not going to return any money to investors if price are where they are after there merger . If XOM decides to write down it’s $ 30 billion investment in shale then only a dumpkoff will venture to invest in shale . Like you wisely said ” if XOM is in trouble than the oil industry is in trouble . ” I will take off ” if XOM can’t make money in shale than nobody can make money in shale .” Muchos Gracias
P.S ; XOM is THINKING of writing down it’s shale assets . They are yet to decide on this as per my last info .
Shallow Sand
In the first chart under item 2 in the post, the EIA reports July LTO production to be 6,979 kb/d, roughly 272 kb/d higher than Shale profile. I think that the EIA is accounting for some time lag in the Texas reporting system.
Ovi: Yes, Enno Peters mentions that there is lag time in state reporting and that his data will be updated.
I refer to shaleprofile because it is the best data source and most accurate.
With Williston Sweet approaching $25, what makes the most sense?
Of course, it is bankrupt Oasis resuming drilling wells in the Bakken.
shallow sand,
Enno’s estimate after revisions for July is 6.8 Mb/d for US tight oil. EIA estimate is 6.98 Mb/d for July. The official tight oil estimates from the EIA are pretty good see spreadsheet linked below
https://www.eia.gov/energyexplained/oil-and-petroleum-products/data/US-tight-oil-production.xlsx
from page linked below (tight oil estimates by play
https://www.eia.gov/petroleum/data.php#crude
Europe is going back into lockdown. If Biden wins chances increase that US goes back into lockdown. There is a big difference in how this would trade. Europe going back into lockdown is negative for their currency. Exact opposite for the dollar. When credit get squeezed due to lockdowns in the US. Everything and i mean absolutely everything will get sold again like back in March.
Just watch the dollar it will tell you everything you need to know. Everything they have done to help smooth out covid-19 economic contraction just compounded the dollar shortage that already existed before covid became a thing.
I honestly think the credit contraction that is coming in 2021-2022 will make last March look like child’s play. Debts have got to clear and disappear. And until they disappear there is no path to recovery. But once the cleansing of debts is over not only is there a clear path to recovery but there is also a clear path for higher oil prices.
Yes we will get a temporary boost from some stimulus. But that only piles on more debt when debts are in dire need of deleveraging.
The process is just going to be painful as hell and politically unacceptable.
My take on the elections is whoever wins is actually just the biggest loser. They are the ultimate bag holder of 49 years of mismanagement.
Oil is sure tanking. Well head prices are now mostly at or below $30.
Just brutal, don’t think any modern crash will compare to this one.
Get ready to grow crops on that land.
Watcher, I think you can grow crops there.
We don’t have much oil in Germany, but here are a few vineyards with a pumpjack sitting every here and there, not taking much space.
Early Asia trading in Singapore .
“WTI just tumbled to a $33 handle in early trading (after being above $40 just 3 days ago) as demand fears (European lockdowns) and supply concerns (Libya ramped up its production) combined to spark anxiety about the energy complex outlook.
Dec WTI Futs are down over 5%…
Just received the following from Jeffrey J Brown
Axios: The decline of ExxonMobil
Axios’ Felix Salmon writes: The decline of ExxonMobil has been remarkable in its magnitude and unexpectedness.
Why it matters: While all major oil companies are facing troubles, Exxon has fallen the farthest, in large part because it has made the biggest bets on oil and gas — and the smallest bets on renewable energy.
While rival BP has recently promised to get to zero net emissions by 2050, Exxon has been doubling down on fossil fuels with moves like a spectacularly ill-timed $41 billion acquisition of XTO Energy in 2009 and its major expansion in the Permian Basin in 2017.
Driving the news: Exxon reported a loss of $680 million in the third quarter of this year, bringing its losses for 2020 as a whole up to $2.37 billion. (In 2008, by contrast, it made a profit of $46 billion.)
The company also announced it would shed up to 15% of its workforce over the next two years, including roughly 1,900 U.S. layoffs, mostly at its Houston HQ.
By the numbers: Exxon and Mobil combined had 390,000 employees in 1980. By 2017, that number had shrunk to less than 70,000.
Losses and layoffs notwithstanding, Exxon is still spending roughly $15 billion on sending a $3.48-per-share dividend to shareholders this year.
Few if any analysts believe such a payout is sustainable. “We have doubts about the sanctity of the dividend longer-term,” Edward Jones analyst Jennifer Rowland told Reuters.
Flashback: The oil giant was the largest company in the world, measured by market value, as recently as 2013.
The big picture: Today, ExxonMobil is not even in the top 40 most valuable companies in America. It’s losing money, cutting staff and stretching to maintain an unsustainable dividend.
The oil giant’s market capitalization of $137 billion makes it smaller than Zoom ($139 billion), and only about a third of the size of electricity-powered Tesla ($385 billion).
NextEra Energy, a power company with huge renewables assets, is also worth more than ExxonMobil.
The most valuable company, Apple, is worth roughly 14 ExxonMobils.
Exxon has lost 54% of its value this year alone. That’s some $163 billion. By contrast, Chevron is down 42%, or $95 billion, while NextEra is up 23%, or $26 billion.
XOM is contemplating shutting down its Australian refinery. Just a week ago BP announced it is shutting down its refinery in Australia. That one is the largest at 150K BOPD.
There is an article behind a paywall that seems to indicate that without government assistance all four remaining Australian oil refineries will close within a year.
SS , if you remember I had pointed out that refineries are the Achilles heel of the PPS (Petroleum Production system ) . Reliance the largest and also the most low-cost refinery in the world had profit decline of 15 % in the last quarter . I posted that . What the public does not know is that most of Reliance earnings were coming from exports , they sell very small quantities domestic . This implies that it is difficult to get the required pricing by the refineries worldwide .
Shallow Sand,
There’s an article at Rigzone on the BP shutdown.
Refinery margins have become so low that BP has decided that the refinery will be converted into an import terminal. They looked at other options and chose this one.
“Axios’ Felix Salmon writes: The decline of ExxonMobil has been remarkable in its magnitude and unexpectedness.”
hardly that unexpected for quite some years now due to their exposure to tight oil operations, must be more than 5+ years now since Mike pointed out the obvious issues with that kind of operation on this forum.
“Why it matters: While all major oil companies are facing troubles, Exxon has fallen the farthest, in large part because it has made the biggest bets on oil and gas — and the smallest bets on renewable energy.”
Isnt that bending reality a bit to suit a narrative, problem isnt oil operations its what type of oil operation and how big your exposure are to it.
As a reference i own interest in an oil company, $2,79 / barrel opex and FCF even during q2, no problem with the oil part of their operations even at todays prices its way more profitable than their “virtue signaling” part (renewables).
So just pick the company that confirm your narrative i guess, or come to the conclusion that it actually depends on what type of oil operation as all are not the same.
Yeah i noticed it says “major” but since they all bet on tight oil in various degrees that is the issue not oil operations in general. My opinion.
Baggen , your investment, and you are welcome to it , but the company you have invested is a minnow(probably ) ,let us talk about the whales . ” One swallow doesn’t the summer make ” . It is like SS said ” If XOM is in trouble ,the whole industry is in trouble ” . Reliance the largest refiner has profits down by 15% the last quarter , Saudi Aramco revenue also down in the last quarter . Saudi Aramco is raising $ 10 Billion by selling it’s pipelines , Shell is going to shut it’s five refineries in Australia , BP in Australia is shutting it’s refinery in Australia and converting it into an import terminal . Conoco merges with Concho as a survival strategy . Pioneer resources looking for merger partners to survive . Oman is going to introduce income tax ,the first time . UAE , Kuwait will be next . I can go on and on ,but no use wasting cyberspace . The whole industry is in hot water ,the producers ,the refiners and most important the consumer whose only hope is a stimulus cheque ,signed by the next President of USA . The arrival of POD(Peak Oil Dynamics ) as Rockman termed and the end of industrial civilisation was never meant to be pleasant . Enjoy the ride .
The company im talking about produces about 200.000 boepd hardly horseshit, and they are not the only example in that production range just the one with the lowest opex but there are others with 10-12 dollar opex with even larger production and they also produce FCF at todays prices. What they have in common is they are 100% conventional producers.
My point as i stated was that im well aware those are the mayors and the issue in my opinion isnt oil production its their investment in tight oil. Break up their operations and you will find they are still profitable in conventional but their shale adventure will be their undoing. Thats fine with me, their production will fall and companies with 2,80 opex will get better prices for their products going forward. ?
How much of the BOE is not oil?
I assume the company’s assets are primarily not in the US?
Not much lower 48 onshore conventional oil with sub $10 LOE.
SS , you beat me to it . Baggen had in an earlier post said opex of $ 3-4 per barrel and had further said this was not operations in an Arab country . I countered that if stripper well operators like SS and Mike S cannot make profits at current WTI then no one can .That is still my contention ,
Shallow,
90% of their production is oil.
q3 they sold oil at about $43 / barrel (they sell brent), weighted for all production including gas they realized about $40 boe.
In q2 they got about $25 as salesprice for their production and still achieved FCF.
You are correct, they have 0 production in US or in any arab country.
HiH,
Well i dont know why this is so hard to believe, they are ofc in my opinion probably the most profitable oil company in the world especially in todays market.
2020 YTD opex is $2.79
2020 full year guidance is 2.80
2020 q3 is 2.80
The $3-4 is guidance for coming 5 year period, i didnt want to “cherry pick” current year just because its lower when we discussed this previously.
They have a very very long history of being conservative with guidance and an equally long history of delivering at or above guidance.
This is not stripper well operations, this is world class conventional assets running on extremely high efficiency with quite large production volumes, that gives you very low opex and nice profitability.
They made more then $150 million FCF in q3 i think that counts as a “profit”?
And again then, my point was not to promote any company it was just that the supermajors all bet heavily on the wrong pony that is their issue. Not their conventional oil operation and that there certainly are oil companies that are more resilient than others out there. Dont know the american expression but in swedish it would be “den enes död den andres bröd” loosely translated the death of the one is the gain of the other.
I agree that supermajors deserve their current valuations and that their future is really gloomy, its their own fault. But this will benefit others who did not make that same mistake.
I can believe there is plenty of onshore conventional oil outside of North America that has LOE under $5.
Some have described Russia as similar to US, but being exploited about 30-50 years later, depending on the field.
When our field was discovered, IP’s of 20-1,000 BO were common. Production fell rapidly, but leveled off 5-15 BOPD.
Our LOE would be under $5 if our average well made 10 BOPD.
Also, labor costs in North America are much higher than most other parts of the world. Compare G & A for a Russian oil company to that of the US.
Finally, if there is little water being produced, LOE can be very low, even in the lower 48. We have sub $20 LOE, and even a couple that will come in sub $10 LOE if there are no down hole failures.
I remember seeing a financial report for a company producing in Iraq ran by a former BP CEO. LOE was under $1. But, there was a large expense for paying the Kurdish Army to guard the facilities.
US onshore lower 48 is among the highest cost oil in the world. But US shale is generally even higher than US lower 48.
The key now is not LOE, it is CAPEX. CAPEX for shale runs $20+ per BOE utilizing unit cost depletion, IF URR are not over stated.
Shallow,
This is actually offshore NCS.
I agree the issue for shale is its massive constant capex due to the extreme declines and on top of that they now have a massive mountain of debt to service.
Steve who used to post here from memory did look at the mayors more in detail and showed that it was actually their shale operations that was dragging the entire operations down, their conventional operations still seemed to be profitable.
What i have also noticed is they are desperate for cash and are selling off assets and then its the conventional assets that gets sold, the ones that are still profitable only to pour that cash into the black hole, but what other options do they have at this point? Sell unprofitable shale to who exactly?
I think a large part of todays position is due to simple personal greed, MDs were given bonuses based on production gowth rather that sustainable profitability. They probably all knew what they were doing and what it would do to the company, workers and stock owners but what does that matter if you got 100 millions in your personal account for the trouble.
If they finally run ut of other peoples money their production should start dropping pretty fast and that will be a positive for every well managed oil company out there.
“They’re showing you RIGHT HERE how the suggestion that individual choices—not systems—are a main driver of climate change is a fossil fuel talking point.”
https://www.commondreams.org/news/2020/11/02/shell-oil-asked-what-people-are-willing-do-reduce-emissions-im-willing-hold-you
Yep. FF companies want to discourage collective and government action. Only collective and government action can truly be effective, which is why Koch and company want to cripple government,
Sounds like the other way around actually and that governments want yet more control…
Ultimately controlling demand is the only way to reduce fossil fuel consumption. Who owns the reserves matters less.
That seems like a bit of a separate issue compared to what I was replying to Nick about.
FF companies and governments appear mostly one-and-the-same and/or ‘private’ FF companies are a comparative splash in the barrel. Even so, they’re still government-controlled/legislated/etc..
Nick (and perhaps Islandboy for that matter) seems to prefer that they appear more separate/disparate/indie so that he can weave a bad guy vs good guy tale to get people on board with his ostensible employer, AKA government, and that they don’t catch on to who/what the bad guy really is.
In that sort of tale, ‘Koch and company’ are the classic fall guys or ‘play againsts’ for lack of a better word.
As for your comment, and on the same sort of tack, if governpimps reduce demand ‘unevenly’ or unfairly, they likely increase social unrest. But if they don’t take the FF energy from the so-called poor and/or working classes, what other parts of society can it be cannibalized from and what happens then? The question is somewhat rhetorical but not entirely.
See also here, which spells out the rhetorical a little.
There is no global warming. There was a very pleasant warming in the second half of the 20th century due to the Sun being more active than it had been for the previous 11,000 years. That stopped in 2006. Climate will revert to what it was in the 19th century – frosts in the Corn Belt in mid-summer. Be afraid, but not about global warming.
If it stopped in 2006 then now 14 years later, we should be back to normal. The sun activity cycles every 11 years, on average. So we have gone through an entire cycle since 2006. Things should be normal now. They are not.
In September, Arctic sea ice reached its second-lowest level ever.
Arctic Sea Ice Shrank to Its Second-Lowest Level on Record,
The frozen area in September was 40% below the historical average.
But the big surprise was October. The Arctic is just not re-freezing nearly as fast as previously. The October level was the lowest October sea ice level ever.
In the Arctic, sea ice at its lowest level for the month of October
According to data presented Wednesday by the Danish Meteorological Institute DMI, “the area of the Arctic sea ice is the lowest on record for the season”.
“The rate of growth of the pack ice is slower than normal,” said Rasmus Tonboe, an expert at DMI, who spoke of a “record” October since the start of satellite measurements in 1979.
According to preliminary satellite data, its area was 6.5 million square kilometers on October 27.
In October alone, the ice cover shrunk 8.2% over ten years.
Temperatures 2 to 4 degrees higher than normal.
Back to normal? Hell no, that ain’t normal!
David Archibald. Its like a trump tweet- false and false [par for the course]
If anyone wants a fact-based quick view of this from NASA, here you are-
https://earthobservatory.nasa.gov/world-of-change/global-temperatures
Its not about belief. Its about data collection and scientific analysis.
Mr Archibald,
Can you cite some peer reviewed publications backing up your claim?
Historical reconstruction of Total Solar irradiance in Watts per meter squared see
https://spot.colorado.edu/~koppg/TSI/
data at link below
https://spot.colorado.edu/~koppg/TSI/Historical_TSI_Reconstruction.txt
Chart of reconsruction based on sunspot data before instrumental era from 1610 to 2018 CE.
Dennis, They always go to the TSI to try to explain stuff away, but the solar spot cycles are completely swamped by the daily and annual variations in sunlight.
An as far as the longer term variations, it’s clear that the sloshing of the ocean’s thermocline causing alternating El Nino & La Nina episodes is what causes the quasi-periodic heating and cooling cycles in the global climate. And it’s just a matter of time before they start accepting that the underlying cause of the sloshing is due to the obvious agent — the same gravitational forces that result in tides.
This is the latest substantiation of the model: https://geoenergymath.com/2020/11/05/gravitational-pull/
It is not the TSI, its the magnetic field, in the main. There are a number of drivers involved. Ten years ago I was rated as the No 2 denier scientist on the planet, now I am officially rated as No 137. I lectured on climate science in a US Senate hearing room in 2011 and was invited back in 2013, so I know what I am talking about. Plus CO2 is tuckered out as a greenhouse gas. We’ll be going back to the climate of the 19th century which includes frosts in the Corn Belt in July and all that sort of thing. Nothing dramatic. Don’t be concerned, there are plenty of real problems to worry about, including where the energy is going to come from when the oil runs down, and when the coal runs out, where the carbon to make plastics etc will come from. China’s war of choice could kill millions and then peak agricultural production will hit in the 2030s. I wrote a book about it – “Twilight of Abundance”. These days I do cancer research, concentrating on prostatic. The cancer field is wide open.
“so I know what I am talking about. “
No you don’t. If you knew what you were talking about, you wouldn’t write this kind of gibberish
The most “readily apparent cycle in solar activity” is the daily or annual cycle (take your pick), which any fool can see is clearly associated with cyclic temperature changes.
In any case, we are on solar cycle 25 and I don’t see “colder weather worldwide” so please do not embarrass yourself further.
“Ten years ago I was rated as the No 2 denier scientist on the planet, now I am officially rated as No 137. I lectured on climate science in a US Senate hearing room in 2011 and was invited back in 2013, so I know what I am talking about.”
You do know what you are talking about when it comes to climate change denial.
That does not make you an expert, or even a novice, when it comes to climate science.
Quite the opposite.
This is a “i am very smrt” post if ever I saw one. So, you were a big cheese in the Special Olympics of science denial. Bully for you. I’m quite shit at maths, but you don’t see me going on about it.
You’re still hilariously wrong on climate science. I do fear in an energy constrained world I won’t have the energy to laugh any more at such posts. Maybe I’ll just have to shrug.
Yes, Dave Archibald’s posts are useful — as comic relief. Unlike Trump, who managed to do a great deal of damage to environmental efforts, Mr. Archibald is a harmless moron that no one with knowledge of climate science takes seriously.
For the record, increased human-produced greenhouse gases is many times stronger than any effects due to recent variations in solar activity; for over 40 years, satellites have observed solar energy output, which has gone up or down by less than 0.1 percent during that period.
David Archibald,
Just because one writes a book, does not make one an expert. The magnetic field of the sun may affect sunspot activity and it is closely related to TSI, but rather than handwaving one needs to posit a solid theory as to how sunspot activity affects climate if it is not through TSI.
If we look at TSI vs global temperature the correlation is very weak.
Climate change will be a major problem if it is not addressed.
There are no experts in climate science in the US Senate, just because Senators tied closely to the oil industry in Oklahoma invites a “scientist” to espouse their point of view, does not make you an expert on climate science.
Can you point us to some of your peer reviewed papers in climate science?
Actually, David, the world is getting both colder and warmer, precisely because the sun gets cold in the cold vacuum of outer space, especially at night, when it gives off less heat, but in the morning, when it comes up, it warms up again and even puffs up a little at the horizon, which is why the world gets warmer again. The sun very much has a life of its own.
Way I see it if Biden wins. That is very negative for the dollar as he plans to spend trillions on medicaid for all and a green new deal and there are also a bunch of states that need bailouts. That a huge win for price of oil. Right up until they start talking about lockdowns or partial lockdowns.
If Trump wins. We are going to get a large stimulus package and then likely even more stimulus after that sometime in second half of 2021 as no matter how large they go it wont be enough or last long enough. So a second stimulus package will be needed. Also dollar negative and positive oil right up until the numbers show that there is a recovery in the works. Any real recovery is dollar positive and likely oil negative. As recovery equals withdraw of or no more stimulus.
They are in a trap. Either they spend like drunken sailors until the end of time. Or the deflationary collapse of debt I have been talking about happens.
A real recovery should be oil positive, at least in the medium term. It will crank up oil usage world wide, hitting on reduced investment in oil infrastructure.
All states in voluntary cutbacks of production won’t invest as much as before now, spending billion $s in infrastructure they don’t need now.
Deep sea and pre salt investment was reduced, too.
If they get their wonder vaccine this winter / spring and world wide tourism and missed business trips come back next summer, oil production can lag behind. And US fracking can only restart with 2019 rates of drilling when the oil price already has risen a lot – so it has to overshoot before they can kick in big and collect new investor money.
Just my opinion.
There will be no recovery ever and no effective vaccine in 2021 . Just my opinion . Yes, there will be rebounds , but recovery never .
Or… there will be a effective vaccines and there will be gradual recovery to previous global economic levels.
Hickory ,or we can also take the flight to Mars with Mr Musk at the wheel . 🙂
The train has left the station and it ain’t coming back .
Hole in head,
We will see if the economists are right, they did pretty well in Oct 2009, the pandemic and economic crisis that has resulted is not likely to continue beyond 2021.
IMF forecast from Oct 2009 for World real GDP compared to actual output in chart below. Clicking on chart will give a larger view (this is always the case for any chart posted).
Hole in the Head-
Or, there will be an effective vaccine, I re-iterate.
And economic growth will resume, including oil demand.
Hello Dennis,
From further back,
“I agree the oil age will end, but think both physics and economics will be factors. The oil will only be produced in free market economies if oil companies can make a profit by doing so.”
Rephrased:
“The oil will only be produced in free market economies if oil companies can make a money funnel from the many to the few by doing so.”
Is profit not a zero sum game without economic “growth”?
Regards,
Paul Isaacs
Is profit not a zero sum game without economic “growth”?
Why the quotation marks? Why the implication that we won’t see economic growth?
Hello Nick,
Sorry but that is off topic for this post.
The question is: Does the making of profit imply that the economy has become a zero sum game in the absence of an increase in the size of the economy?
Regards,
Paul Isaacs
I’m puzzled. Surely if my reply is off topic then your question is off topic.
If you want an answer to this puzzling theoretical question: not necessarily.
First, one conventional economics answer is that in a stable economy in the presence of normal competition, risk premiums would disappear and profit would tend to decline to the level necessary to fund continuing investment in the company (which would be necessary for continuing operations). Profit above that level would suggest “rent-seeking” which should be eliminated by anti-trust, etc.
2nd, absence of growth doesn’t mean an absence of innovation and increasing labor productivity and cost and energy efficiency, which means that investment (and return on investment aka profit) would continue. That’s what happened in the Great Depression: farms were under enormous pressure which meant they increased investment in tractors, which reduced food production costs, which reduced food prices, which increased pressure on farms, rinse and repeat.
Economic progress continues, even if GDP is not increasing, and disruption of the status quo continues.
Hello Nick,
Thanks for the reply.
“profit would tend to decline to the level necessary to fund continuing investment in the company (which would be necessary for continuing operations). Profit above that level would suggest “rent-seeking” which should be eliminated by anti-trust, etc.”
Where do dividends fit in; are they “rent-seeking”? Surely investors expect to have more money at the end of the day than they put in.
Where does the additional money come from?
“2nd, absence of growth doesn’t mean an absence of innovation and increasing labor productivity and cost and energy efficiency, which means that investment (and return on investment aka profit) would continue.”
Conversely, in the absence of growth profit only continues only so long as there is innovation, increasing labour productivity and cost and energy efficiency. Are these things without limit? If they are not then the end game is zero-sum. Is it not?
” farms were under enormous pressure which meant they increased investment in tractors,”
Only because fossil fuel made it possible. It is a specific case of increasing labour productivity by using available energy. It is not a general illustration of “in the absence of growth”.
Regards,
Paul Isaacs
Where do dividends fit in; are they “rent-seeking”?
Well, you have to realize this is a very theoretical question: we’re nowhere near a stagnant, no-growth no-innovation economy. Yes, in a stagnant no-growth pure competition economy, dividends should decline steeply as risk premiums decline and capital returns also decline.
Surely investors expect to have more money at the end of the day than they put in.
Sure. Which is why they’ve been pursuing such risky investments lately, like shale. And, of course, losing that risky bet.
Where does the additional money come from?
It’s not additional money, it’s a portion of corporate revenue. $100 comes in, 98 goes out as direct costs and 2 goes out as dividends. This is, of course dramatically oversimplified.
profit only continues only so long as there is innovation, increasing labour productivity and cost and energy efficiency. Are these things without limit?
Actually, they pretty much are. Look at farming. 1,000 years ago it was 99% of the economy. 150 years ago it was 80% of the economy. Now it’s about 1%. That’s the inexorable grind of innovation, and reductions in labor and other cost inputs.
Only because fossil fuel made it possible.
No, not really. Battery powered tractors would have worked, if necessary. Ethanol (or other synthetic fuels) would have worked (the Model T was designed to run on ethanol). Fossil fuel is not magic, and it’s not essential to a modern economy.
It’s true that fossil fuels were especially convenient 300 years ago, and they very likely accelerated the industrial revolution compared to renewable power, which would have required more time to develop comparable utility. On the other hand, we’re at that point now: renewables are cheaper, cleaner, and more reliable (overall) than fossil fuels.
It is a specific case of increasing labour productivity by using available energy.
Probably not – tractors overall very likely used less energy than horses to do the same work: it would take less land to grow corn for ethanol for tractors than it did to grow hay for horses. But even if they used more, why would that be important? Many forms of innovation require resources of some type – are you arguing that energy will become limited and prevent innovation that needs it?
You seem to be concerned about the total amount of energy that renewables might make available. Well, the world economy uses roughly 10-20 terawatts of power, including all forms of “extrasomatic” energy. The sun sends 100,000 terawatts of power 24×7, 7 days a week. We really don’t have to worry about scaling renewable power up to where we need to be.
Paul,
Not sure what happens when economic growth stops permanently, of course there are economic cycles with random frequency, at some point when human population falls at a rate greater than the rate of growth of real per capita GDP, real World GDP growth will decrease. This bridge will need to be crossed at that point.
Hello Dennis,
“of course there are economic cycles with random frequency”
But since Stirling and Watt then Spindletop the economic cycles have ridden atop a dominant expansion driven by an increasing fossil fuel energy supply.
“This bridge will need to be crossed at that point.”
If there is a bridge to cross. We had best start building because “that point” is very close at hand – if not already here.
Regards,
Paul Isaacs
Paul,
Prices of fossil fuel will increase and they will be used more efficiently and gradually replaced using wind, solar, hydro, and nuclear power.
Paul,
A fossil fuel scenario (from 2016) with energy in exajoules. No scenario of the future is ever correct. After fossil fuel energy output peaks and if demand for fossil fuel outpaces fossil fuel supply (very likely from 2025 to 2040 imo) prices increase and substitutes are used to fill the gap in energy supply.
Click on chart for larger view.
No. Profit can be positive sum aka “win-win”. If two parties specialized in different products trade, the trade can be beneficial to both sides, because each side can have a surplus of his product and a deficit of the other.
Growth is not involved at all.
Alimbiquated,
If we assume each of the producers does not change the number of hours worked or capital invested, your example implies greater output, that is that GDP is higher than before, ie that there is a growth in output compared to the case where there is no specialization.
So growth is indeed implied unless we assume the producers choose to work less to keep output the same (all producers choose more leisure and less work and the same amount of output).
Dennis —
I don’t consider a zero growth economy very realistic, but in theory at least you could have a steady state economy where everyone has the same output and profit every year.
Alimbiquated,
Yes in theory it seems possible to have a steady state economy, especially with falling population (after total fertility rate falls to less than 1.9 worldwide). We are not likely to reach that point until well after 2100 in my opinion (this assumes peak population around 2070) and population growth rate reaching -1.45% per year by sometime after 2170. I also assume steady real GDP per capita growth at 1.45% per year.
Markets are rallying but markets also have a big problem. It’s going to take weeks if not months to sort out this election. The likely hood of more stimulus before end of year is very little and even if there is more it will be small as there is a divided congress.
They say bonds are the truth. And yields are headed lower and prices higher. Banks are buying treasury bonds. They have never been more long bonds than they are right now. They are sitting on over 4 trillion dollars worth of bonds. Well if no stimulus is forth coming. Everybody else will also be piling into bonds here real soon. When equities or stocks rollover due to lack of flow. Dollar roars higher.
Oil needs equity markets to roar higher. Equity markets need credit to flow. Dollar credit that is.
If credit contracts enough even bonds get sold because you have to liquidate in to cash to settle debts. That is what happen back in March and FED stepped in and bail everybody out.
Hello Dennis,
“A fossil fuel scenario (from 2016) with energy in exajoules. No scenario of the future is ever correct”
One has to be careful with models. You say that no model of the future is ever correct but if you knew that it was completely wrong, you would not present it.
You are, in effect, saying that the model will not be correct but that it stands enough chance of being somewhat correct to be worth presenting. I think that is dangerous because it tends to guide your behaviour to comport with your model.
You appear are much more sanguine about the future than I.
To illustrate:
I once did a prototype 2-sided circuit board with mixed digital analogue-digital signals. I used 4 operational amplifiers to keep the sensitive analogue inputs away from the noisy digital lines. To board functioned properly.
The design went to a larger company who normally used multilayer boards. I got a call from one of their designers asking if a single chip containing 4 op amps could be used to save 3 chips in the production run. Assuming that he would be using a multilayer board to keep the signals separate, I said sure.
He used a 2-sided board. It failed. His model schematic diagram was correct. But his model did not include analogue-digital cross-coupling.
I would not even attempt modeling in the current unstable conditions. The pace of change is very rapid in a closely coupled global system. The energy, the environment, the economy and the government systems all interact.
I look at:
– fraced oil: rapid decline, marginally profitable – if at all
– tar sands: low quality, low volume, expensive extraction
– carbon dioxide emissions: increasing amounts of heat trapping gas
– methane emissions: increasing amounts from large volume natural sources
– Arctic ice melt: the rate of change is very high
– wildfires: California, Brazil, Australia
– the use of monetary policy: UsingQE and other such measures to avoid economic crisis
– negative interest rates: an attempt to make money circulate
– decades of stagnation in Japan: despite large amounts of liquidity injection
– paralysis of global governance: the failure of collaboration effort for the Paris accord
– paralysis of national governance: Britain and Brexit, deadlock in the USA
I would not, personally, attempt to be modelling under these conditions.
I do, however, believe that we need to admit that:
– energy supply will soon be, if not already, in decline
– the environment is in deteriorating
– the economy in its current extract/discard form is not sustainable
– our governmental systems are failing
and that, in response, we need to immediately:
– start to wind down our energy consumption
– start to stop running roughshod over our environment
– start to deliberately reduce economic inequality
– start to make our governance functional
Regards,
Paul Isaacs
There is no similarity to a model of a circuit, which is all physics. OTOH, modeling human decision theory requires game theory, which is unheard of in physics.
BTW, you probably had no idea why your project failed based on a SPICE-like model, which no way is going to include 3-D layout considerations that would generate ground loops, etc. You are more likely making an assumption of why it failed based on a post-mortem observations.
Hello Paul,
My project did not fail. The board functioned. However, that was only because of past, bitter, experience.
There was no question of why the other board failed. You could easily see the crosstalk from the digital lines on the scope.
Regards,
Paul Isaacs
I am just saying that a SPICE-like analog model would not have discovered the cross-talk. That would need to be a full E-M simulation of unknown difficulty. The point is that the modeling would not have helped as much as applying design-rule heuristics to avoid the problems in the first place. So, I suggest your analogy is flawed as modeling had no impact, whereas Dennis’s model is actually useful.
Hello Paul,
I think that we are saying the same thing.
In complex systems modelling can easily fail to account for second order effects that dramatically affect the model’s outcomes.
I suspect that both SPICE models and Dennis’ models fall into that class.
Regards,
Paul Isaacs
Paul Isaacs,
If you are suggesting models of the real world (generally these would be complex, this is so obvious as it seems unnecessary to state it) will reflect reality imperfectly, I would agree.
That again seems unnecessary to point out, I try not to insult my readers by pointing out the obvious. 🙂
“I suspect that both SPICE models and Dennis’ models fall into that class.”
Not always. One aspect of modeling oil depletion amounts to something as basic as bean counting — keeping track of a finite & non-renewable resource. That’s a first order effect that will not be drowned out by 2nd-order effects. However, your example of an electronic device design was ruined by the 2nd-order effects that emerged.
Paul Isaacs,
Yes the model is likely to be wrong due to other factors affecting the system.
A model of everything is beyond my capability. It would be likely to fail, and would take an infinite amount of time to complete (as it would require an infinite number of variables, assumptions, and interaction amongst variables.) A simple circuit would be child’s play in comparison to modelling the real world.
Note also the chart below compares a slow energy transition to a fast energy transition. The slow transition model has roughly 1200 Pg C total anthropogenic carbon emissions from 1800 to 2100 and the fast transition model has about 782 Pg Carbon emissions from all anthropogenic emissions including land use change from 1800 to 2100 CE.
Also note that I expect reality will fall somewhere between these two scenarios, and there are an infinite number of possible scenarios with probably about 80% of them falling between these high and low scenarios, the paths will not be as smooth as assumed here, random future shocks ( a global pandemic for instance) cannot be predicted in advance.
Hello Dennis,
I am curious about what your model shows for slow/fast global total EJ over the same time period.
Regards,
Paul Isaacs
Paul Isaacs,
I think it is best to look at energy use in terms of exergy, approximately 60 to 70% of primary energy is wasted as heat that is not put to any use. In a World that has moved to replace fossil fuel with wind solar and hydro, most of the energy produced is used for work and not wasted as heat. So much less energy is needed (because roughly 90% of the energy produced by wind and solar will be exergy).
I do not have a chart to show that at present.
Hello Dennis,
Thanks for replying.
Regards,
Paul Isaacs
Paul Isaacs,
Chart for projection of Primary energy assuming primary energy intensity continues to decline at the 1970 to 2015 average rate and real GDP per capita continues average growth rate of 1970 to 2015 and population growth follows the average of the UN low and medium fertility scenarios (population peak in 2069). The gap between fossil fuel energy output and primary energy consumption is filled by solar, wind, hydro, and nuclear power in this scenario, the fossil fuel supply is the average case presented earlier. Supply of fossil fuel may adjust higher if demand warrants, the falling supply in fossil fuel is assumed due to lack of demand as the World transitions to non-fossil fuel energy to address climate change, pollution, and rising costs of fossil fuel relative to alternative sources of energy supply.
Paul Isaacs,
A scenario for World demand for energy (based on a population scenario that is the average of the UN low and medium fertility cases and continued fall in energy intensity and continued growth in World real GDP per capita both at the average 1970 to 2015 rates) and for non fossil fuel energy and fossil fuel energy.
I assume that for non fossil fuel energy only wind and solar output grows and other sources remain at the 2019 level. The rate of growth for wind falls from 15% to 11% (2023 to 2042) and then gradually to 7%(2046 to 2052) and then to under 1% per year. For solar growth starts at 26% and falls to 13% by 2030 and remains at that rate of growth through 2041, then growth rate slows to 7% from 2047 to 2052. Note that demand limited growth for oil grew at 7% per year from 1930 to 1973 on average, wind and solar will grow faster because the demand will drive the fast increase in supply.
Dennis —
Will either scenario keep temperature below 2C (above pre-industrial levels) by the end of the century?
Doug,
As you know I am not a climate scientist and it seems within the climate science community there are different opinions on climate sensitivity.
The fast scenario has 785 Pg C of anthropogenic carbon emissions (all sources) from 1800 to 2100, the “slow transition” scenario has about 1200 Pg C emissions.
A paper by Allen et al in 2009 see https://www.nature.com/articles/nature08019
suggested 1000 Pg C might keep us at about 2 C of warming (it’s an old paper and may not reflect the current science).
Collective Cognitive Dissonance, Pecking Orders & Fouling The Nests: Rinse And Repeat
Doug, that is somewhat of a key question insofar as all previous civilizations that declined and/or collapsed didn’t do so because they ‘ran out of cheap fossil fuels’ or ‘couldn’t make the transition to electrical solar and wind power. So much of this talk and/or preoccupation is a bit moot, a bit of a sidetrack, even a fool’s errand.
So why did they decline and/or collapse?
Apparently, at least in many cases, it was one, the other, or a combination of, environmental degradation and sociopolitical dynamics leading to tipping-point corruption, inequity and social unrest…
But I would suggest to the researchers that those two could be folded into one, namely the latter. This is because of the idea that corruptions didn’t just touch upon a core uncaring attitude toward the general populations, but upon everything, including natural supports and ecosystemic integrity. I mean, if your system core doesn’t really care about people, (and therefore in a sense, itself) then why should it care much about anything else, including its own ‘nest’?
This seems to be where we’re at currently, again…
We apparently cannot, as a species, accept responsibility for our areas of specialization and how they are ‘equitized’, and so, unlike termites, bees or ants, our ‘lot in life’ is to collapse here and there every few centuries or so, rinse and repeat. We appear, as individuals, unlike termites, bees or ants, too complex to accept our specialized roles and in ‘equitized’ fashion that a proper-running complex civilization demands.
Even so, if you accept such numbers along the lines of the Dunbar Number, we are also not cut out for large-scale overcomplex civilization (and its human/material ‘technologies’), either. It’s like a kind of cognitive dissonance to live in one.
So we seem stuck in a paradox of sorts or at the very least, ‘cyclical conundrums’. Can we escape it/them and would we even want to? Would we want ultraspecialized roles like ants to run our civilizations? Assuming some of us did; if some of us didn’t, would we be free to persue our own sociopoliticultural evolutions?
What happened to that Life of Leisure we were ‘promised’, that we were supposed to have by now? We have the tech, we have the skills, we have the energy, we have the time. So what’s the problem? The commodification of nature and people? Theft by another name? Gangster government?
we need to admit that energy supply will soon be, if not already, in decline
Do you believe that electricity supply will decline? That’s what coal and most natural gas is used for, and it’s also what wind and solar (and nuclear,hydro, etc) can provide pretty easily. So, it’s primarily a decline of oil supply that you believe will cause problems, right?
Hello Nick,
No. I believe that problems will be the result of failing to hold power at a level adequate to operate our infrastructure properly.
The problem is not having the wits to build out the needed infrastructure ahead of time. Oil supplies a lot of power. The replacement build will be electrical. The current build is heat engine. There is a lot of replacing to do.
On top of that I expect that people in developed, aka high power infrastructure, countries are unlikely to readily accept the argument that powering down some is a good move.
Regards,
Paul Isaacs
Paul +Isaacs,
Lets follow your line of thought, and for the sake of discussion we assume that your concerns are valid and correct regarding the ability of civilization to successfully replace the ‘heat engine’ with an electrical one.
OK, two things.
-there is no guarantee how much of the transition will happen in a timely manner or at great enough scale, but what other choice does civilization have in response to liquid fossil to fuel depletion, other than to give electrification a full effort? A full effort as in ‘all hands on deck’/ ‘battle stations’ .
-Secondly, civilization is not just one homogeneous machine. Some places who take the effort seriously, and who have more favorable factors such as access to capital, sunlight and water, and brains/willpower, will have a much better time of it than others.
What the f..k are we waiting for? Our access to capital to run dry?
Hello Hickory,
The stautus quo never moves. It is moved – almost always against its will.
The public is on edge because the assurances that all is OK are wearing thin.
The waiting will be over when they have some coherent vision of the future that they can believe in.
The loss of esteem for science hints that offering up new visions of technological fixes will not suffice.
People will believe in themselves if they get the chance. They will do that if they have some reasonable control over what happens in their lives.
One thing they need is to be able to repair, or have repaired, the things that they depend on. Their clothes and shoes, their vehicles, their houses and furnishings.
Relying on disposables from China and Amazon for the basics of life is not a viable future.
People’s connectedness horizon needs to be within their grasp.
We will not stop waiting until people’s lives can again be lived on a human scale.
Regards,
Paul Isaacs
In an ethical society interested in greater permanance, we can probably have all the electricity we want, but without ethics, such that this dystopia has a big problem with at its core, we will likely have next-to-none of it, and it will decline and/or collapse and take a lot with it– as it has done and is doing so. That’s why permaculture’s core is ‘Care of Earth’ and ‘Care of People’.
Well, that’s still very general and non-specific. Let’s be more specific, so we can have a productive discussion:
Do you believe that the US will not be able to maintain a reliable electrical grid?
Nick , an admission , I am not US based . Now to answer your question . NO, the US will not be able to maintain a reliable electrical grid . The US is broke. Period . $ 21 Trillion debt indicates that . + 100 % Debt/GDP ratio indicates that . 70% of the population can’t afford a one time expense of $ 1000 . 45 million persons are on SNAP . I can enumerate the negative financial parameters . The grid requires 24/7 maintains and a regular upgradation . There is no money . Nancy Pelosi did not pass the stimulus bill because Trump refused to bail out the Dem ruled states . The question is not ” If ” but ”when” . I don’t know the interconnectivity of the grid in USA . If NY goes down than so do LA and SF ?
HIH,
The US government has a fair amount of debt. That doesn’t mean it’s broke, but it doesn’t matter either way: the US government doesn’t run the grid. State governments don’t run the grid. The grid is run by utilities, and utilities are doing just fine: they have stable revenue streams and are perfectly solvent and able to invest in new generation or grid infrastructure.
We do have some variation in utility structure: there are integrated regulated private utilities; public utilities (TVA being a good example) and regulated private utilities that only handle distribution. It doesn’t matter: all 3 forms are perfectly able to invest in new generation and infrastructure.
So, if fossil fuels continued to be the norm, is there any question that utilities would continue to be able to build the necessary generation and infrastructure? And, given that wind and solar are cheaper than fossil fuels, why would there be any question that utilities would be able to continue to run a stable grid?
The US doesn’t have a particularly reliable grid now. My guess is that it will get worse, but that that will matter less as energy production decentralized and energy consumption decreases.
The US doesn’t have a particularly reliable grid now.
What makes you say that? Official stats (EIA) say that it has 99.95% uptime (less than 4 hours down per year).
Page 4, 2nd paragraph, https://www.energy.gov/sites/prod/files/2017/01/f34/Maintaining%20Reliability%20in%20the%20Modern%20Power%20System.pdf
New dood appears.
Argentina is making noises about month to month growth (still way down from pre covid).
YPF shuttered some Columbia stuff and Vaca Muerta suddenly had customers who will take the natgas and oil they produce at a loss.
Vaca Muerta needs investment blah blah blah, 98 stages fracked Sept compared to 700 last year. blah blah
Fernandez must solve economic crises blah blah virus blah blah. Europe has a mutation. Of their very own. Nothing is going to fix this. I’m gonna say 2 yrs chopped off societal life expectancy.
BTW what do we know of YPF in Columbia?
Watcher,
Thankfully is wasn’t dud.
New dood —
“Nothing is going to fix this. I’m gonna say 2 yrs chopped off societal life expectancy.”
Well let’s look at the bright side (which seems to be the fashion here); we’ve been looking for a solution to population overshoot. A deadly virus spinning out of control should (could) be considered as good news!
Silver lining!
Excess deaths are floating along at about 850 per day. We tend to think of that mostly as the very old, and probably for good reason. 850 / day translates into an increase in elderly death count per year of about 15%. Society will have to decide to tolerate that and have an economy, or not tolerate that and not have an economy.
Nick ,you wrote “The US government has a fair amount of debt. That doesn’t mean it’s broke, but it doesn’t matter either way:” . Ever heard of a quote ” I am a little bit pregnant ” or ” I am a virgin prostitute ” . 🙂
Sure, but how do on/off conditions like that apply to debt? Once again, we have to think in complex ways, not in simple dichotomies. As debt rises, in certain situations risk of instability will also rise.
OTOH, my point here was that even if the US did have excessively risky debt, it wouldn’t be that important in this discussion, because the US government doesn’t run the grid. Utilities run the grid, and they are stable.
Germany, Japan, and China all have the same problem. Their economies are export based and all of their currencies are appreciating against the dollar with no end in sight. I expect the central banks of Japan and Europe to take interest rates deeply negative to combat this appreciation.
Right now the benchmark interest rate in Europe is -0.549% and Japan is -0.1%. I think Europe goes to -0.75% then -1.0% to -1.5% and Japan goes to -0.5% then -0.75% then -1.0% Neither really have a choice. Appreciating currencies take them down if they don’t act.
China has two choices at moment. Start cutting interest rates until they get to the zero bound or buy a crap load of US debt. When China starts cutting rates watch out. I have to believe it will be extremely bullish for the price of oil.
And the longer they allow this unchecked currency appreciation to continue the stronger the response will be when it does finally come. China also has a lot of room to cut rates. 3.85% is where their short term rate is sitting at right now.
It looks like America still does care about the character of a man, by a slim margin.
I was looking into what needs to happen in order in get the New Green Deal done. Only way to make it happen is with MMT. Which isn’t likely to happen. MMT is where the government spends money into the economy without the sell of government bonds to bring in the money to spend.
The problem with MMT is you actually have to get rid of all the banks to make it work. Everyone would have an account with the US treasury/FED and there would be no banks. The way banking works now is bank reserves are created via purchase of debt. Without the reserves all banks are insolvent.
Now if you believe banks are going to turn over control of the money supply to politicians. And just go quietly. Think again.
With everything we are facing over next 5-10 years. I view oil like a gold bug views gold. I buy oil and exposure to it in different ways as a hedge against all the BS.
Only way to make it happen is with MMT.
Well, there’s politics and there’s economics. From an economic point of view, MMT is not necessary: the economy is functioning well below it’s capacity, and the wealthy are not spending their income. So, just pass a tax on upper incomes and then spend the revenue (on a New Green Deal, or whatever).
Even WWII was financed by a combination of taxes and borrowing.
The US relies on debt for economic stimulus because the wealthy are calling the shots, and they would rather lend their money to the government (and get an asset and an income stream) than actually (gasp!) pay taxes.
This is important, so I’ll say it again:
The idea that expansion of debt is necessary to stimulate the economy is a myth, perpetrated by the wealthy. The economy isn’t functioning because people aren’t spending their money, and by “people” obviously I mean upper income people. So, cutting taxes on the wealthy (which is how taxes are being cut) isn’t going to help: that’s just going to mean that upper income folks are going to save even more than they are now. Nope: we need a more progressive tax structure. The wealthy need to pay much more, and then government needs to spend that revenue on productive things, like education, medical research, energy infrastructure, etc.
Let me say it a 3rd time. Why are interest rates so low? Well, interest rates are the price of renting capital. If the price is too low, that indicates that there is an oversupply of capital. Why is there an oversupply? Because the wealthy are saving too much. They need to pay more taxes!
HHH, good strategy ,but 5-10 years ? Do we have the time ? I have my doubts . My doubts are 100 % ,no, we don’t have the space . Best of luck and be well .
Tin hat time: IMHO both Lincoln and the Kennedy brothers were offed because of their attempts at reform of the monetary system, all being aware of the numerous cautions against the mainstream banking system in USA’s founding documents. Worth trying getting some Social Credit systems in place again tho, with the swamp drained a little.
Yeah, you really need to stop listening to conspiracy theories.
Pro tip: q anon isn’t real.
CHART STUFF
Permian Wells Below 50 .png
The decline on this shale oil stuff is stunning. Already in the mighty Permian Basin, 50% of all HZ wells
drilled since 2008 are below 50 BOPD and still declining at the rate of 10-12% per year.
Let that soak in a minute and ask yourself, who is in charge of America’s oil future and
what in the hell are we doing flaring associated gas and exporting most of this
Permian oil to foreign countries for?
America’s producing oil basins are exhausted; we’re now draining the resource beds, the kitchens
where oil was cooked that supplied those basins. When THAT oil is gone, when
the kitchens are drained, what’s next?
QUOTE STUFF
“Bias makes people stupid.” Brett Hume, Fox News Analyst
From Mike Shellmans blog . There is a difference between amateur’s and professionals
The same chart on Mike’s oilystuff blog shows that 25.4% of the hz wells, or over 7,000, drilled since 2008 are either inactive or producing less than 10 BOPD.
Again, if you look at Enno Peters shaleprofile you find that all of the shale wells completed 2014 and prior just produced 700K BOPD in July, 2020. That’s all of them, all Basins.
Shallow Sand,
If we assume no tight oil wells are completed from July 2020 to July 2021, US tight oil output falls by about 36% from 6645 kb/d in July 2020 to 4242 kb/d in July 2021 (model estimate based on average well profiles developed using shaleprofile.com data.)
Guys , I am not so much computer savy . Maybe someone can pop over to Mike S site and post the chart . Help is appreciated .
Hole in head,
not able to reproduce Mike’s chart, we are limited to 50 kb files here.
I get 3148 of 28071 wells that produce less than 25 bo/d, about 11% of all horizontal wells drilled in the Permian basin since 2008. On the free blog, it is not broken out below this level.
At 50 bo/d or less the shaleprofile blog has 25% of the 28071 wells drilled since Jan 2008 at that level, 7024 wells of 28071. See
https://shaleprofile.com/blog/permian-monthly-update/permian-update-through-july-2020/
Not sure why the charts are not consistent.
Better estimate from well status tab for Permian basin
10.15% of all wells producing no output (inactive or plugged).
10.75% producing less than 10 bo/d but more than zero bo/d.
So a total of 20.9% of Permian wells with output less than 10 bo/d as of July 2020, Mike’s chart is through August 2020 and is more up to date.
11.12% of wells are producing 10 to 25 bo/d, so 32% producing less than 25 bo/d as of July 2020.
13.78% of wells producing 25 to 50 bo/d, so about 46% of wells producing under 50 bo/d as of July 2020.
Dennis ,thanks for the effort . Comforting that it is a technical problem and not my stupidity .:-)
Sobering sapshot of the realities of peak oil.
https://www.zerohedge.com/energy/narrative-problem-after-peak-oil
Longtimber,
Is Watkins a Marxist? There is no source of value, the idea that energy is the source of value is incorrect. This is not to say that energy is not important, but everyone knows that apples are the source of all value (or labor, or capital, or gold, or any good one chooses).
There is no objective measure of value and certainly no “source” of value. I stopped reading when I got to that statement.
I like salt. I want to be paid in salt, like the roman centurions…
🙂
I stopped reading when I got to “zerohedge.com “
You too?
Gentlemen , this article is by Tom Watkins on his website ” The conscience ness of sheep ” . Zero hedge only crosslinked it . It is not the work of Tyler Durden .
Historically religion gave us our value system. Today money measures value, so that money is actually part of the religion of those who use it. That is why the elephant in the room is money creation. To understand markets which determine our value system, one must understand where money comes from, so one must pay very close attention to money creation. The new high priests are those that create money.
I recommend Blair Fix who debunks many common myths circulating about the economy: https://economicsfromthetopdown.com/.
Schinzy,
Money does not measure value, it is simply a means of exchange. There is no objective measure of value, or if you want to choose a yardstick, it will be one whose length constantly changes as the relative value of whatever as chosen as “the” measure of value will change constantly in relative value. See Sraffa’s Production of Commodities by means of commodities (1960), the analysis suggests we can value all goods by choosing any of the others, neo-Ricardians choose labour as the measure, but one could just as easily choose capital and turn Marx on his head. 🙂
If everyone reading your comments stopped doing so when they contained, or were thought to contain, a falsehood and/or something to nitpick or split a hair about, or something along that line, I doubt you’d have anyone left reading them.
But maybe you just stopped reading at that statement because you had to go to the washroom.
From what is understood, money merely symbolizes, is a token of, or represents value or exchange value.
I could knit someone a sweater as one symbol or token of my love for them, knowing that the sweater, itself, and my labor that went into it, would not be an objective measure of my subjective love. Duh.
But that’s ok.
That said, energy as a source of value might make some sense in the sense that it created the universe that created us, that created such things as value and items that we value.
What do you think? Am I onto something?
The narrative problem after peak oil
Ohh, ok, maybe those are more the real reasons why you stopped reading.
See also here
I’ve got lots of potatoes, how many to get that milk goat from you?
What about some goat milk?
…And a gift economy, since we all more or less have and need the same?
Shallow Sand suggested energy consumption correlates well with population (he is correct).
Below we look at Primary energy consumption and population from 1965-2019, the trendline is extended to roughly the population projection for the UN medium fertility ratio case where population reaches almost 11,000 million by 2100.
Scenario below uses the projection for energy demand shown above and a more conservative set of assumptions for the rate of growth for wind and solar power output over the next 40 years. The projection for fossil fuel and non-fossil fuel energy sources is shown where it is assumed that non-fossil fuel energy use from sources other than wind in solar remains constant at the 2019 level (nuclear, hydro, and other non-fossil fuel energy).
The fossil fuel scenario above (a medium case as far as speed of energy transition) has total anthropogenic emissions of about 985 Pg C from 1800 to 2100 (this includes land use change at the level assumed for the RCP4.5 Scenario from IPCC most recent full report (AR5).) If climate sensitivity of about 3 C is correct (this estimate may change in the future), this might keep us close to 2 C of warming above preindustrial average temperature for the past 10,000 years prior to 1800 CE.
https://wentworthreport.com/world-oil-production-outlook/
Dennis, I have written up world oil supply – see link above. If you would like to run in on Peakoilbarrel, email me and I will send you the file.
From the article:
The days of cheap oil are nearly over. A tightening oil market will cause the LNG price to go to the oil price in energy content terms. The next big buffer will be coal to synthetic fuel which requires US120/bbl to provide a return. But oil will be at that price soon enough.
Nah. CTL won’t happen – CTL plants are very expensive and risky, and after the enormous losses of shale oil what investor is going to bet on high oil prices and government tolerance of very dirty CTL? Expensive oil & gas will incentivize renewables and EVs, and eventually synthetic liquid fuel from electrolytic hydrogen.
Has anyone experience with the https://tankertrackers.com/news website? It looks like an interesting view of exports and oil in storage.
Hello Dennis,
Thanks for this. It is a grand bone to chew on. I very much appreciate the work that you have put in.
To me it implies that it will be around 2035 when the seriousness of the task becomes generally apparent.
At that time solar will have increased 2.5 times but the supply of fossil fuels will still be able to maintain the current heat engine infrastructure so transportation will still probably be ICE dominated.
Fossil fuel supply drops to about half by 2055 and that will surely impact heat engines.
The 2 decades from 2035 to 2055 will need to see a large shift from heat engine to electrical prime movers. That shift will be all the more difficult if it there haven’t been significant prototype installations pre 2035. A 2035 cold start would not be helpful.
I would think that by2035 at least some fully non-fossil fuel electrical generation should be online. Because the current infrastructure requires constant supply, It is not an easy problem given the current electrical energy storage technology.
I would rather see a planned reduction in world demand rather than a 33% increase as shown in your model. Humanity can probably live very comfortably with a 50% reduction.
I would also rather plan for an infrastructure that did not demand continuous supply. The non-fossil fuel supply is likely to have energy storage challenges. Surely it would be better to design infrastructure that would be compatible with variable supply.
( Electrical energy is stored in the electrical field. The strength of that field is inverse square so the maximum storage will be obtained at very small distances. That implies that storage will likely be in the electrical field on an atomic scale i.e. chemical storage in batteries.
There are only four forces in nature: gravitational, electro-magnetic, weak nuclear and strong nuclear. Ultimately, there are only four places to store energy.
The gravitational force is long range but very weak. It is mediated by mass so gravitational storage infra-structure will be very heavy and very large – a la pumped hydro.
The nuclear forces are very short range – sub-atomic distances. They are not at all amenable to direct technological manipulation.
The most favourable force for energy storage is the electric field. )
As Jim Croce said “You don’t pull on Superman’s cape; you don’t spit into the wind; and you don’t mess around with Mother Nature” – in the end she holds all the cards.
Respectfully,
Paul Isaacs
Paul,
For energy uses that are simply heat (as in homes and water, as well as many production processes that require heat as in steel and cement) there is the possibility of utilizing excess electricity output to produce heat efficiently using heat pump water heaters and then storing in superinsulated tanks for later use.
Also excess electricity can be used to produce hydrogen (or possibly ammonia) which can be stored and later burned in combined cycle power plants.
Also note the charts consider primary energy, but in reality the electricity output from solar and wind have about 3 times the equivalent exergy of a typical fossil fuel power plant which on average have about 65% of energy lost to waste heat that is not utilized.
As we move to wind and solar (at roughly 90% of total primary energy output in my scenario in 2062 with 10% of total from nuclear, hydro, and other sources (geothermal, biofuels, etc.) from an exergy perspective the actual energy produced would be about 35% of the total equivalent primary energy, so 252 EJ of exergy rather than 721 EJ of primary energy from wind and solar.
So yes considerably less energy will be used in the future simply by switching to wind and solar from heat engines, further improvements in energy use are possible by building better buildings and heating them (and the water used in them) with ground source heat pumps in colder climates and high efficiency air source heat pumps in more moderate climates.
As fossil fuel supply becomes constrained and the World becomes more acutely aware of the coming climate crisis, policies to accelerate the transition to wind, solar, EVs, heat pumps, demand pricing for electricity use, and a buildout of an intercontinental HVDC network worldwide may be adopted.
There is much work to do on the engineering of the system and there will no doubt be many pitfalls so good research is needed.
For anyone who believes the scenario above is unrealistic, the average rate of increase in wind and solar output from 2019 to 2032(13 years) for the scenario presented is 10.9% per year. For comparison I looked at tight oil output over the past 13 years (from 2007 to 2020), the average annual growth rate in tight oil output in the US was 23.79% per year over that 13 year period. Also note that the average rate of increase in World oil and natural gas output (in exajoules) from 1943 to 1973 was about 7%, this rate of increase was demand limited, it is doubtful that demand will limit the increase in wind and solar output over the next 20 years, especially when fossil fuel output peaks in 2030 or so.
For the sake of comparing the 10.9% growth rate of wind and solar presented in this scenario to the current growth rate during this pandemic slowdown economy of the 1 st half of 2020-
“For the period January – June 2020, solar-generated electricity – including distributed solar – expanded by 22.0% year-on-year and provided nearly 3.4% of the nation’s total. Wind grew by 14.5% and accounted for more than 9.1% of total generation.
Combined, net electrical generation by wind and solar is 16.4% greater than a year ago”
The growth of wind and solar energy generation projected by Dennis may end up looking very conservative.
Hickory,
I am focusing on the World rather than individual nations. For the past 5 years (2014-2019) average annual wind and solar output grew at an average rate of 16.99% per year on average for the World (using BP Statistical Review of World Energy data). For the previous 5 years (2009-2014) the average growth rate was 22%, so my expectation is that the growth rate will gradually slow as output ramps up. I agree my projection may be on the conservative side, but we can only speculate about future growth rates.
For comparison, my scenario has an average growth rate of wind and solar output combined over the next 5 years (2019-2024) at 14.27%, and the following 5 years (2024-2029) have an average annual growth rate of 9.88%, the next 5 years (2029-2034) have an average annual growth rate of 9.08%. By 2041-2046 the average annual growth rate for combined World wind and solar output falls to 7% (similar to oil and natural gas annual growth rate from 1945 to 1970).
Thanks for the explanation Dennis.
Hickory,
You’re welcome.
Population vs Primary Energy very tight correlation.
Chicken or Egg scenario-
Plentiful energy allows rapid population growth, or
Population growth creates demand for energy.
I suppose we will begin to see backsliding on the graph this century.
I suspect that the trip back down in population will be traveled with less primary energy than on the way up.
Hickory,
It is pretty clear to me that population is the driver of energy demand, mediated through real GDP as real GDP is also correlated closely with energy demand.
Basically real GDP per capita has grown fairly steadily at about a 1.4% annual rate (1970-2019) so at the World level real GDP and population are tightly correlated.
Chart below shows Primary Energy consumption vs Real GDP for World from 1970 to 2019.
Surely the correlation is tight. My point was that population would not have traveled the path from 1 billion to 8 billion without the plentiful primary energy.
Will lack of resources (including primary energy, photosynthetic products such as food, fiber, fuel, organic content of soils, seafood, and minerals) pull population down,
or will population decline for cultural reasons- education, aging, poverty, war
or biologic reasons- pandemic?
Hickory,
Perhaps population would have grown more slowly with less primary energy consumption or perhaps if energy was more expensive due to scarcity, it might have been used more efficiently and better progress might have been made developing alternatives to fossil fuel such as wind and solar.
There are an infinite number of possible paths that might have been taken in the past had things been different, just as there are an infinite number of possible paths we might take in the future.
I simply take history as given and focus on the path forward.
As fossil energy becomes scarce and expensive relative to wind and solar, my guess is that the World will transition to EVs, plugin hybrids, and hybrids and utilize greater amounts of wind and solar power, build more homes and other buildings to passivhaus standards, use more heat pumps (both air and ground source), build out an HVDC grid worldwide (with connectors between N America and South America and between Europe and Africa, this would enable excess capacity in summer to be shipped North or South as needed and might be cheaper than utilizing hydrogen as a storage medium.) I have not run the numbers to see which makes more sense and it would be a moving target as costs for technology will change in unexpected ways.
moving target
Exactly. It’s always tempting to over simplify. A wide variety of solutions will be useful, and that will vary by time as well as by location and industry. In some places hydrogen or synthetic methane or methanol will be useful. In others demand side management will be more important. In others long distance transmission may be primary. Still others will maximize over-building. Chances are that a wide variety of solutions will be used, often all together in one location.
It’s tempting to think in terms of a single power supply, like solar, or nuclear, but any utility manager will tell you that’s a terrible idea: you need as wide a variety of sources as possible to guard against any problems that are unique to one source. That could be design defects, or just a weather outage related to the power source.
And a wide variety of parallel simultaneous solutions will allow optimization, both of operational effectiveness and of cost.
Nick,
I agree there is no one size fits all, for the purposes of simple models, the complexity of worldwide real solutions is difficult to model so there will undoubtedly be over simplifications (such as my simplifying assumption that all non-fossil fuel sources besides wind and solar remain at their 2019 output levels from 2020 to 2075, which will undoubtedly be incorrect, it was not the focus of the model). Storage solutions were also not modelled, eventually the costs of transmission vs hydrogen, ammonia, or methane production using excess solar or wind output during high wind or high solar output periods (with supply greater than demand). The cheaper solution will be chosen depending upon technological development over the long run. In the mean time there will be a mix of technologies competing for market share. That solution is likely to give a better (lower cost) outcome than governments picking winners and losers as long as externalities are taxed appropriately.
That all makes good sense.
Let me try to expand on one thing:
The cheaper solution will be chosen depending upon technological development over the long run. In the mean time there will be a mix of technologies competing for market share.
I think it’s likely that the mix will persist indefinitely. Every country and region will have a different mix of resources and local costs: they may have more hydro; or less sunlight vs wind (which creates a different profile of variance/intermittency); perhaps a terrain which is more difficult for long distance transmission.
More importantly, different resources are better for different needs in just one region: batteries are best for daily intermittency; hydrogen/methane are best for seasonal intermittency; demand side management is best for seasonal intermittency and disaster management; solar is better for daytime and summer; wind is better for night and winter; long distance transmission is better for continental grids (as opposed to archipelagos like Japan); etc., etc.
Finally, a very diverse mix of resources and operational strategies makes for a more robust grid. It’s very much like a diverse genetic mix in a wild population: it’s much more resilient. Even if a mix of resources appears a bit more expensive in the short run, it’s very cost effective in the long run. Most utilities and ISOs (independent system operators) understand that.
Nick,
I think we are agreeing. I am simply saying low cost options will be favored, in some cases perhaps higher cost options might be chosen for robustness, but it will come down to cost benefit analysis, is the lower downtime worth the higher cost? Consumers will decide.
Consider land transportation for the past 50 years, it has been dominated by oil as far as I can tell. The next 100 are likely to be dominated by wind and solar. The storage solution (which has the dominant market share world wide) is far less certain, one can claim there will be no dominant technology, I just don’t know, the crystal ball is in the shop. 🙂
Yeah, I think we’re in agreement.
And, yes, forecasting is very hard. Heck, I bet on Beta VCRs…
Vaccine is potential game changer. Long end of US treasuries the 10year and 30year have a little room to sale off now. Stocks will be a little choppy. But commodities, oil in particular now have a reason to go higher.
Shell to cut capacity and jobs at its largest refinery in Singapore . They say they are doing it for a carbon free future . Give me a break . 🙂 .
https://www.reuters.com/article/shell-singapore/update-3-shell-to-cut-jobs-and-capacity-at-major-singapore-refinery-idUSL1N2HW0LV