Below are a number of Non-OPEC charts created from data provided by the EIA’s International Energy Statistics.
The charts and table below are primarily for the world’s largest Non-OPEC producers and are updated to July 2019, except for the U.S., which is updated to August 2019. The first set of charts is for Non-OPEC countries with production over 500 kb/d and the last few provide a world overview.
Under some charts are added country comments from the IEA since I have updated data from them up to September 2019. While the IEA production numbers reflect “all liquids”, their July to September increments provide an indication of how the trend in the EIA charts will change by September.
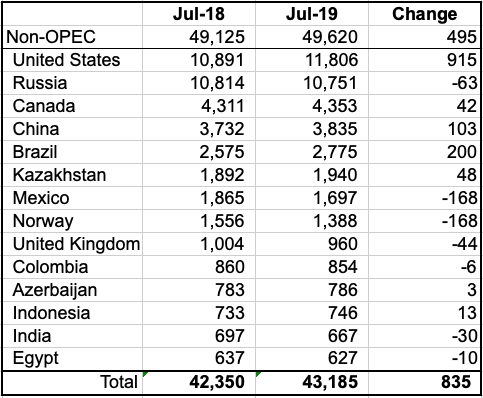
Listed above are the 14 countries with production greater than 500 kb/d. The largest production increases from one year ago come from the US, Brazil and China. The China chart further down indicates that overall, China is in decline. These 14 account for 87% of total Non-OPEC production of 49,620 kb/d in July 2019.
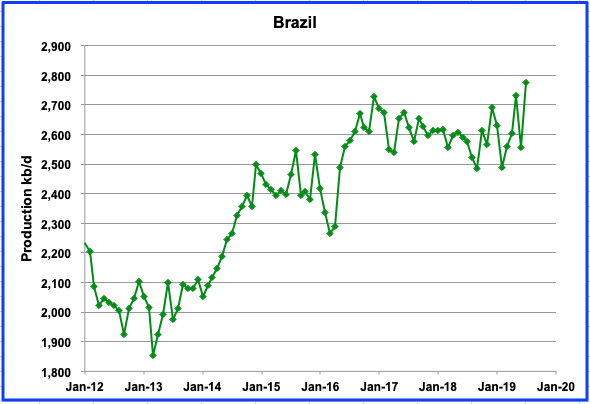
While Brazil’s 2017 and 2018 production were indicating the beginnings of a plateau or decline, July’s production hit a new high of 2775 kb/d by adding 218 kb/d. An additional 220 kb/d were added in August according to the IEA. Production should exceed 3.0 Mb/d by the end of the year. Brazil started four floating production, storage and offloading units (FPSO) in 2019, according to the IEA.
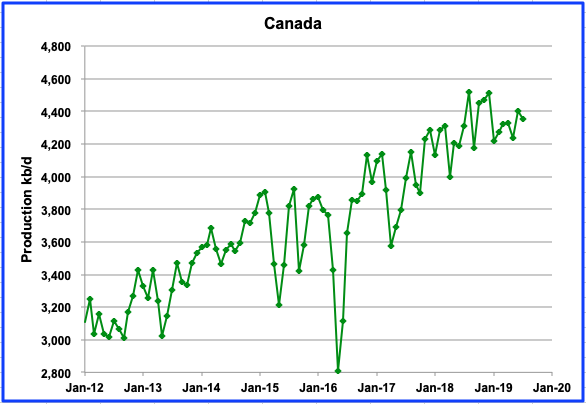
Canadian production continues to be limited by the curtailment rules imposed by the Alberta government. As an incentive to producers, the Alberta government is trying to offload the contract to an oil company. It is closing in on a deal to offload the crude-by-rail program to the private sector. A key point for the private sector will be retaining a provision that allows companies to produce more than their quota under the current curtailment rules as long as the additional oil leaves Alberta by rail. Speculation is that Canadian Natural Resources is the front runner since it has been most affected by the curtailment rules. It produces over 1 Mb/d of oil.
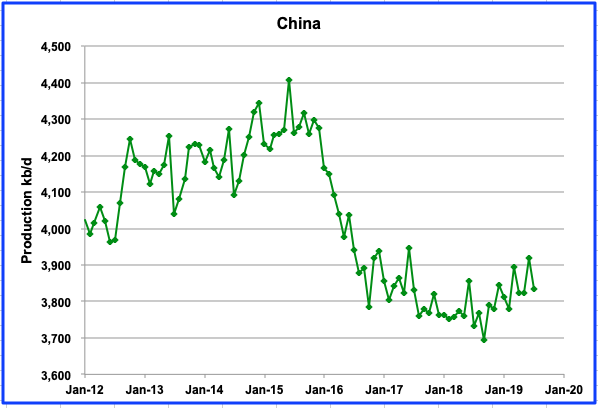
China’s production dropped by 83 kb/d to 3,835 kb/d in July. It is expected to maintain this level of production into 2020 due to increased spending by China’s major oil companies, according to the IEA.
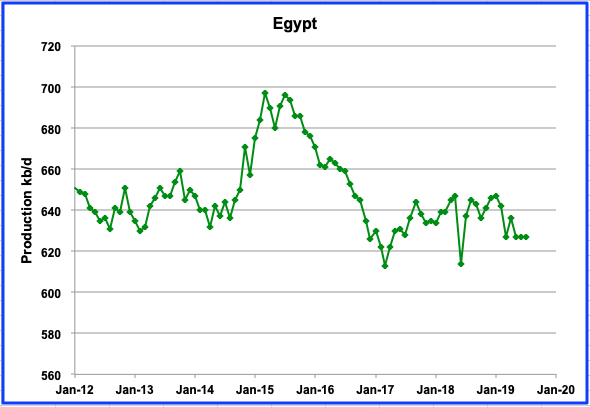
The EIA has significantly revised its oil production for Egypt. Last month they were showing a drop to 586 kb/d. That has now been revised to 627 kb/d and has been flat since May.
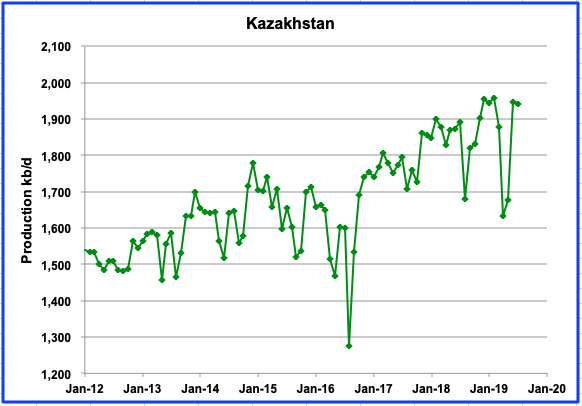
Kazakhstan increased its production from January 2012 to January 2019. It may be close to peak production now.
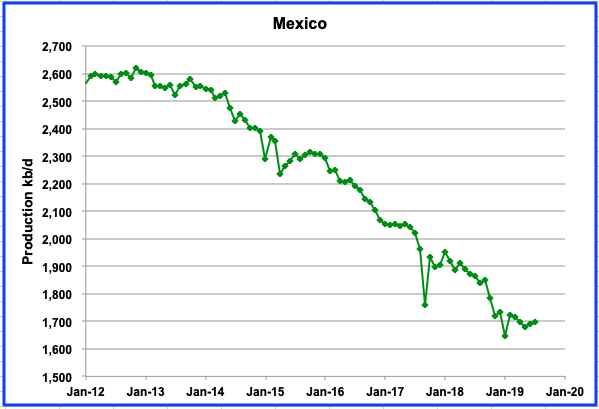
Mexican production is showing signs of stabilizing. The start up of a few small fields has slowed the decline but is not expected to stop it.
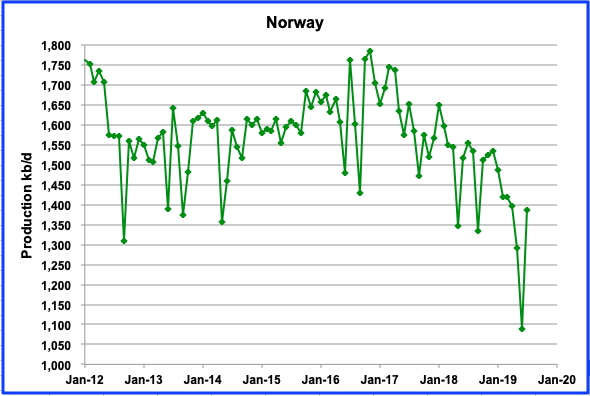
Norway’s production rebounded by 299 kb/d in July to 1,388 kb/d after summer maintenance was completed.
The October IEA report states the following: “On 5 October Equinor brought the much anticipated Johan Sverdrup field online two months ahead of schedule. Phase I of the project is expected to add 440 kb/d of oil production by mid-2020, which will account for over 20% of total Norwegian supply. The initial loading programme suggested that flows in October could average 225 kb/d but most of these cargoes have been delayed to November. However, if the current loading schedule is achieved it implies production at over 300 kb/d on average in November.”
The increased production from the Johan Sverdrup field should begin to show up in the EIA report a few months from now.
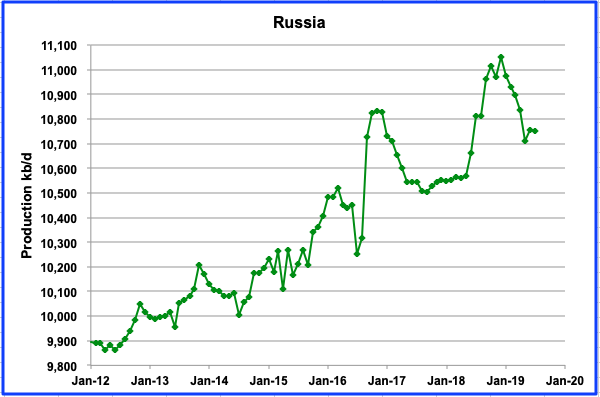
After reaching production of 11,051 kb/d in December 2018, Russia reduced production to 10,709 kb/d to comply with the OPEC+ agreement. For the last two months, Russia has stabilized its production close to 10,750 kb/d as tries to comply with its quota under the agreement.
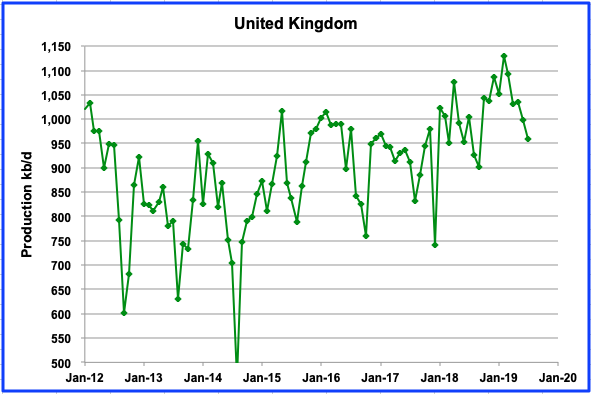
Summer maintenance continues to curb the UK’s production. It is expected to return to producing between 1 Mb/d and 1.1 Mb/d once maintenance is complete.
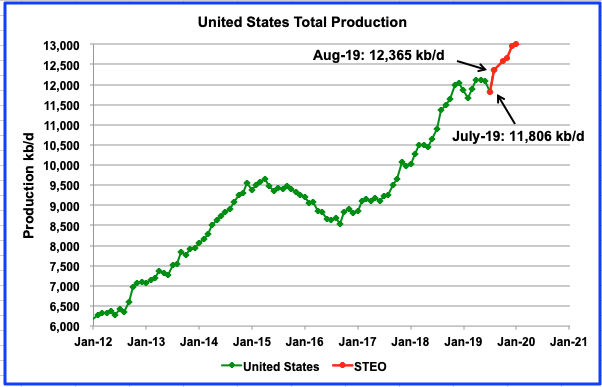
US August production rebounded to 12,365 kb/d from the July hurricane induced slump. The participants/contributors to this site will continue to debate whether U.S. production will plateau in the near term or continue to rise? The STEO projection out to Feb 2020 has been added to show the EIA’s latest estimates for future production. The October STEO estimate and the actual August production numbers are very close.
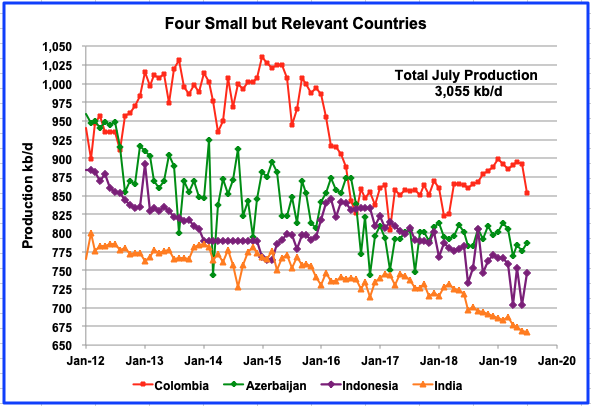
These four countries complete the list of Non-OPEC countries with annual production between 500 kb/d and 1000 kb/d. All four are in decline. Columbia started to increase its production in July 2018, however that has stopped now due to riots. It has investment plans to increase production.
According to Reuters, “Some $700 million in investment spending by oil companies operating in Colombia is frozen because of contract delays caused by community protests and consultations, slow environmental licensing and court orders, the Colombia Petroleum Association (ACP), an industry group, said on Wednesday.”

World C + C production is down from 84,512 kb/d in November 2018 to 81,204 kb/d in July 2019, a drop of 3.308 Mb/d. Of the 3.308 Mb/d drop, 1.130 Mb/d was contributed by the drop in Non-OPEC during that same period. (See next chart) The July drop was 505 kb/d and of that, the US accounted for 276 kb/d due to hurricane Barry. The major part of the drop is the reduction associated with OPEC+.

Non-OPEC production is down by 1,130 kb/d from December 2018 to July 2019. Primary contributors are Canada (-159), Norway (-147), Russia (-300), United Kingdom (-126), US (-231), Malaysia (-151) for a total drop 1,114 Mb/d. The production drop from these countries is related to temporary conditions and more than likely recoverable. However as time goes on, decline in those fields will continue.
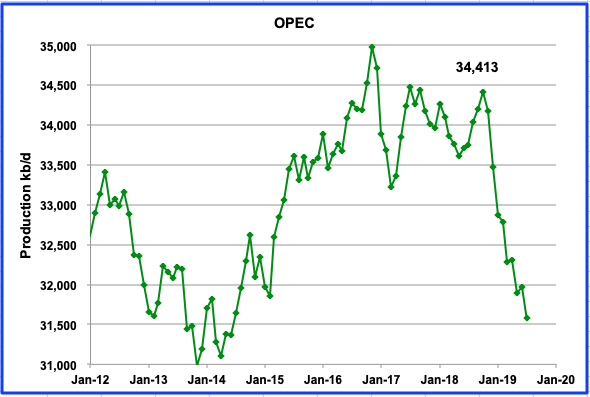
OPEC production is down significantly and is expected to stay down. Will it ever get back to 34,413 kb/d or 34,976 kb/d, not likely using a conservative decline rate of 2% that never sleeps.
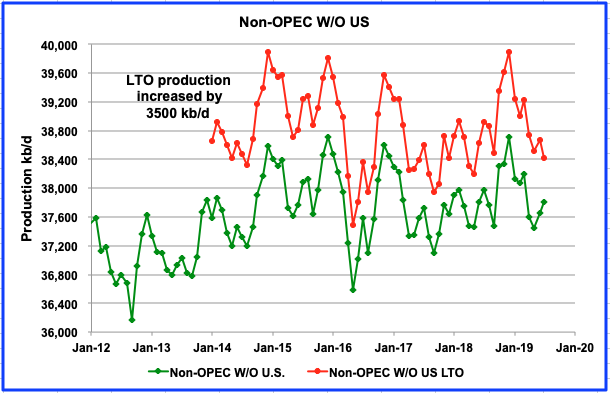
This chart shows two graphs; Non-OPEC W/O total US production and Non-OPEC W/O US LTO. To get the two graphs close and on the same scale, 3500 kb/d were arbitrarily added to the LTO production. As can be seen the trends are very similar. This is probably one of the more critical charts that bears watching in the future. It provides clear evidence that the Non-OPEC producing countries, excluding the US, are on a plateau. This year will be critical since Brazil and Norway are both bringing on new fields with a production capacity of approximately 400 kb/d each. Adding that production to the 37,800 kb/d in July would bring production to 38,600 by the end of the year. Of course, this excludes the decline that never sleeps and is discussed below.
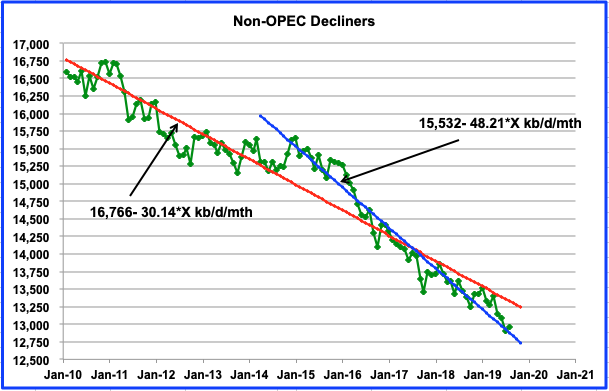
This chart shows the total oil production from Non-OPEC countries that are experiencing declining production and meet the following two criteria:
- Production declined between December 2014 and December 2018.
- Production declined between December 2014 and July 2019. This second criteria is included to eliminate countries that have begun to increase production in 2019, such as Brazil.
The Red line shows the average decline rate over the last nine years and is slightly more than 30 kb/d/mth. There appears to be a higher decline rate starting in January 2015 and is approximately 48 kb/d/mth or close to 575 kb/d/yr. Using 15,000 kb/d/yr as a reference and the higher decline rate, the yearly decline for these Non-OPEC countries is 3.8%. An interesting case of a country in decline is shown below,
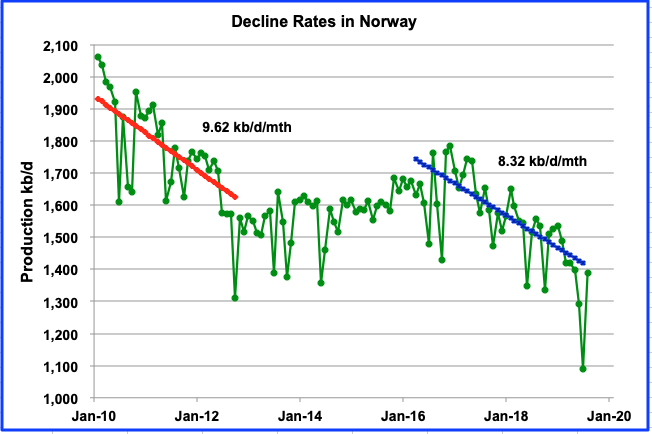
Shown above are two periods in which Norway’s production was in decline. The first period from January 2010 to January 2012 exhibited a decline rate of 9.62 kb/d/mth. The second from January 2016 to the present shows a decline rate of 8.32 kb/d/mth. The average of the two is 9 kb/d/mth. So while the Johan Sverdrup field is expected to add 440 kb/d of new production over the next year, the decline rate from older fields of slightly more than 100 kb/d/yr will constantly be there.
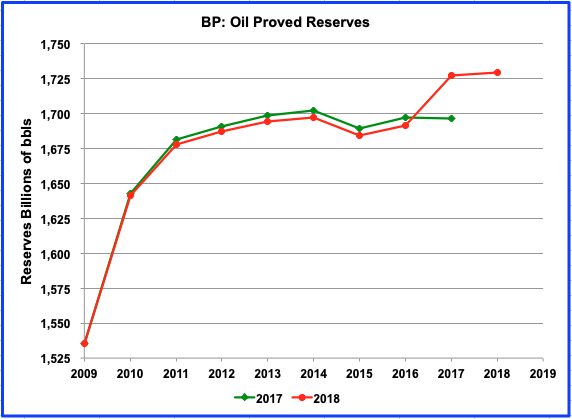
In a previous post, the question was raised regarding the recent low annual discovery rate of new fields and how it was close to 1/6 of the oil we consume annually. Above are BP’s estimate of remaining proved oil reserves. Plotted are the 2017 proven reserves (Taken June 2018 report) and 2018 proven reserves (Taken June 2019 report). Note the dramatic decrease in reserve additions after 2011. Also note how the updated 2018 data, shows lower reserve additions from the 2017 data up to 2016.
The jump in 2017 is due to the US adding 11.2 B bbls and Saudi Arabia adding 29.8 B bbls (Getting ready for the IPO??) for a total of 41 B bbls. However, these may be updated reserves in known fields, as opposed to new discoveries. The actual 2017 increase from 2016 was 36 B bbls on the chart. The increase from 2017 to 2018 is only 2 B bbls.
Clearly the world’s oil reserves are in the peaking phase. Considering that the world has consumed close to 1,400 B bbls up to now and there are an additional 1,700 B bbls left, this adds credibility to Dennis’ use of a URR close to 3,100 B bbls. Since we consume close to 30 B bbls annually, the world has about 55 yrs of oil left, provided we can continue to produce and consume C+C at the rate of 80 Mb/d.
Re: The world C+C 12 month moving average
Is this IT? Have we reached the point where US fracking can’t keep up with its own decline rate, plus the decline rate of conventional fields?
Naw, the 12-month moving will bottom out late next year then, very likely, turn back up. Some say it will make new hights by 2021 or 2022 while others say it will be a bumpy plateau for several years then turn down… for good. I am among those others. But we are all just trying to make an educated guess.
World oil production will make new lows in September and October. The 12-month moving average will not turn up by any significant amount until those months go off the average.
Scenario below is one such “plateau” scenario for a “medium URR” scenario for World C+C of 3200 Gb consisting of 2800 Gb of conventional oil, 90 Gb of tight oil and 270 Gb of extra heavy oil (API Gravity less than 10 degrees mostly from Alberta and Venezuela).
Peak plateau from 2023 to 2027 at 85 Mb/d, but a longer plateau form 2018 to 203, if we define a 3 Mb/d window from 82 to 85 Mb/d for the plateau. In either case the midpoint is roughly 2024/2025 of the long or short plateau. The average World C+C output from Jan 2018 to Dec 2030 is 83.8 Mb/d.
An alternative plateau can be defined as 81 to 85 Mb/d lasting from Jan 2015 to Dec 2032 with average output over that period of 83.1 Mb/d for the scenario presented, the midpoint would be 2024 for that plateau.
Note that a different URR assumption would change the scenario, this is my best guess, but in the past most of these guesses have been wrong (typically on the low side.) One might argue that the tendency of past guesses on the low side may have led to a guess in this case that is too high, only time will answer that question.
If we assume that Dennis has nailed global production out to 2045 with this chart, we are talking about an average decline of available oil supply of 1%/yr over the next 25 years, or so.
Does this equate to the end of the world, as we know it?
I’ve had the assumption of some sort of ‘yes’ answer to this question, over the years.
I had expected oil production shortfall to be earlier and more abrupt, than it has been.
But now, I see it differently. There is viable scenario where the worlds economy could weather this storm of less oil energy in the intermediate term.
Getting by with 1% less/year doesn’t sound too hard to adjust to.
A lot depends on what the oil is used for.
Beefing up energy resilience of the economy is a smart thing to use it for, like rail infrastructure, building insulation, wind/solar production and transmission. Frivolous uses like luxury travel not so smart.
By the end of this period most countries will have already reached their peak population, with a few notable exceptions- places like India and Nigeria. Asia as a whole will achieve peak population very close to 2045.
https://ourworldindata.org/future-population-growth
The countries still growing are going to have to make do with much less oil/person. Some of these countries already use much less/capita than others- For example [Oil consumption per capita (bbl/day per 1000 people)]
Nigeria 1.6
India 2.6
Over 40 [ex. Taiwan, Korea, Netherlands, Australia, USA, Canada]
https://www.indexmundi.com/g/r.aspx?v=91000
This transition depends so much on big choices and policies. Poor choices seem to be an inherent character of human affairs, such as engaging in war. But the possibility for a non-catastrophic pathway is higher than I had previously considered.
Hickory,
I agree with all except the assumption that my scenario will be correct through 2045, always keep in mind there are an infinite number of scenarios one could create, the odds of my “best guess” being correct are exactly 1 divided by infinity, aka about zero.
Just wanted everyone to keep that in mind. Also, I might be in the ballpark up to 2025, by 2045, perhaps same continent. 🙂
If my many assumptions used to create the model all proved correct, the model would be pretty close to reality. Generally assumptions used as inputs to the model are wrong and the model is not a perfect mirror of reality in any case, just a simple approximation.
“Does this equate to the end of the world, as we know it?”
Short answer: Yes.
Longer answer: The world “as we know it” is based on a huge amount of energy inputs per person. Those will dwindle. A lot of Graeber’s Bullshit Jobs will vanish as no longer supportable make-work projects. So the consumer led, infinite growth model will come to a close. No question about that. It remains to be seen if the “smash and grab” crowd or the newly emerging regenerative-cooperative crowd win the battle to define what comes next.
Graeber’s analysis is very interesting. But anarchist views generally are:
https://en.wikipedia.org/wiki/Debt:_The_First_5000_Years
But anarchist views generally are
Agreed.
This is sort of a joke because he bangs on about how debt is by government fiat by doesn’t notice that something more fundamental to market economics — property — is a government fiat as well.
To all you doomsters worried about debt, let me tell you how Chairman Mao dealt with it. Back in his guerrilla days the first thing he did when he took a town is burn all documents in the local archives relating to land ownership and debt. Problem solved.
And the villagers loved it, because rural China was collapsing under a debt crisis at the time. So his army kept growing.
A lot of awful things and a lot of good things have happened in China since then, but the debt is gone forever. It vanished in a puff of smoke. Even if the Communists had lost the war, the debt would still be gone.
So Chris,
lets explore this just below the surface.
Lets say that you decide, come hell or high water, I’m will never have a vehicle without a gas engine.
OK, so could you find a way to cut back on your consumption of petrol, and all the products dependent on petrol use,
about 1% every year?
And if you went down that path, in which year would the world end as you knew it?
qualifications- I do think that certain industries, and certain countries, will have a tremendously hard time as oil becomes short. Others not so bad. Also, this potential soft scenario depends on changes being gradual, rather than big lurches. And on people making smart decisions.
Yeah, life as we know it is going away. But that’s not bad:
EVs are faster, quieter, and just as cheap (or expensive, if that’s what you’re into).
Passive Houses are more comfortable, and just as cheap.
Electric rail is safer and faster, for freight & passengers.
Electric trucks are faster and cleaner.
And infinite hard-goods consumption growth has already ended in the OECD. It ended oh, maybe 40 years ago in the US: car sales, home sales, TV sales, washer/dryer sales…all plateaued around 40 years ago.
CM didn’t mention transportation Hick; It seems to me that some here feel that only thing about the future that needs discussing is the EV vs ICE dichotomy, and ‘people making good decisions’
Good job future prognosticators. You should all work as analysts for CIA Dept of Complicated Operations.
Survivalist,
That is a major part of the peak oil constraint as much of C+C output is used for land transport.
Lots of other problems, climate change, environmental degradation, overpopulation, these subjects are often discussed in the non-petroleum thread.
Higher prices for fossil fuels in general either through depletion or carbon taxes (or both) are likely to lead to substitution of alternatives for fossil fuels. Nobody has any illusions that a transition to non-fossil fuel will be easy, but it is surely necessary and the sooner we start the process the easier it will be.
Lots of solutions, better insulated and sealed buildings, heat pumps including ground source in warmer climates, nuclear, wind, solar, hydro, fuel cells, batteries, hydrogen, ammonia, public transport, HVDC transmission, and possibly a few EVs are some of the potential solutions.
Switching to a more plant based diet might also help, but here we need to be careful about unintended consequences, a better solution might be less meat in the diet and more grass fed cattle.
Of course there is much that has been left out, but I agree EVs are only a small part of the overall solution.
Survivalist.
True about CM, but I brought up transport since it is the primary use of crude oil (something like 70% of crude goes for transport).
Seems like crude for light vehicle transport would be the first to be curtailed [or substituted] in a time of crude shortfall. The crude used for farming and various industrial uses would be the last to be curtailed, if there is a any sort of rational market forces at play.
I don’t follow you on this (you can follow yourself)- ‘Good job future prognosticators. You should all work as analysts for CIA Dept of Complicated Operations.’
rationing will come again
https://www.1900s.org.uk/1940s50s-petrol-rationing.htm
” Cars were therefore absent from the roads. All large cars were confiscated and converted into vans and ambulances. ”
WW2 diet too I ‘d posit
( our fuel taxes on ” motor spirit ” https://www.nextgreencar.com/car-tax/fuel-duty/ and also add VAT 😉 )
something Americans need to think seriously about .
Forbin
Forbin’s post reminded me of what Cuba went through when the Soviets cut off oil shipments to Cuba.
https://en.wikipedia.org/wiki/Special_Period
I always remembered the Cubans losing an average of almost 20 lbs.
forbin- “rationing will come again ”
Perhaps. That could certainly happen in a time of rapid decline.
But it might not go down that way.
Decline might not be rapid.
Check out the chart of global production Dennis put up. If it is close to what actually happens, there will a 10% decline from peak production in about 15 years.
That is not so rapid a decline as to require extreme measures like rationing.
A more rapid decline in certain places is probable if war or depression arises. Then all bets for gradual supply decline are off.
The bigger risk is political. Ask the Cubans. They had rationing despite plenty of oil on the markets. Much of the world production available for export in the next 20 years will come from Russia, Saudi, and other Gulf nations.
I’m not confident that will be a smooth ride for importers.
forbin
there are now two viable alternatives for ground transport if rationing (by the market or the government) is imposed.
One is horses.
Second is an electric vehicle.
Choice is yours.
ok, bikes as well if you insist…
Rationing is already here.
We do it with money, what’s in your wallet ?
Economics 101
“OK, so could you find a way to cut back on your consumption of petrol, and all the products dependent on petrol use, about 1% every year?”
Sure I could. But that’s peering at 1 square inch of bark on a tree of an indeterminate species in the middle of a wilderness.
My views are shaped by studying the interlocking dependencies of a highly complex just-in-time global delivery system coupled to a system of finance/banking that operates really swell in ‘forward’ but seems to shatter when tucked into ‘reverse.’
Looked at another way, I see our ‘economy’ as a gigantic dissipative engine that owes most of is complexity to the flows of energy through it.
Less energy flowing through and suddenly there’s less complexity.
That’s code speak for “tens of thousands of economically negative jobs and industries disappearing.” Fewer jobs = less complexity.
Carry the energy deficit far enough and it’s code speak for “billions of people starving to death.” Fewer people = less complexity.
Currently the US is just 5 percent of the world’s population but consuming 24% of global energy- or nearly 5x its per-capita share of energy. Can the rest of the world “be like the US?”
No, it cannot. Not unless energy consumption can be expanded by (1/0.05)*24% or a factor of 4.8.
The real question is; given the rise of China and India how much longer can the US be allowed to print up Treasury paper and use that consume the same proportion of the actual real wealth of the rest of the world?
When that equation gets re-balanced, and it will, many posting here might be surprised by the impact that has on “what’s possible.”
Chris says “The real question is; given the rise of China and India how much longer can the US be allowed to print up Treasury paper and use that consume the same proportion of the actual real wealth of the rest of the world?” Wonder too.
Correct. Americans have been consuming more they produce for decades. So the import goods and services, and export fancy printed paper.
The solution to the problem is to consume less. As OFM points out. start by driving smaller, more fuel efficient cars. Export oil instead of burning it in monster trucks.
I share much of those concerns Chris.
The fragility of the global financial, and economic, systems are greatly underestimated it seems to me.
Without perpetual growth in energy, or other aspects of the economy, the system could fragment at many points.
But, that depends entirely on the human management response. Not on the actual loss in available joules of energy in the next couple decades [if you subscribe to the notion of gradual decline that Dennis’s chart project].
In this country, every sector and every household could scale back 1% oil consumption/yr for the next couple decades, with ease I’d say.
[btw- I saw an advert by a vet-run solar and roofing company yesterday. They are recruiting more electricians- saying they pay over 100K plus benefits. The adaptation to 1% less oil/yr doesn’t have to mean the end of the world, if it is gradual.
https://www.sempersolaris.com/ ]
Trump says China is cheating us. Are we not cheating China?
Chris,
Yes the world is complex, just in time inventory can be changed, you did not address the fact that only about 40% (possibly less) of primary energy is actually utilized to perform useful work (so called exergy). With the elimination of thermal power plants and ICE vehicles. much less primary energy is needed to run the system. Heat pumps also reduce the need for energy, as does a passivhaus building standard, car pooling can also help, better urban and suburban design can also reduce energy use.
There is much that can be done, higher fossil fuel prices might lead to some of these changes, but an economic crisis in response to peak oil is pretty likely to lead to many of the necessary social changes.
The World economic system might be more resilient than you believe, there is also a lot of energy that can be utilized to power an energy transition.
“There is much that can be done, ”
That right there is the nub of my frustration. We already have the technology and know-how to do things far more efficiently and intelligently. But – here’s the rub – we’re *not.*
Not at scale at least. I could drive a couple of hours and find a demonstration building using the latest low-energy designs, but none are within walking distance in my small city. Not yet.
Why not?
Beats me, except to rephrase the alleged Churchill quote by saying “we’ll eventually do all those right things after we’ve exhausted every other possibility.”
BAU is a powerful force. It does not ‘go away’ all by itself. There needs to be champions and risk-takers. Money needs to be applied for the long-term good even though there are cheaper options in the here & now.
This is what irks me – ‘we’ know how to do better, and we *can* do better, we’re just not doing either at the moment.
Chris-
” There needs to be champions and risk-takers. Money needs to be applied for the long-term good even though there are cheaper options in the here & now.”
Excellent description of the work of Elon Musk, and the policies voted for by the citizens of states like Calif, who have opted strongly for aggressive renewable energy production mandates.
I agree.
Chris,
Completely with you on that (as in 100%).
Perhaps a crisis will lead to us quickly discarding all the “American” options and moving on to Churchill’s “right thing”.
My only contention is that it is possible to achieve an energy transition, if smart people ruled the world, this would have been achieved already. Unfortunately the average person sees trees, not forest.
also known as the “technocracy” movement. King Hubbert was actually involved in this and wrote a course manual describing what is involved in creating policy based on smart technology choices.
https://www.academia.edu/36408669/M._King_Hubbert_-_Technocracy_Study_Course_1945_Technocracy_Inc_.pdf
Currently the US is just 5 percent of the world’s population but consuming 24% of global energy- or nearly 5x its per-capita share of energy. Can the rest of the world “be like the US?” No, it cannot. Not unless energy consumption can be expanded by (1/0.05)*24% or a factor of 4.8.
That would be wasteful. The sensible thing is to reduce energy consumption by a factor of 4.8.
So, let’s look at one example, that accounts for roughly 45% of oil consumption: the average US light vehicle uses about 1.5 kWh per mile. The average EV uses about .25kWh per mile. That’s a ratio of 6 to 1.
So, convert to EVs, and reduce energy consumption by a factor of 6. Get better driving performance, quiet, safety, much less pollution.
Freight can go by rail instead of trucks: rail is about 3x more efficient. Then rail can electrify, which gives about 3x better thermal efficiency. We reduce energy consumption by a net factor of 9. And rail is cleaner, and far safer for other coexisting travelers.
A Passive House reduces net energy consumption to zero. That’s reducing energy consumption by factor of…infinity? And you get quieter, more even temperatures, better air quality.
Getting rid of fossil fuels is definitely not Business As Usual – it’s better.
“The average EV uses about .25kWh per mile.”
I love how these EV’s just magically appear as low energy devices, like fruit plucked from a bountiful tree.
Each Tesla-style EV has a battery pack that required 500,000 pounds of mining waste to be processed and dumped somewhere. Out of sight, out of mind, I guess?
Not to me.
Again, let’s stop looking at the bark. What about the forest? How many exojoules are we talking about and how are those going to be delivered?
And, no, the wind towers and solar panels don’t get to just appear magically so we can begin counting their benefits without first counting their costs.
Think container ships. How many of those operate by electricity? Currently = zero.
Jumbo transport jets….how many by electricity? Again zero.
How much industrial Ag is done with electricity alone? Again, zero.
Honestly, I’m really tired of the EV being used as some sort of relevant device…the amount of energy consumed by personal transport is small in the scheme of things. It proves nothing.
Worse, it might prove we’re stuck in a rut of wrong thinking. What if the future isn’t about people driving their own cars?
Our “economy” is a giant dissipative structure. Our finance system is dependent on that structure continuing to expand exponentially forever. I’d prefer a conversation about how (or rather *if*) we might begin to install and use systems that aren’t dependent on that gigantic machine running at full speed.
For example, can a wind tower be produced, used, dismantled, and then replaced using only locally derived products and using only energy from that same wind tower (or a set of them replacing themselves)?
We haven’t a foggy clue about that. Trust me, there’s a few learnings along that path…
Citation?
Chris,
There is a huge amount of wasted energy in the system, with a lot of thermal power sources capturing 30% to 40% of primary energy input.
We can do much better and as prices for primary energy increase as they deplete we are likely to use energy more efficiently and switch to sources where better efficiency is easier to attain.
Chris,
So you want the solution to all problems all at once.
I tend to focus on one problem at a time.
About 70% of C+C is used for land transport. Nobody is suggesting wind and solar panels appear magically nor does anyone suppose they need to be built locally.
As oil and other fossil fuels deplete they become expensive and may be gradually replaced by wind solar nuclear and hydro. No magic required they are built one project at a time just like oil wells, gas wells, coal mines, hydro dams, and electric power plants. Output of EVs, wind, and solar have been growing at 15% to 30% annual rates. Rapid progress in eliminating fossil fuel output can be made at those rates.
Then we focus on cradle to grave local manufacturing or we focus on everything at once. More equal distribution of income and better human welfare/ living conditions will tend to lead to a lower total fertility level and lower rates of population growth.
The silly meme that anyone claims that EVs are the solution to all human problems is pretty facetious.
They might help to reduce demand for C+C, no more no less.
Keep in mind one needs to compare costs.
Doing things as we are now vs some alternative.
Don’t like EVs or wind or solar, or energy efficient buildings or heat pumps?
Your alternative is?
I can’t speak for Chris, but some people don’t think about alternatives. They just want to witness a ‘crash and burn’, so they can be right about it all.
Hickory,
I think Chris wants to see solutions, he is skeptical that they will ever become reality, such skepticism is warranted in my opinion.
I do not think he believes it cannot be achieved, but that realistically it will not be achieved.
I have not read all of Mr Martenson’s work, so I do not presume to speak for him. That is my impression from the little I have read and/or heard.
For clarification- I speaking about others who have expressed the sentiment, not Chris. Wouldn’t presume to.
You are not Chris Martenson.
Shame on you for posting under that title.
Rose,
Who are you talking to?
If it is Chris Martenson, what makes you believe it is not Mr. Martenson?
Uh…yeah..it’s actually me. I’ve had this account here for a long time.
Happy to be vetted by Dennis if that would help.
Thanks for confirming Chris.
The quality of the comments led me to believe if it was an imposter they were a highly informed and intelligent one.
Thanks Dennis. 🙂
“It remains to be seen if the “smash and grab” crowd or the newly emerging regenerative-cooperative crowd win the battle to define what comes next.” ~ CM
I’m leaning towards thinking that most folks will utilize the ‘Black Friday’ model of rationing.
LOL
That’s about right. Maybe not for the bulk, or even the vast majority, of the population.
But even if it’s “just” 5% that’s enough to make it a lousy situation.
If 95 people walk past you on the street, but the next 5 mug you, I consider that a very bad situation.
Your so-called ‘smash and grab crowd’ might not have such an easy time of it. Even the “the newly emerging regenerative-cooperative crowd” can pull a trigger in defense of their stuff.
Thanks Ovi, informative post.
Agree!
Yea, thanks!
https://oilprice.com/Energy/Energy-General/The-Drilling-Frenzy-Is-Over-For-US-Shale.html
Downturn coming.
Guy
Glad to see you are back. We miss your insights
GuyM,
Thanks, good article. Perhaps flat completion rate going forward, if so and my models are roughly correct (both assumptions could be wrong) we might see a tight oil scenario something like this.
Dennis
Does your model use the same well profile for the years going forward. Sounds like the future wells may not have as many barrels and the time to reach 100 k barrels will begin the increase, reversing the trend that Enno has been showing over the past 5 years
“Echoing Sheffield’s comments, Mark Papa said that this wasn’t only due to spending cuts. “Most people will ascribe the low U.S. growth to capital discipline. But I think the larger reason is what I’ve been talking about for several years the shift to Tier 2 and 3 drilling locations in all shale plays and increasing parent-child issues in the Permian,” Papa said.
Ovi,
Yes I assume new well EUR decreases over time. For Permian basin the EUR of the average well for my “medium scenario”, is below. For each tight oil basin there is a decrease in EUR, I have 5 separate tight oil models (Permian, Eagle Ford, Bakken, Niobrara, and other US tight oil), these 5 models are combined together (just added up) for the US tight oil model. For most basins I assume the decrease in new well EUR starts in Jan 2019, though we really do not have solid evidence of this so my models may be too conservative if anything.
What that story doesn’t say–and other stories about the drilling slowdown in the shale fields don’t say– is,
does this slowdown include well completions? A story I got off search engine a week ago showed that, for example, the Permian Basin had 3,350 Drilled, Uncompleted (DUC) wells. If the slowdown only means that new wells aren’t being drilled, there would still be a big backlog of uncompleted wells. Would those just sit, uncompleted, until (presumably) oil prices tick back up to a profitable level in the Permian? Or will they get completed, even with a new well-drilling slowdown?
If the pace of completions remains on course, the production could still increase for quite some time even if new drilling slows.
This is probably a question for drilling geeks actually working out in the fields.
Cheers,
B.G.
B.G.
If capital spending decreases, the number of completions will also decrease, the data is pretty fuzzy, these cut backs are relative to previous plans, it is unclear how many completions were planned before the announced cut backs in capital spending, the rate of increase in tight oil output will gradually diminish and may turn negative at some point, my guess is roughly 2025, but we will see.
So at the same time OPEC 14 lost several mbpd. How could this not be peak?
Peter Starr,
If oil prices rise, OPEC+ will increase output, also tight oil producers might increase their completion rate if oil prices rise, a reasonable scenario for tight oil in that case has a peak of about 10 Mb/d for US tight oil in 2025, that is the scenario used in the 3200 Gb scenario for the World where I assume that eventually oil prices rise to at least $90/b in 2017$ by 2027. The assumption by many that oil prices will remain low (under $75/bo in 2017$) for the long term seems a highly unlikely scenario between 2021 and 2035 in my opinion.
> “If oil prices rise, OPEC+ will increase output”
But if oil prices rise the world economy will contract and use less oil. Consumers may switch to alternative fuels or electric. Demand is also a function of price.
Hans,
From 2011 to 2014 Brent oil prices averaged $117/bo in 2017$, the World economy grew at about 3% (real GDP at market exchange rates) over those 4 years. So it is not clear that an increase in the price of oil to $90/b in a World with higher real income is likely to have the effect you expect.
Of course demand is affected by price especially in the medium and long term, that is exactly why the price of oil will need to rise because at a lower price the amount consumers wish to consume will be more than the amount of oil that is profitable to produce at that price. Some increase in output and some destruction of demand will happen at higher prices until the market is balanced.
Hans, your scenario would produce kind of a sawtooth-graph, which in opinion is the most likely come out: We will see an undulating plateau for about a decade, combined with the high effort you mentioned to switch to alternative fuels and electric (which all have the disadvantage of an enormous upfront investment).
But: IMO, a growth-orientated economy that can’t grow anymore, will implode rather sooner than later, taking with it all its monetary and debt-oriented structure, thereby creating a mere survival-based economy. This might not be the kind of economy preppies are waiting for, though. I rather await a kind of officialdom where the free market is replaced by a planned economy.
The best outcome, of course, would be enough fossil fuel to buy time for a smooth transition to renewables and some extraordinary progress in fusion energy. Who knows. Fracking, for example, is probably nothing but a Ponzi scheme, but in the long run, it could save the world: Maybe, maybe we get enough time for a smooth transition and manage to put in place alternatives. Someone would have to give, thoug: probably retirement funds and their likes will just evaporate.
The main constraint at present is oil, there is quite a bit of natural gas and that and renewables can take us through for electric power. As oil depletes and increases in price there is a possibility there might be a gradual shift to plug hybrids and EVs which will gradually reduce demand for oil.
It is by no means a given that this is likely to occur smoothly, in fact my sense is that the opposite is more likely. The ensuing crisis may be just the kick in the pants the World needs to move forward on the policies needed to achieve a transition to non-fossil fuel energy, difficult to know what humans might accomplish if pushed and a decision is made to work together towards a common goal.
Historically this has occurred in response to crises, could happen again.
Agree Westexas….
Ovi,
You wonder if OPEC output will be able to recover to the recent high in Oct 2018 of 35140 kb/d, keep in mind that 69% of the 2727 kb/d decrease in OPEC output from Oct 2018 to July 2019 was due to decreases in Iranian (-1378 kb/d) and Venezuelan (-496 k) output, the rest of OPEC output decreased by only 853 kb/d over the same period. I would agree that Venezuelan output will likely take many years to recover(and may never do so), Iranian output could increase fairly quickly with an agreement on the Iranian nuclear program, though that looks unlikely to occur any time soon. Saudi Arabia probably could increase output by 900 kb/d so a return to 33.3 Mb/d seems probable.
Note also that OPEC nations have a lot of reserves that probably are not producing. If we assume the average extraction rate (5.5%) at the World level can be applied to OPEC, they produce about 12 Gb per year (at 33 Mb/d). For producing reserves we would get 12/0.055=221 Gb of producing reserves. OPEC claims to have about 980 Gb of conventional reserves, if 221 Gb are producing reserves, that implies 759 Gb of non-producing reserves. The decline in output from producing wells can be relatively easily replaced by drilling new wells to develop non producing reserves.
It is also possible that the average extraction rate from producing reserves in OPEC nations is considerably lower than the World average in which case the producing reserves estimate would be proportionately higher (if the extraction rate were half of the World average, our producing reserve estimate would double).
In that case we might assume that the extraction rate could be increased/or if left the same, simply develop more reserves.
Unfortunately we don’t have much visibility into OPEC, it is mostly speculation.
Dennis
I agree that the visibility of what is happening in OPEC is not the best. However we do get scraps of information that give us a clue.
We know that Ghawar’s production is declining at 2%, after their drilling program to offset natural decline of 8%. That is 76 kb/yr, based on the the Aramco report that Ghawar is currently producing 3.8 Mb/d. Looking at Ron’s charts from his September post we see the following countries are in decline, Algeria, Angola, Gabon, Kuwait (this one bears watching) and Nigeria. The combined decline adds up.
I also wonder about the SA offshore Safaniya Oil Field. Looking at the decline rate of Norway’s offshore fields, between 5% and 6%, I have to wonder what is happening to Safaniya. I have read that offshore fields have higher decline rates than onshore. Not sure why. Maybe somebody could provide some insight.
On another subject, I also wonder about the decline rate in the GOM.
Ovi, Safaniya is in very shallow water. In much of the field, you can actually see the bottom. The wells are all on stilts sitting on the bottom. I know, Safaniya was where I spent most of my time when I worked for ARAMCO.
So Safaniya is not your typical offshore field.
Ovi,
The Saudi offshore field is shallow water, which tends to behave more like onshore fields, it is the deep water fields that tend to decline more quickly. Eventually every field will decline as is the case now for Ghawar. For OPEC as a group, they may have a lot of undeveloped resources, so they may have the potential to remain on a plateau (as a group) for quite a long time. World C+C output is likely to start declining sooner as non OPEC nations have fewer reserves and may start declining soon, it is unlikely that OPEC will be able to fill the gap, output will decrease by 2026 and oil prices will increase starting around 2023 (possibly as early as 2021).
Note also that OPEC nations have a lot of reserves that probably are not producing. If we assume the average extraction rate (5.5%) at the World level can be applied to OPEC, they produce about 12 Gb per year (at 33 Mb/d). For producing reserves we would get 12/0.055=221 Gb of producing reserves. OPEC claims to have about 980 Gb of conventional reserves, if 221 Gb are producing reserves, that implies 759 Gb of non-producing reserves. The decline in output from producing wells can be relatively easily replaced by drilling new wells to develop non producing reserves.
Thanks for posting this bit of math Dennis. I knew you were a “math type”, which I am not. But I never dreamed you were this good. You found 759 Gb of undeveloped reserves. Just which countries have these undeveloped supergiant fields? Do these supergiant fields have names? When were they discovered?
Ron,
No, but if the reserves reported by OPEC are correct, which Ovi seems to assume and we assume as I did that the World average extraction rate can be applied to OPEC, then we get the result I gave. Note that not all proved reserves are producing reserves, for example at the end of 2017 the US has 40.99 Gb of proved C+C reserves and 17.2 Gb of those reserves were proved non-producing reserves, meaning that 23.79 Gb of the reserves were producing reserves. In 2018 4 Gb of C+C was produced by the US so the extraction rate was 4/23.8=16.8%.
The point is that not all proved reserves are producing reserves, if we assume the average extraction rate in non-OPEC nations is 12.5 %, it implies at the end of 2017 producing reserves in non-OPEC nations were 141 Gb and OPEC producing reserves were about 335 Gb, using the shock model estimate for World producing reserves of 475 Gb at the end of 2017, that implies an extraction rate for OPEC of 3.8%. The non producing reserves would be reserves minus producing reserves. OPEC claims about 980 Gb of conventional proved reserves (I think these are likely to be 2P or possibly even 3P reserves) so if that claim is true (I am skeptical) non-producing reserves would be 980-335=645 Gb. If the OPEC reserves are actually 2P reserves then proved reserves would be about 980/1.4=700 Gb and proved non-producing reserves would be 700-335=365 Gb.
As I suggested earlier we can only speculate about OPEC reserves, very little real data since 1980.
No, but if the reserves reported by OPEC are correct, which Ovi seems to assume and we assume as I did that the World average extraction rate can be applied to OPEC, then we get the result I gave.
Dennis, so-called OPEC proven reserves are a joke. Hell, I thought you knew that.
Ron,
We don’t really have enough information to make a judgement in my opinion. Though I tend to think the reserves reported by OPEC are likely to be 2P reserves and perhaps even 3P reserves. Hard to know, but in a 2014 paper they found that BP proved preserves for the World matched IHS 2P reserves for the end of 2011.
See section 3b of the paper linked below
https://royalsocietypublishing.org/doi/full/10.1098/rsta.2013.0179
Using BP data and assuming non-OPEC 2P/1P=1.3 we get a 2P/1P ratio of 1.22 for OPEC reserves where we assume OPEC reserves reported by BP are 2P reserves. Using the 1.22 ratio for 2P/1P reserves, I would estimate in 2018 that OPEC proved conventional reserves are roughly 800 Gb.
For World 2P conventional C+C reserves we would have about 1590 Gb and cumulative discovery of about 2900 Gb for World conventional C+C+NGL, if 300 Gb of this was NGL, that would leave 2600 Gb of cumulative conventional C+C discovery with 200 Gb more to be discovered to reach my 2800 Gb “medium scenario”.
Ignore last two paragraphs in comment above, I realize I made some calculation errors. OPEC reported reserves are actually more than 2P reserves. Better data in comment linked below
http://peakoilbarrel.com/eia-non-opec-oil-production-updated-to-july-2019/#comment-691382
OPEC claims to have ~ 1.19 trillion barrels of reserves as of the end of 2018.
https://www.opec.org/opec_web/en/data_graphs/330.htm
End of 2019 it will be probably be 1.5 trillion.
Ridiculousness if you ask me.
Dennis says “conventional” reserves. Which is about what they claim when you remove Venezuela’s heavy oil reserves. But even that number is absurd.
However Dennis says they have 759 Gb of non-producing reserves. That one blew my mind.
Oh yes true.
Ron what exactly is the definition of non-producing reserves ?
I really have no idea since I have never heard that term before. But I suppose it would be reserves that have never been drilled.
Saudi Arabia has many very tiny fields that have never been drilled. But they are tiny and very remote. The reason they have never been drilled is that it would be totally uneconomical to pipe water in, for waterflood, over the sand dunes and pipe the oil out over the sand dunes or hard desert all for the tiny amount of oil they would get. But I seriously doubt that Saudi has any economical reserves that have not been drilled and then infill drilled on top of that. Ditto for the rest of OPEC.
Iron Mike,
They are proved reserves that have not yet started producing.
Quantities of proved liquid or gaseous hydrocarbon reserves that have been identified, but which did not produce during the last calendar year regardless of the availability and/or operation of production, gathering or transportation facilities. This includes both proved undeveloped and proved developed non-producing reserves.
https://www.eia.gov/dnav/pet/TblDefs/pet_crd_nprod_tbldef2.asp
Iron Mike you will probably understand better than Ron.
OPEC claims conventional Proved about 949 Gb at end of 2017
World average extraction rate from producing reserves is 5.6% in 2018, OPEC output in 2018 was 12.7 Gb so 12.7/x=0.056, where x is producing reserves for OPEC, x=12.7/0.056=227 Gb. Here we have assumed OPEC extraxtion rate is equal to the World average rate based on the Oil shock model medium scenario.
In fact OPEC extraction rates are probably lower than the World average, maybe 3.8%, so producing reserves are 12.7/.038=334 Gb. That estimate is based on an assumption that non-OPEC extraction rates average 12.5% (US was at over 16% in 2018).
OPEC reserves are likely to be 2P reserves proved are possibly 2P/1.4=700 Gb for OPEC conventional proved reserves, that would put proved non producing conventional OPEC C+C reserves at 700-334=366 Gb.
Thanks Dennis,
Just one part I am fuzzy about.
You wrote:
OPEC reserves are likely to be 2P reserves proved are possibly 2P/1.4=700 Gb for OPEC conventional proved reserves
Why the division by 1.4? I am assuming you are taking 2P reserves as the OPEC stated of 949Gb.
Iron Mike,
The 1.4 is a guess based on data from UK North Sea reserves where they report 1P, 2P and 3P reserves. Using data from 1973 to 2013 the 2P/1P ratio for UK reserves ranged from 1.3 to 2.3, with an average of 1.7.
I simply used the low end at 1.4, as using a higher number such as 1.7, gives pretty high 2P reserve estimates for the World, the 1.4 seemed to give somewhat more realistic results.
Looking back at my calculations I made an error on World 2P reserve estimates.
In fact it looks like the OPEC reported reserves are above a typical 2P estimate for year end 2011. If we assume, using BP reserve data for 2011 that this is equal to 2P reserves as suggested by the Miller et al 2014 paper, that the non-OPEC conventional proved reserves have a 2P/1P ration similar to UK reserves (1.7), then the reported OPEC conventional reserves are 1.286 times higher than the 2P reserves (760.4 Gb vs 978.1 Gb reported reserves).
A further assumption that the 2P/1P for non-OPEC conventional remains 1.7 in 2018 and that OPEC conventional 2P reserves are 1/1.286 of those reported as “proved” conventional reserves by BP we would have at the end of 2018 for conventional C+C+NGL 2P reserves:
OPEC=761 Gb
non-OPEC=517 Gb
World=1278 Gb
cumulative output=1335 Gb
cumulative discovery=2613 Gb=1278+1335
For Proved conventional C+C+NGL reserves:
OPEC=448 Gb
non-OPEC=304 Gb
World=752 Gb
Note that I agree with Jean Laherrere that it makes much more sense to use engineering best estimates (which is the 2P estimate) for reserves, which is essentially the F50 estimate. Proved reserves are not really very useful.
My “medium scenario” assumes there will be about 200 Gb of future cumulative conventional oil discovery which combines both reserve growth (meaning revised estimates with better knowledge as reserves are developed) and new field discoveries.
UK data at link below
https://assets.publishing.service.gov.uk/government/uploads/system/uploads/attachment_data/file/441395/Appendix_2_Historic_UK_Oil_and_Gas_Reserves_and_Production_2015.pdf
Dennis,
Pretty interesting calculation. If i am following you correctly, your revised 2P OPEC reserve of 761Gb, would render the result of the proved non-producing conventional OPEC reserve of:
761/1.4 – 334 = 207Gb
Seems pretty low even with assuming no revision of current reserves and new field discoveries within OPEC.
Please correct me if calculation is wrong. Thanks.
Iron Mike,
Your calculation is exactly correct for the assumptions used.
I have changed some of the assumptions (for example I misremenbered the UK data,and used 2P/1P=1.4, when I double checked the correct figure was 1.7).
So I get 450 Gb (OPEC proved) minus 330 (at an assumed 3.8% extraction rate) so proved non producing reserves would be 450-330=120 Gb. Note that I use 2P/1P=1.7.
I agree this seems too low. Probably my original assumption of 5.6% for OPEC extraction rate makes more sense with the revised proved reserve estimate.
So 16/0.056=290 Gb for proved producing reserves and 450-290=160 Gb of proved non-producing OPEC conventional reserves.
Keep in mind there are also 310 Gb of probable OPEC conventional reserves, by my estimate.
Note that I realized my earlier estimates had some false precision and I have revised figures to only 2 significant digits as that seems more reasonable (and probably still more precise than warranted.)
Non OPEC nations would have about 190 Gb of producing conventional reserves and 110 Gb of non-Producing conventional reserves, where we have assumed the World average extraction rate applies to both OPEC and non-OPEC nations.
Dennis,
I wonder if the statistical significance of 2P/1P ~ 1.7-2.3 for the north sea has implications for other conventional fields. Lets assume it does.
The final value of 160 Gb of proved non-producing OPEC conventional reserves is pretty interesting. So lets add the 310Gb of probable reserves to this. So you get 470Gb. Still significantly less than what is reported.
Would the 310Gb of probable reserves be 3P ? Or is it something different, like 3P-2P?
Iron Mike,
Reserves have 3 “P” s proved, probable and possible reserves. Proved are F90, proved plus probable (aka 2P) are F50 and proved plus probable plus possible (aka 3P) are F10.
The 3P/2P ratio for UK was about 1.5 in 2014.
See link below for an extensive discussion
https://www.spe.org/en/industry/petroleum-reserves-definitions/
It is not clear that we can apply these UK estimates to other parts of the World, unfortunately it is the only easily accessible data.
To make things a bit more concrete, in 2014 UK reported for C+C+NGL, 342 million tonnes of proved reserves, 404 million tonnes of probable reserves, and 344 million tonnes (Mt) of possible reserves.
1P=proved=342 Mt
2P=proved+probable=746 Mt=342+404
3P=proved+probable+possible=1090 Mt.
So for OPEC if we used the 3P/2P=1.5 estimate we would have 3P=1100 Gb for conventional resources, with only a 10% probability that reserves would reach that level.
The OPEC conventional proved reserves may be about 450 Gb, roughly 2.1 times less than OPEC claims (roughly 930 Gb conventional C+C “proved” reserves), if the assumption that UK 2P/1P ratios can be extended to the rest of the World and the findings in the Miller et al (2014) paper are correct.
Note that this estimate fits well with my “medium” World Oil shock model, which proves nothing except internal consistency.
We do not know what World URR will be, we can only speculate.
Ohh i get it. Thanks Dennis.
So 3P – 2P = possible reserves.
Do you have a link to the Miller et al (2014) paper ?
So do you think OPEC is presenting their 3P estimates on their website? That seems to be the case.
That’s interesting that there is a correlation in your medium world oil shock model. What is your estimate of world URR? I believe if memory serves me correct you agree with Laherreres estimates of ~ 2.7 trillion barrels?
Iron Mike
Link below
https://royalsocietypublishing.org/doi/full/10.1098/rsta.2013.0179
My Estimate is pretty close to Laherrere’s, his is about 3000 Gb+/- 200 Gb. My estimate is 3200+/-400 Gb for World C+C URR.
Thanks so much for the link Dennis the source of information in that paper is invaluable.
For anyone interested the pdf link is:
https://content.csbs.utah.edu/~mli/Economics%207004/Royal%20Society-The%20Future%20of%20Oil%20Supply.pdf
Dennis it seems OPEC estimated reserves are ~ 3P so we are assuming P10. Which means that at least ~ 120Gb of reserves is recoverable. (I am going by their website and including Venezuela https://www.opec.org/opec_web/en/data_graphs/330.htm )
If we take Venezuela out and concentrate on conventional reserves we have a P10 of ~ 90Gb. My guess is that the 2P OPEC conventional reserves are at between 400-700Gb . Of course this is assuming no exaggeration of reserves and going off their 3P estimated number on their website, which they are passing off as 2P. What are your thoughts?
Iron Mike,
If the IHS estimates are correct, I think OPEC 2P conventional reserves may be roughly 700 Gb. Probably Orinoco is about 100 Gb, so adding that in perhaps 800 Gb of C+C 2P reserves for OPEC. Probably 700-900 Gb from my perspective.
Thought we should post reserve info from BP and OPEC. Numbers are Billions of barrels. Total reserves according to OPEC in 2018 is 1,190 B bbls. The BP chart shows 1,217 B bbls for 2018 and 527 B bbls in 1985. The Opec and BP numbers are very similar for 2018 and in some cases identical, except for Saudi Arabia. Not sure why BP added 30 B bbls in 2017. A lot of questions regarding the jump in reserves that occurred in the late 80s. Note that the increase is almost the same or larger than the reserves in 1985.
Ovi, it is very important to understand that BP has never done a survey of OPEC reserves. They get their information directly from OPEC. They just repeat whatever OPEC tells them, perhaps occasionally with some slight alterations.
Ron
As you say, many of the numbers in the two reports are identical. My main point was to show the massive reservoir increases in the late 80s. I am hoping that someone could provide some insight on whether any of the increases had any credibility. What is intriguing is why Kuwait didn’t participate in that numbers game. Their increase seems credible.
Nope, Kuwait is perhaps the least credible. In 2006, when the report from Petroleum Intelligence Weekly came out, Kuwaiti citizens clamored for a survey of reserves. Kuwait promised to take the survey and release the data. They took the survey but then declined to release the results.
Kuwait and oil reserves
Published on April 4, 2006 in Peak Oil by Kjell Aleklett (Bold mine)
During the last two months, we now have seen two articles with alarming news about the production of crude oil from Kuwait. The first came in November by James Cordahi and Andy Critchlow at Bloomberg and was entitled: Kuwait Oil Field, World’s Second Largest, ‘Exhausted.’ A quote from the article:
The plateau in output from the Burgan field will be about 1.7 million barrels a day, rather than as much as the 2 million a day that engineers had forecast could be maintained for the rest of the field’s 30 to 40 years of life, said Farouk Al-Zanki, the chairman of state-owned Kuwait Oil Co. Kuwait will spend about $3 billion a year for the next three years to expand output and exports, three times the recent average.
To boost oil supplies, “Burgan by itself won’t be enough because we’ve exhausted that, with its production capability now much lower than what it used to be,” Al-Zanki said during an interview in his office in Ahmadi, 20 kilometers south of Kuwait City. “We tried 2 million barrels a day, we tried 1.9 million, but 1.7 million is the optimum rate for the facilities and economics.”
Reuters has just delivered a second alarming message: OPEC producer Kuwait’s oil reserves are only half those officially stated, according to internal Kuwaiti records seen by industry newsletter Petroleum Intelligence Weekly (PIW). “PIW learns from sources that Kuwait’s actual oil reserves, which are officially stated at around 99 billion barrels, or close to 10 percent of the global total, are a good deal lower, according to internal Kuwaiti records,” the weekly PIW reported on Friday. It said that according to data circulated in Kuwait Oil Co (KOC), the upstream arm of state Kuwait Petroleum Corp, Kuwait’s remaining proven and non-proven oil reserves are about 48 billion barrels. Officials from KOC were not immediately available for comment to Reuters. PIW said the official public Kuwaiti figures do not distinguish between proven, probable and possible reserves. But it said the data it had seen the show that of the current remaining 48 billion barrels of proven and non-proven reserves, only about 24 billion barrels are so far fully proven — 15 billion in its biggest oilfield Burgan.
Ron
Now that you bring that up, I do remember that report. Thanks
Ron,
That report is pretty old. It remains the case that we are mostly in the dark on OPEC reserves, no doubt they are less than claimed, how much less is the subject of endless speculation. My guess is that actual proved conventional OPEC reserves are about 2.2 times less than claimed (using EIA estimates from link below).
https://www.eia.gov/beta/international/data/browser/#/?pa=0000000000000000000008&c=000000000000000000000000000000000008&ct=2&tl_id=5-A&vs=INTL.57-6-OPEC-BB.A&cy=2016&vo=0&v=T&start=1980
Dennis, of course, it is old. It is over 13 years old. That report gives their reserves in 2006. Thirteen years of production means their reserves are even less today.
Dennis, no major oil company or think tank questioned that report when it came out. Not one! And why, why, did the Kuawti officials suppress the actual data after they did the survey?
Though your link shows an EIA chart, the EIA got that information from OPEC. Do you actually believe that someone from the EIA did a survey of OPEC reserves?
Dennis, wake up and smell the coffee. So-called OPEC proven reserves are bullshit from top to bottom.
My guess is that actual proved conventional OPEC reserves are about 2.2 times less than claimed.
OH, sorry about that Dennis. You are agreeing with me?
Ron
Yes I agree OPEC proved reserves are overstated by at least a factor of 2, they are reporting something close to 3P reserves and calling them proved
OPEC chart
Ovi,
It is understood that the reserve increases in the eighties are likely to simply be using 2P or perhaps 3P reserves as “proved” reserves as the quotas assigned were based on “proved” reserves.
Read section 3b of the 2014 paper below:
https://royalsocietypublishing.org/doi/full/10.1098/rsta.2013.0179
From that paper:
Globally, BP [13] estimates 1263 Gb of conventional proved reserves in 2011 (slightly more than cumulative production to date) and 389 Gb of non-conventional proved reserves. The latter comprise 169 Gb of Canadian oil sands and 220 Gb of Venezuelan extra-heavy oil, but both estimates are disputed and only a fraction of this volume is likely to be recovered over the next 25 years. In principle, global 2P reserves should be larger than 1P reserves, but according to an authoritative industry source (IHS Energy) global 2P reserves are approximately the same as national declared 1P reserves—suggesting an overstatement of proved reserves by several producing countries.
I focused on conventional reserves and thus deducted the Venezuelan Orinoco reserves (220 Gb) and Canadian Oil sands resources (169 Gb) from the 2011 BP total (1678 Gb) to find conventional “proved” reserves of 1289 Gb.
I assumed 2P reserves equal to 1290 Gb for the World and used the UK 2P/1P average ratio from 1973 to 2014 of 1.7 for non-OPEC proved conventional reserves (311 Gb).
For non-OPEC conventional 2P reserves they would be 311*1.7=529 Gb, OPEC 2P reserves would be 1290-530=760 Gb. Note that the paper reference above has World 2P reserves at about 1260 Gb, which would reduce the OPEC 2P conventional reserve estimate to 730 Gb.
OPEC proved conventional reserves would be 730/1.7=430 Gb. To estimate 2018 reserves I assume the ratio of reported “proved” conventional reserves to 2P reserves remains the same from 2011 to 2018. That ratio is 978/730=1.34, so in 2018 OPEC 2P conventional reserves remain 730 Gb and proved reserves 430 Gb. That estimate is about 2.3 times less than what BP reports for OPEC conventional “proved” reserves (980 Gb), note that EIA reports a smaller value of 930 Gb for OPEC proved conventional (I use 260 Gb for Orinoco reserves). Perhaps the EIA does not include NGL reserves and BP does include NGL, accounting for the difference in the estimates.
Dennis
Thanks. The 430 Gb is a significant reduction from 1289 Gb.
Ovi
Conventional OPEC reserves are about 940 Gb based on the EIAs estimate Total is about 1200 Gb, then deduct 260 Gb of Orinoco reserves. So about a factor of 2 rather than 3.
The big OPEC question is always, what are the Saudi reserves, really?
Of all the national oil companies in the world, Saudi Aramco seems to us civilians to be the most “Opaque” (non-transparent) about either its true “production capacity” and its “reserves.”
I would put everything published by the Saudis in the realm of Oil News over the past 24 months into the bin of “Aramco IPO fluff pieces” or “Aramco Pump-n-Dump stuff.”
Too bad Matt Simmons passed; I’d bet he’d be working on an update book for Twilight in the Desert. Whoever does that may save some investors losing a metric shite-ton of money in that Aramco “deal.”
Just hunches here. Not peer-reviewed.
B.G.
BG
The paper below is very good and peer reviewed
https://royalsocietypublishing.org/doi/full/10.1098/rsta.2013.0179
my conclusions on OPEC reserves are based on that and the assumption that UK 2p/1p ratio of 1.7 is correct for the World.
We don’t have many peer reviewed estimates for 2P reserves.
A slightly different story from the Canadian oil sands patch. I mentioned CNRL in the comments under Canada.
From their Q3 report, they pay a dividend 0.375¢/qtr and continue to buy back shares.
Note prices below are in Cdn$’s
“For the nine months ended September 30, 2019, the Company purchased for cancellation 22,150,000 common shares at a weighted average price of $36.16 per common share for a total cost of $801 million. Retained earnings were reduced by $627 million, representing the excess of the purchase price of common shares over their average carrying value. Subsequent to September 30, 2019, the Company purchased 1,350,000 common shares at a weighted average price of $33.70 per common share for a total cost of $45 million.”
https://finance.yahoo.com/news/canadian-natural-resources-adjusted-profit-101105194.html
UPDATE 1-Canadian Natural Resources profit beats on higher output
(Adds details on the quarter, estimates)
Nov 7 (Reuters) – Canadian Natural Resources Ltd posted a quarterly profit above analysts’ estimates on Thursday, as the country’s largest oil producer benefited from higher production.
The Calgary-based company said total production jumped 11% to 1.18 million barrels of oil equivalent per day in the third quarter ended Sept. 30.
Alberta introduced mandatory production curbs from Jan. 1 this year to ease congestion on export pipelines. The Alberta government said last week that it would allow companies to produce additional oil if they move it by rail.
Canadian Natural stuck to its previous forecast for annual production and capital expenses, but said it expects natural gas production levels to average between 1,485 million cubic feet per day (mmcf/d) and 1,545 mmcf/d, up from 1,440 mmcf/d and 1,460 mmcf/d in a previous forecast.
The company’s adjusted earnings was C$1.23 billion, compared with C$1.35 billion a year earlier.
Adjusting for certain items, the company earned C$1.04 per share, beating analysts’ average estimates of 77 Canadian cents, according to IBES data from Refinitiv.
Ovi,
Interesting.
Great job on the post. Thank you.
Well, let’s be sure to connect those two dots you laid out so tantalizingly.
Dot 1: Company buys back shares thereby reducing the number of shares outstanding.
Dot 2: company reports a beat on “earnings per share.”
This may be great news, or it may be financialization hiding the details.
We’d have to dig deeper to know if this is actually good news or smoke and mirrors (i.e. a more leveraged balance sheet but the same amount of pre-tax income).
Chris
Dig as hard as you can, you will find this is a real company with excess cash and I believe to be one of the best oil companies in the world. Its only problem is that it does not have full access to tide water.
I would also encourage you to dig into Suncor, the other great Cdn. oil company and doing the same thing.
“Suncor Energy’s Board of Directors has approved a quarterly dividend of $0.42 per share on its common shares, payable December 24, 2019 to shareholders of record at the close of business on December 3, 2019.
Suncor’s Board of Directors has also approved an increase to the company’s current share repurchase program of an additional $500 million increasing the program from $2.0 billion to $2.5 billion.”
Both companies have between 50 to 100 yrs of Bitumen in their reserves.
PS: Both stocks are listed on the NYSE under the symbols CNQ and SU,
Ron, about the last sentence, did you mean “provided we continue to consume …” 80 million barrels daily? (rather than billion barrels annually)
Political Economist
Thanks for the catch. I just fixed it. After a while there are just too many numbers buzzing around ones head.
Ovi
Chart for non-OPEC+ where OPEC + includes 10 non-OPEC nations ( Russia, Mexico, Kazakhstan, Azerbaijan, Bahrain, Brunei, Malaysia, Oman, Sudan and South Sudan.)
If deduct US output from non-OPEC+, the trend for the past decade is nearly flat (annual increase of 9 kb/d), if we deduct both US and Canadian output from non-OPEC+ output the 10 year trend is an annual decline of 169 kb/d, average output over the period is 16400 kb/d so this is about an average decline rate of 1% (169/16400).
Dennis,
Is the decline (US and Canadian output from non-OPEC+) due to natural depletion or due to low oil prices, in your opinion ?
Also do you think when U.S peaks the world would also peak?
Iron Mike
Production is down due to constraints on production in Alberta. See more comments under the Canada chart in the original post.
Thanks Ovi. I’ll check it out.
Iron Mike,
I am a bit unclear on your question, the decline of non-OPEC+ minus US minus Canada C+C output is probably “natural decline” in the sense that a given geographical area will have limited resources that will deplete as they are extracted. Price is always a piece of the puzzle because the limits to the extraction of resources is based on profitability which in turn depends in part on the price of the resource. Not much of an answer, but it is difficult to untangle the economics and the geophysics, they are tied at the hip as it were.
The answer you are looking for no doubt is which is more important in this case. I would say the “natural decline” or geophysical limits are the first order effect and price is second order in my opinion (and I am not a geophysicst, just a basic undergraduate degree in Physics).
I do think it likely the World will peak within a year or two of the peak in US C+C output. Below is the tight oil and extra heavy model used with my oil shock model for conventional oil (scenario presented earlier). Unconventional=tight+extra heavy and is plotted on right vertical axis, tight(LTO) and extra heavy (XH) oil plotted on left vertical axis.
Thanks Dennis,
I was wondering whether the non OPEC + minus U.S & Canada, might possibly be holding back on producing to their potential due to a mixture of low oil prices, oversupply in the global market and global economic slowdown.
And whether when conditions in the global economy become optimum, they will start producing at their full potential.
On the other hand are these the expected natural decline, hence an annual decline of 169 kb/d.
I guess it is a tough question to answer in hindsight. I suspect if one was to look at the maturity of individual fields in question and their respective production history and reserves, the answer might be clearer.
Thanks for the info Dennis. Interesting stuff.
Iron Mike,
You raise an interesting possibility, but the chart suggests prices may be a minor factor though the dynamics are too complex to be sure (there are a number of lags between changes in price and changes in production which makes interpretation difficult.)
The period in question from August 2009 to July 2019 includes both high and low oil price periods, from the data I don’t see much correlation with price and it seems more the interaction of depletion with economic reality to my eye. Chart below so you can interpret yourself, the more minds the better in my view. The average of all the data in the chart over the past decade is 16394 kb/d.
Chart with non-OPEC+ minus US minus Canada C+C output (vertical axis) vs Brent Oil Price in constant 2018 US$. R squared is 0.1 so correlation between output and oil price is relatively low.
Data covers the same period as previous chart (Aug 2009 to July 2019).
Dennis, is that chart some kind of a joke? 😉
It’s like a drunken ant with one leg dipped in blue ink ;).
Eulenspiegel,
Yes a random walk comes immediately to mind, which is why it appears that oil price and C+C output is not well correlated for this froup of nations over the Aug 2009 to July 2019 period.
Dennis,
Even if it is correlated it has a time lag between 4 months (more fracking) to 6 years (new deep sea project).
After investment planning and financing is done, the project is finished most times even when prices change. So a 2013 high oil price project can increase output now. You can’t find this with this plot, so you get ants ;).
You can this only by comparing project starts – but this is a very time consuming work checking up all the oil projects of the last 10 years.
I would just guess – not much expensive big oil project have been kicked off during the 40$ oil time.
Eulenspiegel,
I agree there are a number of different lags which generally make the correlation between current real oil price and output very low, I am not claiming prices don’t matter, only that if one expects a fall in oil prices to lead to a fall in output, one will often be disappointed.
The relationship is complex and not likely to be modelled correctly without a ton of work. Even then I doubt it can be done.
Ron,
No just a scatter plot of C+C output of nations that are not US, Canada or one of the 24 nations that make up the OPEC+ (aka Vienna) Group of nations vs Brent Oil price in 2018 US$ (constant dollars).
The point is to show there is little correlation between C+C output and oil price for this group of nations over the last 10 years (monthly output and oil price data was used for the chart.)
It might be worth looking at the relationship between oil production and price 6, 12, 24 and 36 months before.
Nick,
When lags need to be adjusted to find a correlation, it tells us we have no decent theory, it is just data mining and unlikely to hold up over varying periods and probably not likely to be valid in the future.
You are welcome to do it, I think you would be wasting time, but it is yours to waste.
Yeah, I have a saying for that: “Data analysis is like interrogation: if you torture the data long enough it will tell you anything you want to hear, but it’s not likely to be real”.
The frustrating thing is the lack of good data – it’s frustrating to have to limit one’s analysis because of limited data points and excess noise. But, that’s the real world.
Dennis,
I agree, with the data you represented, the correlation is very weak between production and price. Seems like these fields are just in their terminal decline phases.
It is a predator-prey chart. I love it especially when it has dated points.
The smaller movements are the normal cycling around an equilibrium point. The bigger movements are changes in technology/reserves/economy.
Equinor is selling their stake in EF to Repsol. Seems this hace not veen their best investment …
https://finance.yahoo.com/news/equinor-sells-assets-u-eagle-210327213.html
Blurbs oil consumption this year will be up about 4.8%. That’s down from 5.6% last year. Concentrated in LPG.
Arghh That’s India.
October RRC data for Texas completions are out – 537 oil completions means significant underperformance of last years 987 record, even if we are unsure about the exact “reporting” to “real completion date” behaviour, the October/November numbers from last year seem to reproduce the Iran high price hype taking place in that time…
However, year to date we’re now at 81% of last years completion numbers.
Its an interesting time
Less completions out of the heart of the permian (only real LTO region growing)
https://www.rrc.state.tx.us/all-news/110819a/
Less horizontal rigs particularly out of the permian and eagle ford
https://rigcount.bakerhughes.com/static-files/3b74076e-add9-407c-b1bc-a4294fb36ea7
Frac spreads continue to head lower
https://twitter.com/primaryvision?lang=en
Not a lot pointing to how US oil production will continue to grow from here. Might be time to be long oil ….
Price action on both WTI and Brent charts are bullish. Mainly due to FED expanding it’s balance sheet providing dollars. But the question is can oil continue to rally at the same time as the US dollar is strengthening. Current pullback on the dollar appears to be just that. Only two things hanging over market are trade war and Brexit. Deals will more than likely come with time to protect global stock market valuations.
And with those two hangovers gone because of interest rate differentials between the US, Japan and US, Europe. Dollar goes much higher in value right in the face of the FED expanding it’s balance sheet.
There is still a road to $20 oil here through dollar strength. Even though price action for oil is currently bullish amid this small pullback in the dollar. Will have to wait to see what oil does when the dollar breaks out to higher highs as the pullback appears to be complete. Should get the answer here in next few weeks as dollar builds momentum to move higher. Again the question is can oil and the dollar rally at same time for any amount of time. Like if the dollar rallies for the next 6-12 months can oil really rally at the same time for more than a small amount of time as in a few weeks at most before it rolls over. Dollar would need to remain range bound or in a downtrend for oil to rally to $70-90 over next two years.
Rigs continue to decline in US
https://www.houstonchronicle.com/business/energy/article/U-S-oil-and-gas-rig-count-continues-declines-14820478.php
As well does the Primary Vision US frac spread count, another 4 down to 346, lowest since April 2017.
https://mobile.twitter.com/PrimaryVision/status/1192957025849876484
Envision,
US frac spread count chart is the key factor behind the US shale decline. No frac, no shale oil.
It seems to me that EIA and Rystad will be wrong as there will be no significant increase in shale oil production in Q4 2019 or in 2020. Seems the reason is the Majors like Exxon , Chevron are not investing enough in Permian and other shale fields there. From the Q3 presentation of Papa his Company lost money and burned cash. He emention most Company are reducing their capital spending budget for 2020. Another important issue was that their ballance sheet saw significant increase in interest cost, cost of capital within oil and gaz is increasing that reflect on bottom line. Also their Acre rental fee was significant up. Hopefully there is pipeline constraints, or gas capacity that keeps the majours holding back on investments to keep up with EIA estimates , the break even price Exxon have stated in permian should give huge profit at WTI 50 USD , think they need to use some of this to prevent US oil production starts decline in 2020 that might lead to a global Energy Crizes…
Envision,
In the 12 months leading up to April 2017 US tight oil increased at an annual rate of about 6% per year, over most of the May 2016 to April 2017 period the frack spread count was less than it was in April 2017. Perhaps the completion rate will fall, if the frac spread count remains low.
But still the majors and the other big shale names like Oxy, EOG, Concho etc … all insist on further small production growth in their Q3 presentations !
So I’m wondering wo actually is shutting down all the rigs and the fracking power – are this the smaller producers with their backs on the wall – and how big is their contribution to the shale boom overall ?
So I’m not yet convinced that the growth is really at the end, but it looks like it will be almost definitely a lot lower in the months ahead then EIA/IEA actual predicts.
I agree.
Shale Production Decline Probable Within 12-18 Months, Based On DUC Data (Bold Mine)
Despite a significant drop in the US rig count, oil and gas production continued to increase this year. DUCs declined by about 800, which explains the continued growth in production.
Given the continued decline in rig activity and the limits to DUC drawdown potential, US oil and gas production may start declining within 12-18 months.
The only factor which could prevent this from happening would be a sustained increase in oil prices, which is unlikely to happen, given excess capacity as well as weak demand.
Perhaps the most interesting story in regards to the shale industry this year has been the steady decline in operating rigs we have seen since the beginning of this year, and the continued growth in shale oil and gas production despite it. The number of rigs operating in the US started declining at the beginning of the year and continued to do so for the past 10 months.
The chart below is U.S. Rig Count
And the frack spread followed the rig downtrend – with a lag and longer plateau, really going down from mid/end of July when it dived below the level it has kept since begin of 2018.
– Around one month after the bigger June crude price drop.
BTW the Primary Vision frac bean counter predicted a couple of weeks ago that the drop will stop very soon, because new pipelines, seasonal effects etc. – but it hasn’t so far.
Yes this was September 25th – count was 375
https://www.rigzone.com/news/frac_spread_drop_could_end_soon-25-sep-2019-159898-article/
Latest count 346 will be interesting, you would suspect with the news out of the recent quarterlies that most companies have exhausted their budgets.
Clearly the less efficient spreads are being retired but the drops in completions in texas in November (down ~45% from last year) should send an alarm bell to the wider market that production could flatline or fall heading into the new year
Jack,
Just so you are aware, the completion data from the Texas RRC reflects the date the completion gets reported to the RRC, the actual date of completion varies fro 2 months to 18 months before the date that the paperwork finally gets filed.
In short, the RRC data on completions is essentially useless. Better data from shaleprofile, Enno Peters takes account of actual completion dates, but he cannot do anything about late reporting to the RRC, so his data is incomplete, it is fairly complete if you look back 12 months or more, but the most recent 11 months of “first flow” data, especially in Texas (but perhaps elsewhere as well) is increasingly incomplete as you get closer to the present.
Just a matter of old systems stuck in the 20th century.
Iran oil: New field with 53bn barrels found – Rouhani
“We have found an oil field with 53 billion barrels of oil in place, 53 billion barrels. This is in a big oil field that stretches 2,400 sq km from Bostan to Omidiyeh. The oil layer has a depth of 80m (262ft),” he said during a speech in the central city of Yazd.
Is this new field real or BS?
It’s right next to Iraq’s Majnoon oil field of 12.5B barrels.
This looks pretty credible. The geology is all the same, but it is surprising it wasn’t found long ago. Or not, there was an 8 year war in that area during the 1980s and more war in the 90s.
It looks credible. Iran ascendant.
But how can you know how big an oil field is when you just discovered it? Doesn’t it take years of drilling to delineate an oil field?
Sure they had a Ghawar-sized field they never discovered before, just 80′ down. Despite the fact that they have been drilling in Iran since 1903. For sure dude.
The 80 foot quote was an obvious error by a non oil guy. It likely meant 80 feet thick oil containing rock over xxxxxx square miles of area.
Majnoon down about 10K feet, API wide variance 12 to 39.
Field size estimates from seismic measurements not impossible. These are smart people. They managed to do guidance simulation before the Saudi facility attack. They are not technology poor.
I smell rat. If a field this big existed, it would have been found half a century ago.
Oil column is 80′ not that it is 80′ down.
The press release says the reservoir is 80 m thick, which is about 260′. If you assume the entire 2400 sq km is oil full, and assume a porosity of 26% and water saturation of 20% (both of these are big guesses), the resulting reservoir barrels are 250 BBO original oil in place (OOIP). (A lot bigger than the 53 BB OOIP!) Not sure how deep the reservoir is, what the fluid properties are, and what the resulting B (sub) O would be. (That is the factor that converts reservoir barrels to surface or stock tank barrels.) I’m familiar with B (sub) O values in the 1.1 to 1.5 range. You would divide the OOIP by this. Still, a lot of oil.
The biggest uncertainty, by far, to me, would be if the reservoir is oil full over the entire 2400 sq km. I assume a carbonate reservoir? which I also have no experience with. Did they find an oil-water contact? How many wells have penetrated the reservoir? Do formation pressures and their seismic interpretation suggest the wells are connected? Reservoir depth? Expected recovery factor?
A lot of unknowns from the press release.
And how did they get to the 53 Gb number so soon after the discovery.
Agreed, Frugal. A lot of unknowns.
Also consider the source – if Exxon, BP or Chevron announce a discovery, and include some resource estimate, (which I take to be a midcase recoverable number) I think you can feel pretty good about it. Now they may come back and appraise it and determine it’s bigger or smaller, but I believe your getting a good faith estimate. Not sure so about this press release.
Majnoon recovery factor talked up 70%. It’s right next to this find.
It seems pretty coincidental that Iran announces this huge discovery at the same time that Saudi Arabia is coming out with the Aramco IPO. This combined with those drone attacks makes me think they don’t like each other very much. If this happened at my kid’s school they would probably call it bullying.
Art Berman’s take on it on twitter.
Best guess on Iran “discovery” is that it’s not a discovery but S. Azdegan part of undeveloped heavy oil complex discovered in 1970s (25 bn ooip).
80m depth in Rouhani’s announcement is confusing.
Another take on it from Mehdi H.@mhmiranusa 12t:
Mehdi H.
@mhmiranusa
Iranian oil minister on the new Iranian oil reservoir, called Namavaran.
Previously proven reserve in the field: 31.3 BB
New proven reserve in the field: 22 BB
Total proven reserve in the field: 53.3 BB
New recoverable oil with recovery rate of 10%: 2.2 BB
The Namvavarn field oil API is said to be around 24
—-
Iran have always had a few low multi billion barrel fields (recoverable oil), especially heavier API grades not fully developed. So I don’t think there is very much groundbraking in this “news” more than already known.
Keystone Pipeline leaks 383,000 gallons of oil into wetlands in second big spill over two years
https://peakoil.com/production/keystone-pipeline-leaks-383000-gallons-of-oil-into-wetlands-in-second-big-spill-over-two-years
No worries, it was on Indian land.
Papa blamed depletion of the best drilling locations, and too many wells drilled too close together for the slowdown.
https://www.forbes.com/sites/rrapier/2019/11/10/shale-growth-projected-to-stall-by-2021/#2144006f235b
None in US:
The 20 Biggest Oil Discoveries
Ghawar Field Onshore Saudi Arabia 1948 1951 88-104
Burgan Field Onshore Kuwait 1937 1948 66-72
Gachsaran Field Onshore Iran 1927 1930 66
Mesopotamian Foredeep Basin Onshore Kuwait n/a n/a 66-72
Bolivar Coastal Field Onshore Venezuela 1917 1922 30-32
Safaniya Field Offshore Kuwait/Saudi Arabia 1951 1957 30
Esfandiar Field Offshore Iran 1965 n/a 30
Kashagan Field Offshore Kazakhstan 2000 2013 30
Aghajari Field Onshore Iran 1938 1940 28
Tengiz Field Onshore Kazakhstan 1979 1993 26-40
Ahvaz Field Onshore Iran 1953 1954 25
Upper Zakum Field Offshore Abu Dhabi, UAE 1963 1967 21
Cantarell Field Offshore Mexico 1976 1981 18-35
Rumaila Field Onshore Iraq 1953 1954 17
Romashkino Field Onshore Russia Volga-Ural 1948 1949 16-17
Marun Field Onshore Iran 1963 1966 16
Daqing Field Onshore China 1959 1960 16
Shaybah Field Onshore Saudi Arabia 1998 1998 15
West Qurna Field Onshore Iraq 1973 2012 15-21
Samotlor Field Onshore Russia, West Siberia 1965 1969 14-16
Maybe number 21 is US Prudhoe Bay about 13 Gb recoverable
https://dec.alaska.gov/spar/ppr/response/sum_fy06/060302301/factsheets/060302301_factsheet_PB.pdf
The U.S. Shale Oil Compounded Annual Decline Rate Wreaks Havoc On The Industry
I don’t believe many energy analysts realize the damage taking place due to the compounded annual decline rate in the shale industry. I had a TIT for TAT debate between David Hughes on this very topic in regards to the Permian.
David Hughes didn’t see anything to worry about because “Everyone” knows that shale wells decline 60-70% each year. Well, that’s fine until production continues to stack on top of the previous year’s production.
Shale oil production from the top 4 fields for 2018 ALONE peaked at 3.8 mbd in December 2018. Again, this is just the production for 2018 from the 9,953 wells brought on last year. By August 2019, that 3.8 mbd fell to 1.8 mbd or a 53% decline in eight months.
While it’s only 53%, it’s 53% of 9,953 wells that had peak production of 3.8 mbd.
So, now… for U.S. shale oil production to grow moderately, in these four fields, there need to be 2,000 more wells added in 2019 or nearly 12,000 wells this year. Unfortunately, it looks like there will be fewer wells drilled in 2019 than there were in 2018.
Unless God Almighty himself comes down and buys up all the Debt attached to the Shale Industry and provides more LAND to continue drilling… the Collapse of the U.S. Shale Industry is heading our way.
Steve
And the decline is far from over.
The Rig Count Collapse Is Far From Over
The US oil and gas rig count fell again this week, according to Baker Hughes, continuing the downward trend with a drop of 5 rigs for the week, according to Baker Hughes. This week marks eleven decreases out of the last twelve weeks.
But the decline is unlikely to have a lasting or even immediate effect on prices.
The total oil and gas rig count now stands at 817, or 264 down from this time last year.
The total number of active oil rigs in the United States decreased by 7 according to the report, reaching 684. The number of active gas rigs held fast at 130. Miscellaneous rigs this week rose by 2.
Oil rigs have seen a loss of 202 rigs year on year, with gas rigs down 65 since this time last year.
By state, Texas has seen a drop of 119 year on year, while Oklahoma sunk by 97 to hit 57 rigs.
Ron,
Horizontal oil rig count was 778 on WE Nov 9, 2018 and 594 on WE Nov 8, 2019, a drop of 24%.
If we assume about a 4 month average lag between drilling and completion for tight oil wells, then the average rig count in May would determine Sept 2019 tight oil output which was 708 horizontal oil rigs, a drop of 9% from Nov 9, 2018. We have seen another 16% drop in the horizontal oil rig count since May 2019, if the 4 month lag estimate is correct, we would see this in the March 2020 output numbers. At some point oil prices might increase and rig count may increase as a result, though we would not see this in output numbers for 4 months or so.
Also note that the horizontal oil rig count was at 593 for WE 4/28/2017, for the previous 52 weeks the average US horizontal oil rig count was 385 and US tight oil output increased by 6% from May 2016 to April 2017. Legacy production change is likely higher today so we may need 590 rigs to keep output from decreasing, we will find out in 4 months or so.
Steve,
Pretty sure Mr Hughes knows what he is talking about. Sometimes listening to experts is a good idea.
Up to you. So far, US tight oil has continued to increase in 2019. As I have pointed out previously, it makes sense to only include wells from Bakken, Eagle Ford, Permian, and Niobrara as most of the rest in the publicly available shaleprofile data are gas wells.
If we do that we find in 2019 there have been 5148 wells completed in the major tight oil basins (and this figure is likely to be revised higher by 10% at least (5660). For July 2018 the number of wells completed was 5533, so not much change in the completion rate from 2018 to 2019, if the 10% revision estimate is correct.
Note that a model that assumes the mean USGS TRR estimates are roughly correct and that the recent completion rate (through August 2019) remains constant results in imcreasing US tight oil output. The completion rate would need to decrease by about 20% for tight oil output to decrease, so far there is little evidence such a decrease has occurred thorough Sept 2019. Future completion rate is of course unknown.
Dennis,
Indeed, David Hughes is correct. There is nothing to see here. I’ll make sure I remember that.
However, keep your EYE on the media over the next 2-4 months and see what NASTY NEWS unfolds in the Shale Industry. Hughes and et al have no clue about this. Thus, it will be very interesting to see their reactions. We can include Mr. Berman as well.
A little Birdy told me that something BIG coming out.
Grab your popcorn.
steve
Steve
None of us knows the future.
The main point is that tight oil output is fairly predictable for a given average well profile and well completion rate. I first learned of this at the Oil Drum.
http://theoildrum.com/node/9506
The author has written excellent stuff over the years, in my humble opinion. He prefers I not mention his name.
I am not privy to the big news you expect, if the completion rate remains relatively steady tight oil output will increase through 2025 to about 8.5 Mb/d.
With higher oil prices completion rate may increase and if that occurs US tight oil could peak at 10 to 12 Mb /d.
This assumes oil prices rise to 90 per barrel by 2027 and USGS mean TRR estimates are roughly correct.
Either assumption could be wrong. Generally assumptions about the future are not correct.
Hmm. This was written in 2012, and said: There are several elements/observations that make me believe that shale oil extraction in Bakken (and elsewhere as well, like Eagle Ford) is about to reach its high;
It’s difficult to make predictions, especially about the future.
We may have beat RL to the punch, with this blog post in May 2012, which was 4 months earlier than the TOC post. This mathematically explained how difficult it is to maintain flow in fracked production when the depletion in individual wells is high.
http://theoilconundrum.blogspot.com/2012/05/bakken-growth.html
The only thing missing was associating it with a neat meme like The Red Queen
Paul,
Yes I missed your post about fracking, only became aware of it after I had seen the post at Oil Drum. In any case your insights and those of RL were eye opening from my perspective.
Paul
I recall the look of that integral from my school days and as I remember it was called the Duhamel integral. I did not understand it then and I still don’t understand it. However I am impressed that it could show how difficult it is to maintain flow in fracked production.
Ovi, That’s interesting. Looking that up, it turns out that Duhamel’s integral is more generally known as a convolution integral. It really depends on where you learned it.
Paul
You just reminded me. That was another description for it. It really didn’t matter how they described it, it just wouldn’t sink in.
These days, Excel works for me jus fine.
I would imagine that a 2012 USA LTO decline rate of approx 50% that, hypothetically, takes a million off of the production, compared to a 2019 USA LTO decline rate of approx 50% that, hypothetically, takes 5 million off of production, may have different consequences for the oil market, despite the similar decline rates.
Perhaps it’s not the rate of decline, as that doesn’t change much, but the magnitude of decreased production that is worth considering.
Survivalist,
The tight oil industry has expanded quite a bit since 2012 (more than many of us expected in 2012), so there are many more basins today(4 instead of 2) and the completion rate (number of new wells with first flow each month) was similar in 2012 as it is today, however the average well in 2012 had a peak production rate of only 268 bo/d and in 2018 the average tight oil well produced oil at a peak rate of 637 bo/d (a rate of nearly 2.38 times higher). Effectively this is like completing 2.38 times the number of 2012 wells in 2018. In 2018 11934 wells were completed times 2.38 would be 28403 equivalent 2012 wells, where in 2012 there were 11934 wells completed (by coincidence the number of wells completed in 2012 and 2018 was exactly the same), so effectively the higher productivity of the 2018 wells was similar to completing 2.38 times the number of 2012 productivity wells. This is due to a combination of longer laterals, more frac stages, higher proppant use and better frac fluids (and probably other factors such as better drilling and other stuff I am unaware of).
Bottom line is that output of tight oil has continued to increase and this increase may continue based on simple modelling until 2025 or so if mean USGS TRR estimates prove to be roughly correct and oil prices gradually rise to $90/bo (in 2017$) or higher by 2027 ($77/bo in 2025).
Of course we do not know whether USGS mean TRR estimates will prove correct and have no idea what future oil prices will be.
We know already something.
One of the biggest pure shale producers ( round about 1 mbd ), I forgot the name, wanted to reduce spending in Permian by 50% in 2020, other shales by 30%. It was published here in the board a few weeks ago.
50% reduction ist decline, and even 30% is not more than stable, perhaps even decline, too.
OXY is cutting CAPEX in the Permian Basin from $4.4 billion in 2019 to $2.2 billion in 2020.
shallow sand,
Thanks. I wonder of the decreases by some of the independents will be matched by increased capital spending by the majors. If tight oil output stops increasing, we may see oil prices rise, if that occurs capital spending might also increase.
Shaleprofile has OXY output at 189.5 kb/d in April 2019, EOG was at about 605 kb/d that month, total US tight oil output was about 6904 kb/d in April 2019, top 5 tight oil producers produced 24.3% of US tight oil output in April 2019. Those 5 producers are Anadarko, Concho, Conoco-Philips, EOG, and Pioneer. There are a large number of tight oil producers. Besides EOG other producers in April 2019 were at 256 kb/d, 274 kb/d, 292 kb/d, and 258 kb/d. There are no tight oil producers that produce 1 Mb/d of tight oil, at least not yet.
Steve
How long do we have to wait?
Shale wells do not decline 60-70% each year.
They decline that amount the first year. Less in later years.
Interesting tidbit. Enno is showing a drop of 35 kb/d for North Dakota for September. However, in checking ND.gov, data is only available up to August.
Ovi,
From what I understand Shaleprofile utilizes a “Premium Service” from the North Dakota DMR. Thus, they receive data the public gets a month later.
Steve
Thanks Steve
We should get it by Friday this week.
The question here is: Will these data be corrected later on, since some companies are always reporting late.
Eulenspiegel,
For some reason the North Dakota revisions are pretty small, think it is because there are far fewer wells to keep track of than in Texas where there are many 100s of thousands of wells to keep track of.
Saudi Aramco’s 658 page November prospectus is at this link
https://www.saudiaramco.com/en/ipo/key-documents
There are 23 instances of Ghawar in the prospectus. Page 58 states Dec 2018 liquid reserves of 48GB which includes crude oil, condensate and NGLs. Maximum sustainable capacity (MSC) was 3.8 mbd but does not disclose actual production.
Neutral Zone doesn’t appear to be discussed. It’s called partitioned territory as on page 59.
The prospectus doesn’t make it easy to put a price valuation on its shares. That may be one reason why Aramco shares will list first on Saudi Arabia’s own stock exchange, instead of London or New York.
Page 12 of Aramco short prospectus shows some interesting changes to its fiscal regime, effective 1 Jan 2020.
https://www.saudiaramco.com/-/media/images/investors/aramco—intention-to-float.pdf
The change at (iii) implies that Saudi Arabia Government would benefit substantially if Brent is over $100.
The Company and the Government executed an amendment to the Concession, which (effective as at 1 January 2020G):
(i) reduces the royalty rate on crude oil and condensate production to 15% (from 20%) on Brent prices up to $70 per barrel;
(ii) increases the marginal royalty rate to 45% (from 40%) on Brent prices above $70 per barrel up to $100 per barrel; and
(iii) increases the marginal royalty rate to 80% (from 50%) on Brent prices above $100 per barrel
Dennis,
In the royal society report by miller et al. On page 16:
Based upon these considerations, Hughes [24] suggests that aggregate US tight oil production is likely to peak around 2.5 mb per day (compared to total US oil production of 6.9 mb per day in 2008) and is likely to decline very rapidly after 2017. [16]Other, less detailed studies are more optimistic: for example, the IEA projects a peak of 3.2 mb per day in 2025, followed by a slower decline.
[16] Hughes’ [24] analysis is based upon the production history of 65 000 wells from 31 shale plays, contained in the DI
Desktop/HDPI database, together with EIA data on the number of available drilling locations within each play. Assuming
current drilling rates are maintained, Hughes projects a peak in US tight oil production of 2.3 mb per day in 2016, declining
rapidly to 0.7 mb per day in 2025.
How could they have been so wrong? They weren’t anywhere close with these prediction. I believe Hughes was off by a factor of 10! And his timing is also quite wrong.
I still give him credit for putting his neck on the line with making a prediction.
Hi IronMike,
The royal society report refers to ‘Drill, Baby, Drill: Can Unconventional Fuels Usher in a New Era of Energy Abundance?’ by D Hughes.
In that report, looking at the executive summary in the first pages, under the section ‘Tight Oil’, D Hughes states:
“Tight oil production is projected to grow substantially from current levels to a peak in 2017 at 2.3 million barrels per day. At that point, all drilling locations will have been used in the two largest plays (Bakken and Eagle Ford) and production will collapse back to 2012 levels by 2019, and to 0.7 million barrels per day by 2025. In short, tight oil production from these plays will be a bubble of about ten years’ duration.”
If i’m not mistaken, according to shaleprofile, in these two plays, the peak was reached early 2015 with 2.8Mb, the industry is getting close to reaching that peak again, so ‘production will collapse back to 2012 levels by 2019’ clearly did not happen…
He was probably only commenting about these two at the time i guess…
Hi Skeboo,
Thank you for that information. It makes more sense now. They were only considering Bakken and Eagle Ford.
Cheers
D. Hughes has an updated report on shale released yesterday, a copy can be obtained through the Post Carbon Institute. Haven’t made my way through it yet.
https://www.postcarbon.org/publications/shale-reality-check-2019/
I skimmed through that report. Hughes no longer makes specific predictions, he mostly looks that the EIA’s AEO 2019 reference scenario and says that it is very optimistic, but he does not lay out a “realistic” scenario.
Note that the Permian basin is a far larger resource than I assumed back in 2015. At that time I thought it might be 10 to 30 Gb, turns out that 40 Gb to 100 Gb is a better guess for TRR with ERR of perhaps 30 Gb to 60 Gb, so estimates of future output were too low, I also did not really consider Niobrara and other tight oil plays and mostly focused on Bakken and Eagle Ford.
Often my future scenarios are informed in part by the EIA’s Annual Energy Outlook, as I get new information, I update my models.
In March 2017 my thinking was in post below
https://peakoilbarrel.com/the-future-of-us-light-tight-oil-lto/
Most of my tight oil posts can be found at link below
https://peakoilbarrel.com/tag/lto/
Some of the better posts are:
https://peakoilbarrel.com/us-light-tight-oil-lto-update/
https://peakoilbarrel.com/the-future-of-us-light-tight-oil-lto/
https://peakoilbarrel.com/future-us-light-tight-oil-lto-update/
https://peakoilbarrel.com/eagle-ford-output-estimate-and-future-scenario/
https://peakoilbarrel.com/north-dakota-bakkenthree-forks-update/
https://peakoilbarrel.com/texas-petroleum-report-july-2016-and-lto-scenarios/
My earliest future scenario for tight oil (from December 2013) was very far from the mark, as was the EIA’s AEO outlook.
https://peakoilbarrel.com/when-wil-us-light-tight-oil-lto-peak/
As they say predicting is hard, especially the future. 🙂
Thanks Dennis, don’t beat yourself up about it – pretty much no one predicted how huge the Permian was going to be, not that I’ve read anyways. Your recent predictions seem very even-keeled are well thought out, so you probably have as good as a chance as anyone of being correct with a 2025 peak.
I skimmed the report also and he basically makes a strong case that the EIA is just extrapolating the sweet spot wells to the whole basins to come up with these very high figures. Very good reason to be skeptical of these optimistic assumptions.
Stephen,
Excellent summary. I think if we took the prospective area hughes gives and then compare with the EIA area, the ratio times EIA estimate would give a ballpark EUR estimate.
IEA released their long term study today, World energy outlook: https://www.iea.org/weo2019/
Bloombergs take on it: https://www.bloomberg.com/news/articles/2019-11-13/global-oil-demand-to-hit-a-plateau-around-2030-iea-predicts
The WEO message on peak oil has shifted over the years. This one cheers LTO and expects US tight liquids supply to reach 16mb/d in 2030:
“the United States accounts for 85% of the increase in global oil production to 2030 in the Stated Policies Scenario, and for 30% of the increase in gas. This bolsters the position of the United States as an exporter of both fuels. By 2025, total US shale output (oil and gas) overtakes total oil and gas production from Russia.”
A sensitivity analysis is done in the full report. One of the analyzed factors is technological improvement. They assume it either improves or stays the same but I’m not sure what they mean. Are geological factors assumed to be constant? Production per well/feet drilled or other metric may decline even if technology improves as the geology becomes more challenging.
Smile Dennis??????
These big guys agree with you on US production growth.
Ovi,
I am expecting growth in tight oil output will be lower (maybe 8.5 to 12 Mb/d at peak, depending on oil price and completion rate). No doubt the 16 Mb/d estimate includes NGL output from tight oil and shale gas plays combined, in 2017 NGL output was 3.65 Mb/d for US, no doubt it will be far higher in the future, in the Aug 2018 to July 2019 period NGL output from US shale oil and gas plays was about 2900 kb/d, this will easily increase to 4 Mb/d by 2025, the rate of increase has been at an annual rate of 280 kb/d since 2010 (mostly from tight oil and shale gas), so in 4 years time we would see a 1100 kb/d increase if the rate of increase continues.
This puts the IEA estimate in line with my high completion rate scenario at about 12 Mb/d for tight oil and 4 Mb/d of NGL, my guess is that the increase will be about 2 Mb/d less than predicted by the IEA (around 14 Mb/d by 2025), by 2030 the tight oil and NGL output will be decreasing, especially in the case of a high completion rate scenario. The higher the peak, the faster will be the decline rate after the peak.
For reasons unknown I did not find October 2019 car sales reported. India and Pakistan reported sharp overall declines, but nothing globally pervasive is reported. Usually always reported the first day or two of a month.
A guy with fingers on that pulse reports this:
US vehicle (SUVs and cars) sales fell 3.4% month to month (i.e. from Sept). 16.6 million units sold. This is -5.3% vs Oct 2018, but October 2018 was a “goosed month” from two hurricanes that month so that Y/Y number is ignorable.
Overall cause of sales decline, GM’s strike and industry wide reduced initiatives. Largely expected, especially with a big fleet buy in Sept.
These 16 million cars will burn 564,000 bpd next year. The older cars replaced by these replace even older cars and at the end of that sequence those falling off the back end will burn nothing. So the total burn increase won’t be 564K.
“Though Hughes is careful to focus his analysis only on the geological and technological feasibility of the EIA’s forecasts, I have to stress that when viewed from the broader perspective of economic, energy, and climate security, the EIA’s Annual Energy Outlook is borderline insane.”
Insane seems to be a business model today.
https://www.resilience.org/stories/2019-11-12/david-hughes-shale-reality-check-2019/
The November STEO was released today, about one week later than normal. The delay might be related to the significant change from the Sept projection to October for the Lower 48 W/O the Gulf, i.e. Onshore L48. From February 2020 to July 2020, the October STEO has added close to 200 kb/d over the September STEO, presumably due to increased LTO estimates. Hard to explain this in the light of decreasing rig count. However, there is only a small increase in Dec 2020, 5 kb/d and a maximum, in October 2020.
OPEC MOMR November just released
https://momr.opec.org
OPEC Nov MOMR US crude oil forecast says the source is OPEC Secretariat but I think OPEC really means US EIA and Rystad.