STEO
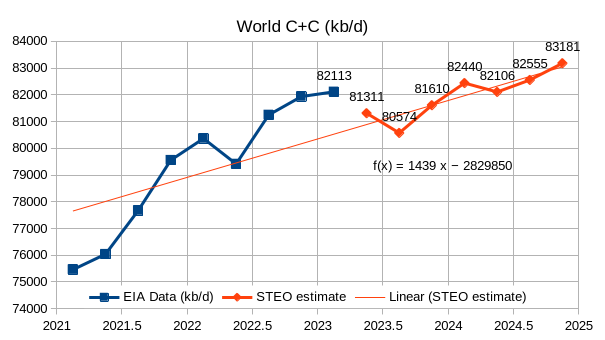
The EIA’s Short Term Energy Outlook (STEO) was published in early January. The chart below estimates World C+C by using the STEO forecast combined with past data from the EIA on World Output.
STEO
The EIA’s Short Term Energy Outlook (STEO) was published in early January. The chart below estimates World C+C by using the STEO forecast combined with past data from the EIA on World Output.
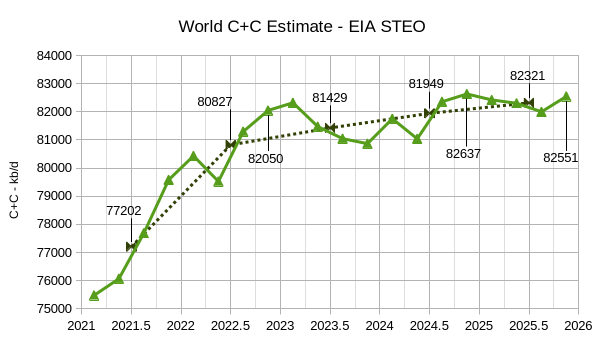
The EIA’s Short Term Energy Outlook (STEO) was published in early July. The chart below estimates World C+C by using the STEO forecast combined with past data from the EIA on World Output.
This month we have actual EIA data for 2023Q1 which increases the annual rate of increase for the forecast period compared to last month by 600 kb/d, part of the reason is an 800 kb/d forecasted drop in output from Q1 to Q2 of 2023. If we use the 2023Q1 to 2024Q4 trend the annual rate of increase is 911 kb/d, about a 100 kb/d increase from last month’s estimate. The trend from 2022Q1 to 2024Q4 is similar at about 916 kb/d. If this forecast through 2024Q4 is roughly correct, I expect increases in output after 2024 will be considerably lower, I also think this STEO forecast is optimistic. Annual average output in 2022 was 80.74 Mb/d and increases to 81.4 Mb/d in 2023 and to 82.6 Mb/d in 2024. These annual averages are 0.25 Mb/d less in 2023 and similar for 2024 as last month’s estimates.
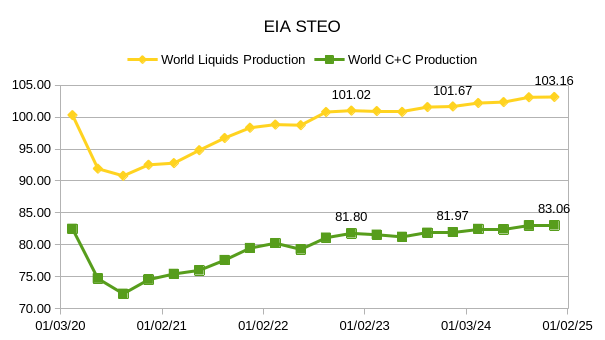
Read MoreThe EIA’s Short Term Energy Outlook (STEO) was published in early May. The report that follows compares World Petroleum Liquids output from the STEO with estimates from OPEC’s Monthly Oil Market Report (MOMR) from May and the IEA’s Oil Market Report (OMR) from February 2023 with an update on World liquids output based on the summary of the May report with my estimate on quarterly output in 2023 based on the annual estimate for 2023 published in May 2023 and the quarterly numbers published in February 2023.
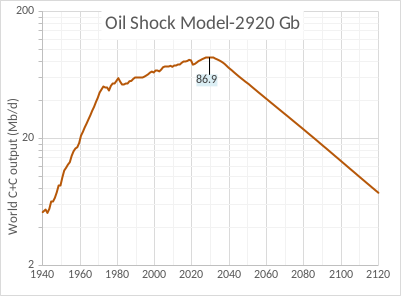
A conservative model of future World Crude plus Condensate (C+C) output is presented below with an average decline rate of 2.8% from 2040 to 2110. From 1933 to 1972 World C+C output increased at an average annual rate of about 7.8% and after the oil shocks in the 1970s and 1980s from 1983 to 2016 output increased at 1.2%/year on average. The decrease in the rate of change in World output was 6.5% between the high growth period up to 1972 and the slower growth period up to 2016. My model projects continued 1.2% average annual growth in C+C output from 2022 to 2029 when the final peak in output is projected. The annual rate of decline gradually increases to above 2.5% by 2039 and is followed by steady decline at 2.8% for the next 70 years. The decrease in the rate of change in output from the earlier period from 1983 to 2029 (about 1.2%) to the period after 2039 is 4%. Chart has a log vertical axis to indicate rates of change in output.
Chapter 5 of our book Mathematical Geoenergy describes a model of the production of oil based on discoveries followed by a sequence of lags relating to decisions made and physical constraints governing the flow of that oil. As it turns out, this so-named Oil Shock Model is mathematically similar to the compartmental models used to model contagion growth in epidemiology, pharmaceutical/drug deliver systems, and other applications as demonstrated in Appendix E of the book.
One aspect of the 2020 pandemic is that everyone with any math acumen is becoming aware of contagion models such as the SIR compartmental model, where S I R stands for Susceptible, Infectious, and Recovered individuals. The Infectious part of the time progression within a population resembles a bell curve that peaks at a particular point indicating maximum contagiousness. The hope is that this either peaks quickly or that it doesn’t peak at too high a level.

