US February Oil Production Rebounds

By Ovi

All of the Crude plus Condensate (C + C) production data for the US state charts comes from the EIAʼs Petroleum Supply monthly PSM which provides updated information up to Febuary 2023.

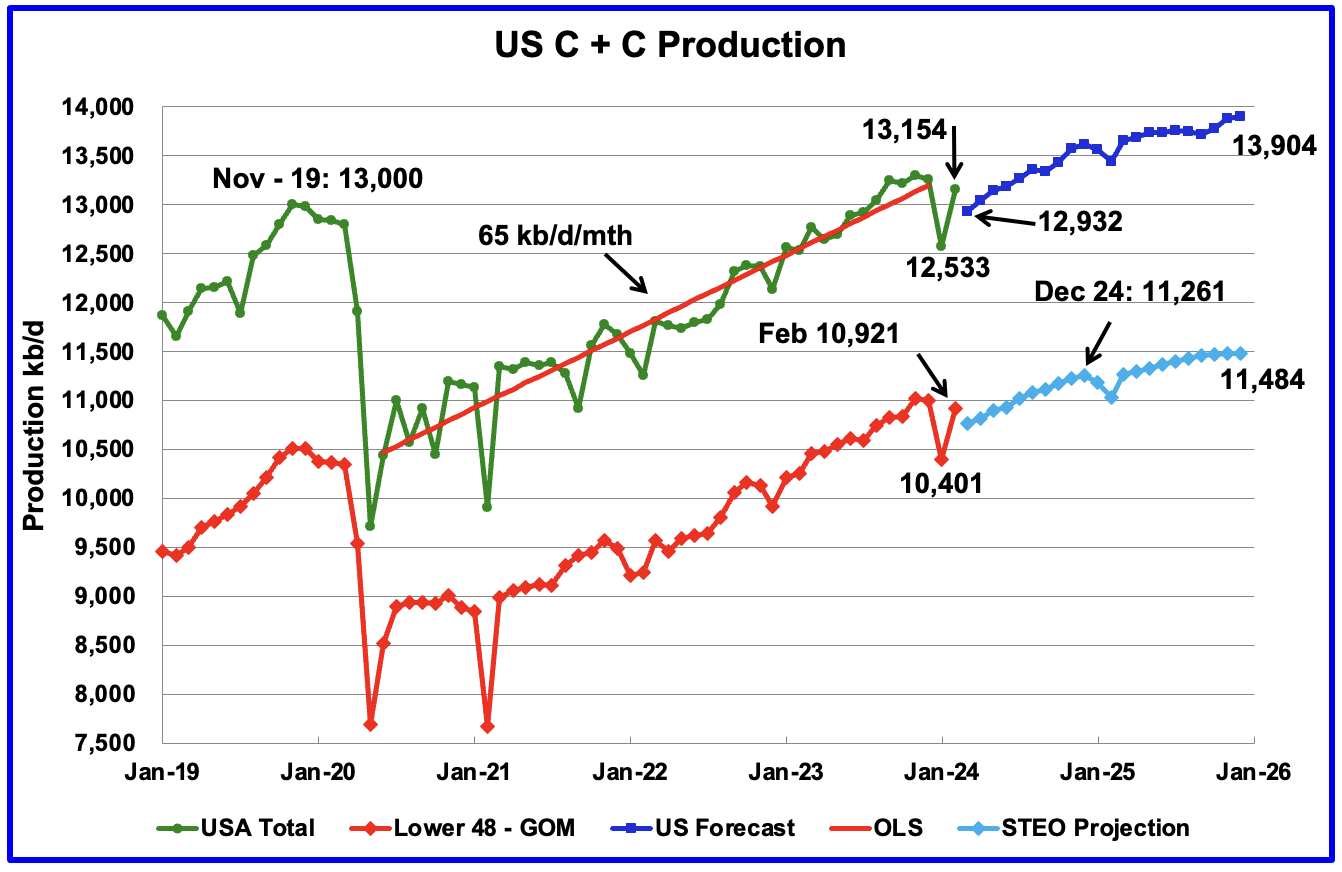
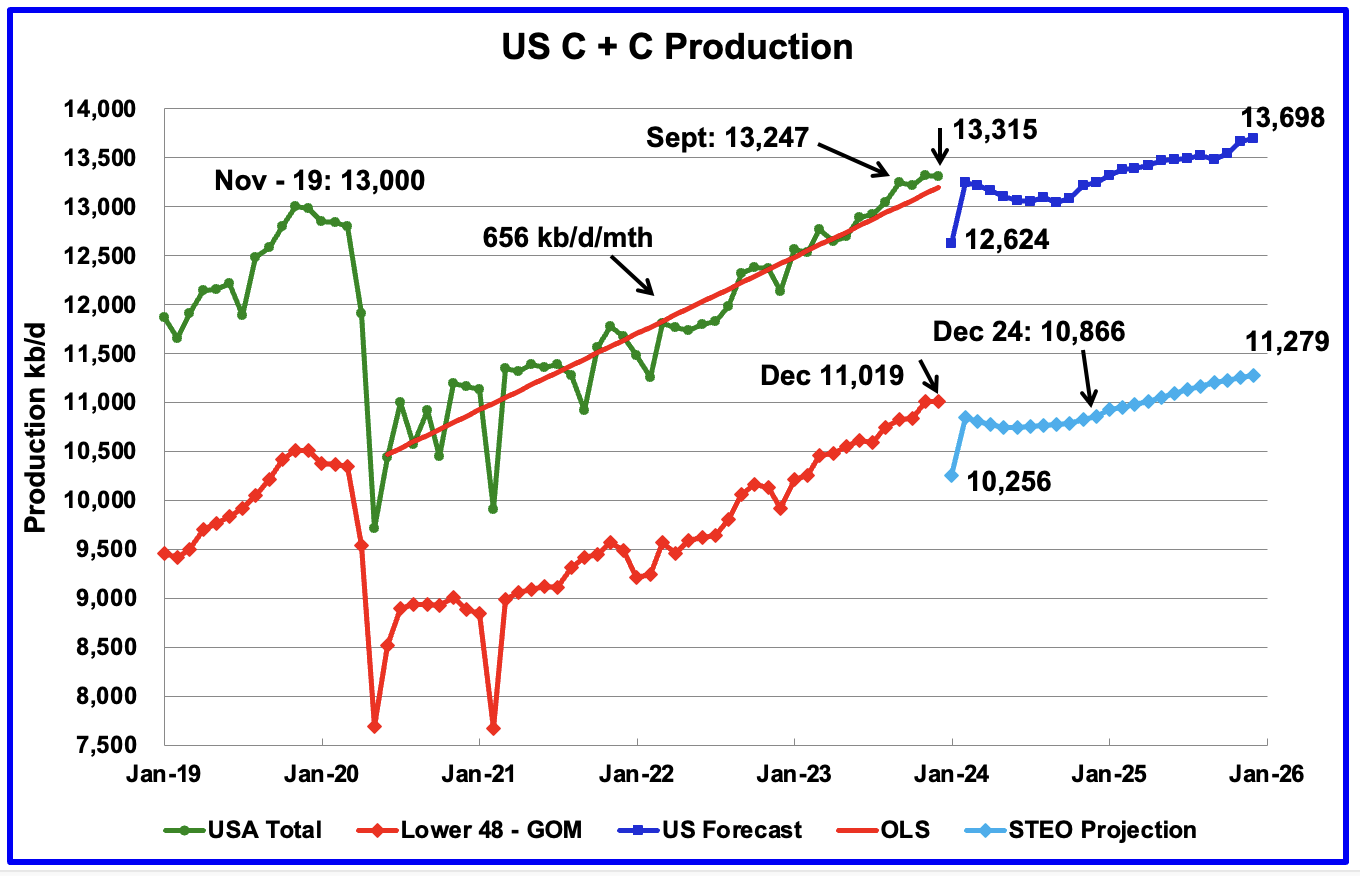
U.S. February oil production rebounded by 578 kb/d to 13,154 kb/d. The large increase was due to a rebound from the severe January winter storm that spread across most central states. The largest increases came from Texas, 172 kb/d and North Dakota 173 kb/d.

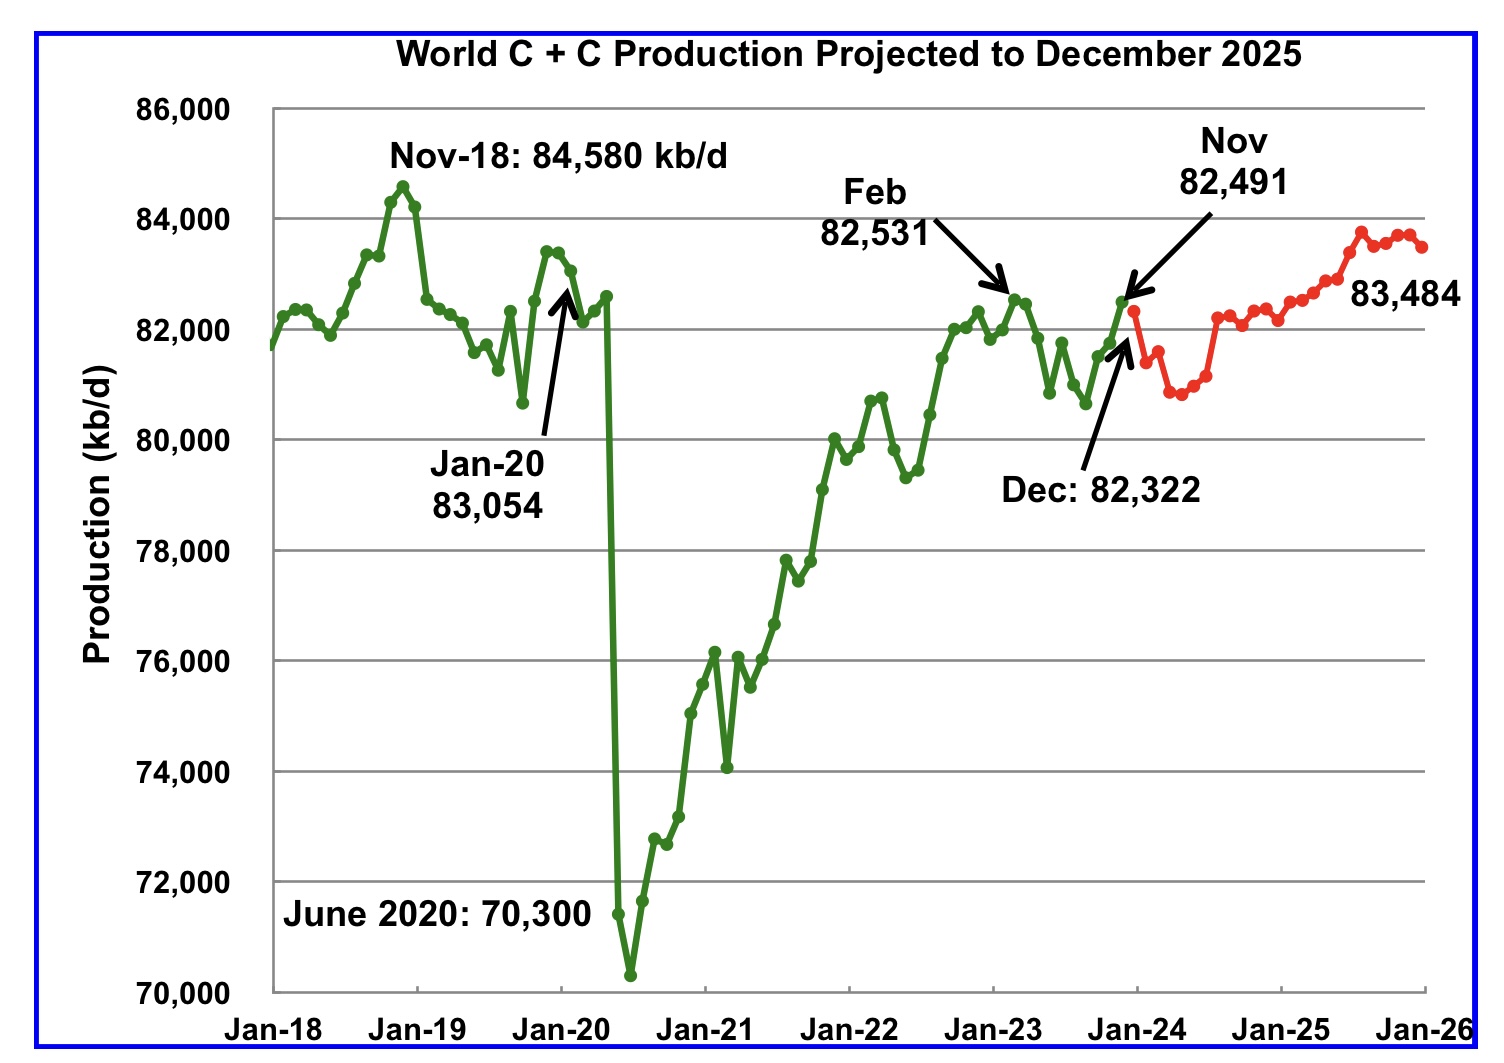
The dark blue graph, taken from the April 2023 STEO, is the forecast for U.S. oil production from March 2024 to December 2025. Output for December 2025 is expected to reach 13,904 kb/d and is an increase of 82 kb/d from the previous STEO report.

Read More

November World & Non-OPEC Oil Production

By Ovi

Below are a number of Crude plus Condensate (C + C) production charts, usually shortened to “oil”, for oil producing countries. The charts are created from data provided by the EIA’s International Energy Statistics and are updated to November 2023. This is the latest and most detailed/complete World Oil production information available. Information from other sources such as OPEC, the STEO and country specific sites such as Brazil, Norway and China is used to provide a short term outlook. 

World oil production increased by 745 kb/d in November, green graph. The largest increase came from Canada, adding 360 kb/d. December World production is projected to drop by 169 kb/d to 82,232 kb/d.

Read More

US December Oil Production Flat

By Ovi

All of the Crude plus Condensate (C + C) production data for the US state charts comes from the EIAʼs Petroleum Supply monthly PSM which provides updated information up to December 2023.

U.S. December oil production decreased by 4 kb/d to 13,315 kb/d. The small decrease was a mix of increases and decreases that netted out to a negligible decrease. The largest decrease came from Texas, 20 kb/d, offset by a New Mexico increase of 23 kb/d.

Read More

October World Oil Production Continues to Rebound

By Ovi

Below are a number of Crude plus Condensate (C + C) production charts, usually shortened to “oil”, for oil producing countries. The charts are created from data provided by the EIA’s International Energy Statistics and are updated to October 2023. This is the latest and most detailed/complete World Oil production information available. Information from other sources such as OPEC, the STEO and country specific sites such as Brazil, Norway and China is used to provide a short term outlook 

World Oil Production and Projection

World oil production increased by 302 kb/d in October, green graph. The largest increase came from Canada and Kazakhstan with both adding 123 kb/d each.

Read More

September World Oil Production Rebounds

By Ovi

Below are a number of Crude plus Condensate (C + C) production charts, usually shortened to “oil”, for oil producing countries. The charts are created from data provided by the EIA’s International Energy Statistics and are updated to September 2023. This is the latest and most detailed/complete World Oil production information available. Information from other sources such as OPEC, the STEO and country specific sites such as Russia, Brazil, Norway and China is used to provide a short term outlook for future output and direction for a few of these countries and the World.

World Oil Production and Projection

World oil production increased by 927 kb/d in September, green graph. The largest increase came from Saudi Arabia 500 kb/d while the US added 224 kb/d and Brazil 210 kb/d.

Read More