The Bakken production data, as well as the All North Dakota production data just came out with their production numbers for March 2014.
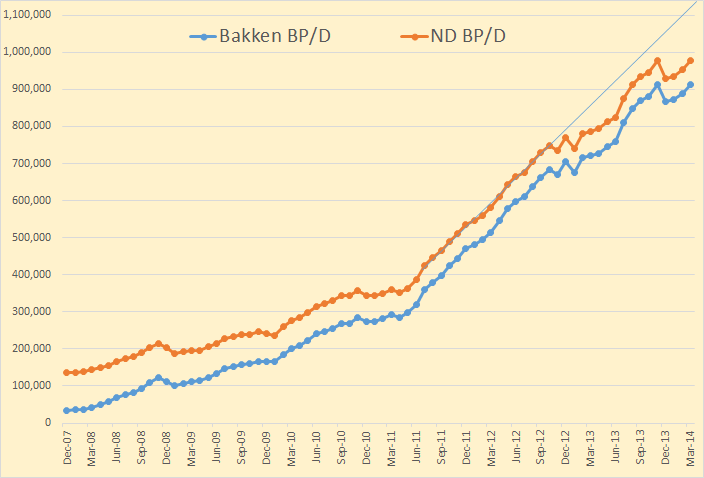
Bakken production was up 914,003 bp/d, up 25,091 bp/d from February. All North Dakota production was 977,061 bp/d, up 24,006 bp/d from February. That was a new record for the Bakken but not for all North Dakota. They are still 538 bp/d below their November 2013 numbers.
The surge in the Bakken really started in July 2011 when they doubled number of additional wells per month. Production continued to climb in pretty much a straight line through October 2012. Then bad weather and other problems started to affect production. They are now about 150,000 bp/d below where they would have been had they continued on that trajectory. (Line on chart.)
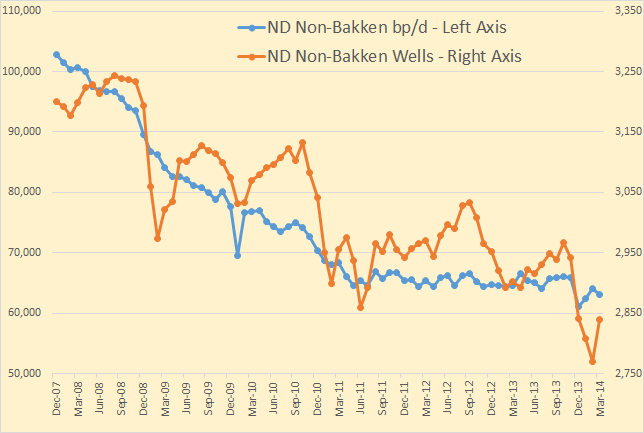
North Dakota production outside the Bakken declined at about 12% per year until the number of additional wells per month doubled on July 2011. Then it flattened out as some of those new wells were drilled outside the Bakken. But now additional wells outside the Bakken have dropped and so has production. Production outside the Bakken is still down almost three thousand bp/d from the December numbers. So though the Bakken hit a new high in March, total North Dakota production is still below the November numbers.
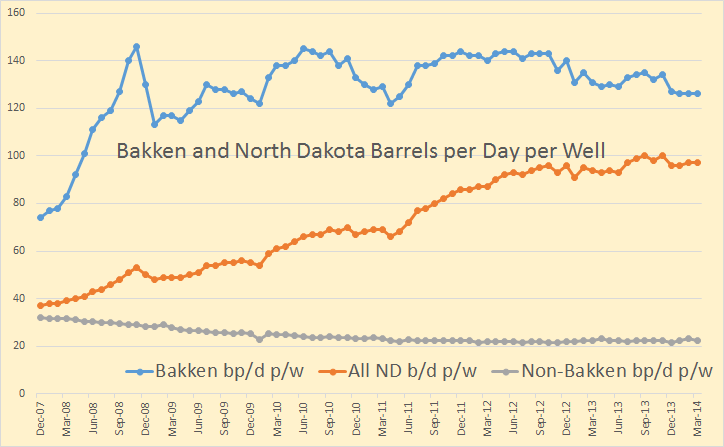
Barrels per day per well is trending down in the Bakken. And obviously wells outside the Bakken are not contributing very much.
The North Dakota production by county numbers don’t add up. If you go here:
ND Historical Barrels of Oil Produced by County and add the combined production of all North Dakota counties, (and divide by the days in the month), you get 920,802 barrels per day for February and 926,286 bp/d for March for a March gain of 5,848 bp/d. That is likely because “Confidential Wells are Not Included”. But those are all the numbers we have and those are the numbers I use on the charts below. But also note that confidential wells are included in the Bakken and state wide totals above.
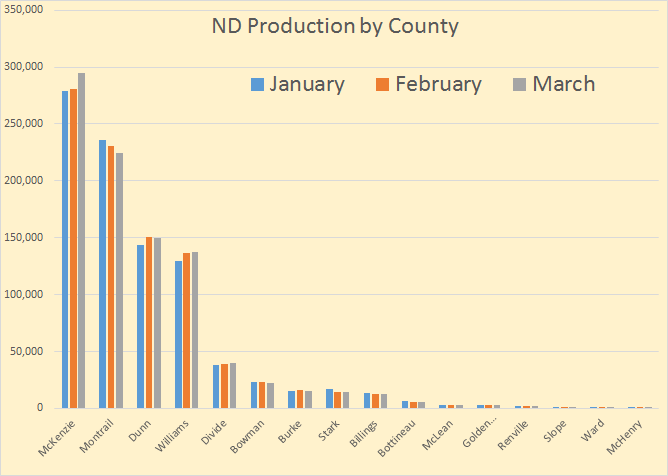
The data is sorted by production numbers. The top four counties account for 87% of all North Dakota production. (Mountrail is misspelled, sorry I will fix it next time.)
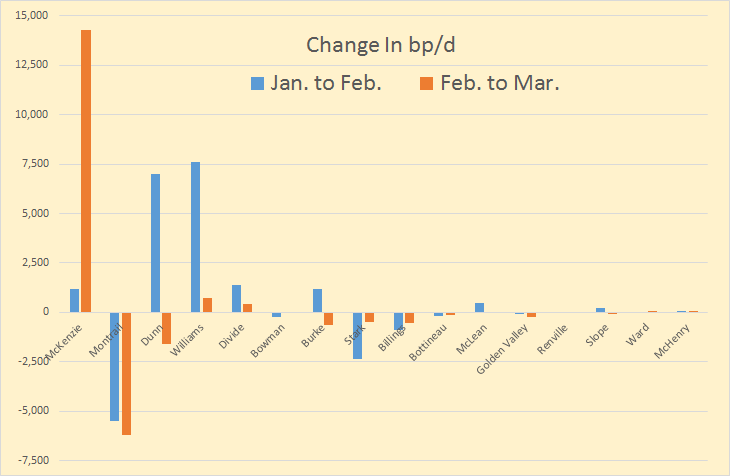
Same sort as the above chart. Though the “Confidential Wells not Included” problems distorts the chart, one can still see that almost all the action is still in only four counties. The second most productive county, Mountrail, seems to be in trouble in any case.
Comments from the Director’s Cut
The drilling rig count was up slightly from February to March and back down from March to April. The number of well completions was up sharply from 70 to 200. Investor confidence remains strong. There were still approximately 50 wells shut in for the Tioga gas plant conversion in an attempt to minimize flaring, but the biggestproduction impact was still the weather. March began with 2-3 days of temperatures well below zero, add to that 7-12 days with wind speeds too high for completion work, and then 8 inches of snow on the last day of the month. In like a lion and out like a lion
makes oil and gas work difficult.
At the end of March there were about 635 wells waiting on completion services, a decrease of 15.
Crude oil take away capacity is expected to remain adequate as long as rail deliveries to coastal refineries keep growing.
Another comment from Helms on North Dakota Oil Production.
Department of Mineral Resources Director Lynn Helms said officials had expected an even bigger bump in oil production. “The larger surge in production expected in March didn’t happen,” he said.
And an interesting stat from that same article:
The U.S. Energy Department’s Energy Information Administration says approximately 1 percent of all natural gas in the country is flared. And department data says while North Dakota accounted for only 0.5 percent of all natural gas drawn from plays in the U.S. from 2008 to 2012 it has accounted for 22 percent of the nation’s flared gas.
The Industrial Commission is expected to consider in June whether production might have to be curtailed.
Industry officials said at a day-long meeting in April that harsh restrictions could make companies consider investing elsewhere. Conservationists and oil patch residents responded that slowing down activity and allowing infrastructure to catch up with production would help alleviate flaring.
And another very interesting article: ND Production up, but not 1 million barrels yet
To further reduce flaring, companies will be required starting June 1 to submit gas capture plans with their drilling permit applications. Helms said companies recently received letters with guidelines on what those gas capture plans should look like.
“I think it’s fair to say they’re extremely nervous about what this is going to mean,” he said.
In some cases, the new requirements could delay or restrict permitting or restrict production, Helms said. The North Dakota Industrial Commission took public comment in April and is still working to develop the final piece of its plan to reduce flaring, Helms said.
I think Helms is just as nervous as the oil companies about any new restrictions on flaring in the Bakken. This could mean that wells that are barely profitable with flaring will no longer be profitable at all after these restrictions. Look for drilling outside the four main counties to slow to almost nothing.
I think we can look for a Bakken production to increase through the end of this year but by not nearly as much as a lot of the Bakken cheering section is expecting. The high decline rates are catching up. Any kind of bad weather or other problems slows drilling but the decline continues regardless of weather or other problems.
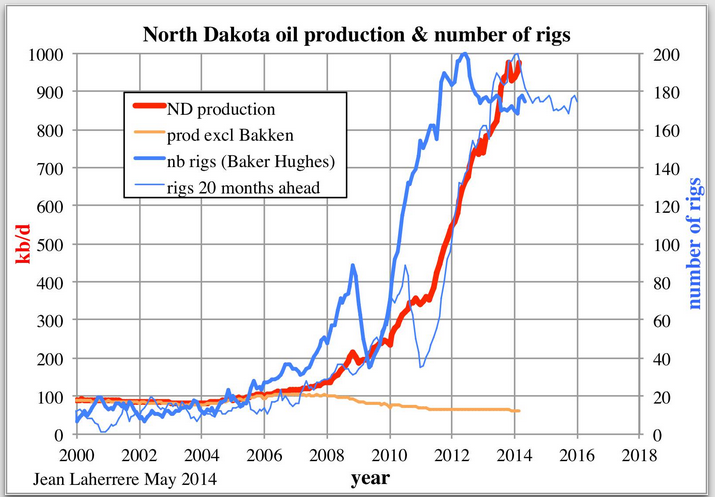
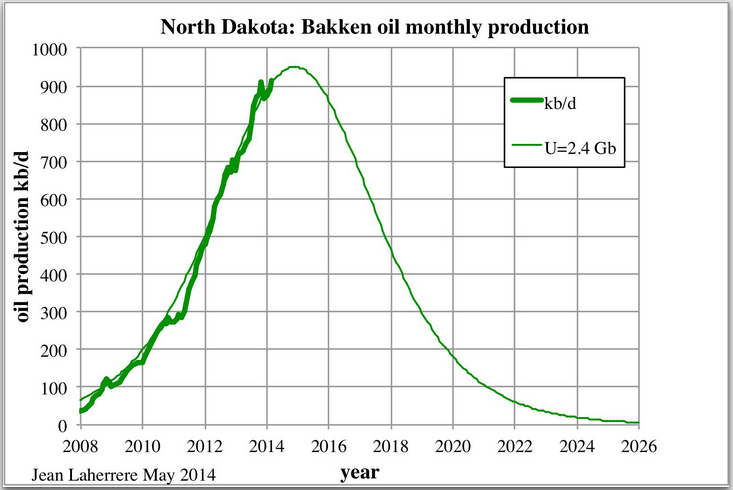
Jean Laherrere just sent me some Bakken graphs. I am posting them below along with his comments:
130 responses to “Bakken Update, March Production Data”
Well, according to Jim Cramer, on CNBC, we are flaring more gas that we are using. So, he claims that we are flaring in excess of 70 BCF/day. This follows last year’s pronouncement from Simon Hobbs, also on CNBC, that the US was already a net crude oil exporter.
And so it goes in the MSM. The problem is that most people’s “understanding” of the US energy situation comes from the MSM. So, people watching CNBC believe that we are are already a net crude oil exporter and that we could export 50 to 60 BCF/day of gas, if we simply put in the infrastructure necessary to stop flaring so much gas.
No, you are giving those who pay attention to Cramer way too much credit.
1. They never look anything up, so do not make the step from “flaring more gas than we are using” to the actual value.
2. They never deal in actual numbers with units.
3. They don’t do math.
Was listening to Victoria Nuland’s hearing on Ukraine, below :
http://foreignaffairs.house.gov/hearing/hearing-russia-s-destabilization-ukraine
And at 2:21:15 you get a rather amazing statement from Mr Poe (Ted Poe), something like :
“we must help Europe, and not just Ukraine, with an alternative to Gazprom, we have an abundance of both natural gas AND crude oil, we must really expedite the supply of these products”.
When it comes to energy, CNBC seems to be broadcasting from Fantasy Island.
Ron, you’ve made an interpretation error:
“To further reduce flaring, companies will be required starting June 1 to submit gas capture plans with their drilling permit applications.”
Your comment is:
This could mean that wells that are barely profitable with flaring will no longer be profitable at all after these restrictions.
It’s the NEW wells that have to submit these capture plans, if that’s phrased precisely. That will be a restriction of new drilling; not output from already producing holes.
Point being, the impact will be far more severe because it is the new wells that are the biggest impact on production.
Well yes, I really meant new wells that are in areas outside the sweet spots. Even before they are drilled it is known that production will below but still profitable. I thought my next sentence made that point: Look for drilling outside the four main counties to slow to almost nothing.
Sorry I did not make that point clear.
okie doke
I’m not easily imespsred. . . but that’s impressing me! 🙂
I hope the broader reality is visible here, politically. If the peak is accelerated by this, it is powerful red meat for the right wing pointing at regulations destroying America etc etc. And in the November time frame.
You may be right about “red meat for the right wing”, but just because it is almost always cheaper to pursue an industrial process by dumping its waste products into the environment doesn’t justify the dumping. Polluters can always be expected to whine about the cost of regulations that keep them from polluting.
In the case of the Bakken, natural gas is pretty much a ‘waste’ side effect of oil production. Whether flared or vented, it is an environmental pollutant, just like all the other greenhouse gases. I guess the oil producers in the Bakken would say that they need to dump CO2 into the atmosphere to produce oil just like a coal-fired power plant needs to dump CO2 to produce electricity.
But all fossil electric plants need to dump CO2, whereas very few oil producers outside the Bakken need to do so. Without a tax on carbon emissions to provide an economic incentive , we are left with the regulatory process to prevent gratuitous pollution. I hope such regulations are forthcoming for the Bakken. If Bakken oil can’t be produced without continuous gas flaring, it shouldn’t be produced at all.
Hi Watcher,
The EPA will drag its feet until after November, Helms is trying to get the regulations changed or softened. Seems the most efficient solution would be to measure the gas flared and charge a fee that will reward those businesses that reduce the amount of gas flared (because they do not have to pay the fee), for example if the capital cost to install equipment to eliminate flaring costs $1 billion, add a 20 % profit to make it 1.2 billion and if 1 billion cubic feet are not flared due to such an investment, then charge $1.20 per cu ft of gas flared to those who choose not to make such investments, with the penalty rising by 10% each year. Start collecting in December 2014.
I think it reads as a state regulation responding to comments already rec’d from EPA.
Agreed. I should have read the document before commenting, sorry.
Great job as usual Ron.
Even if the USGS F95 case of 6 Gb from the Bakken/Three Forks is correct and real oil prices do not fall below $80 per barrel in 2013$, we will not see much of a decline before 2016 in the Bakken (unless there is economic disruption for some other reason.) The most likely scenario is a peak around 2018 with decline setting in in 2019 (see green lines in chart below for F50 scenario, dotted lines are low price and solid lines are high prices), the low and high price scenarios are plotted on the right axis, the AEO 2014 reference oil price scenario has real oil prices rising to about $130/barrel in 2030 (closer to the low price scenario shown in the chart).
Wait a minute.
“The Industrial Commission is expected to consider in June whether production might have to be curtailed.”
So the graph is what happens if production doesn’t look different.
Hi Watcher,
Yes, the graph was produced quite a while ago, I expect the flaring regulations will make very little difference. Even at $80/barrel in 2013$ the profits on an average Bakken well are about 30% on a point forward basis see chart below for the economic assumptions all calculations in real dollars. NPV=Net Present Value and refers to the NPV of future oil revenue minus transport costs, OPEX, and royalties and taxes over the assumed 20 year life of the well. Profit is the NPV minus the well cost.
Edit 5/16/2014 Note the Chart below is for the 5.8 Gb case in my previous chart which assumes TRR=8.5 Gb and ERR(economically recoverable resources) becomes 5.8 Gb due to low real oil prices of $80/barrel (2013$).
The most likely scenario is a peak around 2018 with decline setting in in 2019 …
There just ain’t no way in holy hell the Bakken can go to 2018 before peaking!
Hi Ron,
So I guess you think that something will derail the economy and send oil prices below $80 per barrel at the refinery gate prior to 2018. We also may disagree on how a peak is defined, I judge “the peak” not by single months, but by a 12 month centered moving average.
Also note that I said around 2018 so it could be 2017 or 2019, but 2018 would be the best guess, I think there will be a relative plateau over the 2017 to 2018 period so call it late 2017 if you like and then we can say that you are correct and I am incorrect, if that makes you happy.
I am more concerned about when the decline will begin as we might be on a plateau for a couple of years, I thought that might be 2019, but have revised my thinking based on new data.
I recently realized that US oil reserve data for 2012 is out and North Dakota went up by 1 Gb so I get 3.3 Gb of proven reserves, about 0.6 Gb of Bakken output through Dec 2012, and a USGS F50 undiscovered TRR estimate of 5.8 Gb for the North Dakota Bakken/Three Forks for a TRR=3.3+0.6+5.8=9.7 Gb. I rounded this to 10 Gb for the ND Bakken /Three Forks and used the EIA’s AEO 2014 Reference scenario oil price to get a new Bakken estimate. See Chart below. Peak is 1280 kb/d in 2019.
I have my asbestos suit on, so go for it. 🙂
So I guess you think that something will derail the economy and send oil prices below $80 per barrel at the refinery gate prior to 2018.
I haven’t a clue as to what oil prices will be between now and 2018 because I haven’t a clue as to what the economy will do. But if the economy stays strong I expect Brent will stay somewhere between $100 and $120 a barrel in 2013 dollars. If there is a recession I still don’t expect oil to drop very far. Not likely to go below $95 in a mild recession or $85 in a bad recession. If we have a depression then I have no idea. But if everything stays like it currently is then I think the Bakken will peak between late this year and the end of 2015.
I judge “the peak” not by single months, but by a 12 month centered moving average.
I have no problem with that definition. In fact I think it is a very good one, one that I would use myself.
then we can say that you are correct and I am incorrect, if that makes you happy.
Dennis, this has nothing to do with what makes me happy. I am not happy that we are on a path to disaster but we are, even if oil were never to peak. I am simply giving my opinion which I think is a very educated guess. And I think your opinion as to when the Bakken will peak and how long it will stay on a plateau is way off. It has nothing to do with making anyone happy.
I think you are badly mistaken to concentrate on how much reserves there is in the Bakken. There is likely a lot more than you think it is. And a lot less can be economically recovered than you think can be recovered.
I don’t think there will be any plateau to speak of. Why do you think Helms talks so much about “investor confidence”. Once it becomes obvious that the Bakken has peaked investor confidence will fall like a rock. When that happens it will be obvious just how leveraged those drillers and frackers are. They will sell off assets just to pay their creditors. It will look a lot more like a shark fin than a plateau.
“But if the economy stays strong I expect Brent will stay somewhere between $100 and $120 a barrel in 2013 dollars. If there is a recession I still don’t expect oil to drop very far.”
This is strong?
But no matter. Q1 GDP logged in at 0.1% first look and there will be 2 revisions before the final look. Goldman says the final look will be -0.3%.
Q2 estimates are all over the place since we’re still in Q2, but were it to manage negative . . . that’s the definition of recession — 2 consec quarters.
“When that happens it will be obvious just how leveraged those drillers and frackers are. They will sell off assets just to pay their creditors. It will look a lot more like a shark fin than a plateau.”
Hi Ron,
The companies operating in the Bakken are doing just fine.
In 2018, if Real oil prices follow the EIA’s AEO 2014 reference scenario
profits will be quite good if the USGS mean (F50) estimate for undiscovered technically recoverable resources for the North Dakota Bakken/Three Forks is correct.
Note that I start with TRR and then use reasonable economic assumptions to estimate economically recoverable resources (ERR), using the TRR estimate of 10 Gb and AEO reference oil prices the ERR is about 9 Gb. You need to start with some assumption to do any analysis, 2.5 Gb is less than produced oil plus proven reserves so it is not a reasonable starting point.
Chart below with net present value (NPV30) over an assumed 30 year well life, real, well cost, real oil prices, and profit for the ERR=8.8 Gb scenario presented earlier.
Hi Ron,
I just noticed that your prediction pretty much lines up with the USGS F95 case (6 Gb) where the peak is in 2016, this is a little later than your prediction of “the end of 2015 at the latest”, but the difference between Jan 2016 and Dec 2015 is not really that great.
One difference is that I tend to focus on when the decline begins rather than when the peak arrives. The ERR= 5.9 Gb and ERR=4.3 Gb cases (in orange in my first chart) both peak in early 2016, but the decline will not become noticeable until late 2017 (depending on prices). Remember that proven reserves (Dec 2012) and oil produced is already at 4.2 Gb, so the 4.3 Gb scenario is certainly not far fetched, though it could be argued that it is unlikely that there won’t be any more than 0.1 Gb added to proven reserves in the Bakken.
Whether another 3 Gb will be added is another question, but the USGS thinks the chances are about 95%.
I like those odds. That is why the 8.5 Gb TRR scenario with a 7.6 Gb ERR makes more sense to me.
“I’ve been predicting a Bakken oil production peak in 2014 +/-1 year and I maintain that prediction.”
http://www.resilience.org/stories/2014-05-14/the-status-of-u-s-oil-and-gas-production-spring-2014#
by Roger Blanchard, originally published by Resilience.org | TODAY
Patrick, thanks for the link. I often check Resilience.org but not every day. I might have missed. That is indeed a great article.
Jean Laherrere just posted me a link to his most recent paper. It is great. He has some predictions on peaking in Texas and elsewhere. I particularly liked his take on the Permian Basin. I will likely use this paper in future posts.
http://aspofrance.viabloga.com/files/JL_MITParis2014long.pdf
Hi Ron,
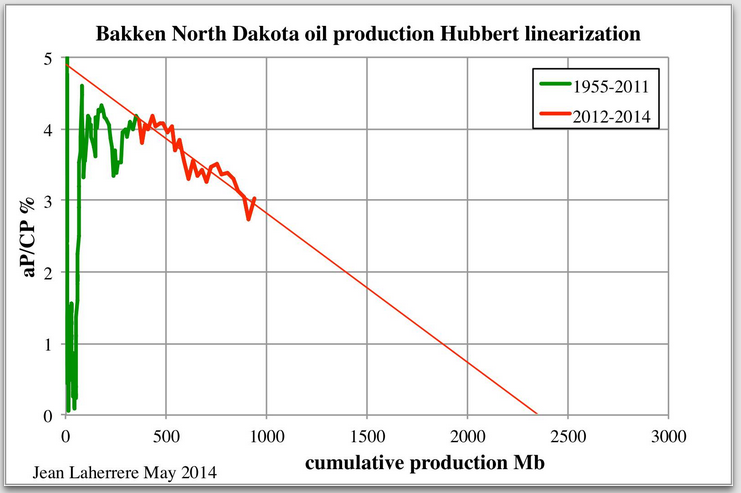
I have read that paper, and it is very good, but I do not agree with Mr. Laherrere’s analysis of the Bakken. Remember Political Economist’s HL analysis of Russia and Saudi Arabia gave spurious results on the high side, it can give bad results on the low side as well, it is really a poor method for establishing URR.
Also note that in Dec 2005 proven reserves in North Dakota were about 400 MMb and Dec 2012 they were about 3700 MMb. Let’s assume all 2005 reserves were from the non-Bakken part of North Dakota(ND) and that these remained at 400 MMb at the end of 2012, that would give us an estimate of 3.3 Gb of Bakken proven reserves at the end of 2012, approximately 600 MMb of Bakken C+C has been produced so that boosts URR to at least 3.9 Gb.
Now let’s consider the USGS April 2013 Assessment of the Bakken/Three Forks (see link below) slides 13 to 18
https://drive.google.com/file/d/0B4nArV09d398cDZMNW5yRWxVM1k/edit?usp=sharing
The low (F95) estimate for all of the US Bakken/There Forks was 4.4 Gb of undiscovered technically recoverable resources (UTRR) about 79% of the UTRR is in ND or 3.5Gb, this amount needs to be added to the proven reserves and produced oil to get the TRR.
Bakken/Three Forks TRR = UTRR + proven reserves + oil produced
=3.5 Gb + 3.3 Gb + 0.6 Gb
=7.4 Gb
Thus the USGS believes that there is a 95% probability that the TRR of the ND Bakken/Three Forks will be at least 7.4 Gb. If there are no proven reserves added to ND Bakken/Three Forks the 2.4 Gb URR estimate is still likely to be 3.9 Gb-2.4 Gb= 1.5 Gb too low.
The mean (F50) USGS estimate of ND Bakken/Three Forks is 9.7 Gb.
The F95 estimate is 7.4 Gb and the F5 estimate is 12.9 Gb.
As these are rough estimates it is more appropriate to round them
so F95=7 Gb, F50= 10 Gb, and F5= 13 Gb.
My guess is that there is about a 99% probability that the TRR is at least 6 Gb.
Note that the original chart I posted above (showing 6 different scenarios with high and low prices) was based on F95= 6 Gb, F50=8.5Gb, and F5= 11 Gb because I only had reserve data through 2011 and assumed incorrectly that this number would not increase significantly in 2012.
EIA reserve data at link below
http://www.eia.gov/dnav/pet/pet_crd_pres_dcu_SND_a.htm
Edit (8:03 AM)
I forgot to mention that the rig number analysis is also flawed because it is fracking that is the bottle neck in the Bakken and not drilling, the rig count is down because there are enough rigs to keep the available fracking crews busy.
I agree, very good article. One thing I don’t get–he says he expects natural gas prices to creep up in late summer/fall to induce more natural gas drilling. Won’t the fall be a little (or a lot) late to get natural gas storage numbers up by winter?
Hi Patrick,
I would prefer that the pessimistic estimates were correct, but they are wrong by as high a percentage as the optimistic estimates of the cheerleaders.
Blanchard suggests petroleum geologists say something different, but there is variation amongst those geologists. Hughes in Oct 2013 estimated about 5.2 Gb from the Bakken and over 7 Gb from the Eagle Ford (search on David Hughes Eagle Ford and find Oct 2013 PDF), but Laherrere estimates the Bakken at 2.4 Gb, and I believe there are a few petroleum geologists at the USGS whose latest estimate for the Bakken is about 9.7 Gb (North Dakota only). Let’s assume the USGS mean TRR estimate of 10 Gb is roughly correct, the cheerleaders say 40 Gb (or more), a factor of 4 higher, where the pessimistic estimates of 2.5 Gb are a factor of 4 lower than this 10 Gb estimate.
Personally I think reality is likely to be between these high and low estimates probably in the 8 to 12 Gb window for the Bakken and maybe between 5 and 7 Gb for the Eagle Ford.
Also note that Art Berman says they are making money in the Bakken according to the Blanchard piece, and I am confident that quite a lot of money is being made in the Eagle Ford as well. It is the Shale gas plays where the majors are “losing their shirts”.
As far as Blanchard’s 2014 call, I think it could be right if we stay on a plateau for a couple of years and if he is right it will be 2015 rather than 2014, but I still like 2017 to 2019. Time will tell.
Dennis,
Question: All your graphs and calculation are based on total Bakken / Three Forks estimated reserves by different authorities. Accepting that they are correct in their 10gb estimate. This would be for the total Bakken / Three forks area, which covers at least 4 counties if not more. Production experience is showing us that maybe just one county is going to be significant in providing the local peak in production, two counties at max.
So my question is shouldn’t you discount the total recoverable to reserve down to these one or two counties, for you to get a accurate calculation and production profile. And while we are concentrating on just one county, and maybe even a smaller area than that, we maybe also run into Watchers favourite subject, how many trucks can we fit into such a concentrated area on any one day?
I am no mathematician, so could be way of in my thinking, but gut tells me if we are only producing from a small area, then it is only the reserves in that area that can be counted on being produced. It is not like a big permeable formation where one well in the middle of the field, given enough time could produce the complete field. These shale wells only produce from the volume of rock fracked.
Hi Toolpush,
Your idea is a good one, but I do not have the data to do what you suggest.
I account for the difference in well productivity (EUR) in the following way.
I assume the average well productivity (new well EUR), which has been pretty consistent from 2008 to 2012, will continue at its present average level until Jan 2015.
Then the average well productivity will decrease as oil companies move to less productive areas.
I also make different assumptions about the TRR from as low as 6 Gb to as high as 11.5 Gb (this was the range of the USGS estimates before I revised them based on 2012 ND reserve data).
Note that 0.8 Gb of oil has been produced (through Dec 2013) and there are 3.3 Gb of proven reserves so TRR is at minimum 4.1Gb.
In 2012 1.3 Gb was added to reserves (including oil produced during 2012), if we assume another 1 Gb of reserves were added in 2013 (without the oil produced), we would be up to 5.1 Gb of TRR.
It does not seem unrealistic to me that another 3 Gb of proven reserves are added over the 2014 to 2018 time frame (0.6 Gb/year on average) which would get us up to 8.1Gb.
The main point is that well productivity (EUR) is assumed to decrease because there are sweet spots and they are limited.
Chart below shows the EUR decrease for a TRR= 8.5 Gb model, 150 new wells added per month from Jan 2014 until 40,000 wells are reached. This chart has no economic assumptions.
Chart below takes the TRR=8.5 Gb and adds economic assumptions to find economically recoverable resources(ERR).
The 7% annual discount rate seems low, but the calculations are done in real (constant) dollars adjusted for inflation so it is equivalent to a 10% annual discount rate if the NPV calculation was done in nominal dollars.
The fall in the annual rate of decrease in new well EUR is due to a reduction in the number of new wells added in 2022 due to falling profits as EUR decreases causing the number of new wells added to drop from 150 wells per month to 18 wells per month by 2024 the rate of decrease in new well EUR falls from 12 % to 1.5%( a factor of 8) similar to the drop in the number of wells added each month.
Chart by ‘Political Economist’ by way of Ron Patterson’s ‘Peak Oil Barrel’, (Click on for big). A record of cumulative crude- and condensate (C&C) since 1965 with prices in constant 2012 dollars (from BP Statistical Review).
Notice that the bulk of C&C extraction cost less than US$40 per barrel; prior to 1973, the inflation adjusted cost was less than US$20.
Back of the envelope calculations give the following quantities at different price levels:
Less than $40/barrel (2012 dollars) = 73,175 million metric tons since 1965.
Less than $60/barrel (more than $41) = 23,050 million metric tons. It’s likely that oil in the sub-$60/barrel price categories has been completely exhausted, all that remains is petroleum and near- petroleum substances that are more costly to extract.
Less than $80/barrel (more than $61) = 20,200 million metric tons.
Less than $100/barrel (more than $81) = 35,300 million tons. roughly 12,000 million MT of this crude was extracted during the period of Middle East wars that occurred during the 1970s and early 1980s.
Without the wars and their affect on transport, it is likely that crude price would have remained $40/barrel or less ($16/barrel in 1972); there was no shortage of petroleum in the ground and demand was inelastic. Higher rates of consumption at lower prices would have brought forward the onset of depletion-related difficulties that we are facing now. Critics of Hubbert linearization point out that it does not adjust for changes in oilfield technology. It also cannot adjust for above-ground interruptions in the consumption regime: the various Middle East conflicts in the seventies and eighties put off the world oil extraction peak by about ten years.
The question mark in figure 3 represents what crude are we going to use going forward? Peak oil analysts insist that the production plateau does not mean ‘running out of oil’. It is hard to see it meaning anything else when the only petroleum our economy can afford has already been burned up.
The suggestion that similar amounts of fuel will be available after extraction peak as before is not borne out by cost/volume analysis. The lower-priced, sub- $60/barrel fuels have been exhausted; lower price made fuel a loss-leader for the burgeoning automobile industry; the consequence of low prices was a world filled with cars and accelerating rates of depletion. Lower costs reflected the ready accessibility of pre-2000 crudes: volumes were easy to extract from large, conventional onshore- or shallow-water offshore formations. Going ‘up’ the extraction rate curve was affordable with relatively little credit being required, the external costs were easily pushed into the future.
The fuels we have today are not the same fuels we used to build out our consumption infrastructure. We have cleverly trapped ourselves: we must support higher prices because there are no low-priced fuels available. At the same time, our waste-infrastructure does not offer returns that would support the higher prices! We either bankrupt ourselves with loans from criminals to support our lifestyles or learn to do without.
Economic Undertow dot com
Thanks Ron.
I used the latest data to update my analyses, please see the familiar graphs below.
Some comments:
Graph 1 & 2 : What I find interesting here is that now it seems to emerge that wells from 2012 & 2013 are on a slightly faster depletion trajectory than 2010 & 2011 wells. It’s still an early observation though.
Graph 3 : The average peak production (around 13000 barrels) of wells peaking in February was still somewhat in the low part of the range of 12000-16000 we’ve seen during the last 4.5 years. New wells starting production slightly up in March.
Graph 4 : I changed this graph to daily output, so that the distortion due to monthly differences in numbers of days was removed. I belief that this graph still somewhat overstates contribution from past production, as some old wells are being reused again (refracking?), but I still count the output of those in the year-category in which they originally peaked.
Hi Enno,
Is 2007 still 2007 and earlier wells, as in “pre-2008” rather than 2007 in your first two charts?
And if you don’t mind shooting me the data by e-mail, I would appreciate it.
Hi Dennis,
Data sent. The 2007 profiles in the first 2 graphs are indeed still a bit skewed to the downside, as they might include some older wells that were at least still producing 1000 barrels a month. I will fix that in a next update, thanks for noticing.
Hi Enno,
Thanks for sending me the data. A suggestion for your third chart is to leave out the 1st month output data for the most recent month as the untrained observer will think, “Wow the output is really dropping.” I believe the first month is usually not the peak output month unless the well started producing on the first day of the calendar month, though you may have better insight on this.
Hi Dennis,
I agree with your first comment.
The 3rd graph shows 2 lines;
-The black one shows the number of wells that started to produce in that month
-The red one shows the average peak production of wells that peaked in that month
Therefore, these lines use 2 different datasets, and I do not assume that the first month is also the peak month. I am still considering whether to create 2 seperate graphs instead.
“Department of Mineral Resources Director Lynn Helms said officials had expected an even bigger bump in oil production. “The larger surge in production expected in March didn’t happen,” he said.”
A few Ronposts ago someone posted a note from CoreLabs quarterly about an investigation into why their April numbers were weak, and determined it was because rock and liquid samples coming in from the unconventional shale fields were way below estimates.
So . . . April may be even weaker.
This link is to a blog that I read on a regular basis. The author has his heart in the right place but he comes across as as way to idealistic to suit me. We live in a Darwinian world which means we play by Darwinian rules.
I am not sure that a country as large and powerful as the US MUST play by Darwinan rules though -at least not all the time.
This particular post deals with the historical relationship between Iran and the US since WWII or so.
I am not expert in this history but to the best of my knowledge the author is telling it more or less straight.He is a very skillful writer and most of his work is better crafted than this and a real pleasure to read – if you think like he does of course. Or even if you don’t if you just appreciate well crafted prose and well made moral arguments.
http://ofprincipalitiesandpowers.blogspot.com/2014/05/argo-search-your-conscience.html
Very nice post. Thanks OFM. I guess I agree with the idea that it is a bad idea for the US to overthrow democratically elected governments.
So do I but in the big leagues sometimes you have to fight dirty.
In this case I wish we had faced up to reality and played a clean game.
We would be far better off today if we had taken oil depletion seriously decades ago as well as having a higher moral standing in the world.
But if we don’t grease a few palms for instance in that part of the world would we be able to do any business there at all?
Our rivals are not going to think twice about paying a few bucks out in bribes.
Hi OFM,
Yes you have to play dirty, but even in the big leagues if you go too far outside the rules you are banned. Bribes are fine, overthrowing elected leaders or assassinations are a bad idea, though no doubt it happens.
The problem is that there is always another layer of the onion or bigger box or whatever.
In the biggest leagues of all the cheating players are also the referees.
Professional wrestling athletes ( acrobats or actors if you prefer the term but they are pro athletes in my estimation of the same sort as circus performers riding horses) and the organizers and the referees don’t have anything at all on the people who are more or less in charge of what is happening in terms of the human race.
As a matter of fact I think one reason wrestling is such a success is that it is an unconscious ( in the mind of the fan) caricature of his day to day life.Every which way he turns he finds the good guys frustrated by the bad guys cheating- but the good guys do win often enough to keep him from dropping out of the audience.
animals, including humans, have to cooperate to get anything done, dont they?
the problems come when my little group of human animals is competing with your little group of animals
in a darwinian world, the guys with the biggest sticks win
.
now we got this move towards “globalization”, but maybe that’s backfiring… maybe people are starting to think of humanity as a whole… maybe they’re starting to see the necessity of cooperating –all of us– to deal with peak oil and global warming
maybe the facade of “globalization” is falling down… maybe we’re starting to see what “globalization” really is
“globalization” seems to be a rationale that allows “our” little group of human animals to move into other human animals’ territory to exploit their resources and labor…
.
if “globalists’ ” stick is beg enough to enforce “globalization”, then they will win temporarily
but the whole attitude is sick because it disregards morals’ function as a survival mechanism
the globalists seem to think they have a monopoly on “truth”… and they’re sailing under these big lags of “democracy” and “free trade” and “human rights”
that’s nice
but while they’re preaching democracy, free trade and human rights, they’re overthrowing democracies, restricting trade, droning weddings and torturing people
so lots of people are beginning to question the globalists’ version of the truth, as demostrated by globalist actions
…and lots of people seem disinclined to cooperate with globalist hypocrites, whose actions are starting to speak much lounder than their words
in 22,014 when the first imperial earthling colonists got to festeria, they found the festainan people to be hostile… human, but hostile
festerians faced up to human perfidy… up to a point
they realized that a festerian female was obliged to impove the race, which obliged her to be inseminated by the fittest male she could find… in the meantime, she had to marry someone who would provide for her offspring
male festarians were expected to inseminate anyone who was willing, on the theory that if the woman was willing, she must think his offspring would improve the race
a situation like this is not good for building trust, but it produced people who were convinced of their superiority… it was a sacrifice –enduring the perfidy– but to the festarians, it was worth it
.
unfortunately, male festarians overcompensated for their insecurity by thinking they should rule the universe… by force if necessary
which resulted in universal contempt for festarians, but the contempt only proved –to festarians, at least– that they were resented because of their superiority
to the earthlings –who had long since become homgenized and brown– not of it made any sense, at all
Why do you have to get anything done?
Hi, everyone. Really enjoy your discussion!
Using the EIA drilling productivity report data, it’s actually possible to do HL analysis for each of the plays and for both oil and gas.
For Bakken, the following graph shows the cumulative production from 2007 to 2014. The HL trend indicates the ultimately recoverable amount to be 3.5 billion barrels. This is of course significantly lower than the various URRs Dennis used. This is easy to understand given the different methodology.
But why is this so different from Laherrere’s? I don’t know. But later I am going to show HL analysis for Eagle Ford, which looks remarkably similar to Laherrere’s graphs for Bakken.
The Bakken oil production is projected to peak 21 months after December 2013, that is, September 2015. The peak monthly production level will be 35.3 million barrels or 1.2 million barrels per day.
Hi PE,
Yes my method is based on the average well profile and number of wells drilled, a much better method than HL analysis in my opinion, if you look back at US output data and do an HL analysis after just a 2 year period you get a URR much lower that the eventual lower 48 URR of about 200 Gb probably off by a factor of at least 4 (it might be higher I forget).
Note that in my comments above I show that for the ND Bakken proven reserves plus produced oil point to a TRR of 3.9 Gb if there are no more reserves added in the future. I believe that at minimum the TRR will be 6 Gb in the ND Bakken and that the USGS F50 estimate might be on the high side, but think their F95 estimate of 7.4 Gb is probably pretty good, I would probably put the estimate between 8 and 9 Gb.
I will comment below on your Eagle Ford HL.
The difference between your HL and Mr. Laherrere’s is that his is for the North Dakota portion of the Bakken only where your data includes output from both Montana and North Dakota, I suppose we could think of this as indicating that the Montana Bakken’s URR is 1.1 Gb (3.5-2.4).
The USGS mean estimate of undiscovered TRR in the Montana Bakken/Three Forks is about 1.5 Gb, so 1.1 Gb may not be far off.
Now let’s look at Eagle Ford cumulative production from 2007 to 2014.
See how similar it is to Laherrere’s graph for North Dakota Bakken. And the predicted ultimately recoverable amount is 2.5 billion barrels (again, very similar to the 2.4 Gb of URR Laherrere found for Bakken).
Ron, you may want to double check with Laherrere if the above graphs were not sent by mistake.
Laherrere says Bakken will peak this year.
Well, my HL analysis finds that under the current trend, Eagle Ford will peak 11 months after December 2013, that is, November 2014.
The peak monthly production will be 43.2 million barrels or 1.4 million barrels per day.
Y’all do realize that if April is weak per Core Labs and the 1 June regulation change on gas capture for new drilling apps is enforced, peak may turn out to be Nov 2013?
And do you realize that “At the end of March there were about 635 wells waiting on completion services”?
Well ya, but that number is always big. It’s much easier and quicker to drill the hole and the horizontal run than to haul 1 million pounds of water and 5 million pounds of proppant. That 600+ number doesn’t get get cleared out quickly.
Just obsessed a bit more on Helms stuff.
200 completions. Apparently 1/3 of the month was no fracking, and with a decline in the wells awaiting fracking, so if they were down 1/3 of the month then 200 is one helluva lot of completions.
That would suggest a perfect month would get them another 1/3 of output of 33ishK bpd.
Or not. If we accept that the calendar determinant on fracking is truck hauling time (for the water and proppant, ignoring the oil hauling issue) it’s not clear low temps or high winds are shutting all fracking activity off — because most fracking “activity” is driving a truck.
So, shrug.
or 33K, not of 33K. This ain’t a great month by previous year standards.
Hi Watcher,
Yes that is the Red Queen in action, but a 33kb/d increase for 6 months (until winter weather slows things down) is an increase of 198 kb/d to 1100 kb/d for the bakken. Also the previous 12 months had an average increase in the ND Bakken of 16 kb/d so 33 kb/d is pretty good compared to the previous 12 months avg. Note the 12 months before that (13 to 24 months ago) was a 17.5 kb/d increase for the average month, but on a percentage basis was much higher.
Generally the exponential rise slows to a linear rise and then slows altogether as the peak is reached. The summer months will be interesting as those months historically have been where the biggest increases have occurred, mud season is coming so there will probably be a bit of a lull in April and May, but when the roads dry out in the June to October, if there is no increase (or very little increase) in output, then the peak (or at minimum the start of the plateau) has arrived.
I will be surprised if we see this in 2014, but by December we should have Oct 2014 data and we will see if I am wrong. My model suggests about a 13 kb/d rise in output in Oct 2014 (but the model does not account for the weather). It also suggests only a 13 kb/d average increase per month over 2014, this rate of increase gradually slows until a peak is reached in late 2018 at a little under 1300 kb/d. The model assumes about 2000 new wells per year are added. It also assumes that the TRR is 10 Gb rather than 2.5 Gb.
I am confident that the TRR will be at least 6 Gb and even if the Brent oil price falls to $80/barrel in 2013$ the ERR will be at least 4.3 Gb (but in that case the peak is in 2016 at less than 1100 kb/d).
Note TRR=technically recoverable resources and ERR=economically recoverable resources(it is thought to be profitable to produce the resources.)
It has been over 450 for a couple of years, you are absolutely correct that the fracking process (which includes lots of trucks to bring in proppant and water) is the bottleneck, at some point they may figure out a way to speed things up (better roads, more trucks?). Or not, in the last 12 months they have been under 150 new wells per month and this may be an infrastructure/weather limit that cannot be overcome. My model may be a little optimistic because it assumes they can get to 165 new wells added per month. For 2012 and 2013 average new wells per month were about the same (just under 150 new wells per month) but in 2011 only 100 wells per month were added on average so perhaps this number will bump up in 2014.
The point was that complaints of temperature and wind speed and the number of days those temps or speeds existed likely does not correlate to the number of days of no fracking. You can drive a truck when it’s cold. You can dump proppant when it’s cold and go get another batch.
Only if it’s cold the hour or two you want to frack during a day is there an issue. At 150 this is 5 wells per day. It only takes an hour or two to execute the process. Even on a cold day you might get a few hours of warm temps at 2 PM.
I am getting suspicious about these weather excuses. Trucks drive in the wind.
Editing that a tad.
If it snows they the oil hauling trucks maybe are not able to move and THAT will smack output.
But this fracking restraint via weather looks shaky.
Hi Watcher,
You assume that trucking is the bottleneck, if that assumption is incorrect (because trucks are not affected by wind and cold) and it is the actual fracking process that is the bottle neck due to the number of properly trained crews and equipment, then wind and cold may cause delays.
Trucks and truck drivers are easier to find than the experts needed to frack a well and the equipment they need to do it.
So the weather argument is only shaky if your assumption that trucks are the key is correct.
Yup, but that was the point of “5 wells per day”. That isn’t many fracking crews.
5 million pounds / 50,000 pounds per truck. Lots of time eating trips.
Versus moving equipment and a fracking crew, with now years to train more if their scarcity was noted.
Hi PE,
Where did you get your Eagle Ford Data? Note that drilling info gets its data directly from the RRC of TX and for the most recent 12 months this data is not very accurate.
I found a good presentation by David hughes (link below)
https://www.google.com/url?sa=t&rct=j&q=&esrc=s&source=web&cd=7&ved=0CGQQFjAG&url=https%3A%2F%2Fgsa.confex.com%2Fgsa%2F2013AM%2Fwebprogram%2FHandout%2FPaper226205%2FHUGHES%2520GSA%2520Oct%252028%25202013%2520-%2520Short.pdf&ei=0sl0U9zhBcHisASmvYG4DA&usg=AFQjCNF0eKf12DtIEqKAbQxgQXq3gb4eIQ&sig2=uPrZC-fhK69Se1VNwWILBg&bvm=bv.66917471,d.cWc
see slides 46 to 49, he estimates much more output than 2.5 Gb, my models assume a TRR of about 6Gb which is a little less than Hughes. whose estimates range from 6.3 to 7.5 Gb.
Note that he uses drilling info data from Oct 2013 and the EF output is underestimated in mid 2013 by about 20% (800 kb/d when it should have been about 1000 kb/d in June 2013.
His Bakken estimates are a little low, but I believe he misinterpreted the USGS 2013 Bakken Three Forks Assessment as I have done in the past.
The mean estimate is 5.8 Gb for the North Dakota Bakken /Three Forks(NDBTF) undiscovered technically recoverable resource (TRR), but in the past I had mistakenly interpreted this as the TRR.
To find the TRR we have to add proven reserves and oil already produced to the undiscovered TRR which raises this number to 9.7 Gb. Even the F95 USGS estimate is over 7 Gb (95% probability that resources are at least this large).
Hughes also estimates only 26,500 drilling locations, but the NDIC estimates 40,000 to 45,000 drilling locations at low drilling density (so the estimate is conservative).
Dennis, thank you for your thoughtful comments.
As I explained in the Bakken post, all data are from EIA’s Drilling Productivity Report. They provide data for every month from Jan 2007 to June 2014 for both oil and gas.
So the data are “official”. And every one can use those data to reproduce the above graphs.
One problem is that as there is no data before 2007, the cumulative production is only for 2007-2014 not all time cumulative production. Although in the case of Bakken and Eagle Ford, the cumulative production before 2007 is probably negligible.
I’m still curious about the coincidence between my Eagle Ford graphs and Laherrere’s Bakken graphs.
Yes, HL analysis can err on the upside or downside. The hope is that when you add up many individual exercises, the pluses and minuses can more or less offset each other. It cannot predict future major developments such as the shale oil boom. But again, as more data are accumulated and more and more expensive resources have been exploited, the chance for future surprises comparable to shale oil will diminish.
Aware of the above limitations, for every HL analysis I always emphasize the results are indicated “under the current trend”. The HL analysis provides one piece of information among many other pieces to provide a range of future possibilities.
I’ve done HL analysis for Permian and Niobrara as well, they indicate comparatively large URR and the predicted peak year will be around 2020 or later.
Hi PE,
The DPR data is not very good, Bakken includes both North Dakota and Montana but you can get the Bakken data from the NDIC going back to 1951. I have Eagle Ford Data which I will share if you are interested.
Note that you can look up proven reserves for Texas Districts 1 and 2 at the EIA (these districts cover most of Eagle Ford), most of the reserve increase since 2008 can be assumed to be from the Eagle Ford, the proven reserves add up to 2.7 Gb, so if we assume there will be no additions to reserves, then the HL is only a little high, I think it is low by a factor of 2. There has been about 600 million barrels produced through Dec 2013 in the Eagle Ford, so if we add the oil produced to proven reserves we get 3.3 Gb, my model expects about 2.7 Gb more will be added to TRR. Jean Laherrere estimates a URR of 3 Gb for the Eagle Ford.
Dennis, thanks for the reply.
This is interesting. Based on my data (the DPR data), Eagle Ford cumulative production from Januanry 2007 to December 2013 was already 800 million barrels, 200 million barrels higher than yours even though your cumulative production starts from an earlier year?
For Bakken, the DPR data said the cumulative production from January 2007 to December 2013 was 1.05 billion barrels. What does your data tell you about the Bakken cumulative production?
And why is the DPR data not very good? I know they try guestimate the most recent months. But why are the historical data not very good or less good than other sources?
Hi PE,
My Eagle Ford data comes from the RRC of Texas, ( I adjust more recent months based on a combination of RRC and EIA data, I do not know why the DPR data is bad, I think they have limited resources and do the best they can. Ron has pointed out on several occasions that the DPR data is suspect and I agree.
On the Bakken, I will repeat what I said above, the DPR data is for both North Dakota and Montana, you can get the North Dakota data from the NDIC (see first link in Ron’s post), that data is excellent.
For Montana it more difficult to get monthly Bakken output data.
Try the following:
1. subtract NDIC Bakken data from DPR Bakken data to get an estimate for Montana
2. compare this with EIA Montana C+C data
What I have found in the past is that the DPR report seems to assume that all Montana output is from the Bakken.
When I have checked the Montana annual data through 2012, the Bakken output is roughly 50% of total Montana C+C.
Also on my Eagle ford cumulative I was giving a rough estimate and trying not to overstate my case, the precise estimate is 670 million barrels, but my method of estimating might be high by 1 to 2 %, if the estimate is 2% high and we adjust it we get 657 million barrels. The actual reported cumulative C+C output by the RRC of TX for the Eagle Ford from June 1993 to Dec 2013 is 635 million barrels.
I am unsure why the DPR historical data for the Eagle Ford is not very good. Again if you want the data set I am happy to share it, just e-mail me.
Here is another link that tells it like it is without preaching which is a real surprise until you get acquainted with the source.
It is a highly partisan source in general but one that tells it straight in a surprising number of cases without mixing in any partisan politics.
This one is about mass transit and young people and changing times.
http://www.theamericanconservative.com/transit-gives-millennials-an-off-ramp-from-cars/
I guess if one wished to make a partisan argument out of the facts presented he could say that this proves that markets work.
And they do. But in the case of issues such as oil depletion they just aren’t going to work fast enough.We are going to have to have top down proactive policies to get thru peak oil without a really hard crash.
I doubt if either party is capable of providing the necessary leadership until after it is too late given the nature of the problem and the ignorance of the typical voter.
Wow, that article is from the American Conservative? It sounds just like mega-liberal Streetsblog. My head is spinning.
Scarcity and money printing has done things to the extremists of both sides.
“There is no Peak Oil. It’s all lies so you right wing mouth breathers can drill more and destroy Mother Gaia. Peak oil is a Koch scam!”
“You can’t kick these people off the welfare roles. That Kenyan communist in the White House has destroyed all the jobs. What could they do if you cut them off?”
The message was more, “Young people don’t want to drive in cars anymore. They want to take transit and bike. And that’s okay.”
I seem to recall Kopits had a slide that said if you don’t drive a car you don’t have or get a job. Something like that.
Unfortunately the terms liberal and conservative have been hijacked, kidnapped and gang raped from both ends of the spectrum.
For a long time it was a very effective trick to just accuse somebody of being a ” liberal”. It still works if the audience consists of self identified ” conservatives”.
I think the tide is maybe beginning to show signs of turning because the so called conservatives that are in control of the so called conservative wing of our political establishment are not truly conservatives at all. They are simply in my opinion cynical opportunists who know how to market themselves to people who don’t like a whole lot of what modern liberalism is all about.
I think of myself as a conservative but this confuses the hell out of a lot of people because I support a lot of so called ” liberal ” initiatives.
But you cannot be either a liberal or a conservative or anything else other than a fool or ignoramus unless you are fully literate in this day and time.This includes being both technically literate and street smart in terms of understanding people and politics and business.
I am technically well educated and have had a good look at the evidence and KNOW that global warming is a grave threat to our welfare. Ditto peak oil.I am also competent in terms of understanding people and politics and understand that although the tea party crowd is about as wrong as wrong can be they are right about one thing- we may well collapse simply because of an unsupportable debt load.
A bedrock principle of real conservatism is that the government must take care of problems that the private sector cannot or will not solve if the problem is of sufficient magnitude. No problem trumps survival. The market is not going to solve the global warming issue. Hence government must.
The market has not provided competent and affordable health care. Being a follower of the Christian philosophy ( but not a fundamentalist) I believe we must look after our fellows to a minimum extent and also that this is a prudent policy in terms of maintaining this country as a safe and prosperous place to live. We don’t need a French Revolution if we can avoid one.!!!!
If the market cannot or will not provide competent and affordable health care and our safety and prosperity and moral standing depend on it then the government must.
This does not mean that I am a greedy selfish ignorant cave dweller that gets a girl by bashing her with a club and dragging her back to my cave if I happen to think that a woman who can afford Georgetown law school and expects to earn over a hundred grand is entitled to free birth control when I pay taxes and will never get close to that kind of income. I pay taxes and don’t even gross the cost of that school.If she can’t afford birth control she should insist that her boyfriend pay for it. Or go to a cheaper school. So far as I am concerned she is whiny spoiled child with no more moral standing than the Koch brothers.
This is the sort of conservatism that I support . The American Conservative is more about principles and values than it is partisan advantage -unfortunately most people don’t even know it exists.
Most so called conservatives don’t even know it exists and most of the ones that do pretend that it doesn’t.
The republican party and the so called conservative establishment these days is all about opportunism and “” me and mine” and depends on smoke and mirrors for its power.
I have liberal friends and when we talk it always turns out that we want the same end results – a safe peaceful prosperous sustainable world where everybody is ok and has a shot at getting ahead.
We argue about tooth and claw the means of achieving such a world.
But no matter how well educated they may be I find that people tend to believe not what their intellect would be telling them if only they would listen to it but rather what their mid brain is telling them about group solidarity and group cohesion.
My best liberal friend is thoroughly pxxxed at me right now because I will not pretend that Ocare is a well conceived and well managed initiative even though I consistently describe it as a long term winner for the country and for democrats.I just insist on pointing out the truth about the lies ( keep your own doctor etc) and that the republicans are going to mop up because of those lies this fall.
He can’t handle this truth. ( Of course maybe Obama really did believe everybody could keep their own doctor. Lol) His partisan loyalties trump his ability to think.
Of course conservatives are subject to the same exact failings themselves.
On Sunday, Germany’s impressive streak of renewable energy milestones continued, with renewable energy generation surging to a record portion — nearly 75 percent — of the country’s overall electricity demand by midday. With wind and solar in particular filling such a huge portion of the country’s power demand, electricity prices actually dipped into the negative for much of the afternoon, according to Renewables International.
In the first quarter of 2014, renewable energy sources met a record 27 percent of the country’s electricity demand, thanks to additional installations and favorable weather. “Renewable generators produced 40.2 billion kilowatt-hours of electricity, up from 35.7 billion kilowatt-hours in the same period last year,” Bloomberg reported. Much of the country’s renewable energy growth has . . . .
http://oilprice.com/Alternative-Energy/Renewable-Energy/Germany-Hits-Historic-High-Gets-74-Percent-Of-Energy-From-Renewables.html
Germany CO2 emmisions up 2% 2013 versus 2012: http://epp.eurostat.ec.europa.eu/cache/ITY_PUBLIC/8-07052014-AP/EN/8-07052014-AP-EN.PDF
Ron,
I think the following is too important not to be repeated here: CONCLUSIONS from, The end of the peak oil myth by Jean Laherrere President ASPO France (April 2014). I apologize for any errors or omissions in the transcription. The source is cited above (by you I think).
“….Production data in the world are very poor, unfriendly, and incomplete with very poor definition of the products.
Reserves
Data is worse, public proved reserves are political/financial data (which should not be used for forecasting future production) and the real technical proved +probable reserves are confidential and unknown by
economists.
There are no rules in the world oil industry, no referees and no red cards for bad reporting!
The peak oil theory was introduced in 1956 by King Hubbert forecasting the US oil peak either in 1965 or 1970. US oil peak occurs in 1970 and triggers the 1973 & 1979 world oil shocks.
North Sea oil production peaked in 2000 and peak oil was then not a theory but a fact. Campbell and Laherrere in 1998 forecasted the end of cheap oil, but it was rejected as poor forecast. It was only in 2005 with oil price reaching 50 $/b that the peak oil was accepted but many disagree on the date and the level.
IEA recognized in 2010 that the world conventional crude oil has peaked in 2006, but since 2005 all liquids display a bumpy plateau within a range being the same order that the accuracy of the oil supply data which varies from sources at plus or minus 2 Mb/d.
The boom of the shale oil (now called light tight oil) in the US with the dream of oil independence for North America led some economists to claim that the peak oil theory is dead (the end of peak oil, peak oil myth)
.
But shale oil boom is not due to new technology (horizontal drilling and hydraulic fracturation are 50 years old practice), but to high oil price. It is
true that huge amount of oil was generated in most mature Petroleum Systems and that 99% is still within the sediments, but resources should not be confused with reserves. Shale plays were reported as continuous type accumulations covering huge areas, but quickly it was found that only sweet spots were economical and 80% of the wells uneconomical.
Estimating ultimate for US shale oil leads to forecast that the US tight oil boom will peak soon (EIA forecasts the peak for 2017 to 2020) in and will decline faster than forecasted by EIA.
The big difference between my shale oil forecasts and EIA forecasts is not for the date or for the level of the shale oil peak, but the rate of decline: I foresee (as many examples in the past) similar increase and decline when they see sharp increase and very slow decline.
Some claim that the oil peak will be due to demand. Some claim that oil peak will be due to demand reduction with abundance of oil supply. But oil price over 100 $/b proves that the problem is oil supply.
Many dream that peak oil will never occur by lack of supply but by lack of demand, because the renewable will take over. But it is likely that oil (all liquids) peak will occur soon and because there is no sufficient substitute to oil for transport…..”
Doug
L F Buz Ivanhoe discussed the “data” in 1996 http://hubbert.mines.edu/news/Ivanhoe_96-1.pdf
Thanks Doug, that is indeed a fantastic paper by Jean Laherrere. I studied it for a couple of hours last night and am going to go over it again today. The link is below just in case anyone missed it.
I think I may have a post later on this paper.
http://aspofrance.viabloga.com/files/JL_MITParis2014long.pdf
As you no doubt noted, and have previously discussed, the key point:
On the prior thread, I went through a “What, If” exercise for Alaskan North Slope production, showing where production would be if we extrapolated the 1978 to 1988 rate of increase in North Slope production for 10 years, for 20 years and for 30 years. In 2018, North Slope production would have been at about 133 mbpd.
Jeff,
Yes, it’s something I’ve been harping on ad nauseam, to employ my wife’s flattering phraseology, but when people like you and Jean Laherrere are saying it people really should listen. As a long retired geophysicist, obviously I’m not qualified to “publish” PO opinions but, saying that, I was in the oil patch for a long time and some things just come down to common sense.
Doug
Hi Jeff,
Note that the decline for the North Slope was much slower than the ramp up, so the idea that the decline after the peak will be just as steep as the rise in production is not confirmed by Alaskan output. See chart below.
Also US lower 48 onshore C+C output declined at an average annual rate of 3.8 % from 1973 to 2001, much slower than the Alaskan decline at close to 6%.
Of course, North Slope production was bottlenecked until the Trans-Alaskan pipeline was opened. Prudhoe Bay was discovered in 1968. If if had been an onshore Lower 48 field, production would have started in 1968 and showed a slower rate of increase, but they had to build the pipeline before they could ship oil to markets, and they continued to drill developmental wells while waiting on the pipeline connection.
However, I think that extrapolating the observed (1978 to 1988) 14%/year rate of increase in production, versus the post-1988 decline rate of about 6%/year is a useful exercise.
Dennis, the world is not one field and will not have the same decline curve as one field. Also there are many other differences as well. The world is highly political and rife with violence. Notice what happened to Libya. Libya did not have a gradual decline curve when the rebels shut down production.
One field is not globalized. One field does not have resource wars. No one decided to keep Alaska North Slope oil off the market for “future generations”.
There is every indication that the decline curve will be governed by politics and the economics of very expensive oil recovery of small fields and deep-water fields as well as the steep decline of EOR that has just petered out.
The idea that the decline will be symmetric with the increase was the idea that I was questioning, the decline might be steeper than the upslope or not as steep, it depends on a lot of factors. The world is not one field, and I think Jean Laherrere’s World estimates are quite good. I don’t know if he has the Bakken or Eagle Ford nailed down very well as the proven reserves plus production in both cases are greater than his estimated URR.
His Gulf of Mexico estimates are also pretty low relative to the BOEM
estimates which conservatively estimate undiscovered TRR at 39 Gb (F95 estimate). Then we need to add the 16 Gb already produced, and the 9 Gb of proven reserves, to get a TRR of 64 Gb. The BOEM estimates that there is a 95 % chance that the TRR will be at least this high in the Gulf of Mexico, Mr. Laherrere estimates 25 Gb, so I think he misses the mark here as well.
Link to BOEM report below:
http://www.boem.gov/Oil-and-Gas-Energy-Program/Resource-Evaluation/Resource-Assessment/2011_National_Assessment_Factsheet-pdf.aspx
see page 5 table 3 for proven reserves and oil produced and page 3 table 1 for UTRR estimates
A chart below showing what Alaska C+C output might have looked like if output started rising exponentially in 1970 to meet actual output in 1978.
It still does not look symmetric, the decline is slower than the rise in output (about a 21% annual rate of increase from 1970 to 1978).
So the field, because it was in the arctic would have taken at least two years to get up and running so I used 1970 as a start point (as if the pipeline already existed in 1970) and assumed production ramped up exponentially to the point where it reached actual production in March 1978. The decline is slower by a factor of more than 3. See chart.
Dennis,
Last time I counted, including Prudhoe Bay, the North Slope contained 13 “oil” fields, brought on line at different times for different reasons. Some involve heavy oil, some light. And, some are, in fact, mainly gas. Geology is quite different too.
Permitting delays, Arctic ice conditions and intra-corporate relations played heavily into various field development plans as well. Then there is the requirement that the pipeline flow rate must be managed seasonally owing to a number of complex issues. So, once again, you’re mixing apples, bananas, lemons and grapes into a simplistic mathematical model. Why?
Doug
Most of the output was from one field, I don’t have all day so why not, This is no different than any area analysis done by Laherrere, there are no perfect models, when you find one you can present it here.
Don’t be sarcastic. I don’t think there are any perfect (or even fairly reliable) models. That’s my point.
Dennis,
And before you say it: I’m allowed to be sarcastic whereas you’re not: That’s because I’m probably twice your age (and half as smart). So there!
Doug.
Hi Doug,
I agree there are no perfect models.
Consider statistical mechanics, we often use the ideal gas law to get a rough idea of how a mixture of gases such as air will behave even though there are different molecules with a variety of kinetic and potential energies, but we don’t let that get in the way, the statistical behavior of the collection of molecules can be understood.
Ask your wife she knows infinitely more than me about the subject (just a BS in Physics for me.)
The statistics allow us to approximate the behavior of an oil field using a theoretical “average well”.
Dennis,
I’ve also been told (by a fairly reliable geo-character) that ConocoPhillips, the major player in the North Slope oil patch, who also own an oil refinery in Los Angeles, regularly schedule Alaskan shipments to optimize economies in their California petroleum marketing business. This may or may not be true but it does illustrate another potential complexity in any oil production analysis. The general public (which includes you and me) certainly wouldn’t be privy to this kind of stuff.
Doug
Hi Ron, thanks for the usefull updates this week. Just some remarks on the units, you should use for “barrels per day” simply “b/d”, and “b/d/w” for “barrels per day per well”. Regards.
Ron,
Or you can use barrels per day (BPD, BOPD, bbl/d, bpd, bd, or b/d). Little round yellow face here.
Doug
Doug, what really pisses me off is using the Roman Numeral “M” for thousand. Then “MM” for million. MM is two thousand in Roman Numerals. It is an adder not a multiplier. So they are using a “Modified Roman Numeral” for millions. Then they completely abandon Roman Numerals for billion and go to the metric system and use “G” for Giga and also use the metric “T” for Tera for trillion.
So they go from Roman Numerals to Modified Roman Numerals to Metric and again Metric for trillions. Why not just start with metric and stay with metric to be consistent?
re: M = 1,000. It’s not just oil – it also is used in the natural gas industry and in the boiler/heating business. When applying for a building gas service with PG&E, they ask for the various building gas equipment loads, in “MBH” which means “1000’s of BTU’s/Hour”. Of course, on the electric side of the same application, you use K for 1000’s of volts or amps.
But archaic, confusing ratings are everywhere, especially where the US and British industries established the standards. Heat output for steam radiators also may be in “MBH”. And steam boiler heat output may be rated in “horsepower” (an archaic rating of about how many HP of steam engine it could run), “MBH”, or even more archaic – “square feet of radiation” which relates to the number of square feet of steam radiator it could theoretically support.
And don’t get me started with US air conditioning and refrigeration equipment ratings. It’s “tons”, derived from how many tons (and I assume pound-based tons, not metric tons) of ice you’d have to melt in 24 hours to create equivalent cooling. Madness, I say.
I have been so beeiedwrld in the past but now it all makes sense!
AFAICT you’ve covered all the bases with this answer!
Taking the overwiev, this post hits the spot
Russia Dumps 20% Of Its Treasury Holdings As Mystery “Belgium” Buyer Adds Another Whopping $40 Billion
http://www.zerohedge.com/news/2014-05-15/russia-dumps-20-its-treasury-holdings-mystery-belgium-buyer-adds-another-whopping-40
Things are getting quite interesting in the FINANCIAL SIDE of the market. Furthermore, London announced they are going to exit the SILVER FIX market which they have been in for over 116 years. This after Deutsche Bank announced they were also getting out of the GOLD-SILVER FIX a few months ago.
So it looks like the BIG BANKS will exit the SILVER FIX on August 14, 2014. This will indeed be an interesting time. Spoke to some analysts yesterday. The Rochchild family who was apart of the GOLD-SILVER FIX got out about 6 years ago. I gather they saw the writing on the wall.
Folks… THARS a lot of headwinds coming all together at one time. PEAK OIL, DEATH of U.S. Treasuries & Dollar, and the End of the GOLD-SILVER FIX which has been one of the largest market rigging activities for quite some time.
This is GONNA be an interesting year.
steve
Interesting tweet?? Dave Collum @DavidBCollum 1h
Paul Craig Roberts weighs in on the waffleheads in Belgium buying $141 billion in treasuries http://usawatchdog.com/fed-laundering-treasury-purchases-in-belgium-to-disguise-whats-happening-paul-craig-roberts/ … Fed goes full criminal?
I admit not being familiar with gold/silver fix, and the businesses getting out of it. Does that mean gold and silver price will fluctuate freely to supply and demand after Aug. 14th.? Or something else?
Gold and silver fixing are very old, and are done twice a day by the market making member banks of the LBMA, which operates the wholesale market for large gold and silver bars.
You can find some interesting information here:
http://www.lbma.org.uk/faqs
Click on the tab statistics.
There is likely to be confusion in the silver market in the coming time. Prices will fluctuate quite a bit worldwide until a new solution can be found.
Gold is by far the more important market so expect LBMA gold fixing to continue. However there is suspicion that the big bullion banks have for a long time run an unallocated fractional reserve gold system to manage the market, and much of the gold has left their vaults and disappeared into Asia. If so it could be quite the scandal if there comes a time when they fail to deliver the gold.
Anyways the writing appears to be on the wall. For good or bad gold and silver are disappearing into private hoards and thereby the ability of the banks to control their prices is diminishing.
Saudi says “other members” can make up any shortfall in world oil production. He means other OPEC members except Saudi Arabia.
OPEC Will Need to Sharply Boost Oil Output, Says Energy Watchdog Behind a Wall Street Journal pay wall but available via Google.
The Organization of the Petroleum Exporting Countries will need to sharply boost its output in the second half of the year, an energy watchdog said Thursday, but the organization responded it can easily cover any new demand for its oil…
That expected level for the second half is 800,000 barrels a day higher that the 29.90 million barrels a day the IEA says OPEC produced in April, despite a rebound in Iraqi and Saudi production…
But Saudi oil minister Ali al-Naimi, whose country is the largest producer in OPEC, said any missing barrels could easily be replaced by other members. “I don’t know why you are all preoccupied with this issue…if crude is prevented from one place or another, the crude oil is fungible, it will move there,” said Mr. al-Naimi, also from the gathering in the Russian capital.
Well no, other members could not pull that off because they are all producing flat out. The only doubt about who was or who was not producing flat was Saudi Arabia. And now it looks like that question has been answered.
Of course Libya has rebel problems and Iran has sanctions. Peace could break out in Libya or Iranian sanctions could be lifted. Those are the only two ways OPEC could increase production very much.
Saudi ECI Ratio (Ratio of production to consumption) for 2002 to 2012 follows. Production = Total petroleum liquids + other liquids; Consumption = Total liquids, EIA.
Based on the 2005 to 2012 rate of decline in the Saudi ECI Ratio, I estimate that Saudi post-2005 Cumulative Net Exports (CNE) are on the order of 58 Gb, and they shipped about 21 Gb from 2006 to 2012 inclusive, suggesting that they may have already shipped about 36% of post-2005 CNE, in only seven years.
As I have occasionally noted, a similar estimate for post-1995 CNE for the Six Country Case History* (based on the seven year 1995 to 2002 rate of decline in their ECI Ratio) produced an estimate for Six Country post-1995 CNE that was too optimistic.
*Six major net oil exporters that hit or approached zero net exports from 1980 to 2010, excluding China
Based on the 2005 to 2012 rate of decline in OPEC’s ECI Ratio (ratio of production to consumption), I estimate that their combined post-2005 Cumulative Net Exports (CNE) are on the order of about 250 Gb, with about 70 Gb having been shipped from 2006 to 2012 inclusive, putting estimated OPEC post-2005 CNE at about 28% depleted in only seven years.
Iran’s export channel is Russian glee at undoing the sanctions, so that Caspian shoreline in north Iran beckons to dock tankers that will haul it north to Russian pipelines.
Of course Russia will need a % of the income, since they will be cutting their own production to keep the price from falling.
So, Iran output via sanction relaxation would not seem their optimal path. Best for them to do the deal with Russia, accelerate their nuclear program and smile and nod at all further negotiations.
I don’t believe the Russians will need to cut their production. Depletion is like rust and inflation- these things may nap occasionally but they never sleep.
Cut their own production to hold the price ?
They may have a hard enough time just maintaining production-but having the Iranian oil to supplement their own means they can probably supply their regular customers without too big a struggle to maintain their own output.
Most of us even here don’t seem to appreciate that Russia is a very old and mature producer and that the legacy Russian fields are probably getting to be pretty long in the tooth.
They have been mostly in Siberia for decades now. I guess their next stop is offshore way the hell up near the North Pole.
Dennis, thank you for the link to David Hughes’s pdf slides. I’ve been following his research, including his reports written for Post Carbon Institute. I hope he can update his study and publish a new report on shale gas/oil soon.
Hi PE,
The information in the slide show from last October is very different from his views in the Feb 2013 report from the Post Carbon Institute.
Possibly the April 2013 USGS Assessment of the Bakken/ Three Forks influenced his thinking.
A big change in his outlook on LTO (light tight oil) from February to October 2013.
The latest news is that rig counts in Permian have significantly increased:
http://www.eia.gov/todayinenergy/detail.cfm?id=16291
My HL analysis find that Permian may have 9.7 billion barrels of ultimately recoverable resources. So far 2.9 billion barrels have been produced.
The projected peak production takes place in August 2017, with a peak production level of 55.6 million barrels or 1.8 million barrels per day.
Interesting.
Laherrere estimates 40 Gb from the Permian.
“The Permian Basin has produced over 29 billion barrels of oil and 75 trillion cubic feet of gas and it is estimated by industry experts to contain recoverable oil and natural gas resources exceeding what has been produced over the last 90 years. Recent increased use of enhanced-recovery practices in the Permian Basin has produced a substantial impact on U.S. oil production.”
The quote above can be found at the link below:
http://www.rrc.state.tx.us/permianbasin/
Jean Laherrere estimates a URR of 40 Gb, but I think he included the 29 Gb already produced and perhaps you did not. If you add your 10 Gb to the 29 Gb already produced we get something close to Mr Laherrere’s estimate.
The RRC of TX claims that 58 Gb will be produced, so 18 Gb above Mr Laherrere’s estimates.
Also note that there were about 6 Gb of proved reserves in the Permian basin as of Dec 2012.
So Mr Laherrere’s analysis suggests another 5 Gb will be added to proved reserves over time.
I have not analyzed the Permian basin, though the long output history of the Permian basin allows a better HL analysis. The online data from the RRC only goes back to 1993, but you could pull data for 1993 to March and then subtract from 29 Gb to get an estimate for Dec 1992 cumulative production and then re do your HL the 29 Gb is through Dec 2013 (I think), so you could do the same thing with the DPR data and get a cumulative for Dec 2006 (I think DPR data starts in 2007) and then go from there. The different cumulative may make your HL match up with Laherrere’s analysis better.
I hope you find this graph interesting.
Breakeven ratio is defined as the ratio of “breakeven rig counts” over the actual rig counts. I calculate the breakeven rig counts by dividing what the EIA calls the “legacy production decline” by the new prodution per rig. The result tells how many rig counts would be needed to keep production constant.
If the breakeven ratio is above 100%, it says actual rig counts are less than the breakeven rig counts and total production will decline. If the breakeven ratio is less than 100%, production will rise.
In 2009, Eagle Ford, Permian, and Niobrara all have very high breakeven ratios, implying declines of production. In 2010, the breakeven ratios fell sharply in all four plays. That was the beginning of the shale oil boom.
Since 2011, the breakeven ratios have generally tended to rise in Eagle Ford. This is consistent with a possible early peak in Eagle Ford. The Bakken breakeven ratios rose from 2012 to 2013 but has since then stabilized. The Niobrara breakeven ratios were basically stable from 2012 to 2013 but seems to have started to rise in early 2014.
The HL trend for Niobrara has been basically flat (the trend of current to cumulative ratio from January 2013 to June 2014 has been only mildly negative), pointing to very large ultimately recoverable resources (6.4 billion barrels, only less than 500 million barrels have been produced).
The Permian breakeven ratio rose from 2012 to 2013 but started to turn down after late 2013. This means, at least for the moment, Permian is moving away from peak production. But unlike Bakken and Eagle Ford where rising production is primarily driven by rising rig productivity, the growth of production in Permian has been driven mainly by rising rig counts. From October 2013 to April 2014, total rig counts increased from 446 to 532 (an increase by 19%), but new production per rig only increased from 123 barrels per day to 129 barrels per day (an increase by 5%).
If there are 10,000 wells pumping 1 million barrels per day in the Williston Basin, not all Bakken formation wells, and the expectation is to have 40,000 wells when completed, should it not produce 4 million b/d?
The plateau would last a while, maybe 50 years with additional new wells added to compensate for wells that are shut.
The graph of million b/d will rise over time and level off when the well count equals 40,000, in 30 years from now, the a slow decline over the next 40 to 50 years back down to 1 million b/d when the average production would be 25 b/d per well. It will probably last longer than that based on the history of the basin.
That is probably how it will happen based on the 63 years of production since 1951. From 1951 to 1979, the total oil produced finally reach 1 billion.
Well count 40,000, barrel count will be 4,000,000 per day at 100 bpd average for wells. That production will probably last another 50 years or more.
Those curves on the graph depicting rapid decline rates are not correct.
Hi Ronald,
If there are no sweet spots and the entire Bakken has uniform well productivity, we can see what 40,000 wells would look like. The Peak would be 2032 at a C+C output of 1.7 to 1.8 million bpd and TRR from 1951 to 2073 would be 15 to 16 Gb. So no not 4 million barrels per day because the output from wells decline over time. Note that the USGS F5 estimate (95 % probability that TRR is less than this estimate) is 13 Gb, so this scenario shows that the F5 estimate is not very realistic if we assume 40,000 wells are drilled.
Also note that there are indeed sweet spots and when these run out of room for new wells, that the estimated ultimate recovery (EUR) of new wells will start to decrease. The scenario in the chart below is not realistic because it assumes no EUR decrease occurs. My purpose was to show that 4 million bpd is not ever going to be produced from the Bakken.
Just for kicks I did a simple model considering technically recoverable resources (TRR) for the USGS high (F5) case which is for about 13 Gb in the North Dakota Bakken.
This is found when we add oil produced through Dec 2012 (about 0.6 Gb) and proven reserves (about 3.3 Gb) to the USGS undiscovered TRR F5 case (9 Gb).
When reasonable economic assumptions are added (including the AEO 2014 reference oil price scenario) to find the economically recoverable resources(ERR) the output will be somewhat lower (probably about 10 to 11 Gb).
This case does not look very realistic to me, but I have been wrong in the past (guessing too low on future Bakken output) and may be wrong here as well. A TRR in the 7 to 11 Gb range is probably the best guess based on current information.
For a very narrow TRR estimate I like 8.5 Gb.
High TRR case (11 Gb) with a 6 % annual decrease in new well EUR (not the same as decline rate), the EUR is the cumulative output from a well over its life (usually assumed to be 30 years).
Low TRR (7 Gb), 18.5% annual rate of decrease in new well EUR,
peak in 2016 at 1070 kb/d
Medium TRR case (8.5 GB) with an annual rate of decrease in new well EUR of 12%,
peak in 2017 at 1100 kb/d.
I will show how this changes by adding in economic assumptions to find the economically recoverable resources (ERR) below.
Chart that follows is TRR=8.5 Gb case (no economics).
And finally the Medium case where ERR=7.6 Gb.
Everything is the same as the TRR=8.5 Gb above except that economic assumptions have been introduced so that when new wells become less profitable (around 2 million dollars (2013$) of profit per well or less) the rate of drilling decreases.
The slower rate of drilling reduces the rate of decrease in new well EUR so that gradually rising real oil prices allow this slower rate of drilling to remain profitable.
The rate of drilling slows from 150 wells per month to 18 wells per month over a 2 year period that starts in June 2022.
The 2014 AEO reference oil prices are used, well costs fall from 9 million to 6.5 million over a 3 year period starting in Jan 2013 and other economic assumptions are:
Annual Discount Rate= 7%
OPEX=$4/barrel
Transport Costs=$12/barrel
Royalties and taxes=24.5% of wellhead revenue
All calculations done in real dollars
These are so called “point forward” profitability calculations.
The peak year and output are unchanged (2017 and 1100 kb/d), but output falls more rapidly in 2022 due to the slowdown in drilling rate. Chart below.
If there are 10,000 wells pumping 1 million barrels per day in the Williston Basin, not all Bakken formation wells, and the expectation is to have 40,000 wells when completed, should it not produce 4 million b/d?
The plateau would last a while, maybe 50 years with additional new wells added to compensate for wells that are shut.
That scenario would happen if there were no such thing as decline for 50 years. Bakken wells, during their first year of production, decline about 6% per month.
Well count 40,000, barrel count will be 4,000,000 per day at 100 bpd average for wells. That production will probably last another 50 years or more.
Bakken barrels per well per day was 134 in November but now stands at 126 and dropping fast. Barrels per day per well for wells outside the Bakken now stands at 22.
According to Lynn Helms 119 new wells were added in December yet production still dropped 5%. If no new wells were added then the decline would likely have been 7% to 8%, which means that my estimate of a 6% decline for wells in their first year of production is a bit low.
Those curves on the graph depicting rapid decline rates are not correct.
The North Dakota Department of Mineral Resources would disagree with you. Their estimate of a typical Bakken decline curve is posted below.
There are good wells in the Bakken and some are very good, they raise the bpd per well average.
A fifty year old well that is in a small field has a monthly production of approximately 84 barrels these days.
Not much, but it must pay some to move the oil to be sold. There are other wells in the field, so it is just pumped out with the rest.
Less than 3 barrels per day, and the land owner/mineral owner still receives some royalties.
My point is there is oil there, hence, it will be developed as a production ‘zone’. It is going to be that way for a long time to come.
The paper on the Bakken Formation by Leigh Price estimated the amount of oil in the Bakken between 750 billion to 900 billion barrels of oil with the depocenter in the Williston Basin. The Middle Bakken Shale is 75 to 90 feet thick in the depocenter and there are wells out there that do produce oil in amounts that aren’t blockbusters. In the Baku region in Russia wells have been known to produce 80kbpd. I doubt the Bakken will produce wells of those kind, the gusher status, but there is oil and it will be pumped from the ground.
A 3 percent extraction will yield a total return of 27 billion barrels after a 40 to 50 year period. 3 years of production at 360 million barrels will be one billion. 1060 million barrels. A total decline rate of 50 percent will be in the range of a 27 billion barrel yield.
If one acre mined for oil produces 15 barrels per month, 1280 acres will have a monthly production of 15×1280=19200 barrels per for a well producing 600 plus barrels per day and they are out there.
It might take more time, but in the long haul, the oil will produce numbers greater than 1 million bpd. After some time, a 4 million bpd production just might occur.
I just don’t see a steep decline rate curve as a valid prediction.
It will be more of a gentle slope downward from left to right.
If Leigh Price’s work is correct, the Bakken is more or less an immature hydrocarbon system with plenty of natural gas as opposed to a mature system high in oil content and low amounts of natural gas. The Bakken Formation probably needs another 10,000 years for the kerogen to continue to bake more oil out of the building blocks, along with heat and pressure, it won’t stop making oil down there.
There are good wells in the Bakken and some are very good, they raise the bpd per well average.
There are wells that produce over 3000 barrels per day, (the first month), and wells that produce 10 barrels per day. I don’t think the state of North Dakota is lying about that. What I posted is what they reported. Bakken barrels per well per day was 134 in November but now stands at 126 and dropping fast. Barrels per day per well for wells outside the Bakken now stands at 22.
A fifty year old well that is in a small field has a monthly production of approximately 84 barrels these days.
What has that got to do with anything? We are talking about the Bakken here. The Bakken is far from being typical. It is very tight source rock that must be blown apart to produce anything. It has a decline rate of 6% per month the first year. That is not typical.
If one acre mined for oil produces 15 barrels per month, 1280 acres will have a monthly production of 15×1280=19200 barrels per for a well producing 600 plus barrels per day and they are out there.
Well hell, now you are talking about something else entirely. The Bakken cannot be mined, it is way too deep. The Bakken produces only from wells drilled very deep in fractured rock. For a well, to repay the very high cost of drilling and fracking, about 9 million dollars, must produce a lot of oil. Right now only wells in the sweet spots are making money. That is why most all the wells are being drilled there. They are, right now, cutting back on drilling in areas that have historically produced little oil.
I just don’t see a steep decline rate curve as a valid prediction.
It will be more of a gentle slope downward from left to right.
The decline curve I posted was produced by the North Dakota Department of Mineral Resources and it was the typical Bakken well.
Okay that was for one well not the entire field. But that is what the field decline curve would look like if they stopped drilling. Well that is if you believe the North Dakota Department of Mineral Resources and I do. They cannot drill 40,000 wells in those four counties. They have run out of space in those four counties for new wells and are now “down spacing”. That is drilling wells in between the wells already drilled. They are getting oil but not as much per well as they got before.
The EIA has the Bakken peaking in about 2016. I think they are overly optimistic.
Hi Ronald,
Oil 10,000 years from now is not of much help. The oil has to be produced quickly or it is not worth drilling the well, it costs 7.5 million to drill and frack the well, the oil companies do not do this for fun, they are trying to make money. There might be 27 Gb of oil that could be produced if the real price of oil was $1000/barrel (in 2013$), I haven’t tried to figure that out. I showed you what you get if the well productivity is uniform throughout the Bakken, its about 15 Gb. We could probably create a scenario where 27 Gb are produced, but it would need very heroic assumptions about oil price, and well productivity.
There are lots of oil resources, not all of them will be produced.
Bottom line 15 Gb is ridiculous, 27 Gb more so.
“Ronald Walter” is the name used in many a scam operation
http://www.scamwarners.com/forum/viewtopic.php?f=34&p=209615
Too bad that we have to waste time replying.
“The Bakken Formation probably needs another 10,000 years for the kerogen to continue to bake more oil out of the building blocks, along with heat and pressure, it won’t stop making oil down there.”
I don’t think so. The rock formation is the wrong kind. The Bakken formation consists of very dense shale where as conventional oil usually originates from Carbonate rock which are permeable. It would probably take half a billion years or more for that oil to migrate into layers of rock that are more permeable. The Oil trapped in the Bakken is much older than Oil from the Middle east or Texas. The Green river formation needs about 100M years to be ready for extraction.
http://en.wikipedia.org/wiki/Bakken_formation
The Bakken formation /ˈbɑːkən/ is a rock unit from the Late Devonian to Early Mississippian age [350-400 Million years ago. The KSA Ghawar field source rock is a mere 160 Million years old].
Apnaerptly this is what the esteemed Willis was talkin’ ’bout.