Bakken oil production was down 10,119 barrels per day in September and all North Dakota production was down 10,353 bpd in September.
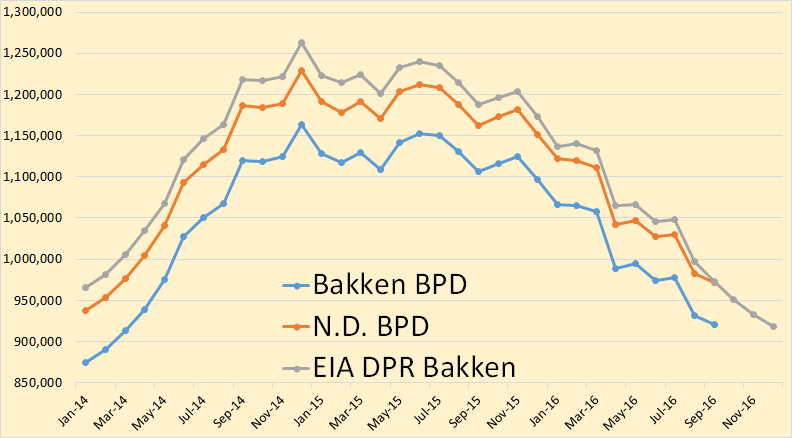
Bakken production continues to decline though I expect it to level off soon.
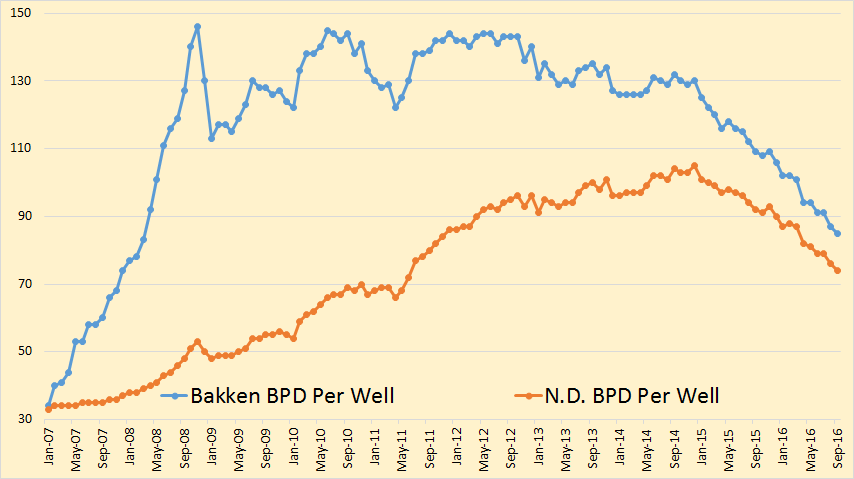
Barrels per day per well continue a steady decline. Bakken bpd per well fell 2 to 85 while all North Dakota bpd per well fell 2 to 74.
From the Director’s Cut
Oil Production
August 30,442,347 barrels = 982,011 barrels/day
September 29,149,737 barrels = 971,658 barrels/day (preliminary)
(all-time high was Dec 2014 at 1,227,483 barrels/day)
920,899 barrels per day or 95% from Bakken and Three Forks
50,759 barrels per day or 5% from legacy conventional pools
Producing Wells
August 13,295
September 13,367 (preliminary)(NEW all-time high)
Permitting
August 99 drilling and 1 seismic
September 63 drilling and 1 seismic
October 82 drilling and 1 seismic (all time high was 370 in 10/2012)
ND Sweet Crude Price
August $33.73/barrel
September $32.98/barrel
October $39.31/barrel
Today $34.75/barrel (all-time high was $136.29 7/3/2008)
Rig Count
August 32
September 34
October 33
Today’s rig count is 38 (all-time high was 218 on 5/29/2012)
Comments:
The drilling rig count increased two from August to September, then decreased one from September to October, and is currently up five from October to today. Operators are shifting from running the minimum number of rigs to incremental increases throughout 2017 as long as oil prices remain below $60/barrel WTI.
The number of well completions rose from 63(final) in August to 71(preliminary) in September. Oil price weakness is the primary reason for the slow-down and is now anticipated to last into the second quarter of 2017.
There was one significant precipitation event, 10 days with wind speeds in excess of 35 mph (too high for completion work), and no days with temperatures below -10F.
Over 98% of drilling now targets the Bakken and Three Forks formations.
Estimated wells waiting on completion2 is 861, down 27 from the end of August to the end of September. Estimated inactive well count3 is 1,514, unchanged from the end of August to the end of September.
Crude oil take away capacity remains dependent on rail deliveries to coastal refineries to remain adequate.
Low oil price associated with lifting of sanctions on Iran, a weak economy in China, and the Brexit are expected to lead to continued low drilling rig count. Utilization rate for rigs capable of 20,000+ feet is 25-30% and for shallow well rigs (7,000 feet or less) 1520%.
Drilling permit activity dropped sharply from August to September then increased from September to October. Operators are maintaining a permit inventory that will accommodate a return to the drilling price point within the next 12 months.
I Can See Clearly Now – Lessons Learned From Five Years Of Crude, Gas And NGL Forecasts
The Shale Revolution changed everything about U.S energy markets, and in the process made forecasting the production and pricing of crude oil, natural gas and NGLs a heck of a lot harder. But we all learn from experience…
Let’s begin, as we did in our 2013 blog series, with a look at crude oil production in the Bakken. When we look back to the mid-2011 forecast (by Bentek; left graph in Figure 1), crude output in western North Dakota and eastern Montana (green shaded area) had already risen sharply (to ~500 Mb/d in 2011 from ~200 Mb/d in 2007), and the forecast was that Bakken production would climb to ~900 Mb/d in 2016 (blue shaded area). By mid-2011, crude output already had exceeded the play’s pipeline takeaway capacity (black line), and planned pipeline capacity additions were not expected to relieve that constraint until early 2013. As a result, Bakken producers were already adding crude-by-rail (CBR) takeaway capacity (area between black and red lines; ~120 Mb/d as of 2011) as a solution to moving crude to market––and planning to add another 300 Mb/d of CBR capacity by 2013.
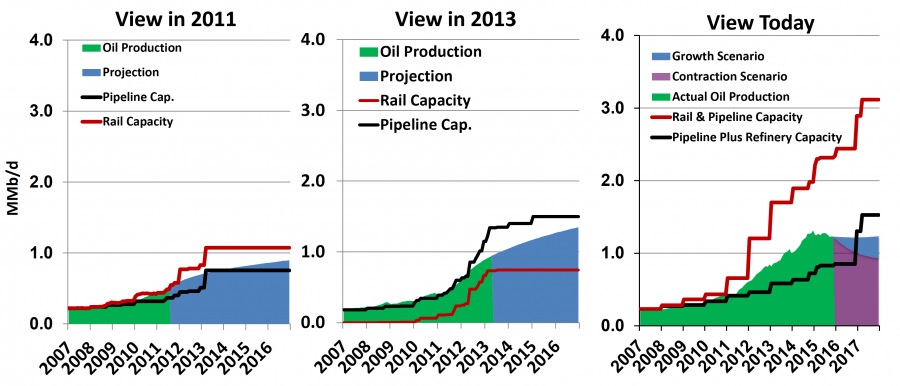
Go to the link to read the rest of this article. It is very interesting. As you can see they have the Bakken peaking in December 2014 with the yearly average peaking in 2015. Even their growth scenario levels out thru 2018 and their contraction scenario projects a continue decline.
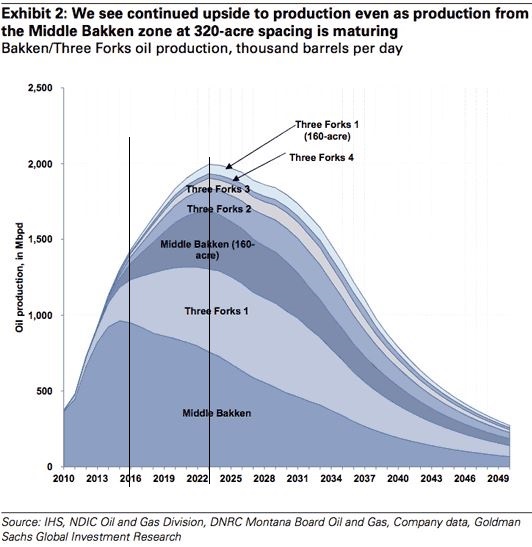
I did not save the link or date for this chart but I am pretty sure it dates from late 2013 or early 2014. They have the Bakken peaking at 2 million bpd in 2023. I inserted the lines to show their peak date and where we should be right now in 2016.. Predicting oil production is a fools game but I sometimes play the fool myself.
China’s Foreign Oil Dependency Nightmare Intensifies
China’s daily crude oil production in October fell to a more than seven-year low , data from the country’s statistics bureau showed on Monday. The development comes as global oil prices are still off from $115/barrel in mid-summer 2014 to now hovering in the mid $40s range amid record high global oil output and historically high oil inventory levels.
Low oil prices have forced China’s state-owned oil majors to trim oil exploration and production activities. Also, contributing to the country’s falling oil output are maturing oil fields and aging infrastructure. However, the scenario will likely remain unchanged until oil prices can find a floor and start trending upward again around $60/barrel giving oil companies an incentive to drill for more oil.
On a daily basis, October production was 3.78 million barrels per day (bpd), the lowest since May 2009, and down from 3.89 million bpd in September.
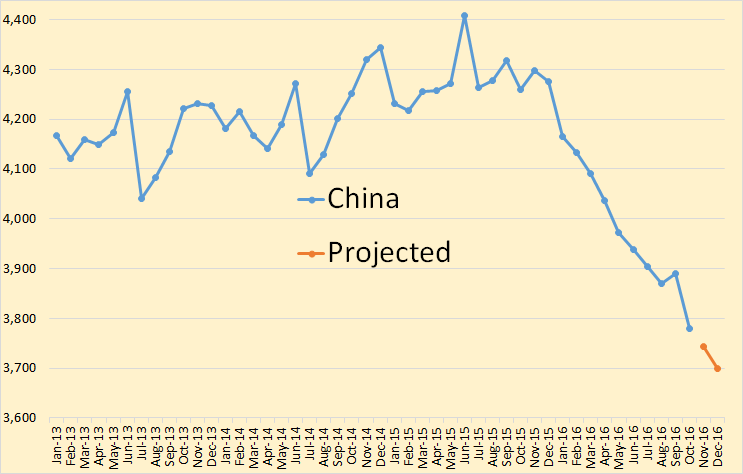
It looked like, in September, that China’s decline had abated. However their October production put them right back on the track projected by Seeking Alpha in August.
NOTE: The page OPEC Charts has been updated with production numbers for October. If you have comments on that data please post it below, on this post, rather than below that page.
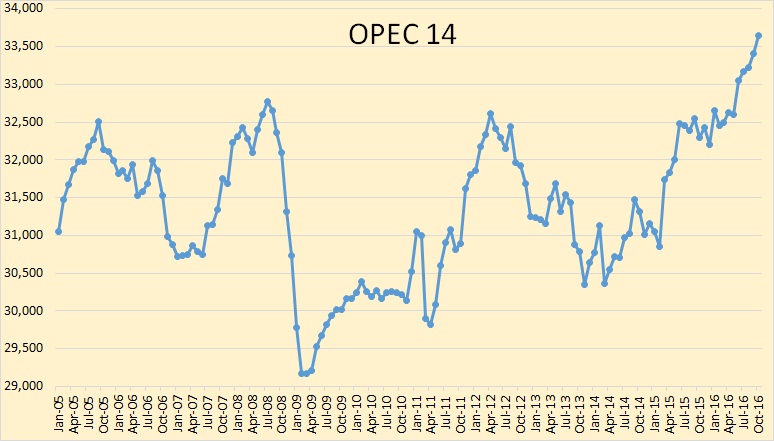
OPEC continues to increase production. How long this can continue I have no idea.
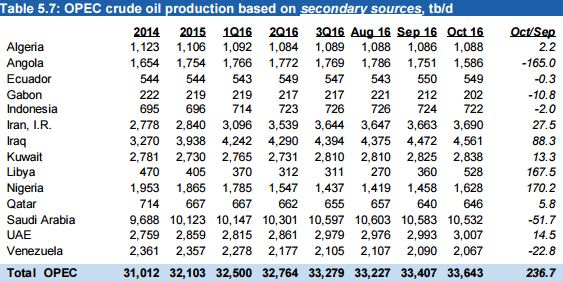
However exactly 100% of the increase this came from the recovery of Libya and Nigeria. Take away their numbers and OPEC production was flat.
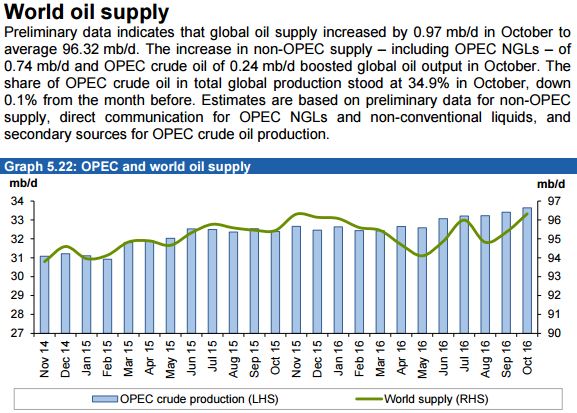
Total world oil supply sits at very near its peak in November 2015. The average for 2016 however is sill well below the average of 2015.
Just a sittin’ here, “riding the slide.”
So far, so good (for me).
😉
I wonder if there will be a sudden stop at the end????
Karl
Hey folks!
Long time no speak.
Quick question that I haven’t seen answered in the last few threads, has the world’s oil output plateaued or peaked yet?
I think the highest I’ve ever seen it is 95 Mb/d, but I admit I don’t recall exactly. Has the peak been hit as expected or has the maximum output increased further since I last paid careful attention?
Thanks!
And now I see that the answer to my question is in this very post so you can all ignore the dumb guy with his stupid question.
Sheesh! Read first, then ask question. Never fails to trip me up. It’s just that simple, but oh no, gotta jump ahead and ask the question first.
Sigh…
21% lower than peak production. Going down at -18% yoy. These are severe numbers. The Trump administration might expecience a rude awakening early 2017.
The new permit numbers will be interesting going forward. 63 new but 28 cancelled and 77 spuds so total open permits are starting to decline.
Bakken Scenario in chart below, 71 wells per month until mid 2017 then gradual increase of 1 well per month to Dec 2018 a more rapid increase of 5 wells per month until reaching 120 wells per month then continued until 2034 with a ramp down of 5 wells per month to zero by Jan 2036. Oil prices gradually rise to 130/b by Aug 2020 in 2016$.
New well EUR starts to gradually decrease in June 2017 and reaches a maximum annual rate of decrease of 4% per year in June 2018. New well EUR in Aug 2016 is 326 kb and is assumed to remain at that level until May 2017.
The problem in using a Hubbert curve is that it was developed for a conventional field, and not a tight oil field like the Bakken, and will have a very different decline curve.
It is also based on the EUR of the field, and it appears that the EUR to generate this curve is only about 10% of the expected EUR according to the EIA for the Bakken.
The Hubbert curve was generated based in full development. In the case of the Bakken drilling was cut by 75% in a very short time so a Hubbert curve will not be a good model for what is happening.
Correction. The Hubbert curve was not developed for anything but as a heuristic with interesting mathematical properties — i.e. Hubbert Linearization
The real physics of decline is described by such models as the Oil Shock model combined with hyperbolic or diffusional decline curves, of which Dennis Coyne has made good use of for describing the Bakken production.
Hi RDR,
A hubbert curve was not used for my scenario. I used the analysis that I first saw by Rune Likvern (the Red Queen series at the Oil Drum) and based on data shared by Enno Peters, developed a well profile based on the actual output data which suggests and average EUR of about 320 kb for the 2010-2015 North Dakota Bakken wells. It is assumed that all wells are average (to simplify the model) and I simply add up the output for all wells completed from 2005 to 2016. The model slightly underestimates output from June 2015 to Sept 2016. How many wells will be completed in the future is a guess, but there have been many estimates of both more wells than I have assumed and fewer wells. Much will depend on future oil prices which are difficult to predict.
If oil prices are higher than I have assumed, output may be higher (more wells may be completed than my scenario) and if oil prices are lower, output will be lower due to a lower completion rate.
In short, no Hubbert model was used for this analysis.
“a Hubbert curve will not be a good model for what is happening.” Apparently it does. It did so for almost 3 years now. And I am sure it will for at least the next couple of months.
Verwimp
I am still following your chart with interest.
As you said in September the data could change and go off course tomorrow, but so far we see … uncanny …
Spring / early summer could get interesting.
Light tight oil has not done a great deal for US economy so far it seems, hence perhaps the Trump administration.
Uncanny, indeed.
Every next datapoint is interesting. Especially during winters. 🙂
Hi Ron Patterson
What do you think about this article*?
*https://www.usgs.gov/news/usgs-estimates-20-billion-barrels-oil-texas-wolfcamp-shale-formation
Well it is shale so the fracking will continue… if the price is right.
thanks Ron, but its 20 GB?
Which was the estimeted of Bakken and Eagle ford at the begining? and what is now reserves?
Hi Caroline,
Bakken median TRR estimate was about 10 Gb for North Dakota Bakken Three Forks by USGS in April 2013.
Proved plus probable (2P) reserves were about 9 Gb at the end of 2014 if we assume probable reserves=proved*0.5. Also 1.2 Gb of oil had been produced at the end of 2014 so this would be a total of 10.2 Gb if all proved plus probable reserves are profitable to produce. Currently cumulative production to date is 1.9 Gb. Since Dec 2007 about 10,700 wells have been completed in the ND Bakken/Three Forks, if we assume the average EUR of those wells is 300 kb, that would be about 3.2 Gb. If we assume the average EUR of future wells is 250 kb, then 27,000 more wells would need to be completed in the future to extract 10 Gb of oil, a total of 37,700 wells completed.
In Drilling Deeper David Hughes estimates about 8 Gb for the Eagle Ford. At the end of 2014 there were about 5.2 Gb of proved reserves and likely 7.8 Gb of proved plus probable reserves in the Eagle ford.
So for the Big three plays this would be a TRR of 10+8+19=37 Gb, maybe another 10 Gb at most for other plays in the US for a total of 47 Gb, if oil prices are high enough ($130/b from 2020-2040). Low oil prices (under $60/b) would cut this estimate in half (possibly more.)
thanks Dennis
Sorry for my english, im from uruguay.
I undersatnd then wolfcamp how much production will have?
20GB not
How much?
How that camp change the usa peak oil, from 2016 Laherrere to.. 20…??
Hi Caroline,
I imagine the Permian Basin might be able to get to 2 Mb/d for a couple of years (maybe in 2021-2023), probably total US LTO would be no more than 4 Mb/d in the most optimistic scenario with high oil prices above $100/b and possibly in the 2020-2025 time frame. Then output will decline slowly over the next 5 to 10 years and more rapidly as Bakken and Eagle Ford run out of room in the sweet spots around 2030 or so. By 2040 total US LTO output will be under 1500 kb/d (possibly well under if oil prices start to fall as the World begins a transition to electric powered transportation).
Hola Caroline,
Su ingles es mucho mejor que mi espanol.
Still think there’s a high possibility of lower price for longer, and the longer, then the greater the switch to electric vehicles will impact on marginal demand, meaning lower for even longer, meaner less capital for exploration and development… und so weiter…. then there’s carbon pricing; which the civilised world will undertake whatever happens in the insane parts…
just saying’
How can the USGS determine that undiscovered resources are technically recoverable?
MattM,
It’s undiscovered within a defined, studied area where the geology is known.
Think of it as the Survey saying to the oil&NG industry “Here’s the geology. If there’s oil there could you get it out with current technology?”
I believe we have to look at the bigger picture in the tight oil plays. Each month the EIA reports on the four largest light tight oil plays in the drilling productivity report.
According to the EIA production for these four plays declined 111 kB/D in aprile 2016.
The decline in production in Sept was down to 60k B/D.
In the Oct report the decline for the month was down to 29 k B/D.
In the current report the decline fell to only 18k B/D.
At the current rate production in the four biggest plays will be growing production in another two to three months. All of this is happening with a rig count about 50% lower that its peak.
One of the reasons to look at these four plays as a group is that many companies have assets in more than one play and are able to shift from play to play based on the highest returns.
It should also be noted that the Permian has higher production from the tight zones than the Bakken and Eagle Ford combined.
These Bakken declines are pretty mild. Awaiting DC for new wells data.
The number of well completions rose from 63(final) in August to 71(preliminary) in September. Oil price weakness is the primary reason for the slow-down and is now anticipated to last into the second quarter of 2017.
Hi Watcher,
Enno Peters has his North Dakota Update for September up. His data says 73 new wells were completed in North Dakota in Sept 2016, probably 72 of these wells were Bakken/Three Forks wells, if we assume 98% of the 33 confidential wells are Bakken/Three Forks wells.
http://shaleprofile.com/index.php/2016/11/17/north-dakota-update-through-september-2016/
I had a look at the proven developed and undeveloped reserves for the major western IOCs and a couple of the larger independents as below. They don’t have as much undeveloped reserve to develop as I had thought, especially for conventional crude. There is only about 17Gb – typically that would only support about 2.3 to 2.8 mmbpd of production. At the moment the companies I looked at have about 2.9 mmbpd worth of projects under construction – they don’t have 100% ownership of all these, a lot is owned by NOCs, but once those projects come on line over the next few years there will be a big bit taken out of the undeveloped part (converted to developed), and that is still not including LTO drilling.
There will be some probable reserves that will be converted to proven, but over years 2013 to 2015 these weren’t that big even as prices were rising. Otherwise new reserves have to come from discoveries (evidently not going well) or purchase (also not that attractive with so many smaller companies loaded up on debt).
ExxonMobil and BP look in the best position (note BP don’t separate out Bitumen from crude so some of their undeveloped might be XXH in Alberta, if not I don’t know where it is; maybe Russia as part of Rosneft JV).
The rules for undeveloped booking include: “Undrilled locations can be classified as having undeveloped reserves only if a development plan has been adopted indicating that they are scheduled to be drilled within five years, unless the specific circumstances, justify a longer time.” However I think this is only really applied to LTO – most conventional projects of any size, especially offshore, have long schedules and their reserves are included no matter what the actual plans are (i.e. ‘justified’).
“ExxonMobil and BP look in the best position (note BP don’t separate out Bitumen from crude so some of their undeveloped might be XXH in Alberta, if not I don’t know where it is; maybe Russia as part of Rosneft JV).”
No, it’s not in Russia
Actually I could have checked better – they state:
“Total proved crude oil reserves held as part of our equity interest in Rosneft is 4,823 million barrels, comprising less than 1 million barrels in Vietnam and Canada, 26 million barrels in Venezuela and 4,797 million barrels in Russia.”
Of the 4,797 they have 1,981 undeveloped. There might be more details elsewhere but their report is about four times longer than anyone else’s so things can be hidden well.
They account a lot of reserves from Rosneft in Russia, but it’s not bitumen.
Probably, Rosneft reserves is Venezuela is bitumen (heavy oil).
Rosneft’s hydrocarbon liquids (oil, condensate, and NGL) reserves as of end 2015 were 24.7 bln bbl (audited by DeGolyer & MacNaughton using the SEC classification).
BP owns 19.75% interest in Rosneft, so BP’s share in Rosneft’s reserves is 4,878 million barrels.
The numbers I am using are rounded, but the result is close to BP’s number of 4,823 million barrels.
Rosneft reserves in Venezuela are mostly in the Petromonagas JV, but I wouldn’t call those “bitumen”. The reservoir produces 8.5 degrees API crude with a fairly decent GOR, and the wells produce using progressive capacity pumps. The best well produced about 2500 BOPD, full pump capacity. The oil is diluted to 18 degrees API and sent to an upgrader.
Rosneft also has several small properties with small reserves, producing medium grade crudes in one block and a 20 API blend from the other. They jv terms stink and they don’t get much for it. They are waiting for Maduro to be removed from power.
Are these numbers after Exxon’s recent write-downs?
Reserves are reported in companies’ annual fillings. So these are the numbers for the end-2015.
Exxon has recently warned that it may write down its reserves due to low oil prices.
The new estimate may appear in 2016 annual report.
A little off topic but still Oil related-
What do you fine folks make of this announcement?
http://www.businessinsider.com/usgs-estimates-20-billion-oil-barrels-in-texas-wolfcamp-shale-formation-2016-11
Game changer? Same old same old? Big nothing?
The USGS link doesn’t work for me so it’s difficult to assess. The key words might be “technical recoverable” in the title. I think they had Bakken at 11 Gb technical recoverable at one time, and that is not looking very likely. Their assessment method for Bakken was pretty simple – pick a well EUR, pick a well spacing, pick total acreage, pick a factor for dry holes – multiply a by c by d and divide by b. There’s a lot of unknowns in that. Still there is almost certainly a lot of oil there – don’t know the price needed for profitability though.
The link works for me.
And there is another one: https://pubs.er.usgs.gov/publication/fs20163092
Abstract:
Using a geology-based assessment methodology, the U.S. Geological Survey assessed technically recoverable mean resources of 20 billion barrels of oil and 16 trillion cubic feet of gas in the Wolfcamp shale in the Midland Basin part of the Permian Basin Province, Texas.
I am a petroleum Geologist drilling wells in the Wolfcamp, the USGS report means nothing. They periodically review basins to assess how much petroleum is there, we have been drilling Horizontal wells in the Wolfcamp for almost a decade, and vertical wells for many decades. Right now there are as many rigs running drilling this rock formation as there are in the rest of the country combined, so it is already baked in to the US production data. This is not like a Saudi Arabia field with a low drill and complete and development cost, it will take many billions of drilling capital to get a small percentage of the oil in place. The big deal is that the area is fairly resilient to low oil prices and will cushion the drop in US production due to lack of investment in other basins.
Thank you, JG ! Straight from the horses mouth, respectfully. The USGS lost all credibility with me as to estimating TRR in the Monterrey Shale in California. It baffles me, after five years of publically discussing unconventional shale oil resources, that modelers, internet analysts and predictors completely ignore economics, debt and finances. Extracting oil is a business; it must make money to succeed. If it does not succeed, all bets are off regarding predictions.
Hi Mike,
The Monterrey shale estimate was by the EIA not the USGS. The EIA had a private consultant do the analysis and it was mostly based on investor presentations, very little geological analysis.
It would be better if the USGS did an economic analysis as they do with coal for the Powder River Basin. They could develop a supply curve based on current costs, but they don’t.
Do you have any idea of the capital cost of the wells (ballpark guess) for a horizontal multifracked well in the Wolfcamp? Would $7 million be about right (a WAG by me)?
On ignoring economics, I show my oil price assumptions. Other financial assumptions for the Bakken are $8 million for capital cost of the well (2016$). OPEX=$9/b, other costs=$5/b, royalty and taxes=29% of gross revenue, $10/b transport cost, and a real discount rate of 7% (10% nominal discount rate assuming 3% inflation).
I do a DCF based on my assumed real oil price curve. Brent oil price rises to $77/b (2016$) by June 2017 and continue to rise at 17% per year until Oct 2020 when the oil price reaches $130/b, it is assumed that average oil prices remain at that level until Dec 2060. The last well is drilled in Dec 2035 and stops producing 25 years later in Dec 2060.
EUR of wells today is assumed to be 321 kb and EUR falls to 160 kb by 2035. The last well drilled only makes $243,000 over the 7% real rate of return, so the 9 Gb scenario is probably too optimistic, it is assumed that any gas sales are used to offset OPEX and other costs, though no natural gas price assumptions have been made to simplify the analysis.
This analysis is based on the analyses that Rune Likvern has done in the past, though his analyses are far superior to my own.
I think when seismic, land, surface and down hole equipment is included, the number is much higher.
With $20-60K per acre being paid, land definitely has to be factored in. Depending on spacing, $1-5 million per well?
Hi Shallow sand,
I am doing the analysis for the Bakken. A lot of the leases are already held and I don’t know that those were the prices paid. Give me a number for total capital cost that makes sense, are you suggesting $10.5 million per well, rather than $8 million? Not hard to do, but all the different assumptions you would like to change would be good so I don’t redo it 5 times.
Mostly I would like to clear up “the number”.
I threw out more than one number, OPEX, other costs, transport costs, royalties and taxes, real discount rate (adjusted for inflation), well cost.
I think you a re talking about well cost as “the number”. I include down hole costs as part of OPEX (think of it as OPEX plus maintenance maybe).
Dennis. The very high acreage numbers are for recent sales in the Permian Basin.
In reading company reports, it seems they state a cost to drill and case the hole, another to complete the well, then add the two for well cost.
This does not include costs incurred prior to the well being drilled, which are not insignificant. Nor does it include costs of down hole and surface equipment, which also are not insignificant.
Land costs are all over the map, and I think Bakken land costs overall are the lowest, because much of the leasing occurred prior to US shale production boom. I think a lot of acreage early on cost in the hundreds per acre. Of course, there was quite a bit of trading around since, so we have to look project by project, unfortunately. For purposes of a model, I think $8 million is probably in the ballpark.
I would not include equipment for the well, initially, as OPEX (LOE is what I prefer to stick with, being US based). The companies do not do that, those costs are included in depreciation, depletion and amortization expense.
Once the well is in production, and failures occur, I include the cost of repairs, including replacement equipment, in LOE. I am not sure that the companies do that, however.
I think the Permian is going to be much tougher to estimate, as there are different producing formations at different depths, whereas the Bakken primarily has two, and the Eagle Ford has 1 or 2.
An example:
QEP paid roughly $60,000 per acre for land in Martin Co., TX. If we assume one drilling unit is 1280 acres (two sections), how many two mile laterals will be drilled in the unit?
1280 acres x $60,000 = $76,800,000.
Assume 440′ spacing, 12 wells per unit.
$76,800,000/12 = $6,400,000 per well.
However, there are claims of up to 8 producing zones in the Permian.
So, 12 x 8 = 96 wells.
$76,800,000 / 96 = $800,000 per well.
Even assuming 96 wells, the cost per well is still significant.
If we assume 96 wells x $7 million to drill, complete and equip, total cost to develop is $.75 BILLION. That is a lot of money for one 1280 acre unit, need to recover a lot of oil and gas to get that to payout.
Hi Shallow sands,
I am neither an oil man nor an accountant, so regardless of what we call it I am assuming natural gas sales (maybe about $3/barrel on average) are used to offset the ongoing costs to operate the well (LOE, OPEX, financial costs, etc), we could add another million to the cost of the well for surface and downhole equipment and land costs. Does an average operating cost over the life of a well of about $17/b ($14/b plus natural gas sales of $3/b of oil produced)seem reasonable? That would be about $5.4 million spent on LOE etc. over the life of the well (assuming 320 kbo produced). Also does the 10% nominal rate of return sound high enough, what number would you use as a cutoff? You use a different method than a DCF and want the well to pay out in 60 months. This would correspond to about a 14% nominal rate of return and an 11% real rate of return (assuming a 3% annual inflation rate.)
“The Monterrey shale estimate was by the EIA not the USGS. The EIA had a private consultant do the analysis and it was mostly based on investor presentations, very little geological analysis.”
Exactly.
USGS’ estimate as of October 2015 is very conservative:
“The Monterey Formation in the deepest parts of California’s San Joaquin Basin contains an estimated mean volumes of 21 million barrels of oil, 27 billion cubic feet of gas, and 1 million barrels of natural gas liquids, according to the first USGS assessment of continuous (unconventional), technically recoverable resources in the Monterey Formation.”
“The volume estimated in the new study is small, compared to previous USGS estimates of conventionally trapped recoverable oil in the Monterey Formation in the San Joaquin Basin. Those earlier estimates were for oil that could come either from producing more Monterey oil from existing fields, or from discovering new conventional resources in the Monterey Formation.”
Previous USGS estimates were for conventional oil:
“In 2003, USGS conducted an assessment of conventional oil and gas in the San Joaquin Basin, estimating a mean of 121 million barrels of oil recoverable from the Monterey. In addition, in 2012, USGS assessed the potential volume of oil that could be added to reserves in the San Joaquin Basin from increasing recovery in existing fields. The results of that study suggested that a mean of about 3 billion barrels of oil might eventually be added to reserves from Monterey reservoirs in conventional traps, mostly from a type of rock in the Monterey called diatomite, which has recently been producing over 20 million barrels of oil per year.”
https://www.usgs.gov/news/usgs-estimates-21-million-barrels-oil-and-27-billion-cubic-feet-gas-monterey-formation-san
I am corrected, RE; USGS and Monterrey. I still don’t believe there is 20G BO in the Wolfcamp. Most increases in PB DUC’s are not wells awaiting frac’s but lower Wolfcamp wells that are TA and awaiting re-drills; that should tell you something. With acreage, infrastructure and water costs in W. Texas, wells cost $8.5-9.0M each. The shale industry won’t admit that, but that’s what I think. What happens to EUR’s and oil prices after April of 2017 is a guess and a waste of time, sorry.
Hi JG,
What is the average cost of drilling and completion (including fracking) for a horizontal Wolfcamp well?
Does the F95 estimate of 11 Gb seem reasonable if oil prices go up to over $80/b (2016 $) and remain above that level on average from 2018 to 2025?
What most interests me are suggestions that there is so much available oil in Wolfcamp and what that will do to oil prices and national policy.
Seems like any announcement of more oil will likely keep prices low. And if they stay low, there’s little reason to open up more areas for oil drilling.
“Their assessment method for Bakken was pretty simple – pick a well EUR, pick a well spacing, pick total acreage, pick a factor for dry holes – multiply a by c by d and divide by b.”
The EIA and others use the same methodology
USGS estimates for average well EUR in Wolfcamp shale look reasonable: 167,ooo barrels in the core areas and much lower in other parts of the formation.
I do not know if the estimated potential production area is too big, or assumed well spacing is too tight.
The key question is what part of these estimated technically recoverable resources are economically viable at $50; $60; $70; $80; $90, $100, etc.
Significant part of resources may never be developed, even if they are technically recoverable.
Keep in mind these USGS estimates are for undiscovered TRR, one needs to add proved reserves times 1.5 to get 2 P reserves and that should be added to UTRR to get TRR. There are roughly 3 Gb of 2P reserves that have been added to Permian reserves since 2011, if we assume most of these are from the Wolfcamp shale (not known) then the TRR would be about 23 Gb. Note that total proved plus probable reserves at the end of 2014 in the Permian was 10.5 Gb (7 Gb proved plus 3.5 GB probable with the assumption that probable=proved/2). I have assumed about 30% of total Permian 2P reserves is in the Wolfcamp shale. That is a WAG.
Note the median estimate is a UTRR of 19 Gb with F95=11.4 Gb and F5=31.4 Gb. So a conservative guess would be a TRR of 13.4 Gb= proved reserves plus F95 estimate. If prices go to $85/b and remain at that level the F95 estimate may become ERR, at $100/b maybe the median is potentially ERR. It will depend how long prices can remain at $100/b before an economic crash, prices are Brent Crude price in 2016$ with various crude spreads assumed to be about where they are now.
Dennis,
where your number for proven reserves in the Permian comes from?
In November 2015, the EIA estimated proven reserves of tight oil in Wolfcamp and Bone Spring formations as of end 2014 at just 722 million barrels.
http://www.eia.gov/naturalgas/crudeoilreserves/
US proved reserves of LTO
Hi Alex S,
I just looked at Permian Basin crude reserves (Districts 7C, 8 and 8A) and assumed the change in reserves from 2011 to 2014 was from the Wolfcamp. I didn’t know about that page for reserves. It is surprising it is that low.
In any case the difference is small relative to the UTRR, it will be interesting to see what the reserves are for year end 2015.
Based on this I would revise my estimate to 20 Gb for URR with a conservative estimate of 12 Gb until we have the data for year end 2015 to be released later this month.
My guess is that the USGS probably already has the 2015 year end reserve data.
Dennis,
The EIA proved reserves estimate for 2015 will be issued this month. I think we will see a significant increase in the number for the Permian basin LTO.
Also note that USGS TRR estimate is only for Wolfcamp.
I can only guess what could be their estimate for the whole Permian tight oil reserves.
But the share of Wolfcamp in the Permian LTO output is only 24% (according to the EIA/DrillingInfo report).
Hi Alex S,
http://www.beg.utexas.edu/resprog/permianbasin/index.htm
At link above they say Permian basin has 30 Gb of oil, so if both estimates are correct the Wolfcamp has 2/3 of remaining resources.
Dennis,
Wolfcamp is a newer play than Bone Spring and Spraberry. That’s why its share in the Permian LTO production is less than in TRR.
Hi AlexS,
That makes sense. I also imagine the USGS focused on the formation with the bulk of the remaining resources. It is conceivable that the 30 Gb estimate is closer to the remaining oil in place and that more like 90% of the TRR is in the Wolfcamp, considering that the F5 estimate is about 30 Gb. That older study from 2005 may be an under estimate of TRR for the Permian, likewise the USGS might have overestimated the UTRR.
AlexS. Another key question, which is price dependent, is how many years will it take to fully develop the reserves?
Hi Shallow sand,
If oil prices go back to $100/b in 2018 as the IEA seems to be concerned about, it could ramp up at the speed of the Eagle Ford (say 2 to 3 years). It will be oil price dependent and perhaps they won’t over do it like in 2011-2014, but who knows, some people don’t learn from past mistakes. If you or Mike were running things it would be done right, but the LTO guys, I don’t know.
shallow sand,
Yes, you are correct. And there are multiple potential production scenarios, depending on the oil prices.
From the USGS press release.
USGS Estimates 20 Billion Barrels of Oil in Texas’ Wolfcamp Shale Formation
“This estimate is for continuous (unconventional) oil, and consists of undiscovered, technically recoverable resources. …
Undiscovered resources are those that are estimated to exist based on geologic knowledge and theory, while technically recoverable resources are those that can be produced using currently available technology and industry practices. Whether or not it is profitable to produce these resources has not been evaluated.”
This is an important way to assess.
If it requires slave labor at gunpoint to get the oil out, then that’s what will happen because you MUST have oil, and a day will soon come when that sort of thing is reqd.
Nice apocalyptic vision of the future you’ve got there!
Whatever happened to the ideals of democracy, capitalism, business, profits, free markets etc…? Don’t worry, no need to answer, that was purely a rhetorical question. I’m quite aware of the realities of the world!
However, not to pour too much sand on your vision, But I have to wonder? Since your potential slaves in 21st century America are already armed to the teeth, they might decide not to just go with the flow. (pun intended) 🙂
Anyways slaves don’t buy cars or too many consumer goods so that might, in and of itself, put a bit of a damper on the raison d’etre, excuse my french, of the oil companies and the very existence of these future slave owners.
because you MUST have oil
Really now?! You know, as time goes by, I’m less and less convinced of that!
Cheers!
This is the mistake most peak-oilers make: thinking that oil is indispensible. You don’t need oil. At some point, it’s cheaper just to carry around some batteries and solar panels.
This follows on from reserve post above (two a couple of comments). In terms of changes over the last three years – there really weren’t anything much dramatic. We’ll see what 2016 brings, especially for ExxonMobil, but it looks like they already knocked a big chunk off of their Bitumen numbers already in 2015.
Note I went through a lot of 20-F and 10-K reports watching the rain fall this morning and copied out the numbers, I’m not guaranteeing I got everything 100%, but I think the general trends are shown.
Note the figures are totals for all nine companies I looked at.
Hmm. C&C reserves are dropping. Bitumen & synthetic reseves dropped, then went up a bit, but will probably drop again.
NG reserves are actually on an upward trend, which is quite different. And this is still in a low-NG-price environment.
IEA WEO is out: http://www.iea.org/newsroom/news/2016/november/world-energy-outlook-2016.html presentation slides, fact sheet and summary are available online (report can be purchased). IEA seems to be _very_ concerned about underinvestment in upstream oil production. Several pages of the report is devoted to this, the title of that section is “mind the gap”. More or less all of the content has been discussed on this website, including the issue with high levels of debt and that this can affect suppliers’ capacity to rebound, and how much demand can be reduced as a result of a stringent carbon cap.
From the fact sheet (available free of charge):
“Another year of low upstream oil investment in 2017 would risk a shortfall in oil production in a few years’ time. The conventional crude oil resources (e.g. excluding tight oil and oil sands) approved for development in 2015 sank to the lowest level since the 1950s, with no sign of a rebound in 2016. If there is no pick-up in 2017, then it becomes increasingly unlikely that demand (as projected in our main scenario) and supply can be matched in the early 2020s without the start of a new boom/bust cycle for the industry”
Presentation 1:09 – Dr. Birol gives his view: “depletion never sleeps”…
I wonder who that paragraph is aimed at. As I indicated above the companies that would be investing in long term conventional projects don’t have a very large inventory of undeveloped reserves (17 Gb as of end of 2015, some of this has gone already this year and more is in development and will come on stream in 2017 and 2018 (and a small amount in later years for approved projects). I’d guess there might only be less than 10 Gb (and this the most expensive to develop) that is currently under appraisal among the major western IOCs and larger independents; allowing for their partnerships with NOCs in a lot of the available projects that could represent 20 to 30 Gb total. That really isn’t very much new supply available, and a large proportion is in complex deep water projects that wouldn’t be ramped up fully until 6 to 7 years after FID (i.e. already too late for 2020). Really the main players need to find new fields with easy developments, but they obviously aren’t, probably never will, and actually aren’t looking very hard at the moment.
My interpretation is that this is IEAs way of saying that it does not look good. Those who can read between the lines get the message. Also, a few years from they will be able to say “see we told you so”.
It’s impossible for IEA to make statements like: “the end of low cost oil will negatively affect economic growth”, “geology is about to beat human ingenuity” etc.
WEO have become more and more bizarre over the years. On the one hand they contain quantitative projections which tell the story politicians wants to hear. On the other hand, the text describes all sorts of reason of why the assumptions are unlikely to hold. Normally, if you don’t believe in your own assumptions you would change them.
Hi,
Here are my updates as usual. GOR declined or stayed flat for all years except 2010 in September. Is it the beginning of a new trend?
Here is the production graph. Not that much has happened. There was a big drop for 2011. 2009 on the other hand saw an increase. Up to the left, which is very hard to see, 2015 continues to follow 2014 which follows 2013 which follows 2012. Will we see 2013 reach 2007 the next few months?
Freddy, these latest years, the IP months are chopped at the top. Any chance of showing those?
The motivation would be to get a look at the alleged spectacular technology advances in the past, oh, 2 yrs.
Its on purpose both because I wanted to zoom in and because the data for first 18 months or so for the method I used above is not very usable. Bellow is the production profile which is better for seeing differences the first 18 months. Above graph is roughly 6 months ahead of the production profile graph.
Excellent.
And I guess we can all see no technological breakthru. 2014’s green line looks superior to first 3 mos 2015.
2016 looks like it declines to the same level about 2.5 mos later, but is clearly a steeper decline at that point and is likely going to intersect 2014’s line probably within the year.
There is zero evidence on that compilation of any technological breakthrough surging output per well in the past 2-3 yrs.
In fact, they damn near all overlay within 2 yrs. No way in hell there is any spectacular EUR improvement.
And . . . in the context of the moment, nope, no evidence of techno breakthrough. But also no evidence of sweetspots first.
I suppose you could contort conclusions and say . . . Yes, the sweetspots were first — with inferior technology, and then as they became less sweet the technological breakthroughs brought output up to look the same.
Too
Much
Coincidence.
It’s all bogus.
clarifying, the techno breakthrus are bogus. They would show in that data if they were real.
And it would be far too much coincidence for techno breakthrus to just happen to increase flow the exact amount lost from exhausting sweet spots.
This suggests the sweetspot theory is also bogus, unless there are 9 years of them, meaning it’s ALL been sweetspots so far. 9 yrs of sweetspots might as well be called just normal rather than sweet.
It is pretty much all bogus, yes, Watcher. With any rudimentary understanding of volumetric calculations of OOIP in a dense shale like the Bakken, there is only X BO along the horizontal lateral that might be “obtained” from stimulation. More sand along a longer lateral does not necessarily translate into greater frac growth (an increase in the radius around the horizontal lateral). Novices in frac technology believe in halo effects, or that more sand equates to higher UR of OOIP per acre foot of exposed reservoir. That is not the case; longer laterals simply expose more acre feet of shale that can be recovered. Recovery factors in shale per acre foot will never exceed 5-6%, IMO, short of any breakthroughs in EOR technology. That will take much higher oil prices.
Its very simple, actually… bigger fracs (that cost lots more money!!) over longer laterals result in higher IP’s and higher ensuing 90 day production results. That generates more cash flow (imperative at the moment) and allows for higher EUR’s that translate into bigger booked reserve assets. More assets means the shale oil industry can borrow more money against those assets. Its a game, and a very obvious one at that. Nobody is breaking new ground or making big strides in greater UR. That’s internet dribble. Freddy is right; everyone in the shale biz is pounding their sweet spots, high grading as they call it, and higher GOR’s are a sure sign of depletion. Moving off those sweet spots into flank areas will be even less economical (if that is possible) and will result in significantly less UR per well. That is what is ridiculous about modeling the future based on X wells per month and trying to determine how much unconventional shale oil can be produced in the US thru 2035. The term, “past performance is not indicative of future results?” We invented that phrase 120 years ago in the oil business.
That, sir, is pretty much the point. I see what looks like about 20% IP increase for the extra stages post 2008/9/10. How could there not be going from 15 stages to 30+?
I see NO magic post peak. They all descend exactly the same way and by 18-20 months every drill year is lined up. That’s actually astounding — given 15 vs 30 stages. There should be more volume draining on day 1 and year 2, but the flow is the same at month 20+ for all drill years. This should kill the profitability on those later wells because 30 stages must cost more.
But profit is not required when you MUST have oil.
You know, that is absolutely insane.
Freddy, is there something going on in the data? How can 30 stage long laterals flow the same at production month 24 as the earlier dated wells at their production month 24 –whose lengths of well were MUCH shorter?
I can only speculate why the curves look like they do. It could be that the newer wells would have produced more than the older wells, but closer well spacing is causing the UR to go down.
I hereby nominate Mike for Dept of Energy Co-Secretary to be served concurrently with Dept of Energy Co-Secretary Harold Hamm.
Thank you, John; but I respectfully refuse. Harold and I don’t see eye to eye on what is best for the American oil industry and besides, the BBQ sucks in DC.
So, Mike, the conclusion is that the frackers are depleting the wells faster (getting more out now, but less later) in order to get cash flow now rather than later?
This matches the scam-the-investors business model which they’ve been using all along, so it doesn’t surprise me. Nice to see confirmation.
Here is the updated yearly decline rate graph. 2010 has seen increased decline rates as I suspected. The curves are currently gathering in the 15%-20% range.
Hi FreddyW,
What is the annual decline rate of the 2007 wells from month 98 to month 117 and how many wells in that sample (it may be too low to tell us much)?
2007 only has 161 wells. So it makes the production curve a bit noisy as you can see above. Current yearly decline rate for 2007 is 7,2% and the average from month 98 to 117 would translate to a 10,3% yearly decline rate. The 2007 curve look quite different from the other curves, so thats why I did not include it.
Hi Freddy W,
Thanks. The 2008 wells were probably refracked so that curve is messed up. If we ignore 2008, 2007 looks fairly similar to the other curves (if we consider the smoothed slope.) I guess one way to do it would be to look at the natural log of monthly output vs month for each year and see where the curve starts to become straight indicating exponential decline. The decline rates of many of the curves look similar through about month 80 (2007, 2009, 2010, 2011) after 2011 (2012, 2013, 2014) decline rates look steeper, maybe poor well quality or super fracking (more frack stages and more proppant) has changed the shape of the decline curve. The shape is definitely different, I am speculating about the possible cause.
2007 had much lower initial production and the long late plateau gives it a low decline rate also. But yes, initial decline rates look similar to the other curves. If you look at the individual 2007 wells then you can see that some of them have similar increases to production as the 2008 wells had during 2014. I have not investigated this in detail, but it could be that those increases are fewer and distributed over a longer time span than 2008 and it is what has caused the plateau. If that is the case, then 2007 may not be different from the others at and we will see increased decline rates in the future.
Regarding natural log plots. Yes it could be good if you want to find a constant exponential decline. But we are not there yet as you can see in above graph.
One good reason why decline rates are increasing is because of the GOR increase. When they pump up the oil so fast that GOR is increasing, then it’s expected that there are some production increases first but higher decline rates later. Perhaps completion techniques have something to do with it also. Well spacing is getting closer and closer also and is definitely close enough in some areas to cause reductions in UR. But I would expect lower inital production rather than higher decline rates from that. But maybe I´m wrong.
Hi FreddyW,
Do you have an estimate of the number of wells completed in North Dakota in September? Does the 71 wells completed estimate by Helms seem correct?
Hi FreddyW,
Ok Enno’s data from NDIC shows 73 well completions in North Dakota in Sept 2016, 33 were confidential wells, if we assume 98% of those were Bakken/TF wells that would be 72 ND Bakken/TF wells completed in Sept 2016.
I have 75 in my data, so about the same. They have increased the number of new wells quite alot the last two months. It looks like the addtional ones mainly comes from the DUC backlog as it increased withouth the rig count going up. But I see that the rig count has gone up now too.
I can’t get any information out of that graph, other than that GOR goes up for every Bakken well over time. Is there a presentation which would make it clearer what you were trying to show?
Not sure if there exists any presentation. But here is a paper on GOR in unconventional reservoirs:
http://petroleum.mines.edu/research/urep/thesis/2.Tuba%20Firincioglu%20PhD%20Dissertation%20Final.pdf
I’ve worked with the author (Tuba Firincioglu), she consulted on a project I was supervising, and she’s a jet plane in this field.
The two subjects are a bit unrelated. Gas to oil ratio goes up because gas comes out of solution as pressure drops, and the gas has lower viscosity.
Tuba’s work was focused on the difference between the lab measured oil-gas mixture performance and what happens in the reservoir, where the fluids are in tiny pores.
The bottom line is that laboratory measurements should be modified to account for rock permeability and pore size/type, fluid viscosity, and the system dynamics (this means in some cases it’s better to pull the wells as hard as possible, which is contrary to conventional wisdom).
One more GOR graph which shows how the distribution has changed over time. The first date is Jan. 2014 just before the price drop and when GOR started to increase significantly. You can see a general movement from lower GOR to higher GOR over time.
Freddy: it’s possible the high GOR wells are hard to produce, and this sets a limit on the overall population GOR. On the other hand it may be a glitch.
I’ve had really bad experience trying to pump high GOR wells, put in smaller tubing and gas lift mandrels, but this only helps if they made over say 50% water. A low water cut high GOR well either flows on its own or it becomes an incredible pain in the butt, with low rates and a lot of slugging.
Ron you say ” Bakken production continues to decline though I expect it to level off soon.”
A few words of wisdom as to the main reasons why it would level off? Price rise?
Hi Pete,
Even though you asked Ron. He might think that the decline in the number of new wells per month may have stabilized at around 71 new wells per month. If that rate of new completions per month stays the same there will still be decline but the rate of decline will be slower. Scenario below shows what would happen with 71 new wells per month from Sept 2016 to June 2017 and then a 1 well per month increase from July 2017 to Dec 2018 (89 new wells per month in Dec 2018).
I am not so convinced that either Texas or the Bakken is finished declining at the current level of completions. There was consistent completions of over 1000 wells in Texas until about October of 2015. Then it dropped to less than half of that. The number of producing wells in Texas peaked in June of this year. Since then, through October, it has decreased by roughly 1000 wells a month. The Texas RRC reports are indicating that they are still plugging more than they are completing.
I remember reading one projection recently for what wells will be doing over time in the Eagle Ford. They ran those projections for a well for over 22 years. Not sure which planet we are talking about, but in Texas an Eagle Ford does well to survive 6 years. They keep referring to an Eagle Ford producing half of what they will in the first two years. In most areas, I would say that it is half in the first year.
The EIA, IEA, Opec, and most pundits have the US shale drilling turning on a dime when the oil price reaches a certain level. If it was at a hundred now, it would still take about two years to significantly increase production, if it ever happens. I am not a big believer that US shale is the new spigot for supply.
Hi Guy,
The wells being shut in are not nearly as important as the number of wells completed because the output volume is so different. So the average well in the Eagle Ford in its second month of production produces about 370 b/d, but the average well at 68 months was producing 10 b/d. So about 37 average wells need to be shut in to offset one average new well completion.
Point is that total well counts are not so important, it is well completions that drive output higher.
Output is falling because fewer wells are being completed. When oil prices rise and profits increase, completions per month will increase and slow the decline rate and eventually raise output if completions are high enough. For the Bakken at an output level of 863 kb/d in Dec 2017 about 79 new wells per month is enough to cause a slight increase in output. My model slightly underestimates Bakken output, for Sept 2016 my model has output at 890 kb/d, about 30 kb/d lower than actual output (3% too low), my well profile may be slightly too low, but I expect eventually new well EUR will start to decrease and my model will start to match actual output better by mid 2017 as sweet spots run out of room for new wells.
Guess I will remember that for the future. The number of producing wells is not important. Kinda like I got pooh poohed when I said the production would drop to over 1 million barrels back in early 2015.
Hi Guy,
Do you agree that the shut in wells tend to be low output wells? So if I shut down 37 of those but complete one well the net change in output is zero.
Likewise if I complete 1000 wells in a year, I could shut down 20,000 stripper wells and the net change in output would be zero, but there would be 19,000 fewer producing wells, if we assume the average output of the 1000 new wells completed was 200 b/d for the year and the stripper wells produced 10 b/d on average.
How much do you expect output to fall in the US by Dec 2017?
Hindsight is 20/20 and lots of people can make lucky guesses. Output did indeed fall by about 1 million barrels per day from April 2015 to July 2016, can you point me to your comment where you predicted this?
Tell us what it will be in August 2017.
I expected the fall in supply would lead to higher prices, I did not expect World output to be as resilient as it has been and I also did not realize how oversupplied the market was in April 2015. In Jan 2015 I expected output would decrease and it increased by 250 kb/d from Jan to April, so I was too pessimistic, from Jan 2015 (which is early 2015) to August 2016 US output has decreased by 635 kb/d.
If you were suggesting World output would fall from Jan 2015 levels by 1 Mb/d, you would also have been incorrect as World C+C output has increased from Feb 2015 to July 2016 by 400 kb/d. If we consider 12 month average output of World C+C, the decline has been 340 kb/d from the 12 month average peak in August 2015 (centered 12 month average).
The dropping numbers are not as much from the wells that produce less than 10 barrels a day, but from those producing greater than 10, but less than 100. The ones producing greater than 100 are remaining at a consistent level over 9000 to 9500. The prediction on one million was as to the US shale only. It is your site, you can search it better than I can,
But then don’t take my word for it. You can find the same information under the Texas RRC site under oil and gas/research and statistics/well distribution tables. Current production for Sep can be found at online research queries/statewide. It is still dropping, and will long term at the current activity level. Production drop for oil, only, is a little over 40k per day barrels, and condensate is lower for September. Proofs in the pudding.
My guess is that you would see a lot more plugging reports, if it were not so expensive to plug a well. At net income levels where they are, I expect they would put that off as long as they could.
Hi Guy,
The Texas data is incomplete. Dean Fantazzini’s estimates are much better than EIA or RRC estimates for the most recent 24 months. Texas C+C is down about 300 kb/d from the peak, Bakken down about 250 kb/d for a total of maybe 600 kb/d for US LTO output. If oil prices remain low your 1 Mb/d estimate might be correct within the next 12 months, in the long term LTO output will fall by much more than 1 Mb/d, but probably not until 2025 to 2030.
Dennis
“Dean Fantazzini’s estimates are much better than EIA or RRC estimates for the most recent 24 months. ”
The credibility of Dean’s methods and calculations has been discussed at length in many prior posts. Many of us believe he has been applying historical correction factors to a data collection system which has changed. As a result his corrected numbers are not accurate. You can believe in them if you want to, but I believe the EIA numbers are much more accurate.
Hi dclonghorn,
The “6 month” estimate uses a correction factor based on the last 6 months of RRC data.
You can believe what you wish of course, time will tell us if Dean’s estimates are better. The EIA estimates are certainly better than the RRC incomplete data, the EIA estimates will be revised upwards eventually.
I guess we will have to wait to see who spits further.
Statistics for North Dakota and the Bakken oil production are perfect, but not for well completions.
From the Director’s Cut:
“The number of well completions rose from 63(final) in August to 71(preliminary) in September”
(North Dakota total)
From the EIA DPR:
The number of well completions declined from 71 in August to 52 in September and rose to 58 in October
(Bakken North Dakota and Montana).
Wells drilled, completed, and DUCs in the Bakken.
Source: EIA DPR, November 2016
Hi Alex S,
I trust the NDIC numbers much more than the EIA numbers which are based on a model. Enno Peters data has 66 completions in August 2016, he has not put up his post for the Sept data yet so I am using the Director’s estimate for now. I agree his estimate is usually off a bit, Enno tends to be spot on for the Bakken data, for Texas he relies on RRC data which is not very good.
Dennis. Someone pointed out Whiting’s Twin Valley field wells being shut in for August.
It appears this was because another 13 wells in the field were recently completed.
It appears that when all 29 wells are returned to full production, this field will be very prolific initially. Therefore, on this one field alone, we could see some impact for the entire state.
Does anyone know if these wells are part of Whiting’s JV? Telling if they had to do that on these strong wells. Bakken just not close to economic.
I also note that average production days per well in for EOG in Parshall was 24. I haven’t looked at some of the other “older” large fields yet, but assume the numbers are similar.
Also, over 3000 Hz wells in ND produced less than 1000 BO in 9/16.
This is just for wells with first production 1/1/07 or later.
Hi Shallow sand,
I agree higher prices will be needed in the Bakken, probably $75/b or more. To be honest I don’t know why they continue to complete wells, but maybe it is a matter of ignoring the sunk costs in wells drilled but not completed and running the numbers based on whether they can pay back the completion costs. Everyone may be hoping the other guys fail and are just trying to pay the bills as best they can, not sure if just stopping altogether is the best strategy.
There is the old adage that when your in a hole, more digging doesn’t help much. 🙂
So my model just assumes continued completions at the August rate for about 12 months with gradually rising prices as the market starts to balance, then a gradual increase in completions as prices continue to rise from July 2017($78/b) to Dec 2018 (from 72 completions to about 90 completions per month 18 months later). At that point oil prices have risen to $97/b and LTO companies are making money. Prices continue to rise to $130/b by Oct 2020 and then remain at that level for 40 years (not likely, but the model is simplistic).
I could easily do a model with no wells completed, but I doubt that will be correct. Suggestions?
Dennis. As we have discussed before, tough to model when there is no way to be accurate regarding the oil price.
I continue to contend that there will be no quick price recovery without an OPEC cut. Further, the US dollar is very important too, as are interest rates.
Hi Shallow sand,
At some point OPEC may not be able to increase output much more and overall World supply will increase less than demand. My guess is that this will occur by mid 2017 and oil prices will rise. OPEC output from Libya an Nigeria has recovered, but this can only go so far, maybe another 1 Mb/d at most. I don’t expect any big increases from other OPEC nations in the near term.
A big guess as to oil prices has to be made to do a model.
I believe my guess is conservative, but maybe oil prices will remain where they are now beyond mid 2017.
I expected World supply to have fallen much more quickly than has been the case at oil prices of $50/b.
” To be honest I don’t know why they continue to complete wells, but maybe it is a matter of ignoring the sunk costs in wells drilled but not completed and running the numbers based on whether they can pay back the completion costs.”
Yep.
Probably to do with how confidential wells are included.
RBN explains EIA methodology:
“EIA does this by using a relatively new dataset—FracFocus.org’s national fracking chemical registry—to identify the completion phase, marked by the first fracking. If a well shows up on the registry, it’s considered completed “
There is an unlikely peak oil related editorial writer hiding in the most unlikely place: a weekly English business paper called Capital Ethiopia. The latest editorial is again putting an excellent perspective on world events. http://capitalethiopia.com/2016/11/15/system-failure/#.WC1ZCvl9600
For the record, I have no interest or connection to this publication other than that of a paying reader.
Wouldn’t it be nice if mainstream publications would sound a bit more like this.
the word oil does not appear anywhere on that.
I’ve lived/worked in several socialist/communist countries, and they share these common traits: they are inefficient, they are unsustainable, they don’t protect the environment, they abuse human rights, they are run by a small caste, they are un democratic, they repress dissent, and they usually evolve into a hybrid fascist-Marxist-capitalist system like we see in China, Vietnam, and is now evolving in Cuba under Raúl Castro.
Thanks all. I thought that the red queen concept meant that there had to be an increase in the rate of completions. So that 71 year-on-year in north Dakota would only stabilise temporarily. Perhaps the loss of sweet spots are being counteracted by the improvements in technology? I’m assuming that even with difficulties of financing there will be a swift increase in completions should the oil price take off, but not sure how sustainable this would be
Hi Pete,
Sometimes I think that once the price of oil is up enough that sellers can hedge the their selling price for two or three years at a profitable level, it will hardly matter what the banks have to say about financing new wells.
At five to ten million apiece, there will probably be plenty of money coming out of various deep pockets to get the well drilling ball rolling again, if the profits look good.
Sometimes the folks who think the industry will not be able to raise money forget that it’s not a scratch job anymore. The land surveys, roads, a good bit of pipeline, housing, leases, etc are already in place, meaning all it takes to get the oil started now is a drill and frack rig.
I don’t know what the price will have to be, but considering that a lot of lease and other money is a sunk cost that can’t be recovered, and will have to be written off, along with the mountain of debts accumulated so far, the price might be lower than a lot of people estimate.
Bankruptcy of old owners results in lowering the price at which an old business makes money for its new owners.
Hi Pete,
The Red Queen effect is that more and more wells need to be completed to increase output. As output decreases fewer wells are needed to maintain output. So at 1000 kb/d output it might require 120 wells to be completed to maintain output (if new well EUR did not eventually decrease), but at 850 kb/d it might require about 78 new wells per month to maintain output.
If decline is hyperbolic, it depends on oil price and input costs. If the decline curve is fairly steady, there will be a number of wells X which increases production a little bit. But I’ve found it’s important to keep old wells producing and then use their jewelry and pipe as part of a rolling materials stock (this lowers new well costs).
It’s a really delicate dance, I’ve found production managers who simply can’t grasp how to run their fields properly to optimize this function. It’s a bit more complicated than making power point slides, which seems to be what modern supervisors are most focused on.
The FED oil production number for October came out yesterday. In below chart the production decline (blue line) is the same as in the previous month, yet the trend is still a massive decline year over year. In my view year over year comparison can show the dynamic of a trend. And it shows clearly that in the current cycle the oil price recovery is – in contrast to the cycle in 2008/9 – very slow and tentative.
The year over year oil price (green line in below chart) actually decreased again year over year and the risk of a double dip in the oil price is growing by the day. Drilling follows very cautiously the oil price in a parallel line (red line in below chart). If there would be really a technological advantage for shale, the red and the green line would not be paralell, but the red line for drilling would rise much stronger. This is actually the case for Middle East drilling, which barely fell during this cycle. This indicates that most Middle East producers still have high margins at the current oil price. Middle East producers – and also Russia – can quite easily cope with an oil price of 40 +/- 10 USD per barrel. This is why I think that the oil price will bounce at the bottom of the barrel within above range for a few years.
There is also something interesting going on with the world economy. The shippers rose exponentionally over the last few days (DRYS up over 1000%). Also the baltic Dry index is up 600% since the beginning of this year. House prices here in London fell – mostly at the high end. Rents for expensives homes are down by up to 36%. Donald Trump has clearly changed something already as it becomes increasingly clear that the dollar hoarders are paying for the infrastructure spending. I am not sure if he understands that he is doing a lot of harm to his own business empire as well.
I expect if that depressing old banker were here he would note that instability is dangerous, and that all the moves in treasuries currency and possibly trade flow create changes of which the results are difficult or impossible to predict
Hi Heinrich,
I can easily understand your assertion that Middle Eastern and Russian oil is profitable at forty bucks.
But if the price is to stay around forty, then it follows that you think that between them, the producers in the Middle East and Russia will be able to supply all the oil the world wants for the next few years.
Am I correct in saying this?
Do you think western producers will continue to pump enough at a loss ( most of them are apparently losing money at forty bucks ) to make up the difference?
If you are willing to venture a guess, when do you think the price will get back into the sixty dollar and up range?
If you think it won’t for a lot of years, is that because you believe the economy is will be that anemic, or because electric cars will substantially reduce demand, or both ? Or maybe you have other reasons ?
oldfarmermac,
The US has thrown the gauntlet to OPEC by claiming to becoming an oil net exporter. This has brought OPEC in a very difficult situation. If they cut – and oil gets to 70 USD per barrel – shale will pick up the slack and produce the amount OPEC has cut within a short period of time. So, OPEC is forced to cut again, until it has lost a lot of market share – and thus also a lot of revenue.
In my view OPEC has no other choice than to produce come hell and water – until something breaks. This could be that many shale companies give up or that for instance Iran is not allowed to export as much as they do, or there is a major conflict in the Middle East, or Saudi Arabia is running out of cash …..
He who has the market share now, will cash in when the oil price rises. And it will rise, yet not until something breaks. This is how business works. This is how Microsoft crushed Apple in the nineties in the PC market – and Apple then crushed Nokia in the smart phone market….
I do not think that Saudi Arabia has the freedom to compromise here – even if they want. If they blink they will be crushed by shale producers. So, the stand-off will go on for a while, at a loose-loose situation for both parties. However this is great luck for consumers as they can enjoy low energy prices for 2 to 3 years.
Dunno about Heinrich, but I strongly believe that electric cars will substantially reduce demand. I also believe that industrial retooling will reduce demand (there’s already been a huge switch to NG). There are other effects: if the price goes high enough, people drive less and take public transportation more. And there’s an overall trend of people moving to downtowns and driving less as a result (which has been going on for decades but is a very slow trend, amounting to tenths of a percent each year). In addition, China’s “oil reserve buildup” propped up the oil market for several years and it has now ended. But I think electric cars are the dominant effect here.
This is tricky to model, but I believe the inherent superiority of electric cars means that demand for electric cars is essentially equal to total demand for cars once upfront price parity is reached in a given market segment. Plug-in hybrids will be part of the market, but it’s documented that typical plug-in-hybrid drivers use electricity almost all the time and gasoline only occasionally.
So I think the primary limiting factor is actually production capacity for plug-in electric cars. This is *extremely* hard to model, but I believe that 5% – 10% of all new cars sold worldwide will be either fully electric or plug-in hybrids in *2018*. Probably closer to 10%. Maybe 15%. This number is dominated by the Chinese market which is going electric *very* fast. The US will lag behind.
If 1/12 of the car fleet is replaced each year and 10% of new cars sold are electric, that’s about .008% of gasoline demand eliminated in 2018. But I see production capacity for electric cars roughly doubling every year after that. I make the assumption that any increase in total car demand is met by additional electric cars (China’s electric car production rate has actually been growing faster than doubling each year). By 2022, the gasoline demand reduction rate from this process alone clearly exceeds the decline rate of the oil fields. The situation will be obvious to enough investors by 2020.
I don’t expect outside investors (as opposed to the money already in ExxonMobil etc.) to pour money into new oil developments until after the oil price goes up, and I don’t expect investors to put money into new oil developments after the situation becomes obvious in 2020. It’ll take a company probably two years to get the oil out and sell it after they do pour the money in. So if the oil price rises in 2017 and the production starts in 2019, this is a pretty short window before the investment dries up in 2020.
I actually think the oil price will climb into the $60+ range in 2017 or 2018 (depending on whether OPEC cuts back now or produces flat-out until they can’t any more) but that the price will be battered back down again as reductions in oil use from the electric car switchover start to become apparent to investors. And I think that’s the final move. The DB report a while back predicted oscillations in the oil price, up as supply ran short, down as demand dropped, up, down, with a final downward move as demand went away.
Hi Nathaneal,
I think your story is roughly correct but too optimistic. Maybe by 2020 5% of new cars sold will be EVs and plugins. About 75 million vehicles sold in 2015 and only about 0.5 million plugins and EVs World Wide. So 5% would be 3.75 million EVs and plugins sold if total vehicle sales (including ICE and electric) remained at 75 million.
If we make the too optimistic assumption that EVs and plugin sales double each year, we be at 4 million in sales by 2018, does that really seem realistic to you?
A more realistic scenario is 40% annual sales growth which gets the market to 10% electric (including PHEV) by 2024 if we assume total vehicle sales growth is 1.5%/year. Even that scenario would be too optimistic in a low oil price scenario.
Dennis,
The 128% growth for Chinese EVs is real. China has actually wanted to get this going since 2000, yet consumers did not catch fire. Yet it seems that EVs are the new cool. And China has a big national interest in this trend.
This is exactly what I want to say: It is possible to spot a trend with the yoy% growth rate – even if the mainstream snubs the low number of actual EVs sold. Of course the growth rate will come down over the years, yet an initial growth rate of 128% tells something. Where there is smoke there is also fire.
A doubling every year means we have 16 mill (or 20%) EVs sold in 2020. Then the World will really wake up and notice. Yet then it is too late for an investment.
EVs will never replace all fossil cars – just like cars did not replace all railways. Yet in urban areas EVs will have a very important role. tThat is pretty sure now.
Hi Heinrich,
I think most cars will be EVs or plugin hybrids in 40 years time.
I do not dispute high growth rates at present, it just becomes very difficult to go from say 2 million cars sold per year to 4 million cars sold per year than from 500,000 to 1 million. Of course this becomes progressively more difficult which is why after the market reaches 1 million EVs and plugins sold per year (probably in 2017) that the growth rate will slow to 40% per year or less by 2019 in my opinion. It will take time for the market to accept EVs and high oil prices and more EVs being sold in the sweet spot of 25 to 30k will help with market acceptance. The cars will need to have 250 miles of range at this price which may become the norm by 2020. Battery prices have been coming down and economies of scale, competition, and innovation will bring prices down more.
I am not offering investment advice, just speculating on how this plays out. Even a 40% growth rate is too optimistic, when they reach 5 million cars sold the growth rate will slow to 20%/year and when they reach 10 million EVs and plugins sold per year the growth rate will slow to 10% per year and that rate might be maintained until they get to 80% of market share, then it might slow to 5% growth until the car makers approach 100% of personal vehicles as EVs or plugin hybrids.
Long haul ground transport will switch to rail and short haul trucks will be plugin hybrids or EVs, but that will happen slowly over the next 45 years.
Dennis,
I have heard the same arguements 30 years ago about the PC market and 10 years ago about the smart phone market. ‘Steve Jobs and Bill Gates were just some nerds and the PC market will be just limted to some special guys.’
The same about the smart phone market. I have then worked in Finland and knew some guys from Nokia. We discussed this and they said ‘smart phones will never take off, because batteries are too weak to support smartphones.’ We know now how this worked out.
I think we are here up to a surprise. China has proven that they can very quickly build up manufacturing capacity, especially as there are no major technological obstacles. Electric motors production can be ramped up very quickly and batteries as well. Also lithium will not be in short supply as most batteries will be recycled.
Li-batteries only have a small share of lithium. Most of the content comes from other metals. I think that it is more likely that Cobalt and Nickel will be in short supply, if there is a metal bottleneck that will restrict EVs/batteries in future.
Heinrich,
From 1986 to 2000 IBM PC and clones had average annual sales growth of 23% per year. If EVs and plugin hybrids experience similar growth rates (23%/year) until 2028 they will have 8% of the car market if the overall market grows by 1.5%/year to 91 million in total car sales in 2028 and 7.4 million in electric cars sold (including plug in hybrids).
I think they will eventually take the entire market, but reaching 95% will take 50 years or more imo.
I’ve also a new post on ND, here.
Do you know why you show a significantly higher number of DUCs than Bloomberg do – as reported here?
http://www.oilandgas360.com/ducs-havent-flown-fast-since-april/
I think your numbers reflect numbers reported from ND DMR but Bloomberg might be closer to reality for wells that will actually ever be completed (just a guess by me though). How do Bloomberg get their numbers (e.g. removing Tight Holes, or removing old wells, not counting non-completed waivers etc.)?
George,
Yes indeed. The difficulty with DUCs is always, which wells do you count. I don’t filter old wells for example, and already include those that were spud last month (even though maybe casing has not been set). I don’t do a lot of filtering, so the actual # wells that really can be completed is likely quite a bit lower. I see my DUC numbers as the upper bound. I don’t know Bloombergs method exactly, so I can’t comment on that.
Discussion of Venezuelan politics should be in the open thread, but politics are going to determine how much oil is produced there for the next few years, and the situation looks iffy indeed.
https://www.theguardian.com/commentisfree/2016/nov/17/venezuela-nicolas-maduro-dictatorship-elections-jeremy-corbyn
Very iffy. Is the USA media covering the conviction of Maduro’s nephews for conspiracy to smuggle 800 kg of cocaine into the USA? These two guys were running a drug traffic ring using the presidential airport gate and Venezuelan Air Force pilots, and the dea taped them saying they were getting the dope from the Colombian FARC. Any coverage at all you see there? I don’t see much in Europe.
Fernando, worrying about 800 kg of cocaine smuggled into the US is laughable! That’s akin to considering the illegal sale of individual cigarettes out of a pack by some homeless kid on a street corner, to be part of a major crime spree. You really don’t get it. The international drug trade is a huge global business.
https://www.unodc.org/unodc/en/drug-trafficking/
In 2007 and 2008, cocaine was used by some 16 to 17 million people worldwide, similar to the number of global opiate users. North America accounted for more than 40 per cent of global cocaine consumption (the total was estimated at around 470 tons), while the 27 European Union and four European Free Trade Association countries accounted for more than a quarter of total consumption. These two regions account for more than 80 per cent of the total value of the global cocaine market, which was estimated at $88 billion in 2008.
BTW, for the record Maduro’s power over Venezuela won’t last long, and if you really think that communism is a still a force in the world with or without Castro’s Cuba you don’t understand that the struggle between capitalism and communism is an anachronism and a throwback to the days of the industrial revolution and the 19th century. Brexit and Trump are in the long run also an attempt to go back in time. Won’t happen!
Fossil fuels are dead as is the linear economy. We are already well into the 21st century. this is the age of digital, big data and a new world order. I could provide you links to a series of talks that happened in Rio de Janeiro two weeks ago but I doubt you’d be willing to sit through them.
One talk in particular was about a parallel economy in Venezuela and how crypto currencies and blockchain technologies will in short order be able to help the Venezuelan people make dictators like Maduro irrelevant. To be clear no one is being naive that these transitions will be painless and it is to be expected that the old ways and people who benefit from that power are not going to give it up without one hell of a fight but they can’t hold on for ever and change will happen.
Concerning Freddy’s chart of production profile of wells drilled in various years.
They all line up by about month 18 of production. This should not be possible. The later wells have many more stages of frack. They are longer, draining more volume of rock. But the chart says what it says. At month about 18 the 2014 wells are flowing the same rate as 2008 wells. We know stage count has risen over those 6 yrs. 2014 wells should flow a higher rate. The shape of the curve can be the same, but it should be offset higher.
Explanation?
How about above ground issues . . . older wells get pipelines and can flow more oil . . . nah, that’s absurd.
There needs to be a physical explanation for this.
These new wells have higher IPs, but also higher decline rates.
Closer spacing (see Freddy’s comment above) and depletion of the sweet spots may also impact production curves and EURs.
That doesn’t make sense. They are longer. By a factor of 2ish. How can a 6000 foot lateral flow exactly the same amount 2 yrs into production as a 3000 foot lateral flows 2 yrs into production?
Look at the lines. At 18 months AND BEYOND, these longer laterals flow the same oil rate as the shorter laterals did at the same month number of production. Higher IP and higher decline rate will affect the shape, but There Is Twice The Length..
Hi Watcher,
I don’t think we have information on the length of the wells, since 2008 the length of the lateral has not changed, just the number of frack stages and amount of proppant. This seems to primarily affect the output in the first 12 to 18 months, and well spacing and room in the sweet spots no doubt has some effect (offsetting the greater number of frack stages etc.).
Listen to Mike, he knows this stuff.
From http://www.dtcenergygroup.com/bakken-5-year-drilling-completion-trends/
STATISTICS
The combination of longer lateral lengths and advancements in completion technology has allowed operators to increase the number of frac stages during completions and space them closer together. The result has been a higher completion cost per well but with increased production and more emphasis on profitability.
In the past five years, DTC Energy Group completion supervisors in the Bakken have helped oversee a dramatic increase from an average of 10 stages in 2008 to 32 stages in 2013. Even 40-stage fracs have been achieved.
One of the main reasons for this is the longer lateral lengths – operators now have twice as much space to work with (10,000 versus 5,000 feet along the lateral). Frac stages are also being spaced closer together, roughly 300 feet apart as compared to spacing up to 800 feet in 2008, as experienced by DTC supervisors.
By placing more fracture stages closer together, over a longer lateral length, operators have successfully been able to improve initial production (IP) rates, as well as increase EURs over the life of the well.
blah blah, but they make clear the years have increased length. Freddy was talking about well spacing, this text is about stage spacing, but that is achieved because of lateral length.
Freddy can you revisit your graph code? It’s just bizarre that different length wells have the same flow rate 2 yrs out, and later.
Take a look at Enno´s graphs at https://shaleprofile.com/. They look the same as my graphs and we have collected and processed the data independently from each other.
If the wells have the same wellbore riser design irrespective of lateral length (i.e. same depth, which is a given, same bore, same downhole pump) then that section might become the main bottleneck later in life and not the reservoir rock. With a long fat tail that seems more likely somehow compared to the faster falling Eagle Ford wells say (but that is just a guess really). But there may be lots of other nuances, we just don’t have enough data in enough detail especially on the late life performance for all different well designs – it looks like the early ones are just reaching shut off stage in numbers now. I doubt if the E&Ps concentrated on later life when the wells were planned – they wanted early production, and still do, to pay their creditors and company officers bonuses (not necessarily in that order).
Hmmm. I know it is speculation, but can you flesh that out?
If some bottleneck physically exists that defines a flow rate for all wells from all years then that does indeed explain the graphs, but what such thing could exist that has a new number each year past year 2?
We certainly have discussed chokes for reservoir/EUR management, but the same setting to define flow regardless of length?
Hmmm.
The flow depends on the available pressure drop, which is made up of friction through the rock and up the well bore (plus maybe some through the choke but not much), plus the head of the well, plus a negative number if there is a pump. The frictional and pump numbers depend on the flow and all the numbers depend on gas-oil ratio. Initially there is a big pressure drop in the rock because of the high flow, then not so much. Once the flow drops the pressure at base of the well bore just falls as a result of depletion over time, the effect of the completion design is a lot less and lost in the noise, so all the wells behave similarly. That’s just a guess – I have never seen a shale well and never run a well with 10 bpd production, conventional or anything else.
A question might be if the flow is the same why doesn’t the longer well with the bigger volume deplete more slowly, and I don’t know the answer. It may be too small to notice and lost in the noise, or to do with gas breakout dominating the pressure balance, or just the way the the physics plays out as the fluids permeate through the rock, or we don’t have long enough history to see the differences yet.
Longer laterals, more stages, more pounds of frac sand per stage all result in higher initial potentials (IP’s) and ensuing 90-180 day production profiles. As I have said, that all lends itself to higher EUR predictions and greater reserves that can be booked and more money that can be borrowed against those new “assets.” The E in EUR stands for estimated, however, and higher EUR’s don’t necessarily lend themselves to greater UR’s. As others have suggested, and Enno Peter’s data (with known completion data) confirms, higher IP’s tend to result in steeper declines; it remains to be seen what the net gain will be, if any, from longer laterals and bigger frac’s that cost lots more money. My belief is that bigger frac’s increase the rate of withdrawal of OOIP, but do not necessarily increase the rate of total recovery of OOIP. The shale oil industry wants us to believe that. I am not convinced. I don’t believe recovery factors are greater than 5%.
In the shale matrix there is oil, water and gas. Gas is in “solution” with the oil phase and when the well is frac’ed, and gazillions of nano fractures are connected, the solution gas becomes the drive mechanism that helps move liquids to the well bore. During the frac additional energy is induced into the shale matrix, like blowing up a balloon. Induced energy is artificial and it depletes fairly quickly. Generally speaking when induced energy dissipates, or the balloon is deflated, the well often stops flowing and is put on artificial lift. Bound solution gas in the shale matrix continues to help move fluid out of the shale bed (higher pressure) toward the wellbore (lower pressure). Eventually, however, gas expands and releases out of the liquid phase, gas to oil ratios increase and liquids are left behind in the nano-fractures, immobile and unable to move toward the pressure sink (wellbore). This is what we look for in solution gas (pressure depletion) environments that would imply depletion is starting to occur. When this happens the length of the lateral and number of stages previously stimulated really becomes irrelevant.
Some stages along a HZ lateral deplete at faster rates than other stages. I actually believe stages in the toe of the lateral don’t get stimulated as effectively as those closer to the heel and pressure differentials along the lateral, from stage to stage, reduce total recovery rates from the well. More stages can in theory be detrimental to recovery factors.
90% of shale wells are put of rod lift and the down hole pump (DHP) cannot typically be set greater than about 12% from vertical in the very top of the radius. There is no “bottleneck” there, but the well bore under the DHP must have sufficient “energy” to move fluid thru those tiny micro factures stuffed with sand, to the lateral, all along the lateral, up the radius and to the intake of the DHP. When there is insufficient fluid conductivity (movement) to the well bore the well “pumps off” and has to be shut in until the fluid can build up above the DHP intake. Rinse and repeat. This problem, I believe, will whack the tails off EUR’s and increasing GOR is a sure sign we are headed in that direction.
The shale oil industry is desperate for cash flow, be it from production revenue or more borrowed CAPEX from Wall Street. It seems highly probable to me that the things it is doing now, to save itself, are resulting in less total recovery of OOIP per acre foot of remaining resource, not more. That will not be the first time in the long history of oil extraction that has happened.
Thanks Mike, great explanation.
My pleasure, sir.
Mike. We recently discussed production days in the Bakken, which for many of the older wells are no longer 30.
As I recall, JohnS has some contacts who said many of the wells in the Bakken are being equipped with automatic controls that shut the well down when it pumps off.
Do you know if this is true in the EFS and Permian also? I looked at Parsley Energy’s wells in Midland Co. 57 produced under 10 BOPD in last 12 months (10/15-9/16). Most are Spraberry trend. I assume those don’t pump continuously. They are vertical, but I assume the Hz will perform the same.
Isn’t this what happened to all of the 1980s-1990s Austin Chalk horizontal wells? They pump a few days per month?
There are 1615 Hz wells in Lee and Burleson Co., TX. 1007 are still active. These two counties were big Austin Chalk counties.
750 produced less than 25 BOPD in 9/16, and of those, 595 produced less than 10 BOPD in the most recent month. I assume those are almost all wells that pump off due to low fluid volume.
The only wells in those counties with higher production are either new wells, or ones reentered recently.
There are going to be hundreds of thousands of low volume, very deep TD oil wells in the US before this is over.
Howdy, Shallow; I concur with your observations completely. Once pressure depletion occurs, fluid conductivity to a vertical wellbore gets difficult; HZ wells, IMO, will be even more difficult. I think we are seeing that already. If prices rise to some future economic level there will be numerous attempts at re-fracing to re-introduce energy into the shale matrix to improve fluid conductivity and we’ll have to see if the EOR hubbub works. In the Eagle Ford it has not, to date. Nor were re-frac’s economic even at plus 85 dollar oil.
The vertical Spraberry and Austin Chalks I operated long ago all stayed shut in for half the production month awaiting fill up, so to speak, a direct result of pressure depletion.
In the oil window of the Eagle Ford, water saturations are higher and we see fewer wells down because they all make water. Depending on how much water, some are down permanently now because of disposal costs. Interestingly, there is an abundance of 5 1/2″ 32 pound per foot production casing on the used pipe market now in Texas…from EF wells being plugged.
We are now in year 3 of this price downturn and many, many shale oil companies are in dire financial condition. One of the reasons we have not seen major integrated oil companies start buying this stuff at bargain basement prices is, I think, they see the depletion writing on the wall. I can’t imagine Exxon wanting to operate slews of what will eventually become 10 BOPD shale oil stripper wells.
Mike, shallow sand,
Thanks for interesting information.
Just one question for SS:
How old are those wells in Midland with <10 b/d production?
Thanks mike, I always enjoy your comments.
I have heard some argue that previously shale companies were rewarded for high IP and so produced wells at high IP, maximizing that since it brought in more cash rather than maximizing total flow across the life.
Now wells are much better, but are not showing higher IP, because of better management and less need to show IP.
Not saying I believe it.
Does it seem at all possible to you? Leaving aside all the comments on this thread on how the curves seem to normalize to the same flow over time, rather than being shifted higher as they should be.
But could people have been damaging wells chasing an IP number? or if not damaging exactly, is it likely flowing a shale well slower will increase total recovery?
Thank you, Wake.
Yes, there is no hesitation on my part in saying that the lack of pressure management in individual shale well operations has hurt the overall recovery factor that might have otherwise been achieved and that reported EUR’s (based on high IP’s and 90 day production profiles) may be grossly exaggerated. EOG, for instance, is absolutely notorious for gutting their wells; I know that for a fact.
But money is king, queen and everything in between and these shale guys need money, lots of it, from wherever they can get it and they don’t care about tomorrow. They only live to survive another day, hoping for the higher oil price defibulator to bring them back to life .
It is a bad analogy, perhaps, but please remember the days of wells flowing unabated over the crowns of wooden rigs, into open earth pits because there was nowhere else to put the stuff…reservoir pressure was destroyed in those situations and recovery factors of OOIP were as well, sometimes permanently. What is happening in unconventional shale development is no different, just far less visually spectacular.
Permian rig count now greater than same time last year.
http://www.fool.ca/2016/11/16/buffett-sells-suncor-energy-inc-what-does-this-mean-for-the-canadian-oil-patch/
Suncor’s forecast for production [in 2017] is 680,000-720,000 boe/d. A midpoint would represent a 13% increase over 2016.
http://www.ogj.com/articles/2016/11/suncor-provides-capital-spending-production-outlook-for-2017.html
Solid growth
The only oil investment that has any feck is turmoil.
Or, Term Oil Corporation.
Also known as Peak Oil.
http://www.bnsf.com/about-bnsf/financial-information/weekly-carload-reports/
The number of rail cars hauling petroleum is a constant in the range of 7,200 to 7,400 petroleum cars hauled each week for a good six months now.
Seems as though petroleum by rail is more of a necessity than a choice.
The volume is down a good thirty percent since about 2013 when over 10,000 cars were hauled per week.
Demand decreases, contracts expire, better modes of transport emerge and cost less. not as much call for Bakken oil. Plenty of the stuff somewhere else in this world.
The trend is down, not up for petroleum hauled by rail.
If there were orders for Bakken oil for one million bpd, the production would be one million bpd.
Bakken oil lost marketshare due to price drop.
Buyers can buy oil from anywhere.
More Bakken petroleum is being moved by pipeline.
Over the whole rail system, petroleum and petroleum product rail car loadings were down to 10.5 thousand in September. That compares to a high point of 16.3 thousand railcars in Sept of 2014.
Coal car loadings are on the rise, from a low of 61,000 in April to 86,000 in Sept. Coal was running a near steady 105,00 to 110,000 railcars every month in 2013 and 2014.
The chart below from RBN shows that Bakken pipeline capacity did not increase since early 2015. But production dropped, and this primarily affected volumes of Bakken oil transported by rail.
Given the higher percentage of oil transported by pipelines, the average transporation cost for Bakken crude should have decreased. Interesting, however, that the price differential between the well-head Bakken sweet crude and WTI has remained within the $10-12/bbl range.
Bakken Crude Production and Takeaway Capacity
Source: RBN
This article from Platts explains better than me:
Analysis: Bakken discounts deepen as competition heats up
Houston (Platts)–16 Nov 2016
http://www.platts.com/latest-news/oil/houston/analysis-bakken-discounts-deepen-as-competition-27711340
Bakken Blend differentials at terminals close to North Dakota wellheads held their lowest assessment since December Tuesday, closing at the calendar-month average of the NYMEX light sweet crude oil contract (WTI CMA) minus $6.25/b.
While one factor dragging on Bakken differentials has clearly been a tight Brent/WTI spread — trading around 42 cents/b Tuesday, well in from the steady $2/b seen this summer — the return of Louisiana Light Sweet to the Midwest market may also be having an impact, according to traders.
One trader said there was an increase in volumes heading up the Capline pipeline, however, differentials suggest LLS is still too expensive, at least compared to Bakken. Platts assessed LLS at WTI plus $1.15/b Tuesday.
Considered by some to be the “champagne of crudes,” it is unclear what appeal LLS still has for a Midwest refiner as margins for LLS actually — and unusually — lag those for Bakken.
S&P Global Platts data shows LLS cracking margins in the Midwest closed at $3.30/b Monday, compared to Bakken cracking margins of $6.37/b. In fact, the advantage of cracking Bakken has grown steadily since August.
Platts margin data reflects the difference between a crude’s netback and its spot price.
Netbacks are based on crude yields, which are calculated by applying Platts product price assessments to yield formulas designed by Turner, Mason & Co.
What is clear however, is that the steeper discounts available for Bakken provide the biggest incentive for a Midwest refiner.
The cost of getting Bakken to this market is around $3.48/b, according to Platts netback calculations, compared to just $1.02/b for LLS.
These costs make up a significant portion of the Bakken discount.
Further, LLS moving up the Capline after many years of relative inactivity does not necessarily suggest a new trend is in the making. However, recent pipeline reversals between Texas and Louisiana mean more Permian crudes are capable of reaching Louisiana refineries, and thus, if priced accordingly, could displace incremental volumes of LLS from its home market.
With current pipeline capacity out of North Dakota typically full, the marginal Bakken barrel often gets to market via rail, and this cost has traditionally sets the floor to Bakken’s discount to WTI. And part of the recent downturn in Bakken could be chalked up to an increase in railed volumes to the US Atlantic Coast, as Bakken cracking margins there are again in the black.
In fact, Association of American Railroad’s latest monthly and weekly data shows crude and refined product rail movements appear to have bottomed, having grown in September from August.
Weekly data bears this out as well, showing increases in three of the last four weeks.
It remains to be seen how long this will last, however, should Energy Transfer Partners Dakota Access Pipeline go ahead as planned.
Linefill for the pipeline could boost Bakken differentials, potentially making the grade too expensive to rail east. However, the devil is in the details.
Traders and analysts have pegged Dakota Access pipeline tariffs between $4.50-$5.50/b for uncommitted shippers between North Dakota and Patoka, Illinois. A further $6.50/b would be needed to bring the crude south from Patoka to Nederland, Texas, sources have said.
If this $11-$12/b combined pipeline estimated cost were to pan out, it would be more expensive than the $10.20/b Platts assumes in its Bakken USAC rail-based netback calculation.
Here is some more Bakken pipeline explanation and plans:
http://www.ogfj.com/articles/print/volume-13/issue-10/features/bakken-pipeline-takeaway-capacity.html
U.S.oil rig count was up 19 units last week, the largest weekly gain in 16 months.
Gas rig count is up 1 unit.
Permian basin: + 11 oil rigs
Bakken: -1
Eagle Ford: -1
Niobrara: +2
Cana Woodford: unchanged
Other shale plays: +2
Conventional basins: +6
Oil rig count in the Permian is up 73.5% from this year’s low – the biggest increase among all US basins.
It is still only 41% of October 2014 peak, but this is much better than the Bakken and especially the Eagle Ford where drilling activity remains depressed.
The number of horizontal rigs drilling for oil in the Permian is now 54% of the 2014 peak.
Oil rig count in the Permian basin
source: Baker Hughes
Weak drilling activity in the Bakken and the Eagle Ford helps to explain continued declines in their oil production
Oil rig count in 4 other tight oil plays
Alex,
As of September 2016, 4 counties produced 90.1% of all the Bakken/Three Forks oil production in North Dakota: McKenzie, Mountrail, Williams and Dunn. Relative to December 2014, North Dakota Bakken/Three Forks oil production is off 243,098 b/d relative to December 2014 while the number of producing wells is up 1861 based upon data from the state.
Based upon state data, the number of producing wells/square mile is 1.29 in Mountrail County, 1.22 in McKenzie County, 1.02 in Willams County, and 0.86 in Dunn County. How high can the number of producing wells/square mile go?
Is there something more than reduced drilling to explain the drop in production?
This shows well density and production from last September. The distance is concentric from a “production centre of gravity” – i.e. weighted average by production for all wells. The core area (“sweet spot”) is a circle of about 50 to 60 kms only (it’s squashed out a bit to the west and missing a bite in the SW). Maximum well density (and with the best wells is 120 to 160 acres, and falls off quickly outside the core. The core is getting saturated.
From a recent EIA report:
“U.S. drilling activity is increasingly concentrated in the Permian Basin …. The Permian now holds nearly as many active oil rigs as the rest of the United States combined, including both onshore and offshore rigs, and it is the only region in EIA’s Drilling Productivity Report where crude oil production is expected to increase for the third consecutive month.”
The EIA DPR production volume estimates for the Permian include both LTO and conventional C+C
Permian Basin also dominates M&A activity in the US E&P sector.
From the same EIA report:
“Several of the larger M&A deals involved Permian Basin assets, where drilling and production is beginning to increase.
Based on data through November 10, the second half of 2016 already has more M&A spending than the first half of 2016, but on fewer deals. The 93 M&A announcements in the third quarter of 2016 totaled $16.6 billion, for an average of $179 million per deal, the largest per deal average since the third quarter of 2014. Although only 11 of the 49 deals so far in the fourth quarter of 2016 are in the Permian Basin, they accounted for more than half of total deal value.”
http://www.eia.gov/todayinenergy/detail.php?id=28772
RRC Texas for September came out recently. As others will probably elaborate more on the data, I just want to show if year over year changes in production could be use as a predictive tool for future production (see below chart).
It is obvious that year over year changes (green line) beautifully predicted oil production (red line) at a time lag of about 15 month. Even when production was still growing, the steep decline of growth rate indicated already the current steep decline.
The interesting thing is that the year over year change is a summary indicator. It does not tell why production declines or rises. It can be the oil price, interest rates or just depletion – even seasonal factors are eliminated. It just shows the strength of a trend.
I am curious myself how this works out. The yoy% indicator predicts that Texas will have lost another million bbl per day by end next year. That sounds quite like a big plunge. One explanation could be the fact that we have now low oil prices and high interest rates. In all other cycles it has been the other way around: low oil prices came hand in hand with low interest rates. This could be now a major obstacle for companies to grow production.
This concept of following year over year changes works of course just for big trends, yet for investment timing it seems exactly the right tool. Another huge wave is coming in electric vehicles which are growing in China by 120% year over year. Here we have the same situation as for shale 7 years ago: Although current EV sales are barely 1 million per year worldwide, the growth rate reveals already an huge wave coming. So as an investor it is always necessary to stay ahead of the trend and I think this can be done by observing the year over year% change.
Low natural gas prices cut coal use.
Why do people quote this stuff? 120% growth in EVs in China. All one has to do, really, is look it up.
The top seller in this “category” is the BYD Tang. IT’S NOT AN EV. IT HAS A 1.5L GAS ENGINE IN IT. That’s probably most of sales bump, but hey what’s #2? Funny you should ask. It’s the BYD Qin. Guess what it has in it, too? Yup.
Why do people quote this stuff? 120% growth in EVs in China. All one has to do, really, is look it up.
Watcher, you do realize that EV stands for electric vehicle, right?! That includes all kinds of electric vehicles including bicycles. You might want to take a step back and look at the big picture once in a while. Disclaimer, I have not actually checked to verify the validity of the 120% growth rate of EV adoption in China, but my hunch is that it is plausible. In any case, the main point with respect to all EVs is that they are at beginning stage of what looks to be an exponential growth rate all over the world.
http://www.bloomberg.com/news/articles/2016-06-02/electric-bike-makers-woo-americans
Motorcycle bans have helped lead to massive e-bike adoption in China, where more than 200 million are in use, according to Benjamin. The country is also the world’s biggest e-bike manufacturer and exporter, with giants such as Jiangsu Xinri E-Vehicle and Yadea Technology Group each able to produce several million annually. Compared with Asia, North America is barely a blip—Navigant predicts only about 152,000 e-bikes will be sold in the region this year, though it expects steady growth. “I would guess 90 to 95 percent of people in the U.S. don’t even know what an electric bicycle is,” says Navigant analyst Ryan Citron, who uses one to get to his job in Boulder, Colo.
It is documented that almost all people who buy plug-in hybrids use electricity most of the time, and gasoline only for occasional road trips.
This isn’t surprising, since it’s much cheaper to fuel them with electricity, practically everywhere — if you have both options, you’ll use the cheaper one. Gas has to get *very* cheap, much cheaper than it is now, for it to go the other way. Chinese gas prices are currently equivalent to $2.50/gallon, for reference.
This matters for modeling gasoline demand.
Watcher,
Here is my source of EV growth:
http://ev-sales.blogspot.co.uk/search/label/World
It states clearly that China has a year over year growth of 128% second only to Begium which shows a growth of 134%.
In my view this number could be much higher when the definition of EV is seen much broader including bikes, bicycles and small transporters.
In my view China has clearly seen the strategic advance of using and promoting EVs:
1. Pollution is down in big cities.
2. It is the Chinese way to become less energy dependent.
3. It is a huge boost to the Chinese local economy.
So, the Chinese government has a significant interest in fostering this trend.
I did not believe it myself, yet if the facts change, I change my mind.
Oh, that’s beautiful. thanks for that data, Heinrich….
I’ve been posting articles about the decline of coal. Here is the latest.
Environmentalists get a dose of good news: “Even though President Obama’s historic Clean Power Plan was stayed by the Supreme Court and appears doomed in the Trump Administration, the electric sector is getting so green so fast that it has already met the plan’s 2024 goal for slashing carbon emissions and its 2030 target for reducing coal use, new data show.”
“Power-plant coal consumption in 2016 is projected to drop to 640 million short tons, down 38 percent from 2005. That’s significantly lower than the EPA expected after 15 years of Clean Power Plan implementation, and with another 15 percent of the remaining coal fleet already scheduled to shut down, those numbers will drop much lower.”
Also, it might be worth noting that if renewables are becoming competitive in price in the US, they are likely to be competitive in price in other countries. So the future of electric cars in developing countries might be pretty good.
Hi BII,
Lots of countries routinely maintain some industries for reasons of national security and to help provide employment, even though they could import the product or service for less money.
This is particularly true in respect to industries involving ship building, aircraft, and particularly for various sorts of weapons. You can’t count on buying any of these things in the event of war or embargo, etc.
The renewable energy industries and electric cars are very likely to benefit from the same sort of support, and may be benefiting this way already, although you don’t hear much about it yet, considering the implications.
The Russians might turn off the gas and oil flowing to Western Europe generally, one of these days, and to Germany in particular.
Neither country has forgotten WWII. You won’t see it mentioned very often, but one reason the Germans are so gung ho on their energy transition is that nobody can embargo the wind and sun, or charge Germany even one thin dime for that wind and sun.
So the country gets lots of jobs, saves a ton precious foreign exchange that must otherwise be spent on imported oil and gas, etc, and is more economically and militarily secure as well.
And here’s another possibility. If a country is burning domestic coal for generating fuel, and can cut back on the use of coal substantially by producing lots of wind and solar electricity, the price of such coal as IS burnt to generate electricity might fall substantially. This would be very hard on the miners and mine owners of course, but very good for everybody else.
Buy less coal and pay less per ton as well? Now that’s getting at least two or three birds with just one stone. More jobs, less pollution, cheaper coal for all the industries that use it, for any purpose.
Yes, I think that Russia might be making some European countries nervous, especially if the US seems to be getting too cozy with Russia rather than serving as a counterbalance.
Low natural gas prices cut coal use.
Yes, of course. And utilities are phasing out coal-fired plants. That’s what is important. The coal industry is declining. Not temporarily, but according to most observers, permanently.
In the short-term, coal consumption in the U.S. may increase.
from the EIA:
Coal may surpass natural gas as most common electricity generation fuel this winter
NOVEMBER 18, 2016
http://www.eia.gov/todayinenergy/detail.php?id=28832
After declining for several months, the share of U.S. electricity fueled by coal is expected to slowly begin growing when compared to the same period last year. In contrast, the share of generation from natural gas is expected to experience year-over-year declines. Based on expected temperatures and market conditions, coal is expected to surpass natural gas as the most common electricity generating fuel in December, January, and February.
Natural gas had long been the second-most prevalent fuel for electricity generation behind coal, but it became the power industry’s primary fuel source for the first time in April 2015. Natural gas-fired generation has surpassed coal-fired generation in most months since then, and generation fueled by natural gas reached record levels this past summer. During the first six months of 2016, natural gas supplied 36% of total U.S. electricity generation compared with 31% for coal.
During periods where available generation capacity exceeds electricity load, selection of which capacity to run often reflects relative operating costs, which largely reflect generators’ fueling cost. When measured in terms of the cost of fuel it takes to generate a megawatthour (MWh) of electricity, to account for the different efficiencies of power plants, the prices for natural gas and coal were relatively competitive for much of 2015. At the beginning of 2016, the national average price of natural gas was consistently below the cost of coal delivered to power plants, reaching a low point of about $16/MWh in March, while coal has averaged between $21/MWh and $23/MWh for the past two years. Natural gas prices were low earlier this year because of ample fuel supplies and mild winter weather, which also reduced overall electricity demand.
continued:
Spot prices for natural gas have generally been rising in recent weeks. The cost of natural gas delivered to electric generators, which includes both spot market and contract purchases, has been increasing as well. The latest available data indicate that the generation cost of natural gas averaged $21.30/MWh in August, which was nearly identical to the cost of coal.
EIA’s November Short-Term Energy Outlook (STEO) projects that natural gas prices delivered to the power sector will continue rising. The STEO forecasts the average natural gas generation cost to reach a seasonal peak of nearly $31/MWh in February, which would be about 40% higher than the projected cost of coal for that month on a national average basis. Because coal costs vary widely across regions, relative fueling costs in particular markets may differ significantly from national averages.
The higher costs of natural gas relative to coal are likely to encourage the industry to use more coal to fuel electricity generation than in the recent past. Forecast cooler winter temperatures, especially in areas where coal is dominant, also contribute to higher projected coal use in power generation. If winter temperatures end up warmer than forecast, natural gas prices would likely stay low, which would reduce the incentive to use more coal-fired generation.
continued:
By the middle of 2017, increased generation from renewable energy sources is expected to reduce the generation shares of both coal and natural gas. In July 2017, projected generating capacity from utility-scale solar and wind plants is 57% and 10% higher, respectively, than in July 2016.
The EIA article seems to suggest that utilities can just switch back and forth between coal and gas depending on the price. It has been my understanding that plants are either powered by coal or by gas, but not both.
So I am doing some research.
Fuel Switching Is Not So Easy: “Unfortunately, owners of coal-fired power plants cannot easily switch fuels. A coal boiler is designed to burn coal, not natural gas. Even if a coal plant was modified to accept natural gas, the resultant fuel efficiency would be horrible and production costs would remain elevated.”
“Finally, it is not only about fuels. It is also about efficiency. Most coal-fired power plants use inefficient boiler technology. They convert the energy in coal to steam energy, reconvert steam energy into mechanical energy and reconvert mechanical energy into electric energy. Every conversion costs energy, and as such, boiler technologies are inherently inefficient.
In fact, EIA reports the average US-based coal-fired power plant has an efficiency of approximately 10,500 Btu per kilowatt-hour. The multi-step process of converting coal into electricity loses almost 70 percent in the process. Until they can harness coal gasification, the coal industry is hopelessly tethered to inefficient boiler technologies.”
There are fuel-switching plants designed to burn either coal or NG, but they have to be specifically designed that way in advance. Most are powered by only one or the other and have to be expensively retooled to convert them. Now you know. 🙂
Current supercritical and ultra-supercritical steam boiler technology, if applied to new coal-fired generation plants, can achieve efficiency in the 40-45% efficiency range, which is a heat rate of about 7,500-8,500 BTU/kWh. The problem is that these require VERY large power plants to justify the high-installed cost, they are essentially locked in as base-load as they are very slow to modulate, and you’re still burning coal, looking at train delivery, with the various emissions issues, plus higher GW emissions, plus the ugly mines.
Natural gas, on the other hand, can achieve 50-59% efficiency with 68,00-5,800 BTU/kWh heat rate with much smaller, more flexible combined-cycle gas turbine power plants. More efficient, less-expensive fuel. Locate the plants locally without the same long-distance HV distribution issues, you don’t need a major train line nearby as you have pipeline fuel delivery, fewer emissions, interface better with renewable.
The power industry is seeing this as a dead-flat no-brainer. Get rid of coal for a whole lot of reasons. Politics is less and less of a factor – if NG is available, it will win, hands down. Coal will see a resurgence only after we’ve burned up all the cheap and even the moderately-priced NG.
“The EIA article seems to suggest that utilities can just switch back and forth between coal and gas depending on the price. It has been my understanding that plants are either powered by coal or by gas, but not both.”
In Germany and Austria, the utilities have indeed an excess generation capacity, therefore, they can shift from coal to NG and back. That is the reason NG lost 1/3 of its market share within the last few years.
They are outfitted to burn either gas or coal?
According to this graph, it doesn’t look like Germany’s coal fired electricity production is growing at the expense of natural gas.
boomer,
However the plans in Germany are to increase the share of coal at the expense of natgas. Germany wants to become independent from Russian gas. Environmental considerations play here a minor role.
I was responding to this.
“In Germany and Austria, the utilities have indeed an excess generation capacity, therefore, they can shift from coal to NG and back. That is the reason NG lost 1/3 of its market share within the last few years.”
So I was asking if their power plants can shift back and for from coal to gas at will.
And according to the chart I posted, it looks like from 1990 to 2015, coal hasn’t cut into the amount of gas used for power generation. Renewables, on the other hand, do appear to have increased while coal use went down.
“If winter temperatures end up warmer than forecast, natural gas prices would likely stay low, which would reduce the incentive to use more coal-fired generation.”
While I know that temperatures locally can be higher or lower than the norm, presumably the trend will be for warmer year-round temperatures, so that should also favor natural gas according to this analysis.
Winter 2016-17 Outlook: Weak La Nina May Bring Colder Temperatures to the East, Dry Conditions in the South | The Weather Channel: “Winter 2016-17 may bring colder-than-average temperatures to the East early on, but this winter may end up warmer than average overall, according to an outlook released by The Weather Company, an IBM Business. …
Last winter was the Lower 48’s warmest December-February period in the 121 years on record, according to NOAA’s National Centers for Environmental Information.”
“Because coal costs vary widely across regions, relative fueling costs in particular markets may differ significantly from national averages.”
In particular, the West Coast has no coal; the Southeast has no coal; New England has no coal; New York has no coal; New Jersey has no coal. The good coal in Pennsylvania and West Virgnia was mined out a long time ago, leaving permanently high coal costs, and the big cities are a long way from the WV and KY coal mines anyway.
So the West Coast and East Coast megaregions see very high coal prices, thanks to transportation costs. They’re not switching back to coal.
The Midwest and the plains east of the Rockies, see much lower coal prices, so they might prefer coal over NG. However, they’ve also got extremely cheap wind power, which is driving out coal.
Nathanael,
The West Coast is indeed without much coal, except for Washington state. Washington is a green, concealed-carry state that hosts the Centralia power plant, west of the Cascades, 1340 MW, burning sub-bituminous coal from the nearby Centralia strip mine originally but now using Powder Basin sub-b. railed in from Wyoming or maybe Montana. (Both are beautiful states, by the way.)
OK, OK–it’s true that the Centralia plant is due to close down in two stages, the first in 2020 and the second in 2025, and that there will be no coal-fired power plants in the state after that. There’s lots of hydro and wind.
‘the data show that nine fossil-fueled states, all won by Trump except Colorado, have not yet whittled their coal fleets enough to meet their 2024 emissions goals.’
Geez, so the other 41 states have already met the “Clean Power Plan” 2024 goals. I happen to know the trend in Colorado (massive wind and solar procurements combined with overall reduction in electricity usage) and I don’t think they’ll have any trouble either. I don’t think there’s going to be much pressure to stop the Clean Power Plan. But I do wonder what the other 8 states are.
Further quote:
‘Megan Berge, a Washington attorney who represents power companies, says they’re abandoning coal primarily because wind and solar prices have dropped by more than two thirds in the Obama era, while gas prices have hovered near historic lows. Federal tax credits for renewables and state mandates promoting renewables have contributed as well. Obama’s new carbon rules, designed to accelerate the clean-energy trend, haven’t had a chance to do much.
‘“There’s a lot of excitement about rolling back the Clean Power Plan, but as a practical matter, the impact on power generation should be minimal to none,” Berge said.’
And the biggest money quote:
‘Florida Power & Light just agreed to pay $450 million to buy a coal plant for the sole purpose of shutting it down and escaping an expensive power contract; it’s replacing the electricity with new solar plants.’
What I am concerned about the environment and climate change, it is much easier to avoid the politics and belief systems by sticking to the economics of energy.
Depletion industries tend to die out in time, often because the depletors poorly manage their resources and use them all up. We’ve seen problems with both fishing and timber. The industries protest regulations, but when they have a free hand, they tend to go for short-term profits and damage their own industries.
Coal is, in part, suffering the consequences of running out of supplies in some areas.
The oil industry has only itself to blame for the low prices. Drill, baby, drill is not a good strategy to keep prices high.
And in Plains states farming will suffer when the Ogallala Aquifer runs dry.
Hi Boomer II,
Maybe there will be a silver lining to a Trump presidency.
The fossil fuel insiders (Koch Brothers et al) have argued that the over regulation of the fossil fuel industry is the main reason that the US has not been able to achieve energy independence. Though an objective analysis would show that the US is producing more energy now than during the Bush administration.
The coal industry is suffering because the natural gas industry is producing so much natural gas that prices are very low and the oil and natural gas industries are also suffering because they have over produced and driven prices to unprofitable levels, it has very little to due with government regulation, as I believe you have argued persuasively.
The perception on the right is that the government is the source of most evil in the World (along with the radical terrorists), they seem to believe that Trump can magically enable both high profits and low prices in the US energy industry.
They will be very disappointed unless there is a massive increase in the subsidies received by the fossil fuel industry, maybe reducing tax rates to zero for fossil fuels and having the renewable energy industry pay higher taxes so the fossil fuel industry can compete. 🙂
Producing electricity with coal is very expensive, maybe we will need to subsidize those coal power plants as well.
I’m going to resend my analysis to Trump, showing the USA can stay in that Paris agreement by rationalizing obama’s rather dumb plan, encouraging gas, and taking credit for reduced emissions in Mexico which result from increased use of natural gas in that country which results from small amounts of USA economic aid (the USA can simply cut $2 billion a year in military aid to Israel and use it to create incentives to build pipelines and gas turbine power plants in Mexico).
CPN, Calpine Energy, uses natural gas to fuel its power plants.
The share price is 11.63 usd. It has a price to earnings ratio of 208.
11.63/.055 = 211. I invested 12 dollars and the return on the investment was almost 6 cents!
A p/e ratio of 10 is a stock price of 55 cents. A price to earnings ratio of 20, the price is 1.10 usd.
If the price of natural gas goes wild, Calpine will probably go through bankruptcy again like they did circa 2005. Inexpensive natural gas will keep them going, but the share price is too high right now. Expensive natural gas will make them go belly up.
Any good power company with coal-fired power plants has a price to earnings of less than 25, much better earnings, a portfolio from investments, core companies, which include wind power, pays a dividend, and doesn’t have to worry if it will go broke or not.
Mongolian Mining just re-opened a coal mine in September.
http://www.mining.com/mongolia-readies-revive-giant-tavan-tolgoi-coal-mine/
Coal is a good energy source and a resource to be reckoned with. 95 percent of Mongolia’s electricity is produced using coal.
https://energypedia.info/wiki/Mongolia_Energy_Situation
In addition, over 40 percent of the world’s energy produced is from coal.
Coal, the second source of primary energy (roughly 30%), is mostly used for power generation (over 40% of worldwide electricity is produced from coal). In addition, coal is used to produce virtually all non-recycled iron. Coal is abundant, affordable, easy to transport, store and use, plus free of geopolitical tensions; all these attributes made it very popular. On the other hand, pulverized coal plants are the most carbon-intensive source of power generation, and this is a real issue, as CO2 emissions need to be dramatically and urgently reduced. Whereas more efficient plants are built across the world, the transition from subcritical to supercritical (and ultra-supercritical) technology is very slow. And even worse news is that the dramatic reduction of CO2 emissions that our climate targets require is possible only through development of carbon capture and storage (CCS) technologies. Progress on CCS is very disappointing.
http://www.iea.org/topics/coal/
Right now, much maligned coal is the bargain priced commodity and energy source. The iea says it will continue to do the job it can do.
Going to need oil to get the new coal-fired power plant built in Mongolia that is going to provide electricity for Mongolians.
http://www.prophecydev.com/projects/chandgana-power-plant/
In other words, coal is set to increase the supply of electricity.
While there might be more coal being mined in other parts of the world, the US industry is in decline. In fact, if other countries develop their own sources, then there should be less reason to import coal from the US.
India and China have both made policy decisions to phase out coal due to local air pollution issues.
Maybe some countries like Mongolia will add coal power plants, but this is insignificant.
“India and China have both made policy decisions to phase out coal due to local air pollution issues.”
Only in relative terms. Absolute consumption is not expected to decline.
from Reuters:
China to cap coal at 55 percent of total power output by 2020: NEA
Mon Nov 7, 2016
http://www.reuters.com/article/us-china-power-consumption-idUSKBN1320LT
China aims to cap coal-fired power capacity at 1,100 gigawatts by 2020, higher than the current ceiling but accounting for less of the country’s total power supply, as the top global energy market seeks to increase the use of cleaner renewable fuels.
Announcing its five-year plan for the power industry, the National Energy Administration (NEA) on Monday said China aimed to have 2,000 gigawatts of electricity generating capacity by 2020, of which at least 320 gigawatts, or 16 percent, would come from solar and wind power and 110 gigawatts from natural gas.
That would bring China much more in line with current power generation mixes in the United States and the European Union, where installed renewable capacity – excluding hydro-power – stands at around 22 percent and 10 percent, respectively.
As part of its long-term plan to shift to clean power, the NEA said China will eliminate or delay at least 150 gigawatts (GW) of coal-fired power projects between 2016 and 2020.
While the new ceiling for coal is up from 960 GW in a previous five-year plan for the period to 2015, it will bring down coal’s share in China’s total power mix to more than 50 percent from over two-thirds.
“It is not easy to cap coal power capacity under 1,100 GW. If we don’t take measures, I believe the capacity will go beyond 1,250 GW,” Huang Xuenong, director of the power department under NEA, told reporters at a briefing.
———————————
Meanwhile:
Revival in China’s thermal coal market fueled by flagging hydropower generation
November 11, 2016
http://blogs.platts.com/2016/11/11/revival-china-thermal-coal-market-fueled-flagging-hydropower-generation/
China’s electricity generation from thermal coal jumped sharply in September, registering a 12.2% year-on-year rise as power plants on the Asian country’s eastern and southern coastal flanks, boosted their consumption of imports from Australia and Indonesia.
The surge in China’s consumption of thermal coal for power generation has led to a renaissance in the Asian seaborne thermal coal market that few market analysts had predicted when the market had been mired in the doldrums in the first half of this year.
———————————–
China’s state planner urges coal mines to speed up output hikes: sources
Tue Oct 25, 2016
http://www.reuters.com/article/us-china-coal-output-idUSKCN12P10C
China’s state planner urged coal miners to speed up the pace of output increases to tame the historic spike in prices at a meeting on Tuesday, two sources said, the latest sign Beijing is worried about dwindling supplies ahead of the winter.
At a hastily called meeting with 16 coal miners, the National Development and Reform Commission (NDRC) told producers they should increase supplies to the market as soon as possible, a source who was at the meeting and a source who was familiar with the contents of the meeting said.
Nathanael,
It’s correct that China looks to cap total amount of coal consumed, and that’s good news. What rarely gets mentioned, that I can see, is that China builds coal-burning plants in other countries. A year ago I looked into that and found that there were 92 being built or on the drawing board. It would be nice if they were state of the art but I don’t expect that, and hope I’m wrong.
A major one was under construction next door in Vietnam, which used to be a coal exporter.
Interesting. China does like to build stuff in other countries (industrial export mercantilism)
The USA has the world’s highest coal reserves. Other countries simply lack the geology, or already mined most of their coal.
Hi Fernando,
If one looks at USGS reports, the actual proved coal reserves in the US are only about 30-40 billion short tons, far less than the 250 Gt often reported which are “demonstrated resources” much of which is too expensive to produce.
Let’s assume World Coal “reserves” suffer from the same problem, that number is about 900 Gt, but if only 33% is actual proved plus probable reserves that can be mined profitably at current prices then proved reserves fall to 300 Gt.
There is far less coal that can be mined profitably than many believe, much of the resource is in thin seams (less than 2 feet thick) or is too deep (more than 500 meters deep). Estimates range from 500 Gt to 1200 Gt of 2P coal reserves with a best guess of 990 Gt (Mohr et al 2015). URR is about 175 Gt higher as that is cumulative coal output through Dec 2015.
If there is less world coal than has been reported, and utilities know this, then they have reason to find alternatives as soon as they can.
I am definitely seeing more industry and news reports that US coal does not have a rosy future.
AlexS. In response to your question about low volume wells.
I looked at those wells of Parsley Energy. The first production dates range from the mid-1970s all the way to 2013. They are vertical wells.
My view on Spraberry Wolfcamp is that the wells will produce economically for a long time, but low volumes. Just driving through the areas, one sees idle pumpjacks all over the place. However, the wells are not shut in, they just need time to fill up, as Mike says.
The horizontal wells are just able to produce so much more oil early on, but so far it looks like declines will be as steep as the vertical wells. To me, Bakken wells hold up best.
There will likely be at least 100K Hz Permian wells drilled in the next few years, maybe more. Vast area, and they will drill on tight spacing. Do not know how sold I am that there are 8 economic producing zones.
Given US capital access, these wells will be drilled, so I am hoping OPEC acts and targets a $55-65 price.
Yes, the Permian Basin shale oil plays have now guaranteed lower prices for much, much longer. In the absence of OPEC action (and I am still skeptical of that) the key to predicting the future of shale oil in America now is capital access. Shallow has it bolted down. Costs don’t matter, oil prices don’t matter, profitability does not matter; its all about funding. So, in my mind it becomes an issue of what direction interest rates go and is the American public willing to ignore CEO bonuses, private jets, multi-millionaire royalty owners, bankruptcies, debt failures, etc. from the private sector, for the benefit of lower gasoline prices and the greater good of the public. The massive amount of debt the shale oil industry can now NOT service, and the billions more that is being added each month, will not simply disappear up a flare stack…somebody someday will pay the price for all this so called, “shale miracle.”
“Costs don’t matter, oil prices don’t matter, profitability does not matter; its all about funding.”
Good point, Mike.
Funding is one of the pillars of the shale business model.
I would add, debt (absolute amount) does not matter, if funding is available.
As regards interest rates, even now they reach 8-10% for some shale companies. If and when the Fed rises rates, what would be the cost of capital for those companies?
Yeah, I don’t see the funding continuing…I know there’s a sucker born every minute, but after a while, the suckers don’t have money any more. I don’t see even President Trump literally printing money to hand it to bankrupt shale oil companies, though I suppose it’s possible.
Crystal ball issues:
1) Infrastructure spending COULD get interpreted to fund shale (retire debts) and pretty easy to spin that into a double plus favorable whammy of energy independence plus infrastructure jobs. Who would complain (other than those who did not borrow)?
2) The non political, impartial Federal Reserve almost certainly hates President Trump’s guts, so if the deficit goes from presently 600B to 1.2 Trillion, they may not be interested in QE, amid an aura of “normalization of rates” as their excuse why not. QE is reserved only for Democrat administrations, they will say to themselves, and when Trump takes office it’s time to take rates to 6% from 2%, and watch that 4% delta add $800B (20T debt) to the deficit. This is important . . . the Fed can print anything it wants to, but if it doesn’t want to, we’re screwed. Sort of like OPEC not wanting to sell oil to the US in 1973. Spigots that get closed create devastation, and make no mistake here. It’s largely whimsical.
3) The GOP enthusiastically voting for first tax cuts (sure) and then a debt ceiling rise (not sure, ugly fight), followed immediately by an explosion in govt spending and deficit? Nope. No way. Repeal Obamacare, day 1, yup. Announce the strictest possible interpretation of immigration regs, yup. Get a huge spending program thru fiscal conservatives? Nope. Pass it with Dem votes to help? Goodbye Paul Ryan. It is absolutely not clear any of these stimulus articles mean anything.
Thanks Shallow sand,
As I understand there is a lot of conventional production (vertical wells, from high-permeability zones) in Spraberry. It seems that opex there is not too high, even in the case of stripper wells.
But when horizontal wells with long laterals producing tight oil become stripper, with 10 b/d or less output, opex should be much higher. Am I right?
AlexS. I think it depends. Mike could give a better answer.
My concern would be work over of a horizontal well bore.
Vertical wells fill up with solids over time. I assume horizontal well bores do too. I assume “cleaning out” the solids in the lateral portion of the well bore would be very difficult.
Also, I wonder about casing issues in the lateral portion. Is collapse common?
I would be very interested in hearing from those who have expierence with older horizontal well bores.
EOG’s grandiose policy is to design a rod lift well that goes five years without pulling. With few exceptions they actually only go about a year. The oldest wells in the EF are now getting pulled twice a year, once a year for holes in tubing, typically a $35K plus job, More with problems.
Casing collapse is not unheard of at all. Scale, iron sulfide, paraffin and frac sand or problematic. CT washouts are a very easy way to spend $100K.
Ask me if I would buy 35 BOPD rod lift shale oi….NO!
shallow sand, Mike, thanks again for explanations
AlexS. I think Pioneer (PXD) broke out LOE for their vertical wells, in order to advertise $2 LOE for their horizontal Permian wells.
As I recall, around $12 per BOE. Note, that is BOE, not BO. Further, I wonder what that includes? I assume it may not include thing such as tubular, Rods, down hole pumps and other repairs which may be capitalized instead of expensed.
I would think $20-$25 would be more like it for low volume wells that are 7,000′-10,000′ deep. Because the wells do not make much water and pump intermittently, repairs may not be as often as what Mike describes in EFS.
Pioneer operates over 6,000 vertical Spraberry trend wells. However, that is not the focus of any investor presentations.
I do think the horizontal wells are more cost effective. They cost more, but recover much more oil early on, which is apparently the name of the game.
We are getting far enough into the process that Freddy could think about a chart showing Texas shale production XX years into production.
I remain surprised at how in the Bakken 2008 wells look just like 2013 wells 18+ months into production, despite entirely different well characteristics like length, proppant type, geographic location, etc. Does it look like that in Texas too?
shallow sand,
Horizontal wells are more cost effective at the early stage, but how they compare with vertical wells when they are 10-years old and produce 10-15 b/d?
AlexS. I was referring to horizontal wells in the Spraberry trend only. I think those were costing $1.5 million +/- to drill, complete and equip vertically.
Time will tell which are better long term. However, I suspect Hz Spraberry trend wells will win out.
Best solution is to drill vertical, complete Spraberry and Wolfcamp fracked and commingled. Put the pump below the bottom perf, and hook up the casing side to the flowline. Don’t drill directional unless you really gave to.
Coal may become a symbol of what Trump can’t do.
A Bleak Outlook for Trump’s Promises to Coal Miners – The New York Times: “And these days, no matter who is president, coal is at the mercy of market economics. Coal’s No. 1 rival is cheap, cleaner-burning natural gas — which could become an even more potent competitor under the incoming administration. The probable easing of restrictions on pipeline building and loosening of rules on gas exploration and production would mean more natural gas reaching the market.”
This guy is going to want to keep his promises. He’s not a politician. He doesn’t know any better.
He could get regulations thru Congress prohibiting use of natgas in power plants. He COULD do that if that was what it took to get coal use up. It may not make engineering sense. It may not make economic sense. It may not make environmental sense. But if it keeps a promise, that is a huge incentive to do it.
Obvious rejoinder . . . then why did he make such a stupid promise? To win the presidency? Pretty good reason. Ask the coal miners if it’s stupid. It’s a bit like people automated out of a job. Increased efficiency means nothing to them, sitting at home too old to retrain, and Collecting Benefits. It suddenly becomes unclear if automation is a step forward if it creates Benefits burden on society. Ditto the coal guys.
This guy is going to want to keep his promises. He’s not a politician. He doesn’t know any better.
Are you serious?! Have you even looked at his business record and long list of bankruptcies and failures? He is a con man and rip off artist!
http://money.cnn.com/2016/05/27/news/trump-university/
The ads for his university were classic Donald Trump — Trump stares into the camera and proclaims:
“We’re going to have professors and adjunct professors that are absolutely terrific people, terrific brains, successful. We are going to have the best of the best… and these are people that are handpicked by me.”
But a CNN investigation finds that Trump and others involved in the school admitted under oath that some promises made to students just didn’t happen.
There is plenty of evidence of Trump not keeping promises.
Hi Watcher,
They could pass a law requiring all coal to be mined with a pickax and shovel, yeah that will create a ton of jobs. 🙂
Here’s my thought.
The coal industry, particularly employees of the coal industry, do not have the clout that other industries do. Does Trump really want to increase coal at the expense of natural gas?
And utilities are using more renewables. If the tipping point in support of them hasn’t come yet, it might soon enough.
The economics don’t favor either encouraging more coal use or getting more petroleum out of the ground faster. Trump and Congress could do it, but that might mean throwing money at coal and petroleum rather than at other industries, and might actually mess up the economics of energy industries and their pricing.
I’ve been posting so many coal articles to show that most close to coal (industry people and politicians in those states) know the game is declining for coal. The people Trump has conned appear to be either those who don’t understand coal but have bought the anti-regulation propaganda or those in Kentucky who are so desperate to hang on to their jobs that they hope he will be their savior.
Some folks may have objected to all that fracking, but it did what it was supposed to do: kill off coal. The next step is to reduce natural gas use via less consumption and alternatives. People have long claimed that they will switch to renewables when it makes economic sense. Perhaps it will at some point. Not a 100% switch, but using it when/where it can work for utilities.
The discussions about the oil industry are interesting, too, because the economics are such a powerful force. Too much cheap oil right now. Eventually only the expensive stuff.
I don’t see why anybody in this forum should think Trump is actually planning on putting the domestic coal industry back on its feet.
He is not exactly a role model when it comes to telling the truth, but he is no doubt smart enough to understand that dirt cheap gas means coal must sell for peanuts, and I can’t see him asking for subsidies for coal, when he plans on doing away with subsidies for wind and solar power.
My money says the coal people who voted for him are in for a rude awakening.
He will gut some environmental regulations, but that won’t fix the coal industry.
“He’s not a politician”
He is now. The guy said he believes Obama founded ISIS. He meant it literally. He must have a very cynical view of his fellow countrymen if he’s willing to say such foolish things in order to attract votes. From what I can tell Trump thinks Americans are fools. I suspect keeping his campaign promises is pretty low down on his TTD list.
http://www.cnn.com/2016/08/11/politics/donald-trump-hugh-hewitt-obama-founder-isis/
Obama did fund ISIS. When the Syrian revolt started the USA encouraged it and gave money and weapons to Sunni rebel groups riddled with Isis sympathizers. These guys took the USA weapons and cash and diddied to the ISIS side.
A lot of what Trump thinks comes from very sound information sources, and very savvy advisors. Most of the conventional wisdom you guys are fed is neocon propaganda. And this is why the USA can’t get out of the quagmire. The neocons are mostly focused on the “what’s better for Israel” as defined by Netanyahu. What’s really interesting is too see how Trump has been willing to stand up to them. Maybe the USA has hope after all.
ferdinandinandio said:
BWAHAHA !!!!
What a loser mark falling for a known grifter.
Fernando- are you just hateful, or also fascist? I understand it is possible to be one without the other, but it is hard to tell.
Hickory, I’m peaceful, nonviolent, anti war, pro human rights, and somewhat libertarian (I’m ok with abortion, legalized pot, the right to own a .306 caliber rifle, gay marriage and the teaching of evolution in schools).
I suggest you try sticking to the subject itself rather than trying the insults. Your approach makes you look like you are newly released from high school, but I’m sure con can do better. You just need to try harder.
Nando said:
“I suggest you try sticking to the subject itself rather than trying the insults. Your approach makes you look like you are newly released from high school, but I’m sure con can do better. You just need to try harder.”
A deflection. You said Obama funded ISIS. That is a horrible smear, on the level of Trump.
It is more accurate to say Bush funded Isis. Remember how wonderful “The Surge” was? It was “The Surge” that created Isis. Right wingers have been projecting onto Obama what Bush had already done! Typical. They will also tell you with a straight face that Obama caused the economic collapse, chronology not one of their strong suits.
Boomer II,
Something that’s been going on during Obama’s administration, that I haven’t seen mention of in the news media I bump into, is the expansion of facilities on the Gulf Coast for exporting coal. Such terminals have been stopped in the Pacific NW but by no means along the Gulf.
My vaguely informed guess is that Appalachian coal would prove to be too expensive to work on the world market but the Powder River Basin stuff and possibly coal from the Illinois basin would be exportable at a profit. The US does export coal, mostly to Europe; in fact (going by memory here) in 2014 the US exported about four times as much to Europe as to all of Asia, India and China included. Coal has a future in much of the world; if Trump wants to build up the US coal industry then it would seem to me that the best idea would be to do it for export.
I just did some searching. Looks like US coal exports have been declining. And prospects don’t look good for a rebound.
‘The Prospects for Coal Exports Are Dimming, but Politics Have Little to Do with it’ – Institute for Energy Economics & Financial Analysis : Institute for Energy Economics & Financial Analysis: “Exports were widely viewed as a lifeline for the United States’ contracting coal industry as recently as 2014. Some analysts predicted mines in the western U.S. could annually ship up to 200 million tons to Asia, or roughly half of what Wyoming’s mines produced at their peak in 2012.
Slowing economic growth, a worldwide glut of coal and high shipping costs have clouded the picture since, leaving Indonesia and Australia better positioned to compete in Asia’s contracting import market.”
The Bible, mazamascience, shows uptick in US coal exports, and global consumption flattish, maybe a tiny decline.
Of course if coal price is low that must mean there is a coal glut as evidenced by increased coal storage in coal tanks.
Boomer II,
We see here the ever-present focus on AsiaAsiaAsia. I mentioned that the US had been exporting four times as much coal to Europe as to the whole of Asia including Chia and India but we hear AsiaAsiaAsia. In 2014 the US sent more coal to Morocco than to China but no matter.
Eastern Asia (which is what these folks mean by “Asia”) is a huge market, yes, but Indonesia and Australia are right there in the neighborhood. The US coal industry would have to look elsewhere (Latin America, Africa) to boost US coal exports.
not the mechanism
go to mazama and scope china and india coal production
I don’t know enough about this to know what published data to go by. However, my impression continues to be that there is little Trump can do to prop up the coal industry other than to pay them subsidies or somehow force utilities to burn it.
Trump pledges US coal revival; world's energy authority begs to differ: “IEA sees little opportunity to boost the U.S. coal industry through exports. It forecasts the three-year decline in U.S. coal exports will continue as consumption in China declines, shipments from Mozambique crowd out American coal in Brazil and Europe, and Colombia wields a price advantage in the shrinking European market.
U.S. coal exports fell 23 percent in 2015 and had fallen another 32 percent through the first six months of this year, according to the U.S. Energy Information Administration.”
The USA could try a program to provide economic aid to countries such as Jamaica and Haiti, to gave them build clean burning high efficiency coal plants coupled to some wind and solar to help their economies and create jobs in the USA. The aid could be via Exim Bank loans, and a government backed coal sales program with a 30 year commitment.
I went through the 2015 annual reports for seven companies that supplied 52% of the ND Bakken flow in December 2015 by Enno Peters’ data: Whiting, CRL, EOG, Oasis, WPX, Newfield, Hess, and QEP. Splitting out ND crude reserves is a bit complicated, especially for EOG and Hess, as NGL gets lumped in and often the lacation is only split down to countries, not basins. Where I couldn’t get exact data I prorated reserves against reported basin flows for December 2015.
Overall these companies report 1.03 Gb of proved developed and 0.91 Gb of proved undeveloped for Bakken. Prorating by flow would give 2 Gb and 1.75 Gb for all producers.
It is noticeable that these companies report combined negative reserve revisions from 2013 through 2015 of -0.1 Gb, -0.3 Gb and -1.13 Gb. This would suggest to me they don’t have realistic probable reserves (or if they do they only just balance over estimates in proven reseverves). Note these figures are for total USA crude and have fairly big error bars – I couldn’t break out Bakken only figures for most companies.
There have been some extensions and additions but overall reserves have fallen faster than just that expected due to production. I’d expect reserve subtractions to continue this year as well. They may come back with higher prices or the companies may just be able to use the price dip to cover up some overoptimistic original estimates.
With about 0.4 Gb produced this year I’d estimate a maximum of about 3 Gb +/- 15% remaining. I think the profile will likely look like the Barnett shale – a flattening out to a plateau sometime next year for a few months as permit applications decline to zero and then a fairly slow exponential decline as drilling fades away.
George,
I think proved reserve revisions mainly reflect lower oil prices
Maybe – but there were write downs already happening in 2013. If you go through the accompanying letters with the reports they sometimes report the split due to price and other factors – where stated price is quoted as around 50 to 70% of the impact. With 1.5 Gb revisions for all USA (and some of that is NGL as well) it might represent 0.5 to 0.7 Gb reduction for price in the Bakken. I think it will never come back and probably will go the other way because they overestimated initially – easy to get away with it as no one had seen a Bakken well run to end off life when they started out (and still not many). @016 reports might give a better indication as there hasn’t been such a big price change overall this year.
Hi George,
If the average ND Bakken well produces 300 kb over its life and there have been about 11,000 wells drilled so far that would be about 3.3 Gb, about 1.9 Gb of ND Bakken/TF C+C has been produced to date and at the end of 2014 about 1.2 Gb had been produced. At the end of 2014 there were about 6 Gb of Bakken proved reserves with maybe 5 Gb of those in North Dakota(ND). Typically probable reserve are about 50% of proved, suggesting 2P reserves of 7.5 Gb.
If oil prices rise in the future to $80/b and remain at that level or higher for 15 years or so (which is likely if there is a plateau and slow decline in output from 2016 to 2030 without a recession like 2008/2009), then even if no more reserves are added in the future we would see a URR of 7.5+1.2=8.7 Gb.
If we assume future wells will see a gradual decrease in EUR then the average EUR of future wells might be 250 kb. To produce 8.7-3.3=5.4 Gb would require 21,600 more wells to be frilled for a total of 34,000 wells.
Coincidently the USGS F95 TRR estimate is about 9 Gb for the ND Bakken/TF, so based on the USGS analysis this is not a very optimistic estimate.
So you are basically saying all the companies are underestimating their reserves?
Hi George,
You get about 4 Gb for proved, the EIA reports about 6 Gb, perhaps your methodology gives inaccurate results or the EIA reports are wrong, I don’t know, just reporting the EIA proved reserve data for the Bakken LTO. The probable reserves are usually not reported either in the 10k or by the EIA, but for the UK North sea it has averaged about 70% of proved reserves over many years (for C+C+NGL), I used 50% to be conservative.
The data suggests about 320 kb for average well EUR in the ND Bakken, about 11,000 wells have been drilled since Dec 2007, early wells may have been a slightly lower EUR so using 300 kb we would get 3.3 Gb if no more wells were drilled and roughly 1.9 Gb of that has been produced, leaving about 1.4 Gb of PDP reserves in ND Bakken, which is roughly in line with your estimate as about 80-90% would be in North Dakota with the rest in Montana. I expect more wells will be drilled in the future and the number will depend on many factors including oil price.
My WAG is about 20k to 24k more wells if oil prices rise to $85/b or more and stay at that level until 2030.
Dennis – the UK is all offshore conventional oil and cannot be used as an example for non conventional on shore. Almost all the revisions to higher numbers happened early in field development, not after the peak, and were applied mostly to undeveloped reserves. Your 50% number is not conservative, it is wrong.
I looked a while back at CLR’s PDP bookings in the Bakken for 2015. You can back into the number from the change in PDP, production, and the number of completions in the Bakken. From what I remember the number was about 180,000 BOE added per completed well in the Bakken. I think they have had to use lower estimates given what they are experiencing from past wells.
Art Berman says:
Permian Giant Oil Field Would Lose $500 Billion At Today’s Prices
Did you hear about the largest U.S. oil and gas field that’s in the Permian basin of west Texas?
That’s the one that’s not a field because it hasn’t been discovered yet. That’s the one whose 20 billion barrels are an estimate by the U.S. Geological Survey. That’s the one whose 20 billion barrels would lose $500 billion at today’s oil prices.
The USGS says it is: undiscovered, technically recoverable resources. That is, that oil has not yet been discovered, but they think it is probably, or likely, it just might be there. 😉
Great link. Art Berman buried the lead there, though. Based on his calculations, it looks like that field doesn’t become profitable until oil hits $70/bbl. Which is impossible to maintain. It would mean average $2.59 gasoline in the US.
At that price, the economics of switching to a plug-in car become quite overwhelming almost everywhere in the US, and more overwhelming in the rest of the world (which typically has higher gasoline prices), so gasoline demand would drop very quickly.
So the field *will never be profitable*. Guaranteed.
I found an excellent gas/ hybrid/ electric cost comparison tool from UCDavis-
http://gis.its.ucdavis.edu/evexplorer/
btw- for real world analysis, the average time/tier weighted price of retail electricity in california (pg&e) is 24 cents/kwh. Using a lower number is ‘greenwashing’.
From Berman’s article in Forbes:
“According to the USGS’ input data, it would take 196,253 wells to produce the 20 billion barrels if it exists [only 3,000 wells have been drilled so far – AlexS]. At $7 million per well, that would cost almost $1.4 trillion in drilling and completion costs alone.
It would cost more than $1.4 trillion to produce $900 billion in revenue resulting in a net loss of $500 billion at $45 oil prices excluding all operating expenses, taxes and royalties.
That’s a discovery that no one can afford to make.”
AlexS. I said above over 100K Hz wells in the Permian. Looks like what I said was realistic, per USGS.
I also agree w Mr. Berman, cannot make $$ on most of them at $45 WTI.
I note rig count has been increasing in the Permian since we came off the 2016 lows.
It appears to me the only way to stop these wells is for the WTI price to drop back below $35. Even then, some will be drilled and completed.
I see 11,516 Hz wells completed in all Permian (TX and NM) (all formations) with first production 1/1/2010 or later. Of those, 5,353 produced under 1,500 BO in 9/16. 3,401 produced 3,000 BO or more in 9/16. Almost 500 of the wells have been inactive for 12 months or more.
OPEC can’t afford sub $35 oil, nor can most other producing countries.
Producers who want to avoid dilution or debt can’t afford sub $35 WTI either.
From Oil and Gas Journal:
Texas can’t ‘swim’ in oil that hasn’t yet been discovered
By Bob Tippee
Editor
11/18/2016
http://www.ogj.com/articles/2016/11/texas-can-t-swim-in-oil-that-hasn-t-yet-been-discovered.html
Texas now “swims” in 20 billion bbl of crude oil that the US Geological Survey has “discovered” in the Pennsylvanian-Permian Wolfcamp shale of West Texas.
So report newspapers about the USGS’s first evaluation of continuous resources in the Midland basin shale.
Oil & Gas Journal readers know swimming in the subject of this evaluation won’t get the Lone Star State very far.
That 20-billion bbl datum represents not even a bucketful of physical oil. It’s an assessment of the mean undiscovered, technically recoverable resource.
From outside the oil and gas industry, the concepts here can be perplexing. Even in the industry, words like “resources” and “reserves” fall victim to occasional abuse.
But doesn’t the adjective “undiscovered” hint strongly that the number relates to something other than a fluid in which anything, let alone a state, might “swim?”
At least that article didn’t report, as several others did, that USGS had “discovered in West Texas one of the largest reserves of recoverable oil in the agency’s history.”
In fact, the USGS discovered no oil at all.
The agency performs many valuable services, but exploration, an activity essential to discovery, is not one of them.
For assessments such its whopper on the Midland basin Wolfcamp, USGS instead studies geology, applies scientific theory, and postulates accumulations of oil and gas outside known deposits.
The resulting technically recoverable, undiscovered resource in this case has a 95% chance of being greater than 11 billion bbl and a 5% chance of being as high as 31 billion bbl.
Those numbers do not indicate reserves, which cannot exist before discovery.
Anyone writing about these matters should know that or learn it in the course of, for example, asking logical questions about the “undiscovered” modifier.
Alas, the article with the swimming metaphor in its headline compounded the error by reporting that the oil is “just sitting there.”
Worse yet, it appeared in the leading newspaper of a major city in Texas, where people really should know better.
What I haven’t understood about these announcements is why anyone would want to do this during a period of low oil prices? Seems like suggesting there is even more oil just waiting to be drilled would keep prices low.
I can see a company wanting to do this to boost its own stock price. Or politicians trying to claim oil will be with us forever so that there isn’t more effort to switch to fuel efficient vehicles.
But overall, the industry doesn’t need to hear there’s lots more oil available.
Hi Boomer,
Maybe the industry wants to counter those crazy arguments that oil output will peak and then decline at some point in the near future (or past for C+C output possibly). That way people will keep buying those big SUVs and will ignore those silly golf carts like the Tesla Model S (which can outperform one million dollar super cars in zero to 60 MPH acceleration tests.)
At $90 per barrel, high grading to recover 10 billion barrels, it looks viable. Thus it looks like Prudhoe Bay. This means buying a Holiday Inn in Midland and putting a BBQ restaurant next door would be a good investment.
Norway was up 385 kbpd C&C in October versus September. No wonder the price isn’t moving up. Goliat back on line (and still ramping?), Aasta Hansteen starting up as well. There isn’t so much next year or 2018 though so a probable decline after December until Johan Sverdrup ramps up in 2021.
http://www.npd.no/en/news/Production-figures/2016/October-2016/
That should be Ivar Aasen. Aasta Hansteen and Gina Krog are next year with total 100 kbpd total.
Norwegian liquids production recovered m/m by 0.49 mb/d to 2.10 mb/d in October, higher y/y, by 75 thousand b/d. The m/m recovery in crude output (+0.32 mb/d) came as several large fields returned from planned maintenance, while the 0.1 mb/d Goliat field started up again on 27 September
https://www.energyaspects.com/publications/view/2016-11-18-norway-oil-data-oct-2016
Argentina: talk of lowering the price of oil. Avg price of all produced blends now $61. It would fall to $50s.
But there’s this:
Madalena Energy Inc, a Canadian exploration and production company that holds nearly 1 million acres in Argentina, said in a statement on Thursday that the price it would receive for its crude in November and December would fall by about 30 percent.
. . .
Madalena said it had been working on selling assets, but the other buyer withdrew as a result of the oil price reduction.
Govt decree. Cost them a sale.
Govt source says no such decision has been put into place. Oil production rose slightly in 2015 and YTD is up a smidgeon.
Lynn Helms on prospects for the Bakken production next year.
Not too optimistic:
Bakken Breakevens Improving, But Permian Tough to Beat, North Dakota’s Helms Says
November 18, 2016
http://www.naturalgasintel.com/articles/108487-bakken-breakevens-improving-but-permian-tough-to-beat-north-dakotas-helms-says
North Dakota faces increasingly stiff competition for investment capital from the burgeoning exploration/production activity in West Texas unfolding in the Permian Basin, according to North Dakota’s chief oil/natural gas regulator, Lynn Helms.
Speaking on a monthly webinar to report the state’s latest oil/gas production statistics, Helms identified competition with the Permian as the latest in a series of economic and regulatory hurdles that are causing Bakken producers to hold off greatly ramping up production next year. He now thinks the big push may be put off until 2018.
“Like it has since the 1930s, the Permian appears to be the best place in the U.S. to produce oil,” said Helms, director of the state Department of Mineral Resources.
Breakeven price points have become more favorable in nearly all of the Bakken producing counties, prompting a prediction that a dozen rigs will be added to the state’s current 38 next year, Helms said.
“That’s great news on the break-evens, but the unfortunate thing is that those price levels are now competing with not just the Eagle Ford, but also with SCOOP/STACK and the Permian Basin.”
Helms characterized the prospects for next year as “slow growth,” even with the expected 12 additional drilling rigs. “We really don’t know what 2018 holds, but if OPEC’s projection is accurate that global prices only rise by $5/bbl next year, there won’t be a lot of rigs added in 2018,” he said.
On the improvement in break-even prices, Helms called out one county, Dunn, for “rising to the top” with help from the recent additions of gas processing and gathering infrastructure. That allowed ConocoPhillips and XTO crews to start a new high-volume, slickwater hydraulic fracturing (fracking) rig with what Helms described as 40 to 50 stages.
“Those rig results were fantastic with the wells coming in at 200-300 b/d better than other county wells, and they have a lower gas load ratio, so the Dunn County economics were given a real boost,” Helms said.
Prospects under the President-elect Trump’s administration are likely to be another stimulus to production, but that is counterproductive to prices being increased, according to Helms who noted that to get sustained $60/bbl prices U.S. oil production needs to drop by 1.5 million b/d. “We’re not likely to see a million-and-a-half drop in production with 5,000 uncompleted wells in the U.S. inventory and the new administration committed to making it easier to drill and frack new wells.”
New pipelines, such as Dakota Access, will also help stimulate production, but all of that will tend to keep prices down, so Helms is convinced the nation is facing a situation he calls “lower for longer” time periods in terms of commodity prices.
In September “Helms said North Dakota is only one or two months away from dipping under the 1 million b/d production level, and the state’s revenue forecast for next year is built around production levels at the 900,000 b/d level — not the one million b/d. “I think that is clearly the direction we are headed,” he said.”
http://www.naturalgasintel.com/articles/107833-bakken-production-activity-trending-downward-north-dakota-official-says
Bakken breakeven estimates by county from the NDIC most recent presentation
Fascinating. That’s one low number in Dunn. I believe around $30/bbl or below, gasoline starts becoming price-competitive with electricity for fueling cars.
This will change as the midstream-downstream infrastructure goes bankrupt and shuts down but that’ll take a while.
More lies from the shale oil industry. $26.00 dollar breakeven prices are absurd. $43.00 gross WH prices less $8.00 transportation and marketing fees, less $2.60 per barrel production and ad valorem taxes, less $5.00 per barrel royalty, less $8.00 OPEX, less $3.00 G&A, less $5.00 interest expense = . Besides, what is the point in breaking even when you owe 4 billion dollars of debt and 25% of your quarterly net revenue goes to interest expense?
There should be zero rigs running in North Dakota, not 34.
Alex,
I was quite surprised to hear his comments about Dunn county. So far in the data I don’t see a sharp increase in new wells, or well productivity there.
Enno,
I was particularly surprised by NDIC’s estimate of breakeven oil price in the Dunn county. $16 is not realistic, in my view.
It is true that oil production there was the most resilient among Bakken core counties:
it has peaked only in September 2015, while the peak in McKenzie and Mountrail was in December 2014, and in Williams in May 2015.
Declines from peak are: 31% in Mountrail and Williams, 28% in McKenzie vs. “only” 17% in the Dunn county (all numbers are ex confidential wells). But 17% is still a significant decline.
Oil production in North Dakota by county (kb/d)
source: NDIC
In 2014, before the drop in oil prices, the number of active rigs drilling for oil in Dunn county was 20-25 vs. 65-70 in McKenzie, 35-40 in Williams, and 30-35 in Mountrail.
The most recent Baker Hughes data is:
McKenzie – 14
Dunn – 10
Williams – 5
Mountrail – 2
Other – 3
Again, drilling activity in Dunn county was the most resilient in the Bakken, and the number of rigs has recovered from just 4 in May to 10 now.
Williams,
Bakken oil rigs by county
Do you know the rules for holding leases – i.e. how long before they must be drilled or released? There are occasional rigs in the non-core counties that drill one well for a company and then go away again which might be for lease holding rather than production. It’s also noticeable how rigs have dropped of in Mountrail, even though there are still many permits there (in September 307, after Dunn at 401 and Mackenzie at 758 and ahead of Williams at 258 – I can’t be bothered to download the data base file gain to check current but they won’t have changed by more than 40 or so each). Does Mountrail have a lot of non-core acreage?
I might have partially answered this myself (I didn’t know before that Excel charts only show the chosen filtered data, which is quite useful). Below show Mountrail drilling, DUCs and permits. All DUCs and drilling locations are pretty well within what I call the core, but about 60% of permits are outside. There is actually a smaller proportion of care acreage than for the other main counties and it was drilled earlier so maybe closer to the limit.
Thanks Alex,
“I was particularly surprised by NDIC’s estimate of breakeven oil price in the Dunn county. $16 is not realistic, in my view.”
Yes, I would also love to see the calculation behind that; but my impression is that these are numbers provided by operators, and not something the NDIC calculates.
Another comment I found very surprising is from Rystad, from their latest Shale Newsletter :
“At the end of 2014, there was a requirement for 850-900 new wells per month in order to keep the production flat. The balancing number has decreased to 450 wells, due to improved well performances and natural deceleration of the base decline from already producing wells as a result of the drop in activity. ”
450 wells per month is about 15 per wells per day. Apparently Rystad estimates that each well adds about 4m bo/d / 15 = 270 kbo of UR (in other words, 15 wells a day will lead to a long-term steady state output of 4 million bo/d). That average UR is quite a bit higher than I would estimate, especially as Rystad is including more wells from gassy plays.
There are some cracks beginning to show in the official wall of denial of the reality of peak oil.
https://www.bloomberg.com/news/articles/2016-11-22/the-tesla-shock-global-gasoline-consumption-has-all-but-peaked
The official projections are still for growth for the oil industry, but at least the bureaucrats are now acknowledging the reality of the electrified automobile.
In the past week I have seen articles quoting coal industry people that coal won’t be coming back, articles saying oil prices will be staying low so there is little reason to pump up supplies, and that EVs and renewable energy are gaining and are a factor in lower demand for coal and gasoline.
We’re reaching a tipping point and it will be hitting just as the GOP says they want to rollback all sorts of regulations. But the economics are favoring lower carbon options. So do you suppose they are going to realize that increasing petroleum production right now will only further lower prices, and that even if coal regulations disappear there is a declining market for coal, and that other countries see the potential of the EV/solar markets even if conservative politicians don’t?
Also, does it really matter if they don’t believe in climate change if the markets themselves are moving toward less carbon use?
Another thought occurred to me. Trump seems to favor appointing people who will eliminate EPA regulations and increase fossil fuel supplies. The thinking seems to be that increased energy supplies will boost the economy. But maybe it is like finance these days. Lower interest rates didn’t really lead to a worldwide economic boom. And excess energy production may not lead to an economic boom.
I personally think converting more of the country to renewable energy and expanding EV options would likely create more jobs, but I don’t think Trump and his inner core will go there unless they decide there’s too much money to be lost if they don’t promote those developments.
But maybe we will see if there are limits to economic expansion even with cheap fossil fuels. Are economic forces such that companies don’t want to add workers even if energy costs are low? And if workers don’t have jobs, that puts a damper on their resource and energy consumption.
Here’s another article saying what is coming out from both the fossil fuel industry and from environmentalists. The shift has begun and is picking up momentum. There won’t be another boom for fossil fuels, and if there will be a boom of some sort, it will likely come from new energy sources and technologies.
What this article adds is that for Trump to set policy like it is still the 1950s, it opens the door for China to fill the vacuum. True, China hasn’t phased out fossil fuels yet, but if they can take the lead with renewables and EVs, they can set the agenda in a way that a backward US cannot.
The World Unites Behind the Green Economy—Most of It Anyway
From the article -“Refiners would be wise to target distillates such as diesel in lieu of gasoline as they grapple with fading consumption, said Michael Wojciechowski, vice president of Americas oil and refining markets research at Wood Mackenzie Ltd. in Houston.”
“Diesel seems to be almost like a utility fuel going forward,” Wojciechowski said. “It’s got its ability to meet a lot of strategic objectives for refiners.”
I seem to recall a chart by Jeffrey Brown that indicated that the current and projected make up of crude “oil” [too light] will not allow for more diesel. Am I wrong?
Hi Clueless,
I have seen several references to the apparent fact that the very light crude that typically comes from tight oil fields is short on the size molecules that make diesel fuel, meaning that in order to get a GOOD diesel yield, a lot of extra processing would be necessary.
Existing refineries are apparently not built to do this, and would have to be extensively rebuilt, or new refining capacity built from scratch, to convert these smaller molecules into the larger ones that are diesel.
This is going to be expensive in both capital and energy.
Sorry I don’t have links, I didn’t save them.
I’m sure any of the guys who are hands on will agree on this, since it seems to be common knowledge.
So, diesel prices will go up and this encourages gasoline engines. It’s not the end of the world.
Or we can make dimethyl ether from natural gas and use it in diesel engines. It’s viable if we can lubricate the valves with a bit of diesel (I think).
Traveling away from my bookmarks.
The chart shows a collapse of middle distillate (kerosene (jet fuel) and diesel) content in API 40 and up oil. Further, the avg API of flowing oil on the whole planet today is relentlessly rising, and this was happening even before shale started flowing.
A big part of the problem is Libya. Their oil has twice the diesel content of KSA oil (and at about the same API). That’s an interesting tidbit. Middle distillates aren’t the same % for two batches of oil from two different places, both with same API density.
But regardless of locale, when you hit 40 (upward), you crash your diesel content.
Interesting quote from Euan
“But where will investors be looking to value Aramco? Reserves are one metric very difficult to tie down. Production statistics are easier but I have found it strangely difficult to find summary production stats for peers like ExxonMobil and Shell. Here’s a very rough guide gleaned form various sources.
ExxonMobil 4.3 Mbpd
Shell 3.7 Mboe/day
Chevron 2.7 Mbpd
Total 2.1 Mbpd
Total = 12.8 Mbpd
And market capitalisations:
ExxonMobil $349 billion
Shell $219 billion
Chevron $207 billion
Total $140 billion
Total = $915 billion
And then if we look at Aramco we find:
Production 12 Mbpd
Anticipated capitalisation $2000 billion
Houston we have a problem!”
http://euanmearns.com/the-aramco-ipo-and-the-black-art-of-estimating-oil-reserves/
What counts is dividends. This in turn depends a lot on the tax regime. I wouldn’t touch Aramco with a 10 meter steel pole.
Fernando
PDVSA
Just went in to default.
http://www.wsj.com/articles/venezuelas-pdvsa-misses-404-million-payments-on-bonds-1479768989#
It’s not a real default. They have 30 days from last Friday to pay up. And I hear they will.
Maduro is going to extremes to encourage a rebellion so he can go ahead and jail, murder, and terrorize the population. I hear the Cuban dictatorship is going hard line to hang on to power (which they hold via Maduro, their puppet).
Since Obama/Hillary won’t be around to help Castro and Maduro in 2017, they are getting very antsy to trigger a rebellion and pull Erdogan’s method. Some of what I’m seeing would make you vomit. And yet the USA media hides it from you.
Told you guys. Venezuela has very very very little national debt. They don’t borrow money. Probably part of why they are hated externally. The banks can’t control them.
http://www.tradingeconomics.com/venezuela/government-debt-to-gdp
That looks like it has grown sharply, to 50%. (1/2 US levels).
But it hasn’t particularly. GDP has fallen. That drives that graph. Not debt levels.
Venezuela has very high debt, given the current conditions it’s nearly broke. The statistics you show simply fail to capture problems it has with non payment to suppliers (several tens of billions of USD).
Those generalized statistical sites have problems measuring GDP because inflation is running at over 500% and they have multiple exchange rates. The bolivar just hit 2400 to the dollar in the black market.
Furthermore, the economic crisis is so acute the three largest plants making corn flour are now closed because there’s no hard currency to buy corn.
A lot of what we are seeing is the intentional destruction of the economy, coupled to gross human rights abuses, and actions to goad the people into a rebellion. This strategy wa given to Maduro by Raúl Castro, who wants a rebellion so he can proceed to muder or jail the opposition leadership, and anybody who dares try to oppose what’s going on. The Castro regime is showing it’s perfectly capable of committing genocide to keep control of Venezuela.
Hopefully Obama will vanish over the horizon and president trump will be more forceful defending Hunan rights.
Subject for next post?
http://coyoteprime-runningcauseicantfly.blogspot.com/2016/11/trump-we-are-banning-saudi-oil-from.html?m=1
So in essence Trump wants to raise the price of oil in the US and lower it everywhere else?
One person’s take on it.
Trump’s empty threat to stop buying Saudi oil: Kemp – Middle East Monitor
Trump is showing some signs that he might not be as scary and unreasonable as he looked while campaigning, for instance having said already he is not going to pursue HRC, which is really teeing off some of his most ardent supporters, and he is talking about maybe saving part of Ocare.
He is also talking a softer game when it comes to climate etc.
This is to be expected, because it is a general rule that you run hard to the right or left to get nominated, and then back towards the center to get elected.
The electorate was so divided this last election he correctly judged he should not do that for the election, and so has put it off until afterward.
He is scary as hell, but I suppose he is not completely brain dead, and realizes that NOW he has to actually perform , instead of throwing molotov cocktails.
Hopefully he intends to soften up enough to allow the fires in the hearts of the people who hate him to cool down somewhat. Otherwise he hopefully understands that there ARE enough RINO’s and D’s in congress, and in judges robes, etc, that he may be deadlocked.
If he wants to get relected, and keep the majorities he has in Congress, etc, he sure as hell better do this, because next time around, the D’s aren’t going to run on identity politics, but rather on the immediate concerns of their working class core voters, and they aren’t going to run a candidate with the highest negatives in party history.
The next candidate will not make the mistake of assuming the working class people in the rust belt will “stay on the plantation” and support a candidate who supports agreements that are apt to result in even more industry moving overseas, even if the candidate flip flops on that sort of talk in the months immediately before the election. etc.
Trump will be fair game now even to people at Fox, who after all are always looking for more readers, more ad revenue, etc, and in four years a whole lot of folks my age are going to be GONE, while a whole lot of Sanders type kids will be registering to vote.
Maybe I am just enjoying a happy daydream in saying this.
We almost all of us gave the Clintons a free easy pass when they told such fibs as being flat broke, remembering racist arson of churches when still a kid, etc etc.
SOME of what any politician says can be safely discounted as intended only to make their supporters feel good for a moment.
I have never defended Trump, but if he does do anything I think is upright and useful, I will say so.
For now all I will say for him is about the same as what I have said about one of my redneck relatives, who hopefully will be too old when he finally gets out of the pen to create any problems.
I defend him to the extent that I tell people he could not possibly have done even a third of the things he has been accused of, because he would have had to work like hell twenty four seven to do even a third, and I know for a fact that he took a week or two off once in a while, lol.
I point out that he has been in jail for the last seven or eight years, while the things they are blaming on him have mostly happened in the last four or five years, lol.
Trump has to work with one hell of a lot of people he could ignore up until now so maybe he won’t be as bad as some of us expect. Maybe he won’t have time enough to totally screw everything up, because it takes a while to make things happen in Washington, even if you have all three branches , and he has only two, for now at least.
I hope.
One thing he MIGHT do that would be useful in my estimation is along the lines of what Reagan did when he called the old USSR what it WAS , in plain language.
He could use the bully pulpit to force the people of the western world to face up to the sort of governments, and the sort of people who compose those governments, that predominate in the part of the world I refer to as Sand Country.
Cutting off their revenue stream at the knees would be very hard on the common people in those countries, but it this consideration has never stopped us from embargoing Cuba, for instance.
If they had NO MONEY, and they WOULD HAVE NO MONEY, except for selling oil, then radical Muslims would be busy scratching out a living, rather than exporting revolution.
( ( Note I do realize that the vast majority of Muslims are peaceable and agreeable people. Likewise the vast majority of white southern Christian males do not actually go ’round burning down churches or have anything favorable to say about such things, or even beat their wives. We let a few loudmouth partisans lead us around by the nose when it comes to listening to such bullshit, because it suits the partisan agenda. )
And IF we could break our addiction to oil, and especially IMPORTED oil, we could safely and do some MAJOR pruning of the military industrial complex that is sucking up so much of our own money, with nothing much to show for it, except if we actually have to use it.
If we and the rest of the Western world weren’t hooked on oil, the only time Sand Country news would make the front page would be when some lucky archaeologist makes a major new find, lol.
It looks as if copy cat so called reporters and journalists have made a fool out of me, in that I read all the headlines about Trump softening his positions, and was encouraged to believe it is so, because I want to believe it.
Reading the actual interviews leads me to a different conclusion.
They really do just make stuff up.
And then call others fake news.
I think they are more than a little scared. He doesn’t seem to need them. There are online streaming sites of far right and far left people who intend to compete with CNN, Fox, ABC, NBC etc. They are talking about viewership that is growing sharply. It is they who would get the press credentials the WH staff may yank from these others.
I was watching a far left site (The Young Turks) sneering at them. “How can there be celebrity journalists? How can that make sense? How can you pay someone $10 million a year to read text? Well, to hell with them. They can keep their 68 yr old demographic. We will end them. We will take over the DNC and never take a PENNY in corporate donorship!”
Sure.
The right wing sites (like infowar.com) are wacko in the other direction. They seem to be pretty sure the DNC has infiltrated all telephones and everyone who dies at any time was “targeted” by Democrats and “suicided”.
I did searches to see if either of them talk much about oil. They have no clue at all. It’s just a handwave about evil Big Oil or rotten regulatory restrictions that prevent oil independence.
But they both hate the mainstream of journalism and both scream about the bias. TYT say it drove people to Trump. infowars say they’re all controlled by the DNC.
How two unemployed guys got rich off Facebook, fake news and an army of Trump supporters
https://www.thestar.com/news/world/2016/11/21/how-two-unemployed-guys-got-rich-off-facebook-fake-news-and-an-army-of-trump-supporters.html
Saw this article in the Toronto Star yesterday (originally from the Washington Post.
The upshot is that these guys sit around their apartments and think up stories to post on Facebook that will make rabid Trump fans click on them.
Solely to get the ad dollars.
No facts required.
-Lloyd
Citizen Cause
Decentralized front-line citizen journalism with smooth, sharp on-the-second/realtime-streaming aerial footage? There are many, and likely increasing numbers of, people flying drones as a hobby in any case, perhaps many who sympathize with citizen causes of various sorts.
Old centralized mainstream corporate media would appear unable (sometimes unwilling?) to compete with this, unless they can successfully crowd-source. They would seem better at/off continuing to, say, cop-chase and attend press briefing room Q&A sessions where they can continue to function as status-quo-propaganda spokespeople.
Digital Smoke Signals
Dakota Access Pipeline protest drone footage
BAU would seem to need oil for awhile longer for pseudorenewable buildout, but what with ‘arterial’ protests and bombings, this may prove to be increasingly problematic for the purveyors of greenwashed BAU.
This is an interesting interview regarding Trump and the beltway crowd.
Trumps trajectory appears to be towards Hertiage Foundation. He’s going for the Reagan look.
Here’s the interview link.
https://s3-us-west-1.amazonaws.com/patreon.posts/11943910540206093587.mp3
Check out Wat Need on Patreon. Lots of free content.
For OFM
https://www.patreon.com/posts/radio-war-nerd-7283779
A review:
http://peakoilbarrel.com/bakken-production-choke-theory/
Two years ago at this time oil was at 67 and 68 dollars.
Oil is doing all it can to stay in the upper forties on this Thanksgiving holiday.
More info on the Bakken:
To date, the best Bakken producer along the “Fairway” is a vertical well which has produced over 300,000 barrels of oil (BO) since its completion in 1985, and was still flowing 170+ BOPD as of the end of January, 1990.
http://archives.datapages.com/data/mgs/mt/data/0044/0020/0020.html
Got to be some more of those out there in other places in the Bakken.
Those are “fly paper wells”. They hit a thin, very long sand channel with meanders, or a beach bar sand that looks fairly skinny but produces like crazy. That type of well gets surrounded by a bunch of marginal wells and dry holes. Those are the flies.
About 30 years ago I saw a well that hit basement but the driller kept on drilling and hit a fault rubble zone. As it turned out that was connected to a fat sand located on the faults down thrown side. That well produced 10 thousand barrels of oil per day, and was draining a reservoir the operator didn’t think even existed. So he drilled several dry holes into basement looking for his “magic rubble zone”, and missed the fat sand located about 200 feet away.
Rig count out – USA up 5 (2 oil, 3 gas), Canada down 10. Not very exciting but in line with general trends – gradual increase in USA, level in Canada given seasonal changes there.
Hundreds of Veterans Heading to Standing Rock to Defend DAPL [Dakota Access Pipeline] Protesters from Police
Addendum:
From a practical stand point those protesters have already used violent means to try to enter private property. Most of them are radical bums and communists (I follow their Twitter so I know their backgrounds). Since they come from out of state I’m pretty sure the North Dakota national guard will handle them properly, arrest them, and they will serve a few months for trespassing.
Caelan, you need a wake up call, you are asleep at the wheel.
The water protecters have visited neighboring ranchers’ pasture land and have killed several cattle and buffalo, cattle rustling, killed horses, cut fences, and made life miserable for the surrounding area.
They are not in any way peaceful and have no interest in protecting water or land resources whatsoever.
They are nothing more than outside agitators and are wreaking havoc.
They have the right to peaceably assemble, that is not what is happening.
If necessary, they will be removed by force.
Mexico’s oil production decline is up to 7.8% y-o-y. They might be joining the 10% club with Colombia and China in a couple of months. One third of their production is from KMZ field which is holding on plateau so far I think. But it’s been there for about 8 years now (from memory) and when it drops it is likely to go like Cantarel at up to 20% per year. They need foreign investment but also to find some decent sized new fields, and soon.
~75% drop of drilling rigs? Looks like it will be downhill for some time.
From EIA (https://www.eia.gov/beta/international/analysis.cfm?iso=MEX):
“KMZ, which is adjacent to Cantarell, has emerged as Mexico’s most prolific oil field. Crude oil production nearly tripled between 2004 and 2013, when it reached 864,000 b/d, as PEMEX used a nitrogen reinjection program similar to that used at Cantarell.”