A post by Ovi at peakoilbarrel.
While this post updates Non-OPEC production to January 2020, we are now in late May and the direction for future production for the next few years is clear, LOWER than where it was in March 2020. OPEC, in response to the reduced worldwide demand, arranged for a production reduction through a Declaration of Cooperation (DoC) with OPEC and Non-OPEC countries. Also Canada and Norway have indicated they will be cutting production in response to world wide reduced demand. The OPEC + DoC reduction schedule and chart are shown and discussed at the end of this post.
Below are a number of oil (C + C) production charts for Non-OPEC countries created from data provided by the EIAʼs International Energy Statistics and updated to January 2020. Information from other sources, such as OPEC and recent news reports and country specific sites, is used to provide a short term outlook for future output and direction for a few countries.
Note that Ecuador production has been removed from OPEC and moved to Non-OPEC and all affected charts have been back dated to January 2012.

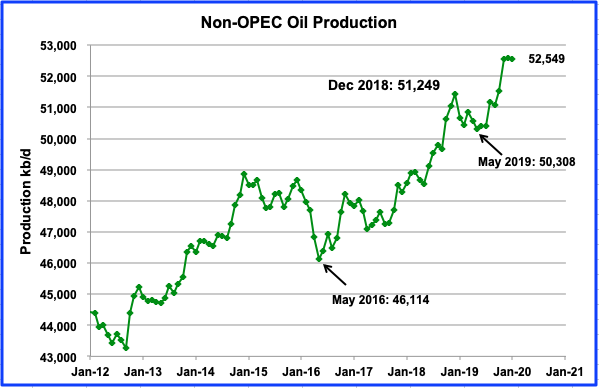
Non-OPEC production was essentially flat from November to January at an average production rate of 52,575 kb/d. January production was 52,549 kb/d and was down by 54 kb/d from December.
Decemberʼs 2019 production exceeded the previous high of 51,249 kb/d reached in December 2018 by 1,120 kb/d. Of this increase, the US contributed 766 kb/d. Smaller gains were provided by Norway, Brazil and Canada.

This chart uses the May STEO report along with the EIA’s International Energy Statistics to project Non-OPEC production out to December 2021. Production is predicted to drop from 52,350 kb/d in March 2020 to 47,193 kb/d in June 2020, for a total drop of 5,157 kb/d. Of the 5,157 kb/d drop, the main contributors are US (1.74), Canada (0.92), Mexico (0.17) and Former Soviet Union (1.77).
In December 2021, output is projected to recover to 50,545 kb/d, an increase of 3,352 kb/d over the June 2020 low. Of the 3,352 kb/d recovery, the contributors are US (0.36), Canada (0.97), other OECD and Non OECD (0.56) and Former Soviet Union (1.47).
The December output of 50,545 kb/d is essentially 2,000 kb/d lower than March 2020. Of the 1,800 kb/d, US December 2020 output is 1,700 kb/d lower than March 2020. The question here is whether there will be a change of strategy/opinion in the US? Will the oil companies and drillers continue to challenge OPEC for supremacy or will they strive to maximize profit and spread out expenses? It is the answer to this strategy/opinion issue that raises the question “Are Non-OPEC’s best days in the rear-view mirror?”
Goldman Sachs also has a perspective on this question. “Goldman Sachs said it has identified a turning point in the oil and gas investment and production cycle that is arriving seven years after the 2014 oil-price peak which signaled the end of non-OPEC growth.”
To this question, add Rystads latest projection for Peak Demand. “Global oil demand hit a record of just over 100 million barrels per day (bpd) in 2019. Rystad now sees demand topping out at 106.5 million-107 million bpd in 2027-2028. The consultancy had previously forecast a marginally higher peak in 2030.
Since all liquids supply was close to 101 Mb/d close to a year ago, where will the additional 6 Mb/d come from now that capex and exploration expenses are being reduced and stretched out?
In addition to the question of how production recovery will proceed, another issue is beginning to emerge. Over the past month, many companies have announced that they will be moving to a “Work from Home” policy in the US and Canada. This will have a significant impact on oil demand in both countries and could slow the rate at which oil companies try to recover lost production. In the May 15 EIA inventory report, gasoline demand was down by 2.6 Mb/d on a YoY basis.
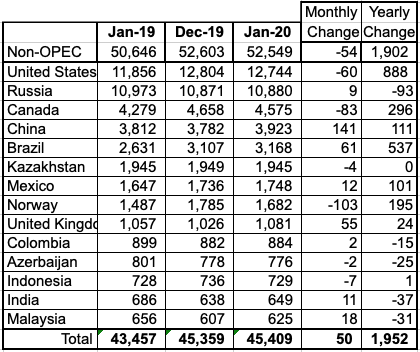
Above are listed the worldʼs 14th largest Non-OPEC producers. They produced 86.4% of the Non-OPEC output in January. Note on a YoY basis, Non-OPEC production was up by 1,902 kb/d while world oil demand was up by 1,000 kb/d.
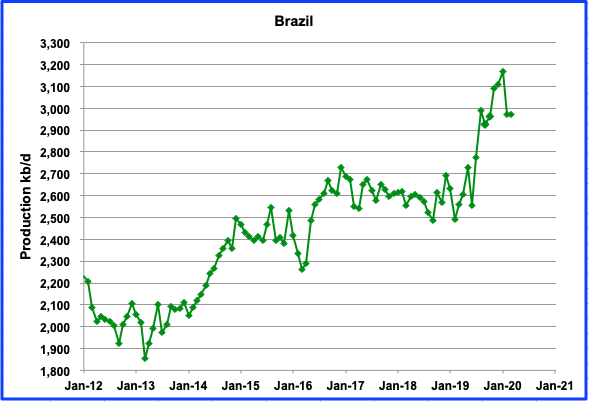
Brazil production peaked in January at 3,168 kb/d. Production data for February and March were obtained from this source where it was reported that output dropped to 2,970 kb/d in February and March, a drop of 198 kb/d.
According to the April OPEC report, “Brazil’s crude oil output in February fell by 0.18 mb/d m-o-m to average 2.99 mb/d as the P-75 FPSO in Buzios operated at just one fifth of its 0.15 mb/d production capacity.” The drop continued in March. No indication was given if the low production was due to technical/mechanical issues with the FPSO.
According to the May 2020 OPEC report, “In early April, Petrobras agreed to reduce its oil production by 0.2 mb/d in response to the contraction of demand for oil and oil-related products. Brazil’s liquids production in 2020 is forecast to increase by 0.19 mb/d y-o-y to average 3.73 mb/d, revised down by 87 tb/d in the new forecast following their stipulation for a cut.”

According to the Canada Energy Regulator, Canadian production will drop by 108 kb/d from December 2019 to March 2020 as shown by the separate red graph. Canadian oil exports are still constrained by pipeline capacity. In March 351 kb/d were shipped by rail, a drop of 61 kb/d from 412 kb/d in February.
On May 23, opponents of the Enbridge line 3 pipeline replacement petitioned the state utility regulator to reconsider its approval of the $2.6 billion project, citing the new different world.
In April a Montana court ruled against permitting the Keystone XL oil pipeline to proceed because the Army Corps violated federal law by failing to adequately consult on risks to endangered species and habitat.
According to this report, Canada’s oil production will be hard hit by the pandemic and will contribute to the DoC negotiated by OPEC and its partners.
“Canada oil sands continue to be the prime victim with 1.14 million bpd of shut-ins in April, followed by Iraq with around 300,000 bpd, and Venezuela with 275,000 bpd. The upstream shut-ins in our tracker primarily include involuntary shut-ins at fields which halted production due to low oil prices, the Covid-19 outbreak, or storage/offtake constraints.”
“In total, we estimate 2Q20 global outages from Covid-19, low prices, and storage constraints at 1.88 million bpd. With oil sands projects like Fort Hills, Mildred Lake/Aurora and Kearl shuttering production, Canada leads the tally with an expected loss of about 960,000 bpd over the quarter.”

China’s production increased by 141 kb/d in January. The increase is due to Chinaʼs oil companies increasing spending and drilling to maintain and increase output.
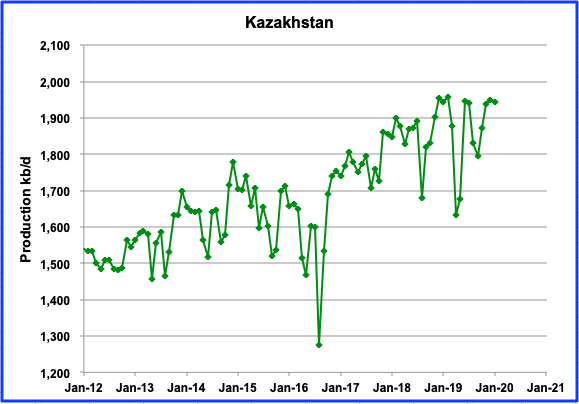
Kazakhstan appears to be on a plateau. From December 2018, production has peaked three times at close to 1,950 kb/d. January 2020 output was 1,946 kb/d. Production should drop in May since they are one of the Non-OPEC signatories to the OPEC DoC.
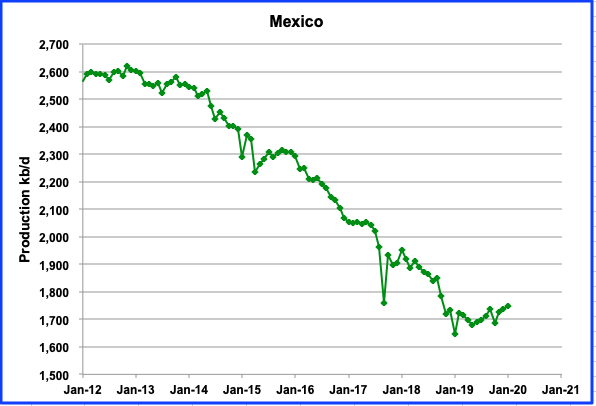
Mexico continues its slow steady output increase. In January production increased by 12 kb/d to 1,748 kb/d.

Norway’s output has been very volatile since December, varying up and down by close to 70 kb/d each month. Output in April, as reported by the Norwegian Petroleum Directorate, was at a new high of 1,809 kb/d, an increase of 74 kb/d over March.
As a result of the pandemic and in cooperation with OPEC + DoC, Norway has voluntarily agreed to cut its production according to the following schedule.
This cut is based on a reference production of 1,859,000 barrels of oil per day. A cut of 250,000 barrels a day in June 2020 thus yields an upper limit for oil production on the Norwegian shelf of 1,609,000 barrels a day in June. (This statement implies that Norway’s output in May will be 1,859 kb/d, an increase of 50 kb/d over April. The increase is probably expected from the newly commissioned Johan Sverdrup field. While their statement is inferring an output rise in May, the chart below, taken from the NPD’s latest production announcement, shows a decline in projected May output, red dots. Am I missing something here???)
“A cut of 134,000 barrels a day in the second half of 2020 will yield an upper limit for average oil production from the Norwegian shelf during the second half-year of 1,725,000 barrels a day”. (This increase is represented by the straight line from June 2020 to December 2020.)
In a statement, the Minister of Petroleum and Energy Tina Bru said that, “We will cut Norwegian oil production by 250,000 barrels per day in June, and by 134,000 barrels per day in the second half of the year. The start of production on multiple fields will also be postponed to 2021. Overall Norwegian production in December 2020 will amount to 300,000 barrels a day lower than the companies had planned. This regulation will cease at the end of the year.”
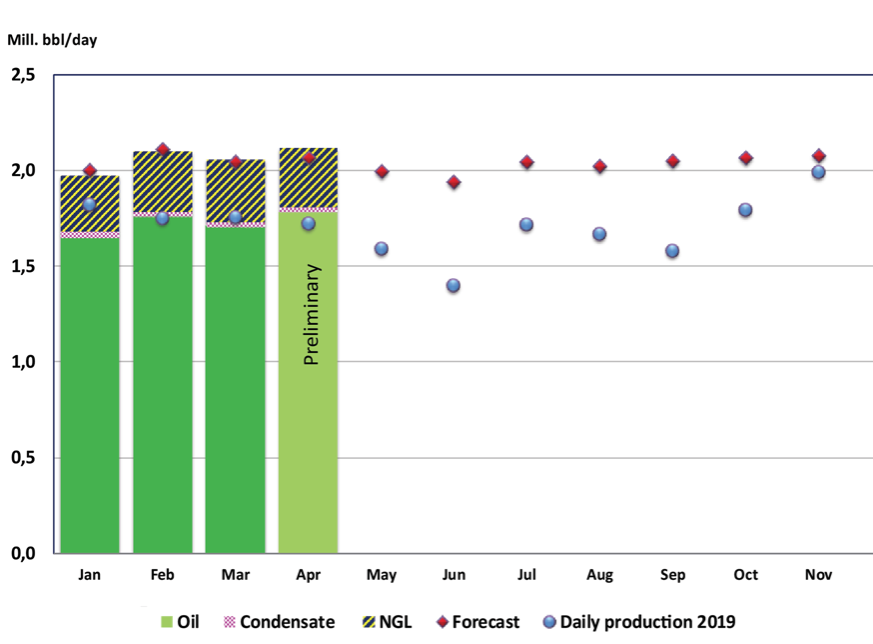
The above chart taken from NPD shows May production dropping.
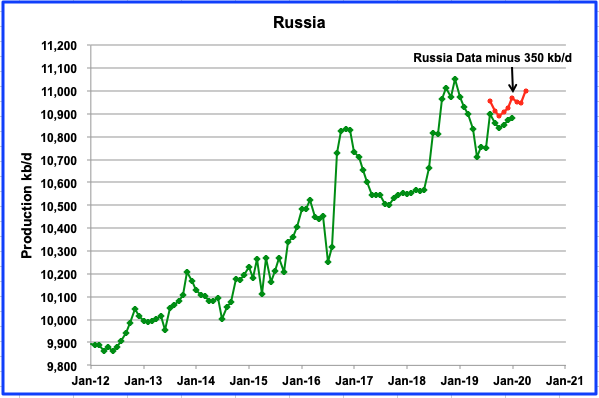
Russian production increased by 7 kb/d from December 2019 to January 2020 to 10,880 kb/d according to the EIA.
Shown in red is a modified version of the oil output as reported by the Russian Ministry of Energy. It is higher than the EIA numbers because it includes NGPLs. The Russian data has been reduced by 350 kb/d to show how closely it parallels the EIA data. It shows an increase of 51 kb/d from 11,298 kb/d in March 2020 to 11,349 in April 2020, an increase of 51 kb/d.
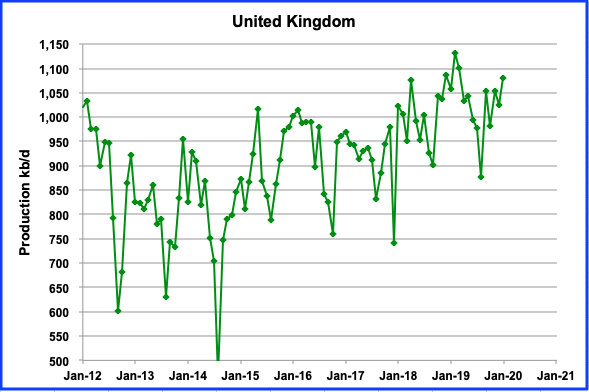
UK output has had an irregular production increase since the August 2019 low of 876 kb/d. January production reached 1,081 kb/d.
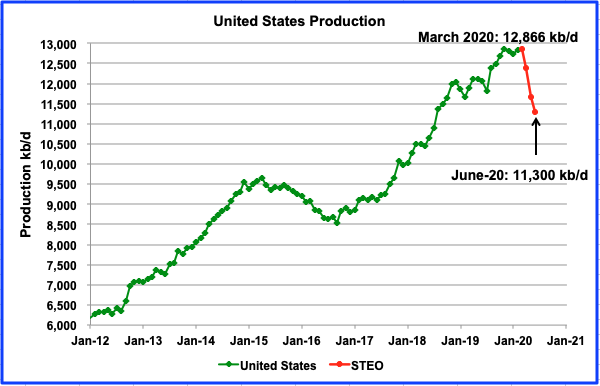
The May EIA STEO report shows US production peaked at 12,866 kb/d in March and then dropped dramatically in April. By June, output is expected to drop to 11,300 kb/d, an estimated decrease of more than 1,500 kb/d.

According to the Baker Hughes rig count, the US oil rig count for the week ending May 22 was 237. This was down from a high of 683 in the week of March 13. This is a drop of 446 rigs or 65%.
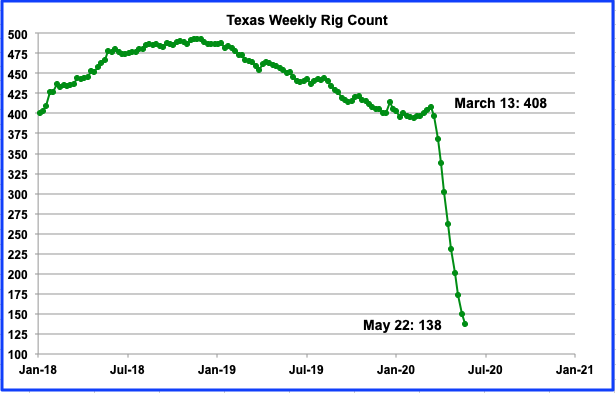
Above is the Baker Hughes Texas rig count for the week ending May 22. This looks like your classic Seneca Cliff. How will oil output follow? From March 13 to May 22, the number of rigs dropped by 270 to 138. For the week, rigs we down by 12, to 138.
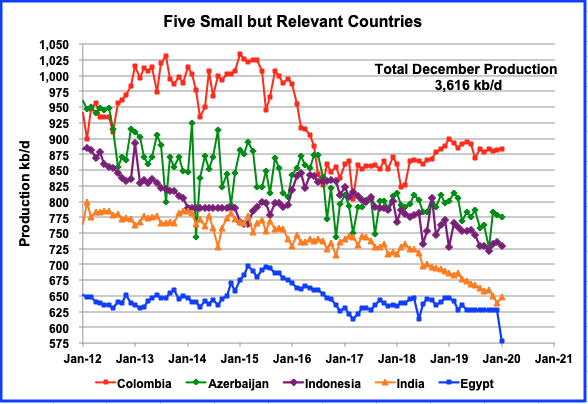
These five countries complete the list of Non-OPEC countries with annual production between 500 kb/d and 1,000 kb/d. All five are in overall decline. Their combined January production is 3,616 kb/d down 34 kb/d from December’s output of 3,650 kb/d. Note that Columbiaʼs production has been essentially flat since August. Azerbaijan, Indonesia and India appear to be in a slow steady decline phase. Production peaked in March 2015 at 4,153 kb/d. Over five years, production has dropped by 537 kb/d or an annual average of 107 kb/d.
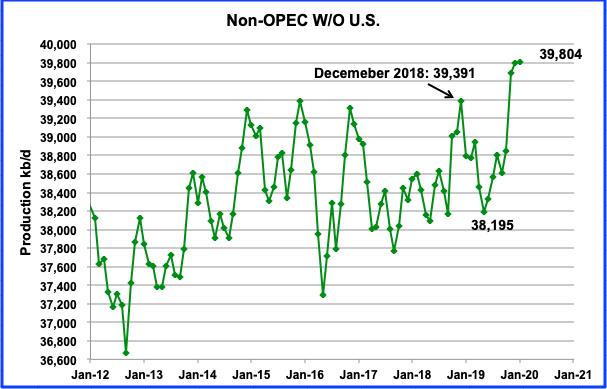
This chart is one of the more critical charts that bears watching. It is providing an early indication that Non-OPEC countries, excluding the US, are very close to an output plateau. From December 2015 to December 2018, peak output remained in the range 39,300 kb/d to 39,400 kb/d. However in December 2019 and January 2020 production reached a new high of 39,804 kb/d. Note that Ecuador has been transferred from OPEC to Non-OPEC and the charts have been been updated to 2012.
The big jump in production to pass the previous high occurred in November 2019. The Non-OPEC countries, excluding the US, added 848 kb/d to push output above the previous high of 39,391 kb/d which occurred in December 2018. It is 413 kb/d higher than the previous high due to the arrival of new oil fields coming on line. Primary contributors were Norway (202), Brazil (126), Canada (163) and Kazakhstan (65). January 2020 output added another another 6 kb/d for a new high of 39,804 kb/d.
It is interesting to note that all of the previous peaks occurred in November and December. 2020 is the first year in which the peak occurred in January.
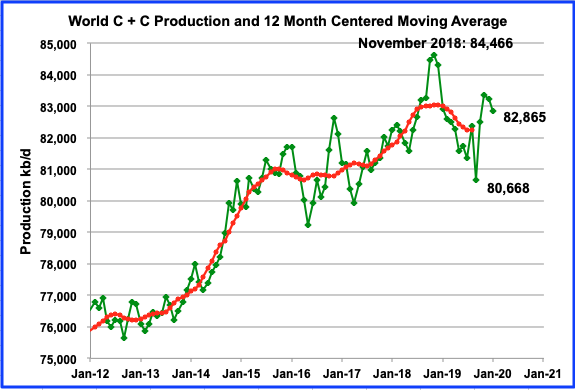
World oil production dropped in January by 370 kb/d to 82,865 kb/d from 83,235 kb/d in December. This puts January output 1,601 kb/d below the previous December 2018 high of 84,466 kb/d. With OPEC adding 1,798 kb/d in April, it would appear that the previous high might be challenged. However production drops from other countries, especially the US, will offset much of the OPEC increase and December 2018 will still retain its crown.
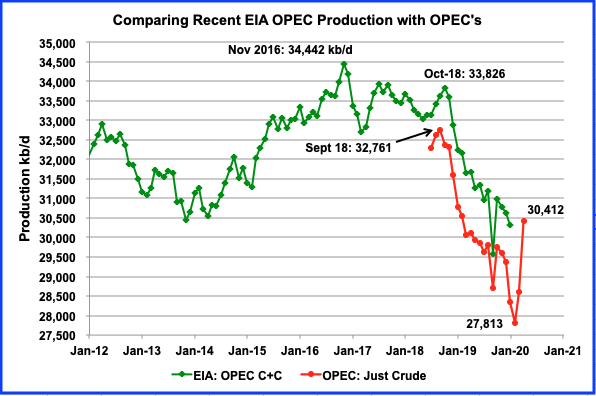
This is a comparison of the EIAʼs estimate of OPECʼs C + C production vs OPECʼs crude output. The EIAʼs estimate is roughly 2,000 kb/d higher, due to the inclusion of condensate. According to the May OPEC report, April 2020 OPEC crude production was 30,412 kb/d and is now down by 2,349 kb/d from the peak in September 2018.
OPEC + Production Cut

OPEC, in response to the reduced worldwide demand, arranged for a production reduction through a Declaration of Cooperation (DoC) with OPEC and Non-OPEC countries. The May 2020 OPEC report outlines the cut that they will implement over the next 20 months and is shown above.
“In response to this sudden and huge market imbalance, OPEC and the 10 non-OPEC participants in the Declaration of Cooperation (DoC), decided to adjust down their combined current production by 9.7 mb/d in May and June 2020, to be followed by a combined reduction of 7.7 mb/d in 2H20 and by 5.8 mb/d for a period of 16 months, from 1 January 2021 to 30 April 2022. Furthermore, on 12 May 2020, Saudi Arabia, the UAE and Kuwait announced that they would voluntarily deepen oil output adjustments from June, by 1 mb/d, 100 tb/d and 80 tb/d, respectively, in an effort to expedite draining a global supply glut and rebalancing the oil market.”
108 responses to “Are Non-OPEC’s Best Days in the Rear-view Mirror”
US oil production drop steeper than expected
US oil production is falling more steeply than expected, forcing analysts to scale back output projections even before a deep plunge in planned upstream spending further cuts supply later this year.
Genscape, a unit of consultancy Wood Mackenzie, said production by May 20 had dropped almost 20 per cent, or 2.3m barrels a day, from a peak of 13.24m in March.
The volume lost already is almost as much as Russia and Saudi Arabia last month pledged to cut in a historic supply deal that begins in June. It will alarm US politicians, including President Donald Trump, who pressured Opec to shoulder production cuts in a bid to push up oil prices so that American producers could profitably keep pumping oil.
Genscape’s latest numbers, based on satellite monitoring and heat sensors at facilities across the US, suggested the biggest reductions were in Texas’s Permian shale — down 1.15m barrels a day — and North Dakota’s Bakken — 480,000 b/d.
Paul Horsnell, head of commodities research at Standard Chartered, said producers had already cut about 1.5m b/d more than official estimates. He predicted output could drop below 10m b/d in the coming weeks, down more than 3m b/d since March.
US dropping by 2.3 mbd in May. What about Jun?
Raymond James totaled announced shut ins by majors and large independents for United States onshore for April, May and June, 2020 and reported as follows:
April – 586,000 BOPD
May – 1,352,000 BOPD
June – 1,433,000 BOPD
The most aggressive of the companies are COP, who will have 420K SI in June, followed by XOM with 320K and CVX with 240K SI in June.
I have read many of the large independents were required to contract barrels ahead of schedule with refiners for May and June in April, so these shut ins should remain accurate.
Raymond James also says at current strip pricing US oil production falls in perpetuity and that there will be a tremendous supply cliff in 2022, even as the investment firm predicts demand will not recover to pre-COVID levels by 2022.
Plains All-American pipeline has reported that over 4.5 million BOPD was shut in as of May 1. Plains is the largest onshore pipeline company in North America. Plains slashed prices for May oil across North America, but reversed course for June. We sell some oil to Plains and lost $6 per BO in May, restored completely in June to pre-COVID basis differential.
Reporting what I have personally observed in a small conventional field, I am not aware of any producer selling any barrels in May. The largest producer SI partially in early April (about 70%) and completely in May. This is about 700 BOPD. Noteworthy is rumor that they will not re-start until NYMEX WTI hits $40.
However, all but two of the remaining producers in our field have reactivated most leases, including us. But spending for several months will be minimal, as none will have ANY income deposited in the month of June. Combined with prices of $26 for March, payable in April, and $14-15 in April, payable in May, these are very big hits. Will take a long time to recover, especially as we do not see prices rising much more in 2020.
I will also note I am shocked at how much our field and some neighboring fields declined YOY 2018 to 2019. Our field had an annual decline of 8.9%! This is the highest percentage decline for our field since the Great Depression.
Other neighboring fields saw similar declines. 7-12% YOY 2018-2019.
There simply hasn’t been drilling in the lower 48 conventional fields for going on 6 years now. Look at the Baker Hughes vertical rig count for US. It has been below 100 for years, and has recently been in single digits. I know in 2019 our field had the lowest number of new wells drilled since 2002.
Assuming demand pre-COVID does not recover until at least 2023, I think Peak Oil is upon us, as there will not be much of a rebound in prices to spur new wells, particularly in the US shale fields. Raymond James is bullish on prices, but they usually are.
What I think could cause a price spike before 2023 is a Democratic sweep in 2020. Shale drilling in Federal lands will cease, meaning New Mexico Permian production falls off a cliff. Also, off shore drilling will cease, meaning the same for GOM. Methane emission regulations from existing wells will kick in, reverting to those proposed by the Obama administration. This will potentially shut in a lot of small company production. However, a price spike in 2021 north of $100 following a Democratic 2020 sweep might make it possible for small producers to comply. It could also be that the Dems might agree to stripper well exemptions, if they realize the impact on small and family owned businesses. The DOE is presently conducting a major study of actual methane emissions from stripper wells, and early reports are that methane emissions are very low from most stripper oil wells. Note, we cannot burn a gas flare from any of our wells.
My concern is what gymnastics the United States government will undertake post 2020 election to keep oil prices low. Consumers in most states have become accustomed to gasoline prices below $2.50. I know many here say there will just be a massive switch to EV with $4.00 gasoline. Maybe. We have discussed how long it will take the fleet to turn over here many times in the past. Add on 20 % unemployment, I just am not seeing massive EV sales anytime soon.
The sentiment in the field I am in has never been lower. 4/20/20 negative oil price was surreal. It shut over 90% of the wells. We shut down production we have owned for over 40 years and that had NEVER been SI due to price. Not in 1986, 1998-99, 2001, 2008-09 or 2016.
The people that have been mocking the Peak Oilers might need to keep quiet for awhile. They will enjoy cheap gasoline for at least another year, but they better hope the Donald wins 2020. Otherwise 11/2018 will be the peak.
Shallow sand,
First it is unlikely that a Democratic sweep that results in a filibuster proof margin in the Senate will occur. So a “sweep” will simply result in the Republicans blocking any proposals by the Democrats in the Senate as occurred throughout most of the Obama administration. In addition, Biden is pretty much in the center, he is not from the far left of the Democratic party.
About 50% of New Mexico’s output is from Federal land, the Federal Government charges only 12.5% in royalties, a rate that has not changed since 1920, New Mexico has set an 18.5% royalty rate on State land, the Federal rate should be the same, or similar to current market rates on private land (perhaps 20 to 25%). This is yet another hidden subsidy to oil and natural gas producers, by charging below market royalty rates on Federal land.
As to how long 20% unemployment lasts depends on how smart reopening plans for the economy are, if not done safely we will see a second wave of COVID19 cases in the fall.
Strangely, Republicans seem in no rush to help state and local governments, by doing so they delay economic recovery and increase the chances of a Democratic sweep (which I think is unlikely). I think the best Democrats can hope for is a Biden win and to hold the House, doubtful the Senate will flip in my opinion, and if it does it will be very close to 51-49. I wonder what happens with a 50/50 split? Not sure if that has ever occurred in history.
Oh a final point, Biden’s claimed policy is no new fracking on Federal land, so I doubt there will be a significant change to GOM development due to a Biden win. The rules will be revert back to 2016 when Obama was President.
Supply seems to be decreasing pretty rapidly, pretty soone the market will be under supplied and stocks will start to draw, maybe starting in August, it probably won’t be apparent until Q4 2020 or perhaps even Q1 2021, so your guess that prices will remain low I would agree with. Perhaps we will see gradual increases in output in 2021 and by 2022 we may see prices start to rise, as by that time the economy may be recovering.
A lot depends on a potential vaccine which might never be realized.
Dennis.
Maybe no vaccine for awhile, if ever, but maybe different strains of the virus, which could be weaker?
I just keep looking at the numbers where I am and in other rural areas. My area doesn’t have the death rates the urban areas do, nor the hospitalization rates.
I have been very disappointed in the statistics that have been reported on this virus. Where I live, each county health department puts out a daily graphic listing the number of cases total, number of active cases, number of recovered cases, number of deaths, total number of tests and number of tests pending. They also report ages in ten year increments. They also report total and current hospitalizations.
We don’t seem to have these statistics available thought the US. Nor do we have co-morbidity stats regarding hospitalizations and deaths throughout the US that are easily accessible.
In any event, oil demand will continue to pick up IMO. Americans are pretty much through with lockdowns. But I agree with Raymond James, likely won’t get back to pre-COVID demand for at least two years.
Shallow sand,
Yes the data is different state to state. For US as a whole I like
https://www.worldometers.info/coronavirus/country/us/
Illinios had more new cases than New York or California yesterday, the most in the nation, though much of that was no doubt in the Chicago metro area.
Many in rural areas are following the social distancing guidelines, which is easier to do in rural areas. Not a lot of mass transit where I live.
As the rules are relaxed and people return to local coffee shops and fail to take the threat seriously, we might see rural area cases jump very quickly. I hope not, just depends on how smart rural folks are, the smart ones will stay home and avoid the folks not wearing masks (unless they are close family members), the others will test your theory of a weaker strain of virus in rural areas (which I am pretty sure is wishful thinking).
Dennis.
I wouldn’t call my weaker strain comment a theory.
Merely a very unscientific observation. But one that can be argued with data in a layperson’s manner.
Shallow sand,
Just not sure there is a lot of scientific evidence for a weaker strain, though supposedly some reports suggest the east coast strain is worse than the west coast (perhaps there was a mutation in Europe before it arrived on the East coast from Europe).
I have not really followed that closely and often the stuff one hears in news reports is wrong/incomplete, I am not really qualified to comment on the science as I had a couple of zoology courses at university and am by no means an expert.
I think less densely populate rural towns lend themselves to social distancing, but one non-symptomatic covid positive person at a square dance, could easily lead to an outbreak.
Stay away from social gatherings and you will be ok, stay safe.
to Dennis and SS:
there is a good , but scientific preprint on two different strains of covid-19 in the U.S.and elseware here. this was produced by the federal Los Alamos lab, that was repurposed to study the spike protein. the spike protein is responsable for attaching to the target receptor on the cell wall of attacked cells in the lungs. all the vaccines currently under investigation use molecular genetics to produce spike protein fragments as active ingredients. i believe there are over 80 under consideration. the world wide collaborative effort to produce a vaccine has been astounding. figure 3 is the money shot. there is an obvious difference between new york and washington state..two different strains, with NY hosting the nasty , more contagious strain.
Tony,
The 13.42 Mb/d estimate for March is likely wrong. probably more like 12.5 Mb/d. So maybe 1.4 Mb/d decrease over 2 months or roughly 700 kb/d, perhaps another 700 kb/d in June. for a total of 2.1 Mb/d over 3 months is a more realistic estimate.
Heat sensors measure oil production? From orbit?
What is it we think they’re looking at? The refinery burners?
Optics resolution from orbit is pretty good, but my recall is the lenses for IR are not.
These guys are guessing and trying to get consultant contracts.
I imagine oil (coming from pretty deep underground) is markedly warmer than ground surface when it is close to the wellhead, especially at night So they may pick up the thermal image of pipelines close to wells. More flow would see a hotter pipe.
Exact Biden quote from debate:
“Number one, no more subsidies for fossil fuel industry. No more drilling on Federal lands. No more drilling, including offshore. No ability for the oil industry to continue to drill, period, ends, number one.”
It was during a moment when Sanders and Biden were trying to move to the left of each other and the subject matter was climate change phrased as what actions on day one of presidency. The campaign clarified, mostly grammatically, and did not walk back any of it.
Yep. That’s what I recall.
Question is how long that position lasts if there are shortages like in 1973.
You may have missed this. Also he has appointed AOC to Head his environmental committee. He is being moved left.
“A threat by Joe Biden to cancel the Keystone XL pipeline has a Canadian province gambling that construction of the multi-billion-dollar project will begin before the Democrat has a chance to take control of the White House.”
https://www.politico.com/news/2020/05/20/biden-canada-pipeline-271543
There will be an interesting fight in AOC’s district.
On June 23, there will be a Democrat primary in AOC’s district. AOC is being challenged by Michelle. I think she has a chance to beat her. I think she is just as hip as AOC on Twitter. If she does, that will be a wake up call for the Dems.
Former CNBC anchor Michelle Caruso-Cabrera, who is running a primary challenge to Rep. Alexandria Ocasio-Cortez, slammed the New York Democrat’s response to the coronavirus on Monday, saying, “AOC is always MIA.”
Caruso-Cabrera has relentlessly targeted Ocasio-Cortez since she launched her campaign in February. Last month, she called the freshman lawmaker “out of touch” for voting against a $484 billion coronavirus stimulus package.
AOC is not representative of the democratic party, Biden is just pandering to the left a bit, but he would be wise to not take the extreme positions of Sanders and Warren and for the most part he has not. The fracking thing was Biden misspeaking something he does a lot, just not as much as the current clown in chief.
Dennis
I know that AOC is not representative of the democratic party. This is why I think it will be interesting to see if Michelle Caruso-Cabrera can unseat her.
Not really familiar with Cabrera. I agree Biden is being pulled to the left, in some sense he is trying to walk a line between center and left to win election, I think if he stays in the center his chances are better. In any case an incumbent president tends to win, if recession is prolonged, perhaps Biden wins. No idea how this plays out.
Dennis
She was a very well spoken commentator on CNBC, the stock channel. She was furious that AOC fought the Amazon expansion in NJ. She is using that wedge to say that AOC took job opportunities from the people in her district.
As for not knowing how this plays out. You won’t even know after the results are in. I have read too many articles on how Russia has been probing the US election infrastructure and Mitch will not allocate funds to protect it. However this means that both Iran and China could get in there. When the results are in and differences appear between public polls, exit polls and final results, I can already see the discord that will arise.
I also have no idea of how this plays out. Too many unknown unknowns.
Ovi.
Isn’t MCC too conservative for that District?
I don’t know. She is a Democrat so she can’t be that conservative. She was for the stimulus bill. AOC wasn’t. I think she has a better balance. Depending on who wins and by how MUCH, it will send a signal to the party policy advisers on where they should be.
AOC got rid of the old party apparatus. They may be out for second round. I think they went out and found a hip lady that could take on AOC. We will have an answer in a little less than a month.
Ovi. I think MCC just joined the Democratic Party recently. The forward of her book was written by Larry Kudlow. They were on CNBC together for several years. The title of the book, written in 2010, is titled, “You Know I’m Right, More Prosperity, Less Government.”
She is doing the smart thing by running as a Democrat. It means she really wants to win, as no Republican could win that District. And if she wins, it means the voters in the District don’t pay attention. At least in my view.
Shallow Sand
Did not know she wrote a book with Kudlow. The title does sound conservative. They need a few more of those in the D party. I still think the old guard sought her out.
If T, who supported Bill could run as a GOP, then I think it is OK for MCC to run for the D’s.
Sounds like past affiliation does no affect what one does today.
Imagine if she and Biden won and B made here Secretary of Commerce. Then she brings in Kudlow as an advisor. In this day and age, such a scenario would not surprise me.
Ovi. She is fiscally conservative and socially liberal.
She knows a program like WPA is better than just doling out money.
I work with people trying to break illicit substance dependency. Why do we require all to obtain employment and why have we never had success with an individual who would not work (stay at home mom’s excepted – which is work imo)?
Why do we have a workshop for disabled people?
UBI would be fine with me if it required something of the recipient.
My job has been somewhat interrupted during COVID. Not having something to do is a bad thing imo.
How about putting together a post for POB.
Great idea Ovi!
What do you think shallow sand? Just shoot me an email if interested, the subject can be anything you want.
Ovi and Dennis.
I should have done that a month ago.
My workplace will be opening considerably the week of June 1, and tons of planning work has been and continues to be keeping me busy.
For better or worse, the US is opening, even the hard hit areas.
shallow sand,
If you ever have free time and feel like writing something, I would be happy to post. I am sure that everyone would be interested in what you have to say.
Shallow sand,
For Biden’s position on fracking see
https://www.washingtonpost.com/politics/2020/03/19/fact-checking-biden-fracking-fracas/
But the Biden campaign said that he misspoke and that his position was the same as ever: He would issue no new fracking permits for federal lands or waters, while allowing existing fracking operations to continue.
Note that there is not a lot of fracking in the GOM afaik.
Also from that article:
“Certain Democratic presidential candidates have promised to ‘ban fracking,’ and I’ve publicly criticized them for doing so,” Lamb wrote in a separate Wall Street Journal letter to the editor in February. “Vice President Biden has criticized them, too. He has explicitly promised not to ban fracking, and when confronted by an activist who was upset with his position, Mr. Biden told him plainly: ‘You ought to vote for someone else.’
Dennis.
I wonder if Biden or Trump really know anything about the industry and how important it remains?
They tend to appoint advisors that don’t know much either.
Obama is likely the most intelligent President in my 50 years and he said percentage depletion is a “Big Oil tax break.” Big Oil has been defined as primarily the Super Majors.
As we know, percentage depletion only applies to the first 1,000 BOPD of oil/6,000 MCFPD of natural gas. Oh yes, Big Oil tax break.
I was in business school in the 1980s. Debt was $2-3 trillion and both my conservative and liberal professors at a large State U lectured it was not sustainable.
And here we are. No deficits don’t matter, because we have to say that about something that will never be paid back.
Just like those who criticize when I point out that every lower 48 public oil producer has been racking up net operating losses every year since 2015. “It doesn’t matter because they are in “growth mode.”
Those same people say we will never see $80 WTI again.
Fantasy land.
28% believe Gates is in a COVID conspiracy.
Wow, I’m getting to be a doomer. Better hit the golf course.
I think Biden knows the oil industry is important as a bridge to get us to something more sustainable. At some point we need to move beyond oil and other fossil fuels, how we get there is unclear.
1. Focus on making post secondary eduation easily accesible for women worldwide along with equal rights for women, this will reduce the total fertility rate, get population to peak and then decline and reduce energy demand ans environmental damage.
2, improve energy efficiency by better building design including passive solar with thermal storage and utilizing heat pumps for heating (ground source heat pumps in colder climates).
3. EVs, plugin hybridss, and electrified rail for transport
4, wind and solar for electricity widely distributed and highly interconnected, overbuild capacity to about 3 times average load hours
5. backup for wind and solar a combination of compressed air energy storage, pumped hydro, thermal storage, vehicle to grid, excess power used to produce synthetic natural gas or hydrogen, geothermal, hydropower, tidal, wave, battery, or nuclear.
All options need to be on the table to find the cheapest and least climate and environment damaging option, natural gas might be used as a bridge fuel in peaker plants, but this should be phased out as soon as is feasible.
That’s my best guess at a way forward, I do not think it will be easy, it will be difficult, but possible in my opinion.
Many denigrate such a plan as business as usual, I would disagree, it will be an entirely different world. Our environment shapes our behavior, just as our behavior shapes the environment.
Dennis, when you say ” overbuild capacity to about 3 times average load hours” what exactly do you mean. Is it 3 times peak capacity or 3 times the actual output capacity?
I believe he means 3 times the actual energy output, e.g., kWh’s.
So, if you need an average output of 100GW, and your capacity figure is 33%, and you want to overbuild 3x, you’d build 900GW of wind capacity. That means, of course, that actual average output would be 300 GW, which means that actual output would be above 100GW about 95% of the time.
Please note that the current grid is overbuilt: US average consumption is about 450GW, and capacity is 1,150GW or more.
Gonefishing,
Nick G is correct, the estimate is based on a 2013 paper, see pages 65 and 66.
https://www.sciencedirect.com/science/article/pii/S0378775312014759?via%3Dihub
Tight oil
https://www.eia.gov/energyexplained/oil-and-petroleum-products/data/US-tight-oil-production.xlsx
Nov 2019 8272 kb/d
Dec 2019 8138 kb/d
March 2020 8080 kb/d
April 2020 7904 kb/d
Some thoughts.
I was musing with shaleprofile, looking into low-producing wells (less than 25 bpd)
I ended looking at wells that started in 2012, and discovered that lately, there was a few wells that produced more than 400 bpd. It’s not significant, a few kb/d. But anyway, it’s enough to increase a little bit the production of 2012 wells, which gives the impression that it can last.
I suspect refracking, but I’m not exactly sure what I’m looking at here. The most spectacular increase is from a totally unknown firm calld “Verdun Oil and Gas”.
A stealth peak in world oil production? By Kurt Cobb
We who have been suggesting that a peak in world oil production was nigh almost from the beginning of this century looked like we might be right when oil prices reached their all-time high in 2008. But since then, we have taken it on the chin for more than a decade as the U.S. shale oil boom kept adding to world supplies—even as production in the rest of the world mostly stagnated or declined.
But then world oil production turned down—not when the recent coronavirus pandemic and associated economic shutdowns hit—but more than a year before while few people were noticing. Monthly fluctuations will make it difficult to pinpoint a peak until long after it occurs. But, let’s note the difference between world output in November 2018 which was 84.5 million barrels per day (mbpd) versus December 2019 which was 83.2 mbpd when the world economy was supposedly still in high gear. (These numbers are for crude plus lease condensate which is the definition of oil on major oil exchanges.) Between these two dates monthly oil production was occasionally lower than December 2019, but never higher than November 2018.
Does this mean oil production has reached an all-time peak?
Recent developments tend to suggest an affirmative answer.
There is a lot more to this article. If you are interested in the actual “production” peak, not the so-called “demand” peak, you should check it out.
Ron
It is pretty clear that the temporary peak in Nov 2018 and the 12 month trailing average peak in 2019 was due to OPEC reducing output in an attempt to raise oil prices. I don’t think a fall in output in a low oil price environment tells us much unless we have reached peak C+C demand, I doubt that will occur before 2030 and more likely after that, 2035 would be my guess.
Oil prices will rise as the economy recovers. If we don’t surpass the current 2019 peak when oil reaches $100/bo or more in 2020$ on average for a 12 month period, then I will be convinced of being past the peak in World C+C supply. I expect that peak will be in 2027 or 2028.
Dennis, I do not understand why you think OPEC reducing production could possibly cause a peak. At any rate, In the last quarter of 2018 every OPEC nation was producing flat out, positioning themselves for the agreed upon cuts to begin in 2019.
The actual peak was in November 2018. It may be, in your opinion, a temporary peak. However In my opinion it is, or rather was, the peak in world oil production.
Ron,
If one thinks the monthly peak is important (I do not), then perhaps Nov 2018 with be “the” peak in monthly output. I focus on the centered or trailing 12 month average output. For World C C peak output the 12 month trailing average was May 2019 at 83056 kb/d (centered 12 month average peak was Nov 2018), the 12 month average fell after that peak simply because OPEC cut output in response to falling oil prices as the market was oversupplied. Peak oil supply is supposed to be about all nations producing flat out at a high oil price and not being able to increase output any higher. It is pretty clear to me that scenario does not apply for the period from November 2018 to Jan 2020, a period when OPEC was restricting output in order to drive oil prices higher.
If one thinks the monthly peak is important (I do not), then perhaps Nov 2018 with be “the” peak in monthly output.
Dennis, I was just pointing out the date of the monthly peak. I have no doubt that that month will fall within the yearly peak also.
Peak oil supply is supposed to be about all nations producing flat out at a high oil price and not being able to increase output any higher.
No, Dennis, you are setting hypothetical terms for peak oil that will likely never happen. There will likely never be a time when every nation is producing flat out. Right now there are at least three nations that are not producing what they could obviously produce if they had no political problems. That number is far more likely to increase rather than decrease as the economic system collapses. And it would still collapse even if we never had a virus problem.
Peak oil will be the month and/or year when the production of oil peaks regardless of the cause.
Of course for most of 2019 some, but not all, OPEC nations were restricting output. But they were not restricting output in 2018. The December 2018 average was only 131,000 barrels per day below the May 3018 peak. You are going to quibble over that? It doesn’t matter. Everyone was producing flat out in 2018 and world 12-month average C+C peaked at 82,925,000 barrels per day in December 2018. Your extra 131 k bpd in May 2019 notwithstanding.
Ron,
Yes I agree everyone was producing flat out (except a few that had political problems) for the October 2018 to December 2018 period, but it was not the case for an entire 12 month period. I agree the current peak is November 2018 for 12 centered month average output at 83056 kb/d. I think it is likely (greater than 2 in 3 odds) that the current peak in the centered 12 month average for World C+C output will be surpassed in the future.
I also think the odds are 4 in 5 or more that the World real GDP per capita (at market exchange rates) in 2010 $ will be higher in 2025 than in it was in 2019 or earlier. My guess is that by 2027 or 2028 (roughly 50/50 odds it will be 2027 or earlier vs 2028 or later) that the 2018 peak in World C+C average annual output (centered 12 month average) of 83056 kb/d will have been surpassed.
Dennis, I am sure you are aware of the fact that some nations can produce, for two or three months, far more than they can produce constantly. They can do no maintenance for those months and drain all storage tanks.
As for your outlook on the economy, you are far more optimistic than Trump was just before the virus outbreak. 😉
Ron,
Yes I am aware, it is part the reason 12 month average output is more important in my opinion.
I am a little unclear why you think OPEC cutting back on output is not part of the reason for the peak, without a decline in output after the peak, there is no peak.
Dennis, OPEC peaked in 2016. The peak is Non-OPEC peak combined with OPEC decline in output.
Ron,
Yes OPEC peaked in 2016, but they only saw a small drop in 12 month centered average output from September 2016 to July 2018 of 232 kb/d (mostly due to trade sanctions on Iran by Trump).
Non-OPEC 12 month centered average output in chart below (last data point includes 12 month average data through Jan 2020). As is clear there is no drop in non-OPEC output, the drop in World output after November 2018 (for 12 month centered average World C+C output) is due to the fall in OPEC output, plain and simple. Click on chart for larger view.
Ron,
It occurred to me you may have meant non-OPEC minus US had reached a peak, I checked the 12 month centered average for that also, chart below. A brief peak in late 2018 followed by increasing 12 month average output for most of 2019.
A final point is that the OPEC “decline” in output was a policy choice to try to raise prices, they are certainly capable of producing more than 31 Mb/d, probably 33 Mb/d with no problem for the next 5 years and perhaps as long as 15 years. The main problem will be an eventual peak in non-OPEC output. I expect near term the peak in centered 12 month average non-OPEC output will be late 2019, as oil prices recover in 2021 or 2022 non-OPEC output will start to increase and the final peak will likely be between 2025 and 2030, OPEC might be able to delay the final peak in World output a bit, but I think only by a year or 2 if Brent oil prices are high (over $90/bo in 2020 US$.)
Dennis, did you read Kurt Cobb’s article? If so what did you think of it? You seem to think the economy will come roaring back. That is very unlikely to be the case. The world shutdown is causing very serious and very lasting damage.
The real wild card is whether consumers will be able to afford the higher prices that are necessary to support increased industry investment. If they can’t, we could get caught in a zig-zag decline in oil production that will imperil all future growth.
I do not believe we will return to a pre covid-19 economy. The damage is permanent. It will take decades to recover, if ever.
Ron,
Yes I read the article.
I think it will take about 5 or 6 years to return to the 2019 level of real GDP per capita for the World, at most. Cobb says he does not think there will be a v shaped recovery, to me that type of scenario sees a return to 2019 real GDP per capita by 2022. I agree that is not likely. Equally unlikely in my opinion is a scenario where the mistakes of the Great Depression are repeated. We have moved beyond classical economics with their laissez faire theory of economics, we are a bit smarter since Keynes enlightened the economics profession.
In short I disagree strongly with any scenario that sees a repeat of the Great Depression or worse (your decades to recover if ever scenario) due to the pandemic. It may take 5 years, but we will get past the covid19 pandemic.
I do not believe we will return to a pre covid-19 economy.
It seems extremely unlikely to me also.
(But I have been wrong before.)
I think reality has finally caught up with our neoliberal delusion.
Ron/Dennis
Attached is a chart to consider.
This chart is World without the US. The peak was November 2016 at 72,835 kb/d. So the non -US world added 5,348 kb/d of output after the previous September low. The primary additions came from Brazil, Canada, Russia, Norway and Kazakhstan. Most of these are now close to their highs/peak.
The gap between November 2016 and January 2020 is 3,624 kb/d. Of the 3,624, OPEC accounts for 3,000 kb/d. So to exceed the previous peak, OPEC will need to restore the 3,000 kb/d (note this is pre- pandemic) and find an additional 600 kb/d from OPEC or others. To exceed the world peak will then also require the US to get back above its January level of 12,833. Seems like a double tall order.
In the mean time, decline continues 24/7.
Dennis note in my post above Rystad has revised its position on peak demand. “Rystad now sees demand topping out at 106.5 million-107 million bpd in 2027-2028. The consultancy had previously forecast a marginally higher peak in 2030.”
World minus US C C trailing 12 month average.
Not when looking at 12 month averages the difference between peak and recent 12 month average is about 2000 kb/d.
Dennis
Nice plateau.
Ovi,
Yes it is interesting, also if one looks at OPEC centered 12 month average and compare to chart above (trailing average which needs to be shifted 5 months to the left to compare with centered 12 month average). It is clear the drop in output at the end of the plateau is simply due to OPEC cuts in output.
Hi there thank you for the report I were looking for oil lease information also thank you.
BIG TROUBLE FOR THE BIG THREE U.S. OIL COMPANIES: Financial Disaster In Its Domestic Oil & Gas Sector
“While it’s no secret that the U.S. shale oil industry continues to be a trainwreck, the damage is now spreading deep into the financial bowels of the Big Three Oil Majors. Unfortunately, the largest, ExxonMobil, has the worst-performing domestic oil and gas sector in the group.”
“The Big Three suffered a net $900 million earnings loss from their U.S. upstream sector while spending a whopping $5.6 billion ($5,591 million) in CAPEX. Now compare that to the combined non-U.S. or International upstream earnings of $4.3 billion based on investing $4.6 billion in CAPEX.”
https://srsroccoreport.com/big-trouble-for-the-big-three-u-s-oil-companies-financial-disaster-in-its-domestic-oil-gas-sector/
Steve
The EIA’s Monthly Energy Review is just out with data through April. The final month of the Monthly Energy Review is often revised quite a bit. But sometimes they get it pretty close. They had US C C down up 93,000 barrels per day in March and down 782,000 barrels per day in April. The data in kbpd:
Oct-19 .. 12,674
Nov-19.. 12,866
Dec-19.. 12,813
Jan-20.. 12,746
Feb-20.. 12,833
Mar-20..12,926
Apr-20.. 12,143
However what I found interesting was total petroleum products supplied, or consumption. Consumption was down 721,000 barrels per day in March and down 4,395,000 barrels per day in April. That is consumption was down 5,106,000 bpd for the two months.
Ron,
Interesting that March 2020 is the new US peak (subject to future revisions). In April US tight oil output only decreased by 176 kb/d in April 2020. So much of the April drop in US output (783 kb/d) was from conventional oil (607 kb/d). According to Shallow sand, some of the production in his field restarted in May, though my expectation is that tight oil output will continue to decline and the April estimate may be revised lower in the future. I agree with Ron that the estimate of the most recent month of output tends to be revised by the largest percentage in the future.
Recent STEO has US output at 10730 kb/d in March 2021, down 2196 kb/d from March 2020 peak.
That drop in April 2020 for products supplied is 5368 kb/d less than April 2019, a 26.7% drop from the April 2019 level.
Based on the weekly data, product supplied may have rebounded in May, the 4 week average for products supplied has increased by 1600 kb/d over the past 3 weeks from week ending April 25 to week ending May 15, 2020. The May 15, 2020 level remains about 4000 kb/d less than the April/May 2019 average products supplied (using monthly data for the April/May 2019 estimate).
My guess is that consumption may slowly recover to the 2019 level, but it will take a few years, maybe by Sept 2021 (optimistic) or May 2022 (pessimistic).
Dennis. Some started in late May, but well more than half still has not and almost no oil will be sold in May.
The financial hit for April, May and June is the worst we have seen in over 40 years.
March was $26 oil. Check received in April was half of what it had been for 2019 on average.
April was $15, and less barrels were sold as we shut in some pre 4/20/20 and almost all post 4/20/20. So the check was about 1/5 of what we received on average for 2019.
Zero oil sold in May. So June oil income will be zero.
So, the income we actually received for the second quarter of 2020 (because payment is received in the month following sales) was just 23% of average in 2019. 2019 was not what I would call a banner year for the price of oil, very average. Maybe below average if one is a highly indebted shale producer.
In a 3 month period a company selling 6,000 BO per month at $52 has $936,000 deposited to the checking account. That same company will have just deposited $218,000 for April, May and June.
Huge revenue hit. Crazy investment media is talking about the “meteoric rise of oil prices”. It’s still just HALF of the mediocre average price last year.
I try really hard to believe that the people at EIA are professionals who do their best to report accurate data, although recent estimates aren’t usually the best. They try with what they have.
But, if US oil production doesn’t fall off a cliff between now and Election Day, as reported by EIA, I will lose my faith in EIA. Public companies announced over 500K shut in per day in April, over 1 million for both May and June. There are barely any active frac spreads in the oil basins, so maybe 5% of the new wells added in Q1 will be added in Q2?
The nothing to see here attitude of the investment community is something for sure.
XOM will not only have to borrow to pay all its dividend in Q2, but will also have to borrow billions to cover operating losses.
Wonder how many billion of net operating losses PXD will add to its $5 billion NOL. At least they are getting a big tax refund for paying no tax by being allowed to carry back some of that $5 billion NOL.
What a joke the oil industry has become.
shallow sand,
Sorry things are so bad. I imagine a bunch of tight oil focused oil companies will go bankrupt. I expect tight oil output should drop like a rock in the May to December period. Have you tried Enno’s shale forecast tool, it is pretty darn slick. He is trying to make me obsolete, and doing a fine job. 🙂
At some point demand recovers and oil prices rise, but you know how good my price guesses are so I won’t bother you with those.
Price forecasts, as we’ve discussed many times, are literally impossible. If you forecast high prices, producers will over-produce and you’ll get…low prices. And vice versa.
Tight Oil Supply projection
I assume rig count remains at May level until Jan 2025, at that point I assume well productivity decreases by 0.3% each month until Dec 2030 and rig count increases by 1% per month from Jan 2025 to Jan 2028, then rig count decreases after Jan 2028 by 0.5% per month. Obviously this is one of an infinite number of possible future scenarios.
At link below you can create your own
https://shaleprofile.com/us-tight-oil-gas-projection/
Interesting.
PSM is out, just 3 days after the “Monthly Energy Review”, and with quite some different numbers.
February production revised 100 kb/d lower, and March production 200 kb/d lower than in the MER. Consumption, at 18’284 kb/d, is also quite below the MER estimated, at over 19 Mb/d.
The number of various report the EIA produce is amazing, sometimes with major variation between them in a few days of being out.
Anyway, the most important, IMHO, is the PSM. Because it’s the most accurate and it’s from this one that all the other estimations for the other report are derived. But it only gives a pictures of two months ago.
The second most important is the Weekly report. It is quite accurate for the petroleum stock figures, but the imports/production/consumption can vary a lot (few hundreds of barrels per day) with final figures. Always take account for the adjustment figure in the report.
The DPR gives an interesting view on past LTO production, but the most interesting is the activity of drilling, completion and DUC.
The other reports are mostly useless, but compile anyway some information about international data.
Something interesting also in your graphic is the consumption in 2019. It stalled after a few years of constant growth. But we won’t know if the trend would have continue because the crisis just turned everything upside down.
Tita,
DPR is not very good. The shale profile supply estimate is much better. Only the PSM is worth paying close attention to, the MER seems to use 4 week average output from the weekly reports for its estimates for the most recent few months forward from the previous month’s PSM latest estimate. Sometimes the estimate will be close, but often the 4 week average output estimate is pretty far from the mark. I tend to ignore the MER Crude output estimates and just wait for the PSM.
5 Iranian gasoline tankers enroute Ven. 2 already arrived.
Back of the envelope says about a month worth of consumption in the total of 5.
With prices so low, Iran really isn’t giving all that much away. Might not be able to collect regardless of price. No reason not to support Ven. Nothing to lose.
Amusing consideration. The decision to ship was probably made with oil price negative.
Iran was profiting by giving it away.
Watcher,
Negative prices only applied to WTI for one of day (April 20, 2020), most World prices are tied to Brent price.
WTI daily spot prices for April.
So not the 9 tons of gold bars then.
Ovi,
There is no projection for crude plus condensate for non-OPEC in the STEO, it is an all liquids projection, did you just assume a constant proportion for non-crude liquids for nations other than the US? This is not really made clear in your post.
Ovi,
I think I see roughly how you did it. I used the Jan 2016 to Jan 2020 proportion of C C to other liquids for non-OPEC minus US and then assumed this proportion remained constant from
Feb 2020 to Dec 2021. My attempt is below, with a centered 12 month average.
The billion $ question we read nothing about is:
How much have alle the state controlled oil companies reduced spending in their old fields, or opening new fields.
In a year like this where you have voluntary output reductions and huge costs of corona, it makes no sense for a state to invest multi billion$ in maintaining an output capacity you don’t use. So the usual 5-8% yearly decline won’t be offset by new infill drilling and all the other stuff. At least not as much as in years before.
Perhaps this will even continue in next year when oil prices will stat in the 30s and 40s – no fast payout of these multi billion investments.
When demand finally catches up and the tanks are empty enough, let’s see if HHHs 160$ scenario can happen. I won’t rule it out – oil production is moving slower with investments than a consumer recovery can happen. Many of these easy fast fixes have been used up after the 2015 crisis, so more long term investment is necessary in many oil countries, tapping the B class fields by building lot’s of new infrastructure. Not only milking the A class fields even more, that works only for a limited time to maintain production.
Eulenspiegel,
Good point, I agree. If or when the Global economy recovers (2 to 5 years in my opinion), we are likely to see a tight oil supply and high prices. Tight oil can come back pretty quickly with high oil prices, deep water offshore and brownfield development will be slower to ramp up. Brent oil prices at $160 to $170/bo in 2020 US$ by 2025-2027 is a very real possibility, perhaps $90/bo in 2020$ by 2023.
Dennis ,spoiler alert . Can you tell me how do you think we will traverse 2020,2021,2022,2023,2024,and on to 2025 with the the way the chips are falling ? No, please not a single POV give me the larger picture ,if not then we are doing nothing but rearranging the chairs on the Titanic and smoking ^hopium^ at the same time . A dangerous combination .
P.S : My regular argument ^ To get to the long term you must go thru the short term and the medium term ^ .
hole in head,
Governments stimulate their economies with infrastucture projects of various sorts, a vaccine that is safe and effective becomes available. People receive the vaccine and some “new normal” is established over the next 2 to 5 years.
Not exactly sure what you are looking for, there will be high unemployment for the next 12 to 24 months. Fiscal stimulus by national governments will be needed to get people back to work over the next 2 to 5 years, if national governments go back to the 1930s laissez faire economic policy, then we could have a prolonged 10 to 12 year depression.
In my opinion the chance nations throughout the World will be that stupid collectively, is quite small, perhaps 1 in 50 odds.
In any case if you want a very specific scenario, of the infinite number of possible future scenarios, any of which has zero chance of occurring, I will leave that to you. 🙂
Dennise , you are putting too much faith in the intelligence of the politicians and the governments to do the right things when history proves that they have screwed up on a regular basis . So we have to get to 2025 by your scenario . The next election will decide between Biden and Trump . The next guy in WH will be incharge till 2024 . Take your pick between ^Dumb and Dumber^ . Luckily there is no column on the ballot paper that says ^dumbest^ , 100% he would be elected .
hole in head,
Biden is far from perfect, but Trump has set the bar at below sea level for a better option. Biden will be far better in my opinion, if elected. If we get Trump, then yes Depression becomes more likely, the future has not been written, neither of us knows what will happen, I have simply laid out what I believe is the more likely scenario, I am often incorrect about what the future will bring.
In the past things have often turned out better than my expectations, no guarantee that occurs in the future of course.
^Donald Trump may appear poorly suited to presiding over such a national crackup. Many will accuse him of instigating it. Whatever he does is liable to be construed as wrong by half the nation, whether he acts decisively to put down actual insurrection, or dithers inconclusively while cities burn. His Democratic rival, Joe Biden, appears even less credibly capable of managing a crisis. He is, in fact, a Potemkin candidate for president, a stalking horse for forces and persons mysteriously awaiting emergence in Milwaukee around mid-August. It looks like some people will have to start deciding some things.^
This is from the latest post by JHK . The choice is between dumb and dumber .
Disclaimer ; I am not a US national and live outside the USA.
Dennis,
The fastest vaccine ever developed was for mumps, and it took 4 years. No vaccine for a coronavirus has EVER been developed and found to be safe for use in humans.
Any vaccine will be developed well after the 2 year beginning of your range for recovery, if ever.
Niko
I think we need to distinguish between two questions here. The sense I get is that one or two effective vaccines could emerge by year end.
It is the question of whether it is safe and for how long does it last that takes time.
Indeed. IIRC correctly, numerous previous attempts at a SARS vaccine turned out to be unsafe, and efforts were eventually abandoned. It’s unclear why this new version of SARS (COVID-19) will be any different. And if we could create a safe coronavirus vaccine, it seems likely that someone would have already done so due to the huge potential profit to made preventing the common cold.
The assumption that a vaccine will be ready for use any time soon seems seriously flawed to me.
When you increase the potential reward for finding a vaccine exponentially, you’ll get a lot more concentrated focus on it, and it will be much more likely to happen. It’s still probably a year away, but based on the genetic stability of the virus, it won’t be as difficult as an HIV vaccine, for instance. This problem is being approached from multiple angles and odds are at least one will be partially successful.
https://abcnews.go.com/Health/covid-19-vaccine-candidates-front-runners/story?id=69881230
No vaccine for the Coronavirus known as the common cold.
Stephen Hren Wrote:
“When you increase the potential reward for finding a vaccine exponentially, you’ll get a lot more concentrated focus on it”
And a lot of fraud. interesting to note, that Moderna somehow skipped animal testing and when directly to human trials. I noticed Moderna Insiders sell stock after the announcement. The Oxford vaccine looks to be DOA.
…an additional question is the level of protection. Some vaccines provide total protection, some only partial.
From articles in Scientific American and the Guardian, it appears that many (?) virologists believe a vaccine is possible but not likely. Some believe there might be a partial vaccine, where the severity of symptoms are reduced, and that’s valuable in itself.
It seems prudent to make plans on a vaccine being available, but it seems a requirement to also plan on a vaccine not being available.
Yes a partially successful vaccine will still be hugely beneficial, as it will quickly move forward herd immunity. Imagine a 50% successful vaccine given to 80% of the population. That adds 40% total population immunity. Add 20% already exposed, a number already reached in NYC for example, and you are at 60% herd immunity, enough to bring the R0 value below 1 for this virus.
Niko,
If there is no vaccine, eventually herd immunity will be reached. There was no vaccine in 1918, we just muddled through, this may be no different.
Dennis,
Agreed. I was simply pointing out that lack of a vaccine will greatly elongate any recovery period.
The 1918 pandemic is a bit different, as it infected a much larger percentage of the population early on, and killed with much greater speed when it did so. Both factors act to shorten the duration of the pandemic.
Social distancing has bought our hospitals time, but it has severely slowed the normal rate of immunity acquisition. At current rates of transmission it would likely be half a decade before effective heard immunity is developed in the US. (Assumptions: 60% immune for heard immunity to be effective, current US known cases a bit less than 2 million, unknown cases outnumber known cases by a factor of 10, virus has been spreading in US ~5 months).
So without a vaccine, and if we continue to try limiting the spread, we are looking at a very long road indeed.
Niko,
When there is better availability of ppe, testing, and tracing. The spread can be limited to what hospital capacity can handle. If no vaccine looks likely, social distancing will be limited to those who are more vulnerable to speed transmission rates to levels that won’t overwhelm healthcare system. So the half decade estimate may be conservative. Widespread antibody testing will give us a better estimate of how close we are to herd immunity.
In the 1918 pandemic, the second wave was worse than the first.
The first affected the elderly most, and the second affected younger people, and may have mutated from the first version.
The third wave was also bad for some parts of the globe.
I take comfort in that the science is a lot better now, and the testing is slowly getting better, but i do worry that many people seem to think the pandemic is over and it’s time to go out and socialize.
Effectively, there’s not much different from three months ago. The virus is still there, and still fatal. Groups of people will be infected and many will die.
The big plus from three months ago is the better testing. With the numbers of cases dropping to near zero where I live, Public Health is hopeful that they can detect, track, and isolate infected people.
But our Public Health people keep repeating that any spike in cases will lead to another lockdown.
This is our new life until there’s a vaccine, a cure, or successful treatments.
I’m not happy about it.
Niko,
Mumps vaccine was first developed in 1948.
I believe there has been a bit of scientific progress in the life sciences in the past 72 years.
Dennis
It looks like you figured it out.
– Started with STEO Total World and subtracted OPEC all liquids to get Non-OPEC all liquids.
– Non-OPEC all liquids minus EIA C C = NGPls from Jan -17 to Jan – 20
– Calculated the ratio of NGPLs to C C. Took the average from Jan – 19 to Jan – 20 and got 0.2916
– Used shorter range for average because it is more representative of current production ratio
– Divided Non-OPEC all liquids by 1.2916 to get a good estimate of C C out to Dec -20.
Did not intentionally explain because I thought it was too long. Also wondered if anybody would ask. Looks like someone did.
I thought it was worth a try. We can revisit in a year to see how wrong it was.
Ovi,
Your method was excellent, I was just trying to understand where it came from, I agree the shorter term is probably more representative. I just chose the longer term because I had the data easily accessible and didn’t know your methodology. I like yours better than mine.
Thanks.
The STEO gets revised monthly and is usually incorrect 12 months out.
Dennis
That gives us an out to blame them.
Article on supply/demand dynamics of liquid fuels leading to future shortfalls/massive economic disruption/pain/no puppy chow for the unprepared.
“Roughly 60 percent of the world’s oil comes from just 25 oil fields mainly in Saudi Arabia and the Middle East with an average age of over 70 years and already experiencing 6-7 percent annual declines.”
“With most oil-producing countries in terminal decline or having plateaued, U.S. shale is the new swing producer and the biggest wildcard in the global oil markets. ”
https://oilprice.com/Energy/Oil-Prices/Oil-Markets-Could-Soon-Face-A-Devastating-Supply-Crunch.html
Plague.
Fruitcakes in high office.
National riots.
And it’s apparent oil isn’t going back to where it used to be:
https://www.resilience.org/stories/2020-05-28/shutting-down-oil-wells-a-risky-and-expensive-option/
Is this the final swirl of the drain?
Dennis.
EIA March, 2020 monthly is out and it appears to be a little less than 400K BOPD (12.716 million BOPD) below the highest EIA March weekly reported. I recall a 13.1 million BOPD weekly being posted.
I am wondering if April and May weeklies are also way too high, given the announced shut ins, what Plains All-American pipeline has reported, etc.
The weekly data are just wild ass guesses. The monthly data is far more accurate. C+C production is down only 150,000 barrels per day from the peak.
Nov. 2019 12,866,000
Mar. 2020 12,716,000
Difference -150,000
The data in the chart below is through March 2020.
Shallow Sand
You may be referring to the weekly charts I post every so often and many say that their estimates are too high. It looks like those comments have been correct since January.
However it should be noted that February’s output estimate from the EIA’s May report, 12,833 kb/d, has also been revised down to 12,744 kb/d, a downward revision of 89 kb/d. Even the EIA’s MER which came out on Tuesday 26 th, four days before the 914 report, had March’s output at 12926 kb/d. That is a full 210 kb/d higher than today’s number.
Difficult to understand how one organization can have so many different estimates.
Wery Easy to understand: different departments, different people, different methods… and all in their own silos… (been in similar situations in totally different industyr but I’d bet that there is some similarity anyway…)
Ovi,
The MER may be based on models for most recent 3 months. The PSM is based on surveys from large producers about 90% of total output and then a statistical model that adjusts state level data where available which is often incomplete.
The PSM is not perfect, but is always the best estimate by the EIA.
On this point Ron and I agree, possible we are both wrong, but unlikely.
Dennis
There is always room for disagreement on the site. Looking at the numbers, it looks like the PSM required the smallest revision to get to the latest output estimate for March.
However, looking at the weekly numbers from August to December, they were bang on. I guess they have good months and bad months. What’s new?
Ovi,
Yes sometimes the weekly estimates are ok.
We only know this after several months, in general PSM tends to be more accurate. The weekly data for crude output is simply an interpolation of the most recent STEO estimates. Sometimes those estimates are good sometimes they are not. The period from jan to march 2020 they were not very good. Not surprising given the pandemic.
I also noticed that the weekly estimates were surprisingly accurate from August to December, with less than 100kb/d of difference with the PSM.
But it started to get off by more than 200kb/d since January.
I don’t think there was something special, just no surprisingly fast growth of LTO and no unforseen disruption in the GOM. The EIA is uneasy with large production change in the weekly reports, it’s more WAG. We’ll probably have major differences in April and May between PSM and Weekly.
Maybe even up to 800 kb/d of difference in May.
Tita,
Yes there are widely varying estimates by analysts. I expect output will be quite a bit lower in April and May, but the STEO is already making that estimate. Note that the weekly crude output estimates simply takes the recent STEO estimates for April, May and June and it does a linear interpolation to get the weekly C C output estimate. The STEO does the best it can to estimate future output, sometimes they get it right, most times they are too low or too high by a significant margin (greater than 10% from actual). Doubtful that anyone could do better, certainly not me.
As to your guess of 800 kb/d difference between weekly estimate (best comparison is the month ending 4 week average) or the STEO estimate for May (which is what the weekly data is based on), that is less clear to me. Currently the STEO is predicting 11660 kb.d US C C output in May 2020 and the PSM has March 2020 output at 12716 kb/d, so we expect a decrease of about 1056 kb/d over the April and May period. Any expectation that this would be 800 kb/d too high would mean a decrease of 1856 kb/d over a 2 month period, or an average of 928 kb/d for 2 months. I doubt that will be the case, it might be 10% higher than the STEO is estimating, so instead of 528 kb/d for 2 months, maybe 581 kb/d would be a reasonable guess in my opinion.
Ovi,
I think March-19 was supposed to be March 2020 on the label in chart above.
MER should be ignored or taken with a grain (or many grains) of salt.
Shallow sand,
Possible that recent weekly numbers for crude output may still be too high. Visibility is not very good at present. Any guess on your part would likely be the best we might find. I think 4 week average from weekly report probably gives a better indication of where we are for April or May until next month’s PSM is released.
American new cases are not showing any spike from loosened lockdown. Not surprising. People largely lock themselves down. This and one other parameter does not bode well for a restoration of normal consumption. The other parameter is a survey saying over 50% of those surveyed will not take the vaccine.
General sentiment is there is no way for any vaccine team doing a lightning fast release to have a thorough understanding of long term side effects.
This says that return to economic normalcy globally is not in the cards anytime soon, and maybe ever. Unless a cure arrives. As has been noted before, a good cure is preferable to a typical vaccine.
Surprisingly, given no spike in new cases, and no sharp decline either, the daily death number in the United States is falling sharply. This suggests a treatment evolution, but I’ve heard nothing about any such thing.
Nate Hagans says the peak in world production was October 2018. Nate states that it would have been in October 2018 had Covid-19 never happened. I agree with him on this point.
The State of The Species 2020 – Nate Hagens
His peak oil statement starts at about the 15-minute mark.
Nate Hagens, Director of EnergyandOurFuture.org, covers the state of the economy, environment and human cultural situation in the face of the recent Coronavirus. Lecture is 1 hour 8 minutes followed by 45 minutes of question/answer (link: https://youtu.be/EXu4wdrl3NY ) (there were a few bandwidth issues were the sound briefly flanges).
This presentation was preceded by an introduction by Ivan Idso (host) of Mayo Clinic and Rochester MN Transition, and Rochester Mayor Kim Norton (not shown). Thanks to Kristin Anton, Priscilla Trinh and DJ White for help in creating slides/images.
New posts up.
http://peakoilbarrel.com/us-oil-output-continues-its-steady-decline/
and
http://peakoilbarrel.com/eias-electric-power-monthly-may-2020-edition-with-data-for-march/