A guest post by George Kaplan
EIA US Reserve Estimates
The EIA publishes reserve data for the USA, usually in December of the following year – so that the figures presented here are for 2019. Only proved category reserves are shown and the numbers are based on companies’ annual reports and 10-k or 20-f filings (so that last year’s numbers are now being addressed as most companies have filed). Not every company is included, otherwise the net acquisitions and dispersals (the yellow bars) would surely have to sum to zero, but most are and all the big players. Net adjustments include revisions (which may be technical or economic) and other adjustments, which are fiddle factors to make the numbers add up but are usually zero or small; improved recovery is here included as discoveries and extensions. The yellow dashed line shows the net change.
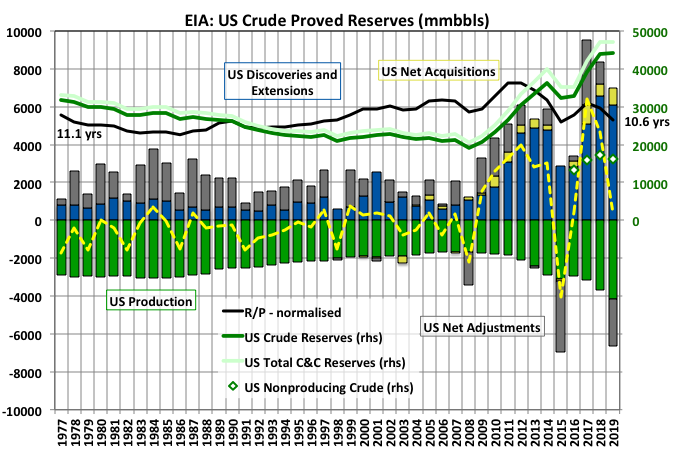
Most of the non-producing reserve (shown as open diamonds for the last four years) is proved, undeveloped (PUD) but some may be proved, developed, nonproducing (PDNP), such as wells awaiting a work-over or completion. The percentage for oil and gas is about the same at 26 to 28%. There is also not much difference between the US as a whole, which is mostly unconventional reserves, and the GoM (see below), which is conventional, although ultra-deep reserves are sometimes alternatively categorised. I found this a bit surprising as one is built around many low-flow, rapidly depleting wells and the other on fewer, high flowing wells, often with long plateau periods.
Net additions of reserves peaked in 2018 for oil and gas, and total remaining reserves peaked in 2018 for gas and will in 2019 for oil (whether locally or globally time will tell). This rear is likely to show downgrades at least as big as those in the 2015 price collapse. Whether a recovery as seen in 2017 will happen depends on the economy, but the oil companies’ shareholders must be getting a bit wary of committing development capital when prices have been so volatile, much of LTO production is at best marginally profitable, and the politics of climate change is becoming increasingly important.
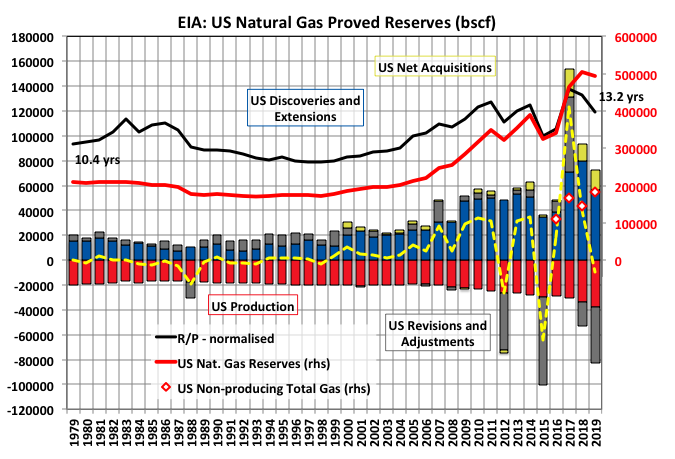
The R/P (reserves over production) values have been normalized to fit on the left hand scale. Oil was at a maximum in 2013 and natural gas in 2018. Both are have been declining quickly in recent years, which implies production has been maintained at higher levels than the reserve base, however fast it has grown, can support over the long term.
EIA GoM Reserve Estimates
The boost to crude reserves from ultra-deep fields looks to have run its course starting in 2017/2018. R/P values have been falling since 2012 as production has increased as discoveries have fallen, although it is likely to rise in 2020 as produced took a big drop from the effects of the pandemic, the largest annual impact from hurricanes and natural decline because of a hiatus in new start ups.
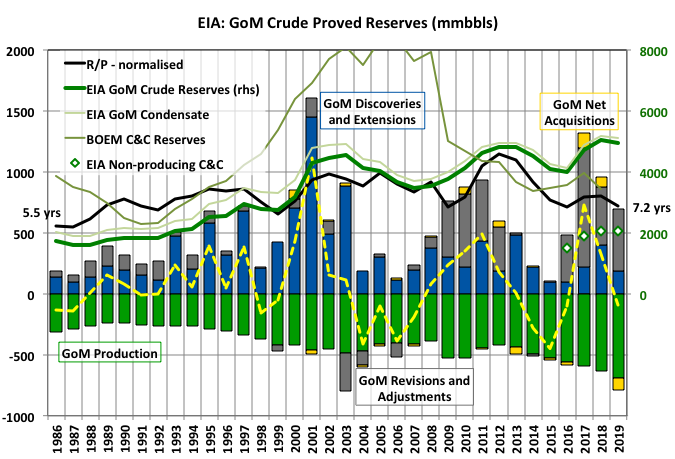
Note that the EIA discoveries are not backdated so they will include any projects reaching FID for the given year. Actual discoveries have dropped far lower in recent years than shown (see previous posts on GoM reserves). The BOEM curve shows remaining reserves backdated to original discovery date, which explains some of the difference between the curves. They are converging but as the EIA estimates include only proved reserves but are higher than those from BOEM that include proved and probable something else is going on. BOEM figures are only through 2018 but are likely to show a decline for 2019 and more for 2020 – very few new field discoveries are recorded in the BOEM database in the last five years and are much outnumbered by new lease start ups (i.e. most have been smaller, near field tie-backs following infrastructure led exploration).
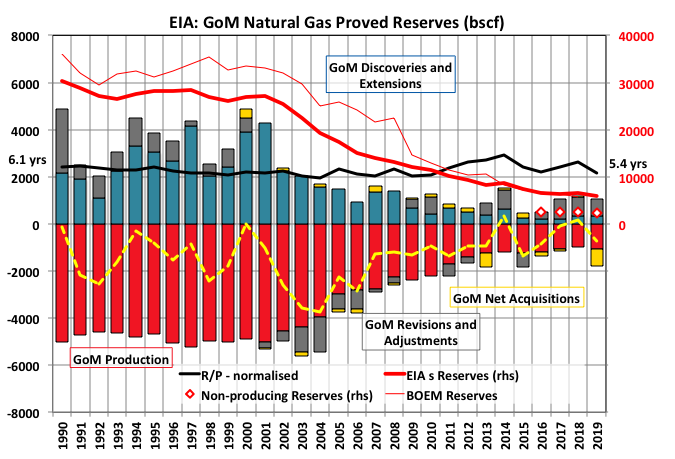
For natural gas the proved estimates from the EIA pretty much coincide with the proved plus probability estimates from the BOEM, which is to be expected in a basin approaching exhaustion. It also appears that the larger companies are divesting their assets to leaner players, as they have been doing in the North Sea.
Super-Major Reserves
The largest IOCs (with the I variously standing for integrated, international or independent) are Chevron, ExxonMobil, BP and Shell, which can have various and changing rankings depending on market worth, reserve holdings or production. Here I’ve just shown them alphabetically.
Total Oil is often included as fifth super-major but it has not yet reported for 2020, though anecdotally, I think it has had better reserves replacement numbers, especially for gas, than the others.
BP
BP oil production has held up well and still the reserve to production (R/P) ratio has been increasing so discovery or acquisitions have also been doing well. In common with all the companies here the R/P for gas has been declining noticeably faster and even as production has dropped (similarly for the others except Chevron).
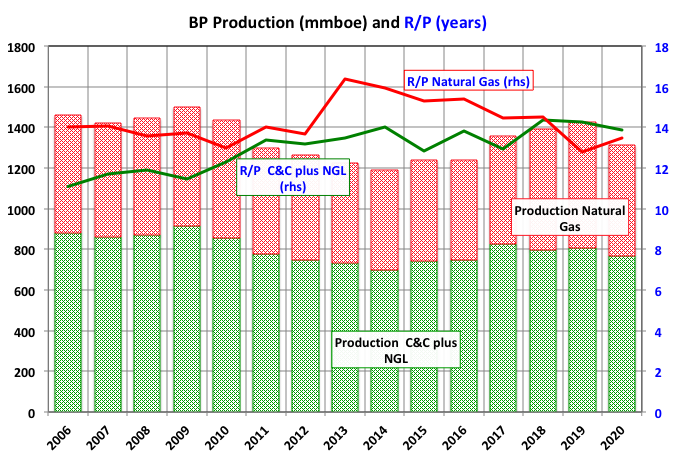
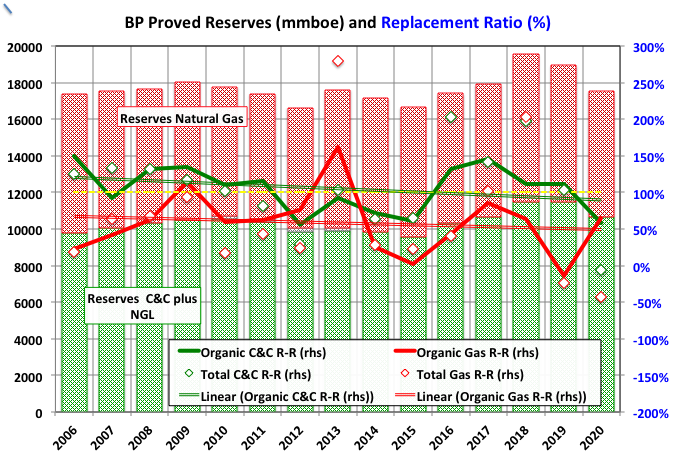
Organic reserve replacement ratios (R-R) include all revisions, adjustments, discoveries and extensions (i.e. it reflects the effectiveness of the companies reservoir and development teams compared to production depletion) while the total figures include net acquisitions (sometimes called drilling on Wall Street). BP has kept oil R-R stable at around 100% but hasn’t done so well with gas. BP had some oil sands holdings but never produced them and sold up in 2017, so I haven’t included them.
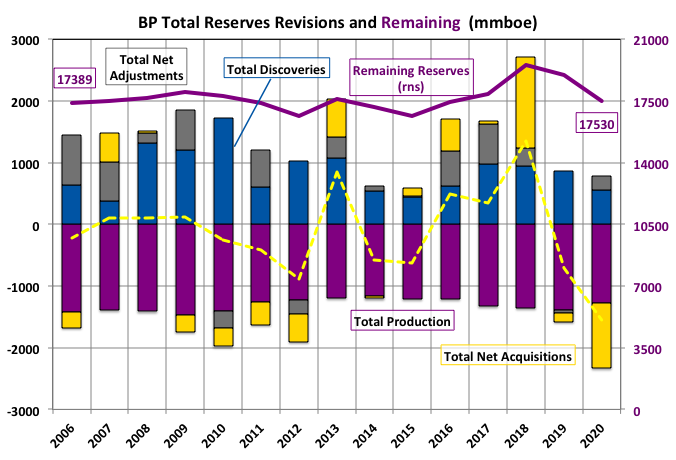
BP does more transfer of assets with other companies than the other three companies but overall the net result is about even.
Chevron
Chevron has recently increased gas production, through LNG projects, well ahead of any reserve gains. Oil production has fallen slightly
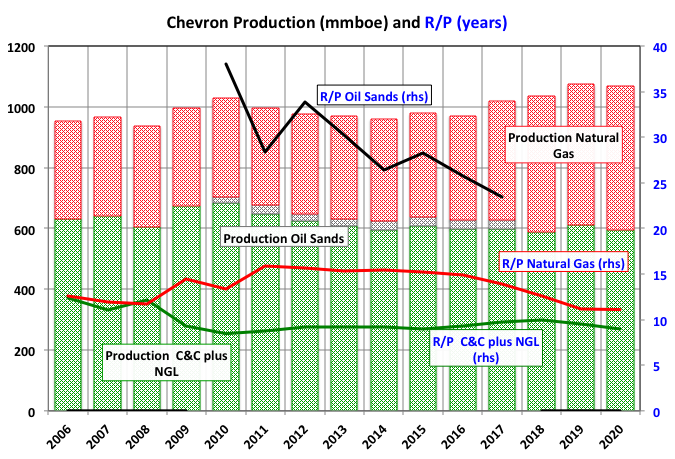
Overall, though, it’s production and reserve holdings have been least affected by this centuries price swings than the other three companies presented here.
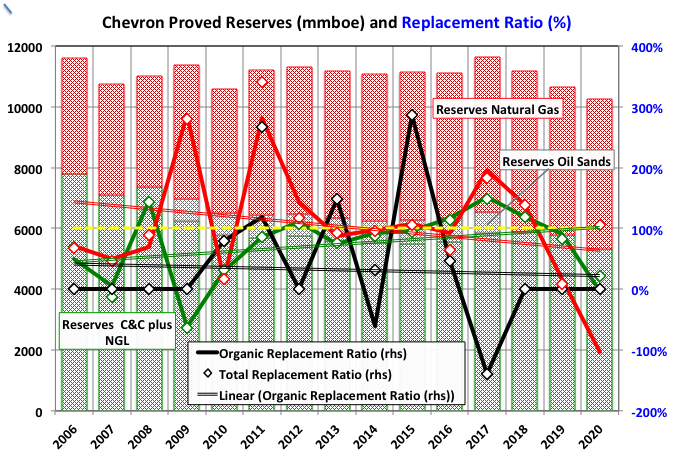
Before 2009 oil sands production (bitumen and synthetic crude) was included in the C&C numbers and, from what I can see, reserves were not counted anywhere. Shell and ExxonMobil provided enough information in earlier years to be able to back out the numbers but Chevron does not so the added reserves appear as a sudden upward revision from zero in 2009. Chevron left the oil sands business in 2017.
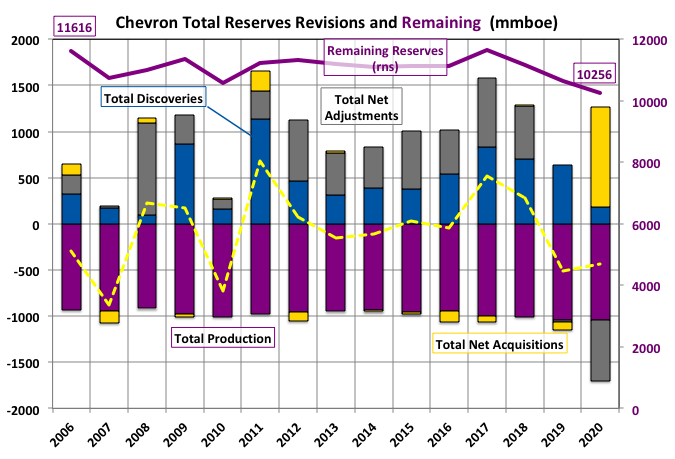
Chevron had been fairly successful at maintaining a healthy replacement ratio without reverting to the chequebook, but reserves started to drop in 2017, possibly explaining it’s interest in buying Anadarko, where it dodged a bullet, but it made a big purchase of Noble assets last year, which only slowed rather than reversed the decline.
ExxonMobil
ExxonMobil has done well on the crude side for production, R/P and R-R but has the worst performance of the four (maybe equal to Shell) for gas.
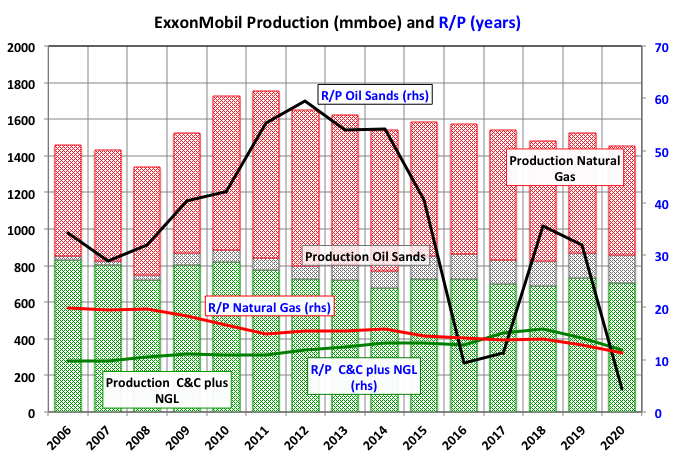
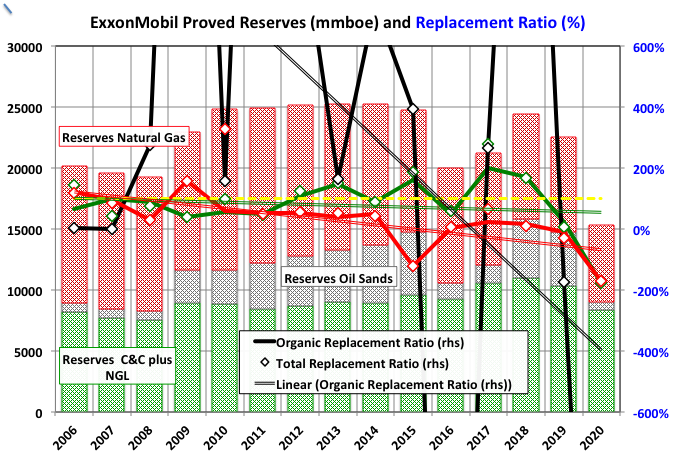
The latest downgrade to ExxonMobil’s oil sands reserves mean that little of that remaining is profitable at 2020 prices with R/P now at only around four years. For oil sands, especially mining based, production does not fall off as reserves deplete, so I guess unless prices rise and stay high the operation would have to be shut down by mid decade. The assets were massively downgraded in 2016, restored in 2018 and then cut by even more in 2020. Replacement ratios are off scale but oscillated between 3000% and -3000%. In such volatility it is difficult to see how shareholders will allow any future capital development. Like the other super-majors ExxonMobil has kept crude replacement ratio at almost 100% (but now falling) but for natural gas discoveries have been much lower and falling faster and last year showed a notable write down, mainly in shale gas.
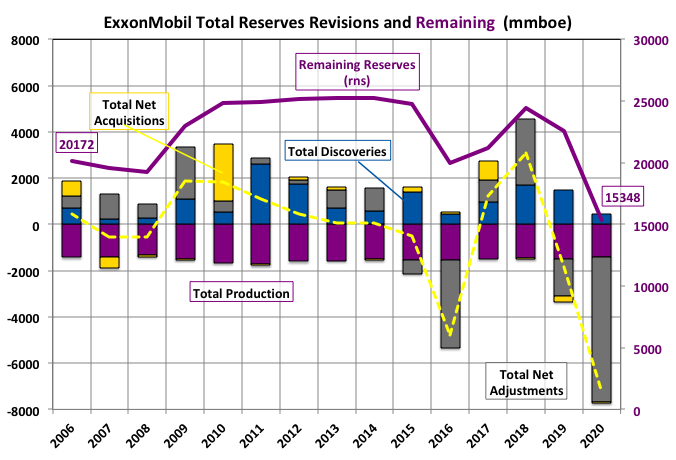
There’s a theory that countries and companies build their biggest skyscrapers at a peak just before a collapse (e.g. the Empire State building preceding the Great Depression). ExxonMobil opened a huge central campus north of Houston in 2013/2014 (not a skyscraper but low rise buildings over a large area), which corresponded with its recent peak in proved reserves. Reserves are likely to be further depleted by divestment of holdings in mature basins like the GoM and the North Sea.
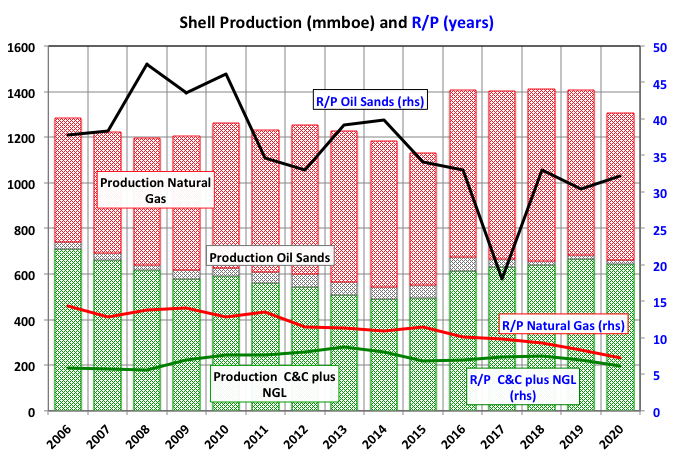
Shell
Shell has managed to maintain production but R/P numbers are now falling quite rapidly, although maybe less so for crude.
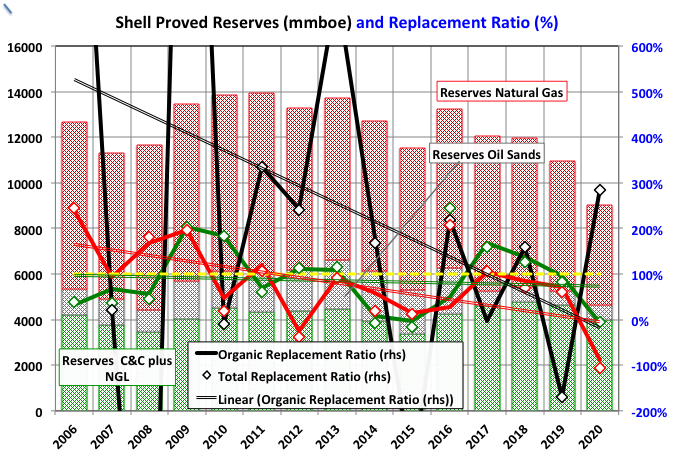
Organic replacement ratios have all been falling steadily and for crude and natural gas have consistently averaged below 100%, and last year both were negative.
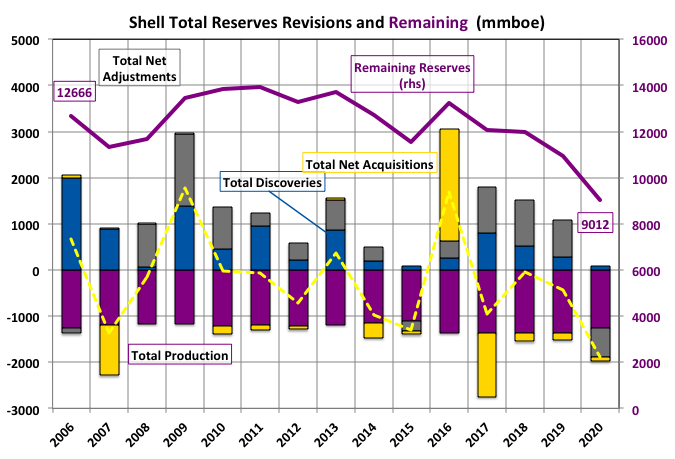
Overall Shell’s reserves seem in the worst shape of the super-majors (although ExxonMobil’s impairments in 2020 after years of stonewalling were pretty dramatic) and have shown accelerating decline since 2016, and I think it is still in the mood to clear debt through dispositions. This possibly explains why it has been so keen to switch to renewables and promote peak oil expectations. Last year it wrote off gas assets as economic revisions but also had some disappointing results from new fields in the GoM. It’s oil sands reserves were little affected because much had been sold off and the rest had been downgraded after the 2015 crash and never reinstated (I’d guess because of the pervading price volatility).
Combined Reserves and Production
The reserves shown are the current annual remaining reserves plus all production since 2006. As assets reach end off life these would normally show creaming behaviour (i.e. tending towards an asymptote) but since 2018 the combined value has been falling due to impairments and sales by the four companies. To put this in context the production shown at 5 Gboe is around 8 to 9% of the global total.
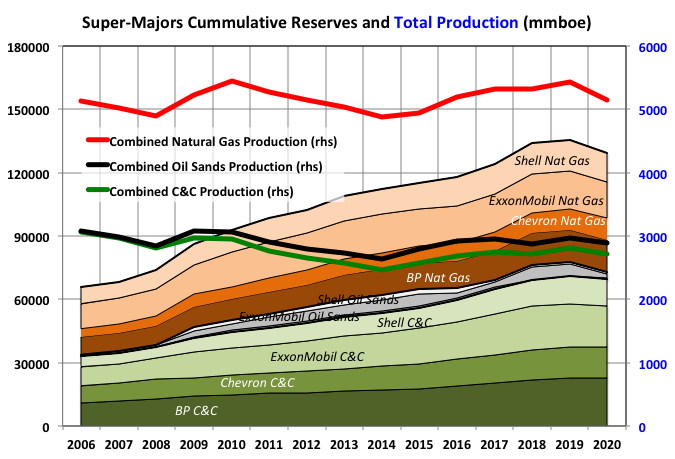
Total hydrocarbon production had risen slightly over the period until 2019 before falling last year. A constant production with falling reserves results in accelerating decline in R/P and in a short time something has to give. Either the reserves have to increase through some large discoveries (unlikely given their recent dearth and current drilling demobilisation) or reserve revisions (requiring prolonged high and stable oil prices as necessary but probably not sufficient) or production is going to drop.
Possible future posts
SEC filings are now required to be available as Excel files and in the past most majors and large US companies have opted to do so, which makes extracting and manipulating their data relatively straightforward. However that is not the case for smaller firms in the US and non-majors oversees, especially non-European and non-Canadian, so I’m not sure how much of the following I’ll be able to do. Canadian firms are interesting because they publish figures for probable reserves, although much of their reserves are bitumen and have different characteristics than conventional oil and gas; and the frac’ing companies’ responses to the price crash are worth scrutiny (plus the EIA issues reserve data for each basin). If nothing else I’ll be able to show overall changes to the developed and undeveloped reserves for the last decade for the largest IOCs and independents.
Part II – Reserves for Canada
Part III – Reserves for Shale Oil and Gas
Part IV – Reserves for Other IOCs and Large Independents
Off Topic Finish: Recommended Media Consumption
I have just finished reading a couple of weighty tomes with similar themes: Dark Money by Jane Mayer is about how some nominally right-wing libertarian sociopaths, (i.e. the Kochs and their coterie) seek to control American politics through various ‘charitable’ think tanks and stealth infiltration of top ranked universities; and The Age of Surveillance Capitalism by Shoshana Zuboff, which is about how some nominally left-wing(ish) libertarian whiz kid sociopaths seek to control the whole world through social media. My main take away is that libertarian ideology is just shorthand for narcissistic entitlement and psychopathic greed.
There is an open access book: Health of People,Health of Planet and Our Responsibility, which is about our various environmental challenges, in particular their direct effects on health, with proposed solutions. Each chapter is contributed by pre-eminent scientists in each subject. As would be expected the real science is excellently presented and care has been taken to make it easily accessible and understood, but as far as overcoming the psychological and political barriers and huge, complex technical, social and economic intricacies required for accomplishing their solutions I think they are in cloud cuckoo land. It often reads like some combination of whistling past the graveyard, a final plea for help to a higher power and nuanced propaganda to get people to do something, anything. I can’t believe any of them are as naively optimistic as they are portraying themselves.
Another open access book, just out so I haven’t read it yet, is from Tom Murphy, of ‘Do the math’, which he appears to be restarting: Energy and Human Ambitions on a Finite Planet.
Mark Lynas’s heavily revised version of Six Degrees (now titled Our Final Warning: Six Degrees of Climate Emergency) is just out in paperback. It is one of the best books on possible future paths under different climate scenarios, I think the way it’s basic structure is based around an appreciation of implicit probabilities (however qualitative) is especially cogent. Like most writers in the field, maybe most everyone except economists and politicians, he has become significantly more pessimistic (realistic?) over the past decade.
At the moment I am reading Arrival of the Fittest by Andreas Wagner, which describes how processes at the molecular level can take short cuts to accelerate evolution. It is very well written.
Here are a few recent articles, podcasts and videos that sum up Surplus Energy Economics by Tim Morgan (especially No. 193); The Consciousness of Sheep by Tim Watkins (always good and now you can get it read out to you if you so wish); Peter Turchin (Cliodynamics); The Climate Question (BBC); Ashes-Ashes; Not Cool: A Climate Podcast; Drilled (Critical Frequency); Radio Ecoshock; IEEFA; Scientists Warning Foundation and Climate Literacy(a primer course on climate science).
147 responses to “Annual Reserve Changes Part I: EIA and Super-Majors”
Feb this year Exxon erased oil sands from its reserves.
Article talked pandemic so doubt they sold anything. Probably just a price determinant.
George,
Nice charts and summary of U.S. Oil & Gas Reserves.
However, it seems to me that a large percentage of these “supposed” unconventional reserves will never be extracted. Thus, the U.S. Shale Industry will have permanent DUCs that will never be completed and proved undeveloped reserves that will evaporate into thin air.
Why? Well, if we look at some of the top shale players, total long-term debt from just five companies increased from $17 billion in 2006 to $133 billion in 2020 (XOM, CVX, EOG, OXY & CLR).
With Equinor selling its Bakken assets (liabilities), writing down $11.5 billion from the company’s original price-tag, and saying it was a big mistake to get into shale…. why would it be any different for ExxonMobil or OXY?
Indeed, the U.S. Shale Ponzi Scheme will continue a bit longer until the day the highly-leveraged over-inflated broader stock markets finally crash. At that point… there will not be a SHALE 3.0. I see U.S. shale oil production falling 75% by 2030.
Steve
It has been a big scrutiny in Norwegian press the past year towards Equinor’s extravagance in prior expenses in Bakken, Eagle Ford and Gulf of Mexico. When it comes to shale oil Equinor really had no edge to be fair. There have been some big ideas in Norway in the past towards exporting knowledge and competence in the offshore O&G sector abroad, and rightfully so. The offshore investments in Brazil, GoM while initially portrayed hopeful, are hampered down as a result of the depressed demand outlook for O&G. Now, Equinor has been forced to be more environmental by the government. What that means is just focusing on more offshore wind power and delaying exploration for oil and gas. Probably a good move in the long run, since exploration in oil and gas can always be turned up a notch if needed.
It is a big debate when it comes to electrifying offshore North Sea in Norway. Not using natural gas on the platforms for electricity but rather use hydro power through cables from the mainland. Costing a lot (more than 50 Billion NOK), the aim is to electrify platforms to export more oil and gas and probably then at the end of offshore installation lifetime then revert the surplus electric energy towards either industry in a hydrogen economy or export/import electricity to UK, Netherlands, Denmark through the cable capacity. The last mentioned to offset the very real Intermittency problems of offshore wind power in the future. Some in the opposition parties in Norway are all against it all as they see as a waste of money. But I guess they don’t see the big picture in my view, as there are some real advantages despite the cost.
There are some good options to the electrified cooperation in North Europe from Norway’s perspective. One is to build up magazine capacity or pumped storage in Norway and offset nature based shortages when “the wind is not blowing” through electric cables in the North sea. The second is to use electricity (or convert it to hydrogen if needed) in energy intensive industries in Norway (e.g. aluminium and even copper mining) and export it. The third is to export hydrogen using ships to e.g. the Ruhr vally for industrial use.
Kolbeinih , tks for a very interesting and clear update on Norway . If shale is a disaster then hydrogen economy is a catastrophe . Waste of time , money and resources . Some people never learn and chase the pot of gold at the end of the rainbow . Best of luck to Equinor .
To produce 1 cubic meter of hydrogen at standard conditions for temperature and pressure, you must consume 15 KWh. The combustion of 1 cubic meter of hydrogen will produce at standard conditions for temperature and pressure, 3 KWh of energy. The energy yield of electrolysis is therefore 20% : it is the disaster of electrolysis. Photosynthetic microorganisms can produce hydrogen but at minute rates. Therefore hydrogen production is rather unusefull with electrolysis except for specific industrial uses.
Sure. Hydrogen efficiency through electrolysis is too low, but there are some breakthroughs in 2020 when it comes to the speed it can be done if the press is to be trusted. And the percentage of 20% can most certainly be improved upon. The second option is hydrogen production by using natural gas, which is much better (60% or more conversion rate), and combining it with carbon capture. Which is cheap for a concentrated Co2 flow. This is what is promoted right now; if renewable energy is cheap enough it can mitigate problems. And hydrogen can pretty much with some modifications use the same infrastructure as natural gas. Both when it comes to pipelines, salt dome storage and turbine electrical generations If it does not work out, it can still be a solution for industrial use in a much less energy rich future.
Kolbeinih
The one Achilles heel of hydrogen is its high flammability and propensity to leak. I ran a program to develop and operate natural gas buses in Ontario. The modifications we had to make to the storage garage were very costly. NG detectors, modified gas heaters in the ceiling, high speed fans that would be activated if a leak were detected. Not sure planners have thought of this.
Condos in my city don’t allow propane cars to be parked indoors underground the building. Why would they allow hydrogen?
JFF
Then to use the hydrogen, it is typically stored at 10,000 PSI, (680 bar) for use in a fuel cell. I recall reading somewhere that consumes 10% of the energy of the hydrogen, ie, 0.3 KWHr, reducing the 20% to 18%. If you could confirm the 10%, or a more accurate percentage, that would be appreciated.
Hydrogen disperses quickly upwards and outwards, but it has a very wide explosive limit, propane tends to hug the ground and collect in enclosed spaces, and can probably find ignition sources more easily. From what I remember they both have really high overpressures when they ignite (i.e. cause a lot of damage). Hydrogen is a binary molecule so has a high isentropic expansion coefficient an gets hot when compressed. I think It has to have specialised compressors (I’ve forgotten the name but the type I was slightly familiar with had two intersecting lobes shaped like figure of eights) and the efficiency depends patly on how much cooling is added with the compression.
George
A hydrogen powered bus/vehicle stored outside is OK. Yes H2 does disperse rapidly. My comments relate to when the bus/vehicle is brought inside for storage or maintenance.
Prior to operating NG buses, we ran propane buses. One day we discussed possible consequences of a car hitting the side of the bus. Cracked lines, leaking propane hugging the ground didn’t appeal. We announced that the project would be stopped in six months and declared victory and prayed.
We then moved on to the NG bus and mounted the tanks on the roof and that is where you will see them today.
As an aside we did this in late 1980s into mid 1990s. I think the future of buses is more likely BEV.
depends on the final pressure – but you’re in the right ballpark.
See section C. in the following paper.
The paper is full of math on the generation, transport and use aspects of hydrogen,
but there’s a pretty picture summary in Fig. 9.
Does a Hydrogen Economy Make Sense?
Ulf Bossel
https://www.industrializedcyclist.com/ulf%20bossel.pdf
“Therefore hydrogen production is rather unusefull with electrolysis except for specific industrial uses.”
That is an unintended oxymoron. Industrial uses of hydrogen are quite huge, therefore, we can expect many GW electrolysis capacity.
Hydrogen in combination with LOHC are able to store energy in a useful way and allow the use of “waste” heat for heating purpose, to reduce the discussion to molecular hydrogen is a useless oversimplification.
The big point in my view is that hydrogen can be converted as you say into industrial usage. And also it can be converted into electrofuels with some efforts (adding co2 and wood resources). The last Bill Gates climate saviour book mentioned electrofuels all the time. Going from excess green electricity to useful fuels is probably the solution portrayed.
Coverting electricity to hydrogen is a waste at 20% they say. But what about combusting refined gasoline to motion energy with just 25-35% efficiency; that is all good. If renewables gives enough energy in volume for some decades, then we are ok for some time; maybe. And that is probably the course.
Steve , you are being very generous with your 2030 forecast . Mike S and me think more like 2025 when the lights are switched off on shale .
Still waiting for a future scenario from either you or Mr. Shellman on tight oil.
Scenario for US tight oil where Permian completion rate remains at todays’s level (about 350 completions per month) and the rest of US tight oil remains at my previous scenario (low prices assumed in each case).
Can’t really imagine in any realistic scenario it would be lower than this (but still waiting on Mike and Hole in head for a “realistic scenario”. Peak for scenario is 6830 in 2026, but chart below shows short term to Dec 2022. Doubtful that output for US tight oil will be this low in the future, even for the unrealistically low oil price scenario used here ($51/bo maximum for WTI from 2021 to 2050).
longer term scenario chart, note that in my opinion this scenario is unrealistically low, my guess is there is about a 99% probability US tight oil output will be higher than this scenario.
Dennis , my contention is not technical but financial . OPM has runout and even at $ 55/60 shale is a loser . Period . If they continue then they will file for bankruptcy before they run out of wells . As to Mike S , he has written so often about the BS of shale and the Ponzi that I run out of fingers to count . Steve does good work ( so do you ) but Mike S is the guy with the torn jeans and face, hands covered with in the black goo . I would place his opinion above all .
P.S : I have commented earlier that all your calculations are based on assumptions that have weak or no legs to stand on . Example WTI at $ 75 . Not going to happen .
Ignorance on display, waiters required
Never say never oily pants
Less than a year ago the market paid to take delivery
I think you must mean waders, not waiters, dumb ass.
Whatever, I’ve never worn bullshit pants. Texas, I’ll bet yours are extra large.
Hole in head,
The scenario above is based on Brent real prices that are no higher than $56/bo in 2019 US$, other economic assumptions are based on what I have learned from Mike Shellman and shallow sand. Note for WTI in 2019 US$ the scenario assumes a maximum price of $51/bo. Also below is a scenario where we assume all new wells after Dec 2020 are financed from cash flow, i.e OPM not needed. As to WTI never reaching $70/bo (as I assume in my standard scenario around the end of 2021), time will tell.
Reminder of my “standard scenario” (F50) where oil price for WTI in 2020$ rises to $70/bo by Dec 2021 and remains at that level until Dec 2045 and then oil price decreases linearly to $30/bo in June 2068 and remains at that level until Dec 2079.
And yes future oil prices are not known by anyone, that much is obvious.
It will be interesting to see who is closer in 2030 for US tight oil, Steve’s forecast of about 2100 kb/d of tight oil output (perhaps less, I took 25% of peak output of about 8400 kb/d) or my best guess scenario of 8800 kb/d of output in 2030. We will know in 2031. My minimum scenario has output of about 6500 kb/d for US tight oil in 2030, much depends on future oil prices.
HT , please refrain from using foul language for other persons posting here . It spoils the atmosphere of cordiality that prevails and benefits no one . Good manners and polite words cost nothing . Thanks .
First of all Hole In Head, it’s HB not HT. Second, what’s the difference of writing BS that you write and bullshit that I write? Third, “OPM has runout”, this is just stupid BS(for your girly eyes). There is record amount of cash sitting on the sidelines today with easy Fed policy. Money will flow to opportunity when risk and returns are profitable. Fourth, “even at $55/60 shale is a loser”, more BS. Show us a link? This is just another stupid ass “assumption” of yours. You don’t know the breakeven point of profit for every shale producer. Fifth, crediting a hole digger as an economist is like having a construction pot hole worker fill a cavity in a tooth. Sixth, stating that $75 wti is never going to happen is an “assumption that has weak or no legs to stand on”. Seventh, calling shale a Ponzi just shows your ignorance of the world energy shortages of the last 15 years and the game changer it really has become.
What hurts this blog HIH is your BULLSHIT assumptions that you spread all over this site day after day.
Your bullshit shows no respect for Dennis quality forecasting hard work.
HB,
I like Hole in head’s comments. I encourage differing points of view.
Assumptions about the future are always weak, as to future oil prices I like 55 to 70 per barrel over the next 5 years for WTI in 2020 US$, hole in head likes $25 to 50 per barrel for WTI in 2020 US$ over the next 5 years (a guess based on his comments).
Only time tells us which assumptions about the future are weak or strong. We will see.
Hole in head,
If your oil price expectation of $25/bo for 2025 is correct, then you would be correct.
Note that the current WTI price is much closer to $70/b (my guess for 2025), than it is to $25/bo (your estimate), lots of time between 2021 and 2025, perhaps oil demand will crash between now and 2025. I hope you are right, but you are far more optimistic than me. 🙂
Dennis , it took OPEC one year and cut production by 4–5 mbpd to bring the price from $45 to 60 . Will they cut another 5 mbpd to get it tp $ 70 ? No , I am not claiming this cut as a black swan event ,it is a business decision and acceptable . However in case they had not gone on an enforced diet the scenario would be quite different . Still 2025 is someway off .
Just in today . There is no going back to pre covid demand . Maybe OPEC will be forced to go in for more cuts .
https://economictimes.indiatimes.com/industry/energy/oil-gas/deserted-streets-raise-alarm-over-indias-fuel-demand-recovery/articleshow/82043222.cms
Hole in head,
India is not the World. It is clear to me why OPEC had to cut, there was a severe drop in demand due to the pandemic. You seem to think the World will never recover from the pandemic, we will talk in 2022 and see how the World economic recovery is going.
Some think changes in behavior due to the pandemic (more online shopping, more telecommuting, fewer business trips, etc) as well as the move to electric transport will mean that World C plus C demand peaked in 2018 and will never return to that annual level (or higher) in the future.
As I suggested, I am not that optimistic, I see World demand for C plus C increasing to about 85 Mbo/d by 2030, then a plateau until 2035 followed by a decrease in demand. If oil prices do not increase, there will be insufficient investment to increase output, a lack of supply to meet demand, and market forces will naturally drive oil prices higher.
You assume that an economic recovery will not happen in the future, now that is what I call a weak assumption. It is true that anything is possible, but the economic history of the past 150 years suggests very low odds that your assumption is correct.
Time will tell.
By 2035 the human population will be about 1,ooo,ooo,ooo greater than it is today.
Yes there will be demand growth, for everything except the truth perhaps.
Hickory,
Most of crude demand is for land transport, if by 2035 much of the crude demand for land transport has been replaced with electricity, then demand for crude falls below the peak demand level. I have modelled this and it is my best guess, but it could range from 2030 to 2040 depending on one’s assumptions about the future. I also assume population and GDP continue to grow in my models and the growth rate assumptions could also be wrong.
Future remains unknown.
Dennis,
It seemed pretty clear there are some here who don’t understand the elasticity of oil demand. It’s my view that if opec cut supply by 4 to 5 mbpd and other things equal. The price wouldn’t go to $70, but more like $170 quickly. That so called Ponzi going on in west Texas would be bring up golden goose eggs over night and with in a few months every rig from the east coast to the west coast would be in operation. Ford F150’s would cluder car lots with $10,000 manufacturers discounts. The stock market would be down maybe 40% and Chevron trading over $200. Within a month oil inventories would be at 5 year record lows.
Dennis , yes India is not the world , but it is a whale when it comes to oil importing . it along with USA and China import about + 40 % of the total world imports . So when analysts say they see future growth coming out of India I have to correct their viewpoint .
For other posts on India my effort is to inform what deep damage has been done and that Covid damage is underestimated by most of the commentators here who are US or Europe based . For the rest we will leave it to 2022 to see which scenario was closest or best .
Especially counties like India will switch to electric transport last.
Cheap ICE engines without lot’s of high tech, as produced from Tata, will be cheaper to buy than electric vehicles for a long time – and India is poor. So buying cost is important. Maintainance and fuel cost comes later.
Additional, the electric grid is very poor in many locations there. No possibility to charge the 20+ Kwh every night someone used the day with taxi driving. Many installations go down when you switch on a water heater.
Yes there will be Teslas for the upper middle class as status symbol. But with the broad vehicle base they will switch last.
Othere nations there are worse. I’ve been in Nepal – a stinky mess in the big cities. And every dawn, the grid breaks down every evening when people switch on the TVs and lights. Absolutely impossible to charge more than a few electric cars there.
Eulen , Tata stopped the production of the cheap car in 2019 . No sales . The rest of your post is bullseye . The grid is not dependable . Brownouts and blackouts are regular , however the major issue is the frequency . The cheapest car currently is Suzuki priced at $ 6000 basic model .
https://www.business-standard.com/article/pti-stories/no-nano-production-since-jan-only-1-unit-sold-in-last-6-months-119070201018_1.html
Steve,
Can you clarify on your 2030 tight oil forecast? In January 2020 US tight oil output was about 7000 kbo/d (EIA official estimate, rather than DPR model). So in 2030 you expect tight oil output will be about 25% of the recent output level (a decrease of 75%) so 0.25 times 7000 or 1750 kbo/d at some point in 2030. Is that about right?
I doubt tight oil output will be less than 6500 kbo/d in 2030, even if oil prices are low. Higher oil prices ($70/bo for WTI in 2020$) is likely to result in a tight oil output level of 8700 kbo/d or more in 2030. What is your expectation for real oil prices (in 2019 US$) in 2030?
Dennis,
In using some of Jean Laherrere’s work on Shale Oil Reserves including the fact that most, if not all, U.S. shale oil companies have overstated their Proved Undeveloped Reserves, and factoring in the rapid decline rate, I stick by my estimate of 75% decline by 2030. Below 2 mbd sounds about right.
I see the Bakken oil production falling to below 250,000 bd by 2030.
Furthermore, there has been some serious fraud taken place in one of the larger shale oil companies that once exposed, will likely put a spotlight on the “Overstating of Reserves.” I wish I could say more, but I have signed an NDA on this issue. But, I can assure you… the data is there to prove massive fraud.
That being said, with the U.S. public debt up over $4 trillion in a bit more than a year, this type of Monetary Intervention isn’t sustainable for a decade. I believe the Fed and U.S. Treasury will begin to lose control of the markets, thus the economy well before 2025.
We must remember, the Stock Market isn’t the economy, but it has taken over that role more recently.
I try to put out the data and info as I see it WITHOUT the NAME CALLING & PERSONAL ATTACKS… well, at least, anymore.
steve
Steve,
So no price estimate, do you assume oil prices will be very low in 2030 due to a severe future economic downturn?
Here is some information from Jean Laherrere on Bakken from late 2016
http://peakoilbarrel.com/jean-laherrere-on-proven-reserves/#more-14237
He estimated a URR of 3 Gb for Bakken, cumulative production from Jan 2000 to Feb 2021has been about 4 Gb.
At the end of 2019 proved reserves in Bakken were 5.8 Gb and cumulative production from Jan 2000 to Dec 2019 was 3.6 Gb, if we assume probable reserves are zero (they are likely about 2.5 Gb), then URR would be 5.8+3.6 or 9.4 Gb. This estimate is more than 3 times larger than Laherrere’s Dec 2016 estimate for the Bakken tight oil URR. My low oil price model estimate has Bakken tight oil URR at 6.8 Gb, so the expectation is that much of the “proved reserves” in the Bakken are overstated in a low oil price scenario (by 2.6 Gb).
My “standard model” which assumes oil prices reach a maximum of $70/bo for WTI in 2020$ from 2022 to 2035 has a US tight oil URR of 88 Gb, with 61 Gb produced from the Permian Basin. A lower price Permian scenario with maximum oil prices of $51/b (2020 $) for WTI has only 34 Gb for Permian URR.
Dennis,
While your math seems logical, what is missing, is the massive debt overhang in the system. This is also true for many of the large oil majors and shale producers. As I have stated several times, debt has been used to offset the Falling EROI of oil. While that is a broad statement, it makes perfect sense when we realize that the U.S. domestic oil production’s EROI is becoming so low, that we can no longer support the highly complex system, designed for a much higher EROI before the 1970s.
The Financial System is highly leveraged on oil production growth. As you realize, there is no real economic growth (GDP) if there isn’t oil production growth. Those who disagree must believe in the ENERGY TOOTH FAIRY.
If the world wasn’t being strangled to death by so much debt, then there is a chance that U.S. shale oil production could remain elevated by 2030. But, we don’t live in a Financial Vacuum.
By 2025, I see U.S. shale production down by 25-40% and 75% by 2030.
Let’s keep track of this forecast.
steve
Steve,
EROEI for a single energy product like oil is not that important, it is the EROEI of the entire World energy system that matters. For individual oil producers EROEI matters not, only revenue, cost, and profits.
Better run oil companies are doing fine. As oil prices rise due to rising costs of production due to depletion oil producers will increase their profitability relative to the low price environment of 2020.
I do not have a lot of confidence in the paragraph I have placed in bold below. I think that scenario is laughable.
Why ‘Peak Oil’ Won’t Mean the End of Drilling
If you accept that petroleum demand may have already peaked — and that’s still a controversial opinion — the world is expected to burn hundreds of billions of barrels of oil in the coming decades.
That gives plenty of incentive for giants like Total or Royal Dutch Shell Plc, plus the hundreds of smaller explorers that remain in business, to keep searching the world’s frontiers for the next place to sink their drill bits.
BP Plc is the only oil major to have gone so far as to call an end to the era of oil demand growth. The London-based company said last year that consumption may never return to levels seen before the coronavirus pandemic.
The rest of the industry still expects at least another decade or so of demand growth before the global need for oil maxes out. And even BP’s less bullish outlook shows a world where a lot more petroleum will be used.
In the BP scenario where we achieve “net-zero” emissions by 2050 and oil demand falls rapidly, the world will still have an appetite for 660 billion barrels of oil over the period, according to the company’s estimates. That’s not too far below the 880 billion barrels consumed during the prior 30 years.
That’s partly because most companies expect greenhouse gases to be eliminated not by the world forsaking fossil fuels, but by using technology to capture their emissions, or planting trees to re-absorb them.
In BP’s “business as usual” scenario, where there’s limited progress in agreeing new measures to reduce carbon emissions but oil demand still sees little or no further growth, another 1.1 trillion barrels will have been used by 2050.
I’d write it like this-
“In the BP scenario where we achieve “net-zero” emissions by 2050 and oil demand falls rapidly [after that], the world will still have an appetite for 660 billion barrels of oil over the period [2020-2050], according to the company’s estimates. That’s not too far below the 880 billion barrels consumed during the prior 30 years [1990-2020].
That’s partly because most companies expect [insatiable demand for the critical energy provided by fossil fuels to fuel demand despite global warming].
Hicks , that’s more like it .
This one is also laughable : ”That gives plenty of incentive for giants like Total or Royal Dutch Shell Plc, plus the hundreds of smaller explorers that remain in business, to keep searching the world’s frontiers for the next place to sink their drill bits.” Royal Dutch Shell stated that their production did peak in 2019 and that their production will decrease by 1 or 2 % per year. That means that they decided to cease exploration and implementation of new oilfields or gasfields, if I am not wrong.Therefore, why there are still people who decide that oil companies should look for new oilfields ? They want to make real their dreams despite the crude reality ?
Ron,
Which scenario do you disagree with there are two. If answer is both (note that it is clear these scenarios were obviously pre-pandemic which was not foreseen by many), what do you expect? The net zero scenario is no doubt optimistic (from a climate change perspective) and the business as usual scenario is cornucopian (pessimistic from the environmental perspective), a realistic scenario (from my perspective) would be somewhere between these two scenarios, after accounting for the pandemic crash of 6% or so in 2020 (annual output).
The EIA STEO expects World Liquids annual output to return to above the 2018 level by 2022. By 2035 we may see output start to drop significantly as World demand for petroleum may wane as we move to electric land transport.
No, no, no, Dennis, you misread my post. I have no problem with either of those two scenarios. I think they are both very reasonable. I said: I do not have a lot of confidence in the paragraph I have placed in bold below. I think that scenario is laughable. And what I placed in bold was this paragraph:
That’s partly because most companies expect greenhouse gases to be eliminated not by the world forsaking fossil fuels, but by using technology to capture their emissions, or planting trees to re-absorb them.
No, they will not remove the greenhouse gases via geoengineering, nor will they plant enough trees to make one damn bit of difference. Both scenarios are laughable.
Ron,
Got it. Note they do not mean geoengineering they are referring to carbon capture and storage in combination with planting trees and perhaps better farming practices to reduce release of carbon from the soil. I agree these solutions will not solve the problem by themselves, but they could be a part of a more comprehensive solution for climate change.
As to how the future will unfold, I am far less confident than you about my ability to foresee what changes we will see in the future.
Good gravy, whatever gave you the idea that I think I have the ability to see the future. Yes, I see disaster but I am not at all sure how that disaster will play out. But I can see your point. You would say: “Oh, how can you be so sure there will be disaster? You cannot see the future”. Well, if you were a member of any of the other millions of species that live on this planet, except this species of rapacious great apes, you would be well aware that the disaster arrived at least half a century ago.
But your position, as well as the position of other cornucopians, is: “Well, we Homo sapiens are doing just fine, our fertility rate is falling, and our population will start to decline in about one hundred years or so.
Sorry, Dennis, it will be way too late by then. In fact, it is already way too late. No, I cannot see the future. But only the stone-cold blind are unable to see what is happening right now.
Ron,
Perhaps it will be way too late, I don’t know the future and have never claimed to.
Dennis, I was talking about the present. Really Dennis! Do you really believe there is nothing wrong with what is happening to the planet right now? Were you not aware that we are in the midst of the sixth great extinction?
Dennis, here is the point: We are currently destroying the environment. We are currently killing off all the world’s megafauna. And I could go on for pages but you get the message.
It just blows me away that you fail to see the disaster that is happening right now. You keep talking about not being able to see the future. Just look at what’s happening right now. As far as the earth’s environment is concerned, we are not headed for collapse, we are smack dab in the middle of collapse.
Ron,
I agree there is a lot of environmental damage, your claim is that it will become worse, I do not know what will happen in the future.
your claim is that it will become worse,
Dennis, you are using the wrong verb. “will become” is future tense. The correct words are “is getting worse”, present tense.
It is getting worse every day and shows no signs of slowing down. You do not have to be a psychic medium to see what is happening.
Dennis, you should be looking at what is happening today and wonder if there is any way to stop it. My knowledge of human nature tells me that no, you cannot and will not tell 7.8 billion people to change their lives, to stop clearing the rain forest, to stop killing wild animals, to stop over-fishing the sea, and to stop doing all the other things that are currently destroying the environment.
Do you actually believe there is a way to turn this destructive behemoth around? Well, you could stand on a soapbox, yell at the top of your lungs, “Hey people, stop this shit!” But I really don’t think that would convince enough people. 😉
Ron,
Yes currently things are getting worse. You assume the future will be just like the present. I have seen lots of changes in the World in my lifetime, most of these I would not have predicted 40 years ago.
Perhaps 40 years ago you imagined what the World would look like 40 years in the future and got it exactly right. I lack such clairvoyance. 🙂
What I do see is that the total fertility ratio fell from 5 children per woman worldwide in 1965 to about 2.5 children per woman today, for about half the population of the World the average births per woman is under 2. The trend toward lower fertility may continue and human population will peak and decline, fewer people will result in less environmental damage. Laws such as the Clean air act and clean water act can be passed which reduce pollution. Humans are not powerless to make changes. I have seen a lot of change in my lifetime (some good and some bad), I expect change will continue, it is the only constant.
Yes currently things are getting worse. You assume the future will be just like the present.
No, I make no such assumption. Over the last half-century or more, things have gotten progressively worse. I assume this trend will continue. Therefore the future will be much worse, not just like the present.
What I do see is that the total fertility ratio fell from 5 children per woman worldwide in 1965 to about 2.5 children per woman today,
More children survive today so therefore women have fewer children. Of course, there are other reasons. But the horse has already escaped the barn. The world is already dramatically overpopulated. And any decline in world population will not likely start for another century or so. Current overpopulation is what is causing the destruction of the environment. It just baffles me as to why you cannot understand that simple fact.
Clean air act and clean water act can be passed which reduce pollution.
Oh, I am sure that will likely happen. And immediately after the USA or some European country passes such legislation, the air will start to clear up over China. Dennis, this is a world problem, not a USA problem. At any rate air pollution is just one of the many problems overpopulation is causing.
Dennis, world population is still increasing. And it will continue to increase for at least half a century. Then any natural decline will be extremely slow. (However, Catastrophic decline can happen much more quickly.) At any rate, the world population would have to decrease by at least 50% to make any significant difference in the destruction of the environment.
Humans are not powerless to make changes.
Dennis, humans are the problem. There is no possible change humans could make to cure the dramatic overpopulation of the world. And no, I am not clairvoyant, but I am not stone-ass blind either.
Ron,
Individual nations contribute to the problem and individual nations can change their laws. Nations that pollute could have import tariffs placed on their goods by low pollution nations so less is purchased and they produce and pollute less.
I agree humans are the problem. Population can be reduced and nations can follow policies to reduce environmental destruction.
My guess is we can reduce World population to under 3.4 billion by 2150.
My guess is we can reduce World population to under 3.4 billion by 2150.
Hey, that’s amazing. I have the same guess, or pretty close. However, there is a difference I am sure. You think this will be a natural reduction. No, that is not within the circle of possibility to reduce the population by almost 60% in just 1.3 centuries. But it will very likely be done, just by catastrophic means rather than peaceful natural means.
Hi Ron,
Scenario based on Wolfgang Lutz SSP2.
Dennis, I cannot argue with a chart that gives no basis for its data. I know this guy is a professional demographer. But upon what does he base his projections? Were there other scenarios presented by Dr. Lutz? Why did you not post the link that published this chart? I cannot believe Dr. Lutz did not qualify his projection with some logical argument. What was It?
There are other population charts. Unfortunately, most of them only project to 2100. And many of them, certainly not all, estimate 2100 population at around 11 billion. But one very extensive study by the United Nations Department of Economics and Social Affiars projects to 2300. It presents three scenarios and puts the medium estimate at 8.5 billion in 2200. This is an extensive paper that runs 240 pages.
But Dennis, there is far more to this argument than just numbers. The fertility rate in Sub-Saharan Africa is around 5%. It is dropping very slowly because of the high mortality rate in young women. They die before they can have 5 children. Their booming population is clearing the forest in order to grow crops. And many families live primarily on bushmeat, monkeys, and such from the ever-shrinking forest. There is virtually no hope for Africa and its wildlife.
Ron,
The chart projections only go to 2100 see
https://www.sciencedirect.com/science/article/pii/S0959378014001095
After 2100 for SSP1 I assumed the decline would mirror the increase in population. See chart below for scenarios which go to 2300, basically a fertility level of 1.5 achieves the kind of reduction in my scenario, and much of the World already has achieved this fertility level or lower.
I mistakenly said SSP2, the scenario is SSP1.
Great article on what an oilfield worker’s life is like in a small oilfield boomtown.
Inside Williston, ND, where men work hard, make bank and get into trouble
Ron.
He wrote a book that recently was released.
I haven’t read it, but I will.
Has really good reviews.
Might help some of us put things in perspective, me included.
I have now read 3/4 of the book. It is a lot less about oil and a lot more blue collar working men.
It is a very good book IMO, worth the read.
Thank you very much for the interesting reading material George. I’ve got Arrival of the Fittest on my list, as a start.
The biggest risk to oil demand in the next couple years is the failure of all those who can get the vaccination to take advantage of the opportunity.
The fewer (and slower pace) people get vaccinated, the higher chance that a more severe viral variant will emerge.
If this happens, it could make the economic disruption thus far look like childs play.
All bets would be off.
I will be a Pfizer double-jabber in 2 weeks.
Americans’ failure to get Darwin 101 absolutely ensures that a resistant variant will arise.
Stupid fuckers, rolling the dice over and over, blindly, will get Snake Eyes, as sure as shit.
As if there is no such thing as a natural immune system (that cannot exist in isolation). Granted, the virus may have been a gov’t-funded lab escapee. Maybe try harder to keep ‘your’ society’s crap away from the rest of the world and we won’t have to find as many ‘solutions’ to self-inflicted problems, speaking of Darwin.
From Art Berman (source):
1 bitcoin = 1000 barrels of oil
1 barrel of oil = 4.5 years of human labor
1 bitcoin = 4,500 years of human labor
“The disconnect between this imaginary value and the physical world is astounding.”
Its not just bitcoin.
A piece of art, measuring about 3 x 4 ‘, previously sold for 9000 x’s more than a bitcoin.
Even more extreme, the number of people in the world with net worth greater than $30 million is over 250,000.
By the measure above, each has accumulated the equivalent of 2,700,000 years of human labor.
Name me a politician not named Eliz Warren who has raised that as big problem, over and over.
The difference is:
The piece of art was created in the artists studio, with not much material effort. In old times even pure biological or nature products- some canvas, some oils, a few grams of mineral powder. And bread and water for the artist (not famous yet 🙂 ).
The Bitcoin networks need round about 10 GW to work (more than all credit card postings).
To put this on a oil basis, since we here are in the oil forum:
Creating this elecric energy with a Diesel Generator with an effiency of 33%, this is round about 500.000 barrel Diesel per day. Not too shabby.
So Bitcoins are a lot of energy – to keep some unique hash values. You could store and browse the entire Blockchain on an efficient smartphone using only a few Watts to operate.
https://cbeci.org/
Hey, 10 GW was the old value I had in my head. Its now 750.000 barrel oil equivalent per day – most mining is done in China powered by coal.
And with Bitcoin prices going up, consumption will go up further. At Bitcoin at a million, there will be several bitcoin related blackouts world wide.
Bitcoin mining rigs are not that difficult to transport to new or remote locations so the majority of mining ends up migrating to the cheapest electricity on the planet. To remain profitable most Bitcoin mining is set up close to power generation facilities and run primarily during off peak hours or seasons. This generates revenue for the power company that would otherwise be lost so in a way it works like a battery to stabilize the energy grid.
Here is an example of a Bitcoin miner setting up mobile turbine Generators and mining rigs utilizing stranded gas that would otherwise be flared. https://www.youtube.com/watch?v=c3PbdwZpSt8&t=42s The whole interview should be interesting to the audience here but the subject of this discussion starts at 1:08:00
Pollux , good find . Puked on my keyboard . 🙂
Calling the BS on DUC’s .
https://oilprice.com/Energy/Crude-Oil/Many-Drilled-US-Wells-Will-Never-Be-Completed.html
Yeah, DUCs are falling because the industry wants to get as much as they can from the shale patch while investing as little as possible. This will continue until all the good drilled wells are completed. A lot of the drilled wells will never be completed because their estimated production does not justify it. These will be dead DUCs. From your link:
Fracking crews are increasing their activity in U.S. shale basins, finishing off a slew of DUC wells, according to the EIA’s latest Monthly Drilling Report. As oil and gas companies focus on finishing off wells they’ve already drilled, on the sidelines, observers are wondering whether this is a fluke or whether the industry has really learned its lesson about drilling rigs that they do not intend to complete.
Are we seeing typical industry behavior, which may indicate that we are in for another DUC increase now that drilling activity has picked up?
Tackling the Fracklog
The way to describe the DUC count is a “fracklog” because it measures the number of wells that have been drilled but not yet completed—essentially creating a backlog of half-finished wells that are not producing oil or gas. The higher the DUC count, the more money oil companies have spent drilling wells that are not yet working—ostensibly while drilling more wells, which they also may not complete.
For the U.S. shale industry, the DUC count has been a bellwether for the oil industry; the higher the DUC count, the more money oil and gas companies are sinking into wells that are stuck in limbo and not producing. This could either mean fiscal irresponsibility or a rapidly changing shift in the markets that too quickly rendered wells once deemed wise as obsolete.
Thought this was of interest.
Lightsout , interesting . We keep focusing on wells, DUC ‘s and production/price but forget GOR and WOR . Thanks for waking us to this hidden problem in LTO play .
Over a period of time the GOR and WOR ratio will increase thus decreasing the profitability of the shale plays . Would it be correct to infer that the sunset on shale output will be much faster and earlier than we envision ?
Do we have an estimate of how many of these DUCs are not viable? I have never really seen one. Over the 2017/2018 period roughly 29000 wells were drilled and completed, most of these DUCs turnover over time, it is simply an inventory of wells waiting on completion, there may be some small number that are not viable (likely it is in the range of 500 to 1000), basically nobody knows the number, perhaps Mr Shellman or shallow sand know (or their guess would be better than mine).
Dennis , I remember a YT of Art Berman where he said that majority of the DUC’s are unviable . It his opinion ,of course I think that was when the oil price was in the $40-45 range .
Hole in head,
Looking for a number, rather than “lots”.
Sorry Dennis , no number . If my memory serves me correct he used the word ” majority ” .
The EIA’s Drilling Productivity Report came out today.
The below chart is their estimate through May. This data also includes production from conventional wells in the shale basins.
I just don’t see any big turnaround in shale production any time soon.
Completed wells, that is fracked wells in all shale basins, have outpaced drilled wells an average of 203 per month for the last 8 months.
Of course, if completed wells are outpacing drilled wells, that means DUCs are falling at the same rate, an average of 203 per month for the last 8 months.
It seems Permian drilling activity is likely to continue to increase, https://www.ursaspace.com/hs-fs/hubfs/Permian-1.png?width=850&name=Permian-1.png (from this site if you want explanation and context: https://www.ursaspace.com/blog/oil-market-fundamentals)
I’m not sure what this means for production as drilling and fracking is one thing and net output something else (decline etc.).
Thanks Jeff, a great blog IMO.
Note that the falling equipment levels in storage is a leading indicator suggesting that drilling and completion will continue to increase. There is about a 3 month lag between SAR activity index and rig count. So we would expect the rig count will continue to increase at least through June, it is likely if that is correct that we will soon reach a completion level in the Permian where output starts to increase (based on my model), likely by June 2021 with output rising to about 4000 kbo/d (tight oil only) in the Permian by May 2022.
Chart with DPR, EIA official tight oil estimate and conventional from tight oil regions, log scale.
I apologize if this has already been addressed.
BIG OIL’S DWINDLING RESERVES ARE A MAJOR PROBLEM
“According to Citi, the overall average reserves in place have fallen by 25% since 2015, with less than 10 years of total annual production available. These issues appear to have been under-assessed by financial markets, with analysts unable to accept that the very future of IOCs is under threat. An oil company can only exist if it has reserves and is able to keep production at targeted levels for a long period of time. If reserves and production dwindle, it is not only the attractiveness of such an independent oil company that comes into question but its existence. In its research note, Citibank described falling IOC reserves as “an impending challenge” and the annual reports from the industry giants suggest that these once-great companies are now in trouble. According to Citibank, it is low oil prices that are the primary driver behind this growing problem. “There is no circumventing this relationship between reserves and earnings, so we believe that analyzing reserve trends is an extremely important indicator of a company’s health.”
https://oilprice.com/Energy/Energy-General/Big-Oils-Dwindling-Reserves-Are-A-Major-Problem.html
Full circle! The Oil Price article references Ron’s reposting of this article (George’s above) in Seeking Alpha.
Regarding this issue – I’m of the opinion that both Shell and BP (European based) have kinda resigned themselves to a gradual reduction of their reserves as they make the transition to greener companies. BP in particular has said how they are greatly reducing the size of their exploration staffs.
Chevron and Exxon (US based) are still trying to buck this trend. As you mention, Doug, the Citibank view is that low oil prices are the primary driver behind this. I still am of the opinion that the reserve replacement challenge is just as much due to the maturity of so many global basins. There just are not that many big discoveries yet to be made.
BP not quite done in this regard:
BP strikes oil in delayed deepwater Gulf of Mexico well
Exploration & Production
April 13, 2021, by Nermina Kulovic
Oil major BP has made an oil discovery at the Puma West prospect in the deepwater U.S. Gulf of Mexico.
The well, on Green Canyon Block 821, was drilled by BP on behalf of co-owners Chevron and Talos Energy.
BP holds a 50 per cent working interest and is the operator with Talos and Chevron each holding a 25 per cent working interest.
It is located west of the BP-operated Mad Dog field and is approximately 131 miles off the coast of Louisiana in 4,108 feet of water.
BP and its partners first started drilling the well in late 2019 using Seadrill’s West Auriga drillship only to suspend it in January 2020 after setting casing below salt and reaching a true vertical depth of approximately 21,500 feet. Operations re-started in the fourth quarter of 2020.
Greenbub,
I’ve actually been following this well on BSEE’s web site. The rig moved off location a few weeks ago. Thanks for the press release above. I’m quite familiar with this part of Green Canyon from my working days. Mad Dog is a large field, over 250 mmbo produced to date, and the MD2 facility set to come on line next year. It could ultimately be a billion barrel field? perhaps?
The Puma diapir is the structure is to the west. Numerous wells have been drilled around the feature between around 2003 or so and 2008 – by the Mad Dog partners, BP, BHP and Chevron. They were unable to commercialize anything they found, and gave up on it in 2009 or so (turned all their leases back to the feds). The west flank had never been drilled, and this is the discovery mentioned above. The north flank has also never been tested, and that is probably the next well to be drilled out here. Most likely development is a tieback to something nearby.
Dennis et al,
Here is my 2 possible future scenarios. So for everyone interested I’ve picked ARIMA modeling (autoregression integrated moving average). So this type of modelling is used more in time series datasets and i believe extensively in econometric modelling (Hence the failure of economist predictions lol). Also its used more in data which reverts back to a mean but it can also be used if your data has a trend.
Anyways enough with the boring stuff. The first one is the more likelier one in my opinion but who the hell knows.
ill briefly get boring again and explain some features in the chart. So the data i got courtesy of ourworldindata. The greyed out area is the predicted area (~2021-2030), the legend on the top left is self explanatory. So the higher the oil prices the quicker the trend will return to the linear regression line, whereas low oil prices would equate to a struggle to revert back to the trend.
Iron Mike,
Can you define “high oil prices” and “low oil prices” for us in your model. Also perhaps the “medium oil price” level, which I assume is associated with the black circles in your forecast (which I assume is the best guess of F50 scenario).
Interesting stuff thanks. I think oil output at the World level does not correlate well with oil prices, a simple OLS on world C C output (EIA data) as the dependent variable with real oil price and real World GDP as the independent variables (use EIA and BP data to get real oil prices) and FRED for World real GDP.
The t-stat for real oil price is only 1.5, we would expect about 2 to be able to rule out the null hypothesis for real oil prices at the 95% confidence interval, for real GDP the t-stat is 25, so the null hypothesis is rejected at the 99% confidence level.
In short, it is real GDP for the World that matters rather than the price of oil. So you might want to redo your model using World real GDP, rather than oil price.
I tend to focus on price, but really GDP is a better focus for the overall oil market (macro level), oil prices are more relevant at an individual producer level (micro level). I expect oil prices might very roughly follow the 1974- 2019 trend line (with a high level of volatility).
link to spreadsheet with data and several regression results below
https://drive.google.com/file/d/1bx5wN_0G8Xf7KOHAuA03YVgj8ek0JRmu/view?usp=sharing
Hi Dennis,
Can you define “high oil prices” and “low oil prices” for us in your model.
Excellent question. I actually thought long and hard on this after i posted my predictions. So I came up with this, in current USD terms:
Low oil prices
$55-65/b => medium oil prices
>$70 => high oil prices
There is a $5/b discrepancy between $50-55 and $65-70 which would respectively be the low-medium and medium-high ranges.
So the model ran a 50 path possible scenario and the black circled line is the average of the 50 path simulation. (I should’ve explained this as well).
The t-stat for real oil price is only 1.5, we would expect about 2 to be able to rule out the null hypothesis for real oil prices at the 95% confidence interval, for real GDP the t-stat is 25, so the null hypothesis is rejected at the 99% confidence level.
This is interesting. So you are saying at the macro level oil production seems to correlate much more with real world GDP than oil prices? (I am assuming prices being inflation adjusted). That is actually understandable at the macro level oil being such a geopolitical commodity if i am understanding you correctly.
Thanks for the link I will check it out soon.
Do you have data for historical world GDP by any chance?
Iron Mike,
Yes, I have real GDP in the spreadsheet I sent you.
See link below for World real GDP, and also nominal GDP
https://data.worldbank.org/indicator/NY.GDP.MKTP.KD
interesting analysis, thanks.
Iron Mike,
Below I present three “models” where I use simple OLS for three models using data for World C plus C output from 1984 to 2019, World real GDP in 2010 US$ (market exchange rates), and real oil prices (2019 US$) data from BP stats. All three models have World C plus C as the independent variable and the first uses both real GDP and real oil price as the independent variables (RGDP OP on legend), second has real GDP as independent variable (RGDP on legend), and last uses oil price as the independent variable.
The first two models have similar adjusted R squared of about 97%, the oil price model is much lower at 28%. Basically oil price does not give us much info at the macro level, there is very little difference between the fist two models and as before for the multilinear regression the oil price variable has a tstat of 1.66 (not significant at 95% confidence level) where real GDP has a tstat of 30 (significant at well above the 99% confidence level).
Link below with excel spreadsheet
https://drive.google.com/file/d/1P5qm2axbpw6z6XuY2PfT9R-E6C2by__0/view?usp=sharing
In the meantime the exports from Africa have dropped by 3 Mb/d since 2007, as consumption in this region has increased by 1 Mb/d.
The situation in Middle East is similar with domestic consumption already at 10 Mb/d
Most of the exports go to China and India, as is well known where production has stalled.
Excellent set of charts Seppo. The big picture.
Even though world production may remain at a high plateau for a decade or two,
importing nations will be struggling to obtain supply of oil available on the international market.
And it will be hard to compete with China for that oil.
Here is the projection for imports to China and India to 2025
“Here is the projection for imports to China and India to 2025”
Yes, and just who will yield their current oil imports to China?
Thanks for the graph, African demand almost never gets a mention.
2nd prediction:
If the virus gets the best of the world or if some other drama overtakes the globe and collapses the recovery of the global economy. This i believe is the less likely scenario.
But let me point this out i am quite confident both these scenarios are wrong lol. So waste time reading this at your own peril.
As you can see the production is struggling and failing to get back to the linear regression or trend.
Iron Mike,
What level of economic output do you assume for this “Great Depression 2” event?
I agree scenario 2 is low probability (5% or less).
Below is a recent update to my Oil shock model, note the projection from 2021-2030 is speculative and from 2031-2050 is highly speculative (aka ridiculous), presented for comparison with EIA AEO and other projections.
Note that extraction rate is for conventional resources only (unconventional includes extra heavy oil from oil sands and tight oil, modelled separately) conventional accounts for 94% of URR.
Hi Dennis,
What level of economic output do you assume for this “Great Depression 2” event?
Once again excellent question. I am making a huge assumption here that real world GDP would have to shrink by something like 2-5%/year for at least 2-4 years. Something i just can’t envisage happening at the moment.
I honestly think that there is like ~ 30% probability that a stagflation scenario might play out, with excessive liquidity in the system and low economic output, where prices might rise for goods and services but economic growth is sluggish. What do you think will happen to oil prices in a stagflation scenario? There seems to be powerful forces in both the low and high price directions.
In your scenario do you think unconventional sources will be viable (whether price wise or economic output wise) to shift the peak more to the right ? Or do you think by that time electrification could make significant impacts to leave unconventional sources out of the picture ?
Iron Mike,
I think the stagflation scenario is unlikely due to globalization, the wage push inflation seen in the 80s is a thing of the past. Agree 100% that a scenario with real GDP decreasing for several years is low probability (less than 1%).
In a stagflation scenario I think oil prices would follow your medium oil price scenario (but I think real prices in 2020 US$ would be similar to your nominal oil price range).
For my scenario, I assume as demand peaks (assumed in 2035) that unconventional resources gradually ramp down as they will not be able to compete cost wise with conventional oil as prices fall due to lack of demand more and more of the resource base will be priced out of the market.
Dennis,
So in your scenario the extraction rate will have a V-shaped recovery probably correlating with a V-shaped economic recovery, but not seeing the peaks of < 2018.
Also you are saying you will see demand peaking in 2035 not supply? So plenty of oil still in ground to be extracted if the demand is there ? URR=3200, how much of that is economically recoverable do you predict?
Regarding further modelling of datasets. As you already know, the actual real world is much more complex than our statistical analysis. I was wondering whether we can mitigate some of the discrepancies. For e.g. the point you made regarding oil prices weak correlation with oil output.
At the micro-level i am making an assumption that oil prices will be more relevant to unconventional sources. What do you think? Overall there is a lot of noise in oil prices at the macro-level. I am wondering whether it would be tediously possible to take the noise out of the oil price data? The correlation of oil production and real GDP is just unbelievably strong.
Honestly though, getting a real world predictive model is just too hard. One has to know specific details at the micro-level (for major producers only ) and then integrate all the data to turn it into a macro-dataset to run your models. Even then there are issues, take Ghawar for e.g. at the micro-level. I have no clue what production costs 50 years ago are compared to now. No one knows. But these are vital pieces of information. Also how much subsidies certain major fields get to produce. Some of these data will be impossible to get. That's just at the top of my head. Once you really think about it, it seems to be an impossible task.
I am going to attempt to run the ARIMA model for oil production and real GDP within the next couple of weeks, maybe I am thinking to check world energy consumption to oil production as well, what is your opinion? I'll post it once i do the code and charting. Cheers bud
Iron Mike,
Yes extraction rates increase as economy recovers in my scenarios, note that the current extraction rate is less than half the level in 1990 when it was about 8%, the peak extraction rate since 1951 was in 1973 at about 16%. From 1960 to 1984 the extraction rate was above 10% every year. All of the URR is economically recoverable. Yes I assume there is more oil that might be extracted if demand was there and oil prices were high.
In my scenario low oil prices after 2035 reduce the amount of unconventional oil extracted and also reduce the extraction rate for conventional oil.
I agree building a macro model from the micro data is a huge task, impossible for me to accomplish. That is the reason I do my models from the macro perspective. The shock model takes estimates of World resources, discoveries, production, and 2P reserves and the historical relationship amongst these quantities. A high level model developed by Paul Pukite, et al is used to link these in a physical way and the model and underlying relationships is used to estimate future output based on URR and how resources have been developed over time. A set of assumptions is made about future extraction rates and speed with which resources are developed (this last assumption basically assumes it does not change in the future.)
Looking forward to your new model.
It occurs to me the shock model presented a few comments up is quite conservative on recovery of extraction rates, it might reflect a very slow economic recovery with very low oil prices (with a probability of 75% or more that extraction rates would likely be higher for conventional oil resources).
A more realistic scenario is presented below where extraction rates return to the 2019 level (but do not reach the 2018 level). Note also that extraction rates have recently (in 2020) reached historically low levels. Every year from 1871 to 2015 the World extraction rates from producing reserves was higher than the 2016 extraction rate of 4.97% and every year before 2001 the extraction rate was over 6%. So even the model below is quite conservative with respect to future extraction rates.
Iron Mike and Dennis , these graphs are above my pay scale with a limited knowledge of mathematics . My question ” Is there a better parameter as an anchor then GDP growth ” ? What I am thinking is that one can goose GDP growth by taking on debt . In the last year FED and treasury printed $ 6 T ( the whole world printed close to $ 13/14 T) , this will evidently show up in GDP growth .Does this debt have an effect ? If not in the short term(2 yrs) then maybe in the medium term (5 yrs).
Hi HiH,
I think Dennis and I would differ in our views regarding what you’ve said. He is much more knowledgeable in economics than I am. But i think debt/GDP seems to be important (both public and private). Last statistic I seen regarding world debt to GDP ~ 355%. Which is extremely high (in my opinion).
I am going to have a look at whether the real GDP equation can be altered to include the central banks printing effects and debt, this might give us a better picture. So to answer you question in my opinion debt does equal to GDP in the government statistics which distorts reality and gives the impression that things are better than they actually are.
Hole in head,
At the World level, debt is money we borrow from ourselves as long as there is no interplanetary lending. 🙂
The short answer is no, debt has little to no affect on World GDP.
The short answer is no, debt has little to no affect on World GDP. I am sure you mean “effect”. ?
O’ gracious Dennis, you cannot possibly believe that. You just have not given it any thought whatsoever or else you would know that is not true.
If there were no debt, almost no houses would be bought, almost no cars would be bought. In industry, the word “leverage” means borrowed money, Bonds are a form of leverage, that is borrowed money, that is debt. If fledging industry could not go into debt, that is borrow money, there would be very little industry.
The world runs on debt Dennis. Debt is what makes our economy run. There would be virtually no GDP without debt.
Ron,
You are correct that debt is necessary for the economy to function, where people get confused is that they believe debt is a problem, it is not. At the World level it is money we owe to each other, whatever people are willing to lend and borrow will be what is necessary for the economy to function, increased lending and borrowing typically indicates a growing economy, that is all.
So the point is that the expanding level of debt is unlikely to cause any problems.
https://en.wikipedia.org/wiki/Gross_domestic_product#:~:text=Gross%20domestic%20product%20(GDP)%20is,in%20a%20specific%20time%20period
GDP measures economic output and real GDP adjusts for inflation so it is the measure of the dollar value of the stuff produced.
I agree debt helps put money in the hands of those that need stuff and increases demand, those with wealth are willing to lend their saved earnings for a fee (interest).
Cash injections by governments (and fiscal deficits) help prevent severe recessions. See J M Keynes General Theory.
Realized, above what I should have said is that debt/GDP ratios are not that important.
See
https://stats.bis.org/statx/srs/table/f1.1
For all economies reporting data to BIS 2020Q3 debt to GDP for all sectors was 252% at PPP exchange rates and 278% at market exchange rates, this is up from 221% and 234% respectively in 2018. This data is total credit to the non-financial sector (so called “core debt”).
Essentially real GDP is like income, typically mortgage lending uses a rule of thumb of debt to income no higher than 3 to 1 or 300%. Japan, France, Ireland, Belgium, Luxembourg and Netherlands have had debt to GDP over 300% since 2015, Japan, Hong Kong, and Luxembourg were all above 400% debt to GDP for 2020Q3. My guess is the World Debt to GDP using PPP exchange rates is the better measure and anything below 350% is not likely to be a problem. Switzerland was at 299% debt to GDP for 2020Q3 and the US was at 290%.
Hole in Head,
I recommend David Graeber who observes in his book: Debt, the First 5000 Years that the hypotheses of neoclassical economic theory are not verified. He then asks the question: “How does one perpetrate a theory based on false hypotheses?” His answer is : “The biggest lies are taught in the first year, everyone knows them.”
Money creation is the heart of any economic system. International finance is a debt based system. On the order of 90% of the money in circulation is created by banks in the form of debt. If no entities take on new debt, this money leaves the system, and the economy comes to a standstill. The only reason people put up with the current system is growth in economic production. Without economic growth, the system becomes simply absurd, as is becoming more and more apparent.
Schinzy,
Which hypothesis in particular is not verified? There are lots of problems with all economic theories.
I agree an economic system with no growth is likely to present problems for capitalism. It will likely be a problem in general until population growth stops. As population starts to decrease it might be less of a problem, but a problem nonetheless.
Steven Keen wrote an entire book: “Debunking Economics” which I have not read.
I will say the following:
I think the entire framework of neoclassical equilibrium theory will be thrown out in the next 10 years.
The first rule of science is that you cannot prove that a scientific theory is correct. You can only prove that a scientific theory is wrong. A scientific theory is wrong if it disagrees with empirical data. The scientific theories we accept are those that have not yet been proven wrong.
I am perhaps wrong, but I cannot think of any price production data which is incompatible with the so called “law of supply and demand”. Nothing can be inferred from a “law” which is compatible with all data. The “law” of supply and demand is equivalent to saying “the price is the will of God”.
I think my main complaint with neoclassical economics is that it treats monetary value as somehow universal. So, for example, you just have to let the market decide what a good exchange rate is between two currencies and that will establish a unique value system encompassing both currencies. This is obviously wrong.
Historically money has been used many times to impose a value system on conquered people. For example the Romans (among others) minted coins with which they paid soldiers to conquer other people. They then imposed a tax on the conquered people forcing them to accept the soldiers coins. Obviously this created thriving trades in sex, drugs, and rock and roll because that’s what soldiers buy. Graeber traces the dichotomy between marriageable women and prostitutes to this period in history because this dichotomy does not exist in most cultures.
Though I haven’t read Keen’s book, I agree with his assessment that dynamical systems is a more appropriate tool to investigate the economy than neoclassical equilibrium theory. If you want to understand the economy, follow the money. Where does it come from, and where does it go. How does it disappear.
Hi Schinzy,
Though i have also not read Steve Keens book I am fairly familiar with his views. His views make sense to the logical mind. However where he has been wrong is that the global economy does not work within the confines of logic. Human behaviour and emotions probably play a much bigger role than logic.
Another point is the opposing camps of whether economics should be considered a science or not. I am in the not camp. I have problems with monetary policy more than fiscal. I believe central banks only exasperate wealth inequality. The result of which can clearly be seen in 2020. The top 0.1% increased their wealth tremendously thanks to central bank policies. While the middle class got smashed.
Schinzy,
All economic theories are wrong, one just has to choose the best of several imperfect theories. Keep in mind that humans are not atoms, theory will influence behavior. A perfect economic theory would need to be kept secret, because if known, smart people will change their behavior to try to game the system and gain an advantage. Of course no perfect theory exists (or if it does it is a well kept secret.) 🙂
Iron Mike,
The wealthy do well because of bad tax policy in advanced economies, and it probably has less to do with monetary policy. Though I do agree the central banks are pushing on a string by trying to expand the money supply in the face of near zero interest rates and should stop simply pumping up asset prices with the expansion of the money supply.
They should reduce the assets they hold to normal levels and force the legislatures to enact fiscal policy to solve economic crises, IMO.
Dennis,
Check your email when you get a chance.
Iron Mike,
Got you email, fine to post charts.
Hole in head,
If we don’t like real GDP as a measure (yes more government debt does in fact lead to higher GDP, just as borrowing for investment spending by businesses will lead to higher GDP), we can use population. GDP consists of consumer spending on domestically produced goods and services, investment spending, government spending, and net exports (exports minus imports). The correlation between population and oil output is also quite good, actually better than real GDP from 1984 to 2019 (98% R squared vs 97%).
Basically population and real GDP are highly correlated (R squared 98%).
Prof Tad Patzek presenting in the next #geoscience & #geoenergy webinar, who will discuss innovative ways to characterise gas production in the USA
https://twitter.com/HWUGeoFracs/status/1381282086733029383
https://youtu.be/syABz6FH6rM
Can still watch this presentation by Patzek, discussion of data on lateral lengths, etc
https://youtu.be/syABz6FH6rM?t=1098
Paul,
Thanks. The talk by Patzek was excellent, I would highly recommend this to all.
The approach is very similar to yours.
Factoids relevant. You can’t produce oil if the workers are dead.
And if you don’t, the people who don’t work the oil fields also die, of starvation.
Black Death hit population hard with that two pronged attack. The disease itself, and then the reality that it had killed the farmers. Starvation was widespread during the plague. The only reason the world’s population did not fall 75% was the Americas were untouched. As is, the population of Europe was smashed, and China, too. That population did not restore for over 100 yrs, when Columbus brought potatoes back to Europe.
The virus is mutating apace, likely outrunning the vaccines. The oil industry needs to think about this. It is they more than anyone else who have to endure somewhat perpetual restrictions. If the eventual Brazil+++ variant gets onto oil derricks, nothing more will come from there.
Lumber prices hit an all-time high.
New crop corn can be contracted for 1/22 delivery at many elevators for $5 per bu and planting corn has just started. A short corn crop in 2021 in the Midwest it will rocket to records. There is a shortage of all feed grains over the aquifer, OK and TX Panhandle basis for feed grains is at all time highs.
Oil has leveled off. Assume the most recent COVID spike worldwide has something to do with that.
An old article but I posted because it concerns oil affordability . Cheap is important but affordability is more important .
https://extranewsfeed.com/no-matter-how-much-oil-is-down-there-it-still-costs-too-much-f7142428849b
Not sure how this has affected oil prices, but it certainly has had an effect on the economy:
https://wallstreetonparade.com/2021/03/senator-ossoff-drops-a-bombshell-the-12-or-13-largest-banks-got-the-trillions-from-the-feds-repo-loans-last-year/?link_id=17&can_id=4b031caa6645ded8bb36f9782aa2a5c4&source=email-newsletter-you-may-disagree-but&email_referrer=email_1139995&email_subject=newsletter-you-may-disagree-but
Russian Minister of Energy admits that Russia has reached peak oil but hopes to still produce 11.1 million barrels per day in 2029.
Russia may have passed peak oil output
Russian oil production might never recover to pre-coronavirus levels, the country’s Energy Ministry has forecast, according to the Kommersant business paper.
SNIP
In the scenario labeled most probable, the Energy Ministry predicts Russia’s oil output will grow over the rest of the decade — but fail to hit the record output of 2019, with production hitting a post-coronavirus peak of 11.1 million barrels a day in 2029 before decreasing to 9.4 million barrels a day by 2035.
But the Oxford Institute for Energy Studies says it just ain’t gonna happen. They say Russian C+C production will be about 9 million barrels per day, and falling fast, in 2029. Their prediction, along with that of the Russian Oil Minister is shown in the below chart. But you can read their report at the link below.
The Future of Russian Oil Production
A side note: Saudi crude oil fell again in March even though quotas increased for all OPEC+ countries. I think Saudi can produce more than they produced in March but, like Russia, they will never again reach their previous peak. So two of the three of the world’s largest oil producers have reached peak oil. That means it is up to the good old USA to save the world from peak oil. Nah, that ain’t gonna happen. 😉
Russia may remain on plateau, KSA may be able to increase output further, depends on demand and oil price along with geology, there is also Iran, Iraq, Kuwait, UAE, Brazil, Canada, US and Norway, difficult to predict how it will play out. There is no doubt that 2018 is the current peak for annual output, I believe the annual World C plus C peak in 2018 (82.878 Mb/d) will be surpassed by 2025 and possibly as early as 2023.
In order to remain on the plateau, new fields need to be commissioned, and there are not many of them.
In Western Siberia, 17 million tons were mined in March 2021, in the best years they mined up to 22 million per month, production there is decreasing every year. The plateau will remain at a maximum until 2024.
Khanty-Mansiysk. In March, Ugra produced 17.589 million tons of oil. This is 1.837 million tons more than in February, the Oil and Gas Information Agency calculated.
In March, the drilling indicator increased significantly to 1 million 426.535 thousand meters. Subsoil users drilled 267,756 thousand meters more than in February.
Average daily production amounted to 567.4 thousand tons. Compared to February 2021, production increased by 4.8 million tons.
The enterprise put into operation 391 new wells, which is 134 wells more than the previous monthly indicator, according to the report of the Research and Analytical Center. V.I.Shpilman.
Recall that in January-December 2020, 210 million 793 thousand tons of oil were produced in the Khanty-Mansi Autonomous Okrug, which is 11% less than in 2019.
Ron
Here is an interesting clip from this WP article.
“Sanctions against the Russian petroleum sector are having an effect, blocking access to needed Western technology, an industry source tells me. Russia attempted to increase production in recent months in aging fields, for example, but output continues to decline because they lack modern equipment..
“https://www.washingtonpost.com/opinions/2021/04/16/kash-patel-trump-intelligence-community/
Russia has been drilling thousands of infield wells, horizontal wells, with the equipment they have. I don’t know how modern equipment would help much. Those old fields are in natural decline. Modern equipment would do little for them. I think that is someone making excuses for their decline.
Canadian production took a huge hit in February. This is very unusual since February is usually one of their best months. Their down months are usually mid-summer when the ground has melted and sometimes too muddy to work over.
Ron
Looking at their sheet in detail, I get the impression February is not complete. A few provinces that supplied production for January have not entered numbers for February.
Looking at their data, I cannot make heads or tails of it Ovi. They have never reported a partial month before so I do not know what’s going on. So we will just have to wait and see.
That being said, you might find this interesting:
Canada’s Energy Future
I will post something from this link in a day or two but I think I will wait for the next petroleum post.
Dennis, booked myself a crate of champagne . 🙂
https://oilprice.com/Energy/Oil-Prices/WoodMac-Oil-Prices-Could-Drop-To-10-In-2050.html
Hole in head,
Not sure there would be adequate supply at $10/bo, my guess remains a low of $30/bo, not all OPEC output is profitable at $10/bo, but much of it will be profitable at $30/bo in 2020 US$.
I hope I am wrong, but I am less optimistic than those that believe World oil demand will quickly fall to 20 Mb/d by 2050, perhaps by 2100.
Dennis.
Why would anyone even predict an oil price in 2050?
How would you (or anyone) know what the profitability of OPEC oil will be in 2050?
I am sure you also realize “OPEC” oil covers a wide range of profitability price points at present. What will be the profile of OPEC production in 2050? How do you (or anyone) know with any certainty enough to make these statements?
I hate to be condescending, but I can’t decide which is worse, the ding dong commodity trader who said on CNBC back in 2016 that WTI would never be above $44 again in his lifetime, WoodMac coming up with 2050 oil price scenarios, or you opining on the profitability of OPEC production (whatever that will be) in 2050.
I sincerely doubt anyone around 1990 predicted anything like what happened with the price of oil from around 1997 until now.
Stuff is moving so fast. We have been offered big bucks to lease some land for solar. I couldn’t have predicted that six months ago, let alone in 1990.
I talked this week to a VP of a geothermal company about abandoned oil wells being used to produce geothermal energy. Likewise, I couldn’t have predicted that either, six months ago, let alone in 1990.
In 1990, I was still in undergrad. There were no cell phones. Nobody had laptops. I typed papers on an electric typewriter. Al Gore had not even invented the Internet yet. Almost nobody outside of Arkansas had even heard of Bill Clinton. The idea of Donald Trump ever being President would have made any proponent of the same be the butt of jokes. How many people in 1990 would have believed we would have a black President in 2008 named Obama? Amazon was years away. Microsoft was in its infancy. Apple looked like a failure. I could go on forever.
I don’t know why you keep making these graphs that go out for decades? You are just shooting from the hip.
Oh yes, how many worldwide pandemics do you have built in your models between now and 2050?
At least you used the word “guess” in the above post, because that is all it could be.
SS, I will jump to Dennis’s defense because the 2050 projection is not by Dennis but by WoodMac . Dennis merely responded to my link which actual was just a teaser (see smiley ) so not his fault . At the same time I am 100% in agreement with you that making projections so way out is ridiculous . My rule is ; 3 years good guess , 5 years WAG , anything beyond 5 is just firing arrows in the dark and sometimes used as a misdirection from current problems . At the end of the day they are at best estimates based on current info/ data available but I think my rule works well within range of projections . tks .
P.S : Sometimes the correspondent has a job to keep , so will write something even if absurd to keep his paycheck coming .
shallow sand,
every prediction about the future is a guess.
No idea what oil price will be in 2050, the $30/bo guess is based on future expected cost for EV transport, $30/bo is needed for ICEV to be competitive (similar cost of operation under and assumption the electricity prices don’t change much and current efficiency trends for ICEV continues). Cost of production for different types of OPEC output also assumed to remain at today’s levels in my guess, I am assuming demand falls to about 40 Mb/d by 2050 (probably optimistic) and I doubt there is 40 Mb/d of oil which would be profitable at $10/b.
Every scenario that goes to 2050 has a set of oil prices associated with it. Every one will be wrong with probability of a correct scenario being exactly zero (one prediction of an infinite number of possible scenarios).
I assume the readers here understand that the future is unknown, both 2022 and 2050 (agree 2050 is ridiculous), many agencies such as EIA carry their scenarios this far and my scenarios do so for comparison.
Basically I don’t think oil prices will be $10/bo in 2050, my guess is $66/bo in 2020$ and I would guess $33 to $132 for a likely range with perhaps a 95% probability the price for Brent in 2020$ will fall in that range. My scenario has Brent price in 2020$ falling to $30/bo in 2068, that’s the minimum for the scenario used to do the economics for the Permian basin out to 2080, I do it that far out to estimate URR. Obviously anything after 2025 is going to very far from the mark, the only way a model can be done is to make some assumption about the future, so I simply make assumptions which will be wrong. Others can suggest different assumptions (which will also be wrong).
The reason for showing decades into the future is to show what decline rates will be for the assumptions that have been made.
Yes there have been lots of changes and we can only speculate on future changes. Below is a scenario I did for a transition from EVs with the very simple assumption that demand from other transport (air and water) and other sources (farms, chemicals, etc) are unchanged from 2018 levels (likely a bad assumption, but simple). Obviously each curve will be incorrect, I say this often, but even when I don’t say it it should be assumed. Woodmac may assume that this gap between supply and demand on my chart (or something like it) will lead to low oil prices. Clearly if the supply scenario and low demand scenario (fast EV transition) were correct (they won’t be) we would see low oil prices. Chart next comment.
chart
North Dakota just reported its Bakken (Not ND) production. It is down 62 kb/d from January. The January LTO report was predicting February output of 1,116 kb/d for the Bakken. Not many new wells brought on-line since December, bouncing around 13,600.
New posts
http://peakoilbarrel.com/opec-update-april-2021/
http://peakoilbarrel.com/open-thread-non-petroleum-april-17-2021/