Jean Laherrere has posted the following charts and comments on Bakken and World oil reserves.
EIA proved reserves on Bakken (ND +Montana) plus cumulative production have changed at end :
-2012 3754 Mb
-2013 5701 Mb
-2014 7203 Mb
-2015 6671 Mb
As shown in this graph in red squares, together with HL ultimates, USGS estimates and cumulative production.
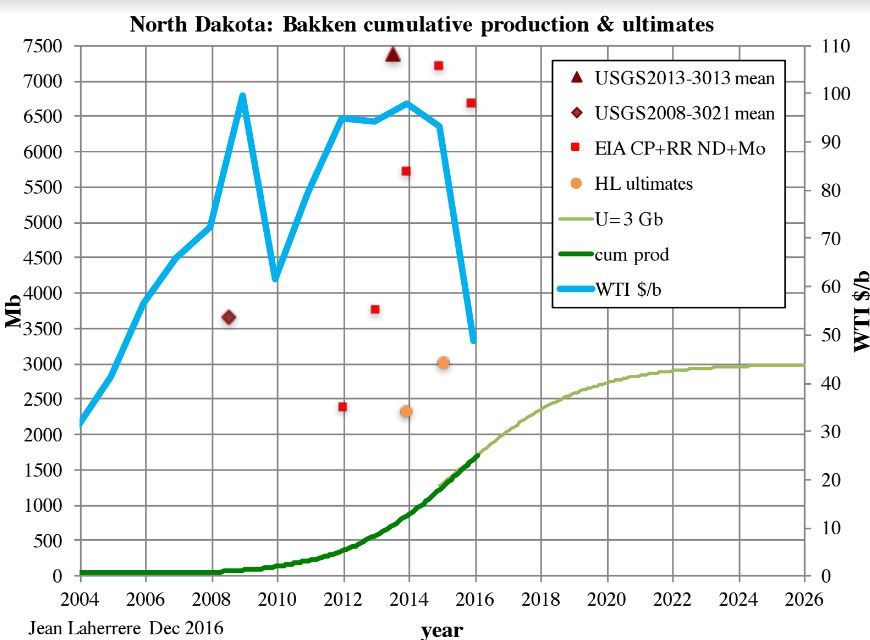
ThisEIA CP+RR value (which is assumed to trend towards the oil ultimate) has increased sharply from 2012 to 2014 and has decreased in 2015 (this decrease may continue towards which value?).
Proved reserves depend upon the oil price.
Its variation indicates that its reliability is poor:
No one knows how to estimate unconventional reserves as LTO because there is not enough historical series to verify if the method is right.
EIA reports Bakken reserves only since 2011.
Unconventional oil reserves are in unconventional reservoirs under unconventional trapping (no conventional water oil contact).
There is no world consensus on oil reserves definition with 4 different definitions:
-SEC with audit for IOCs listed on the US stock market forbidding to publish probable reserves.
-OPEC without audit for OPEC members excluding condensate and NGL.
-ABC1 = Russian definition relying on the maximum recovery.
-SPE-PMRS (Petroleum Reserves Management System) used by IOCs to estimate the Net Present Value before deciding the development of oil project.
Proved reserves are:
-Either financial being audited following SEC rules by IOCs.
-Or political being unaudited for OPEC members.
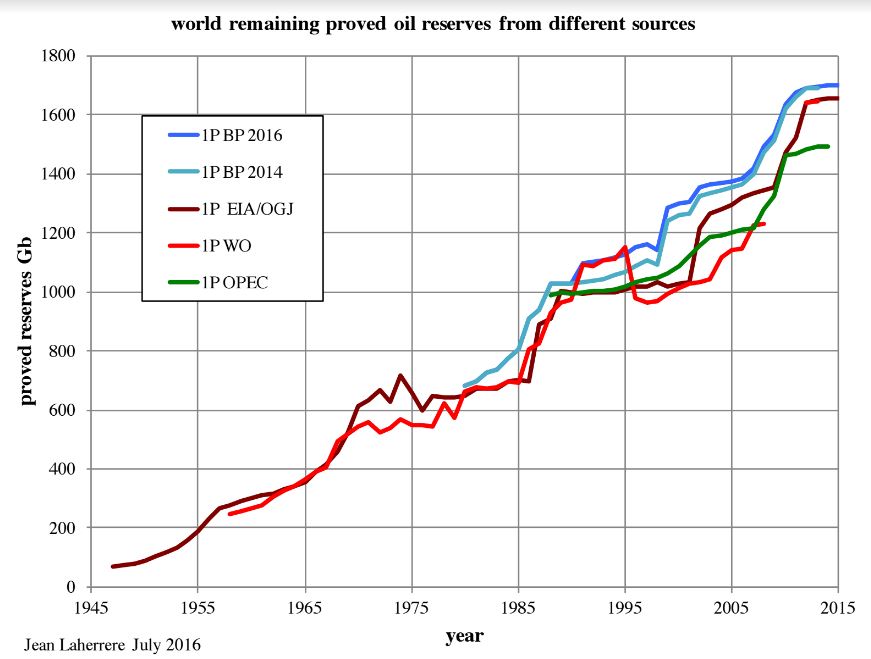
World proved reserves vary with sources, showing that they are unreliable, in particular BP 2016 is different from BP 2016.
The most important graph is this remaining oil reserves from political/financial and technical reserves, showing the discrepancy between the published data (proved reserves) and the confidential 2P (proved plus probable) data.
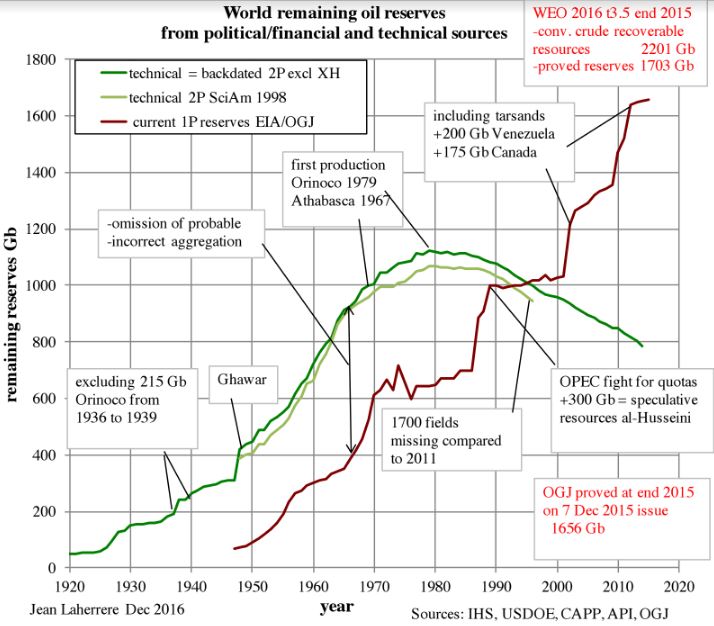
The aggregation of proved field oil reserves largely underestimate the proved reserves of the country or of the world: it is incorrect to make an arithmetic addition, only aggregation of mean reserves is correct.
In the Gulf of Mexico BOEM has decided in 2011 to report GOM oil reserves under 2P, dropping the proved reserves estimates: BOEM is not obliged to follow SEC rules!
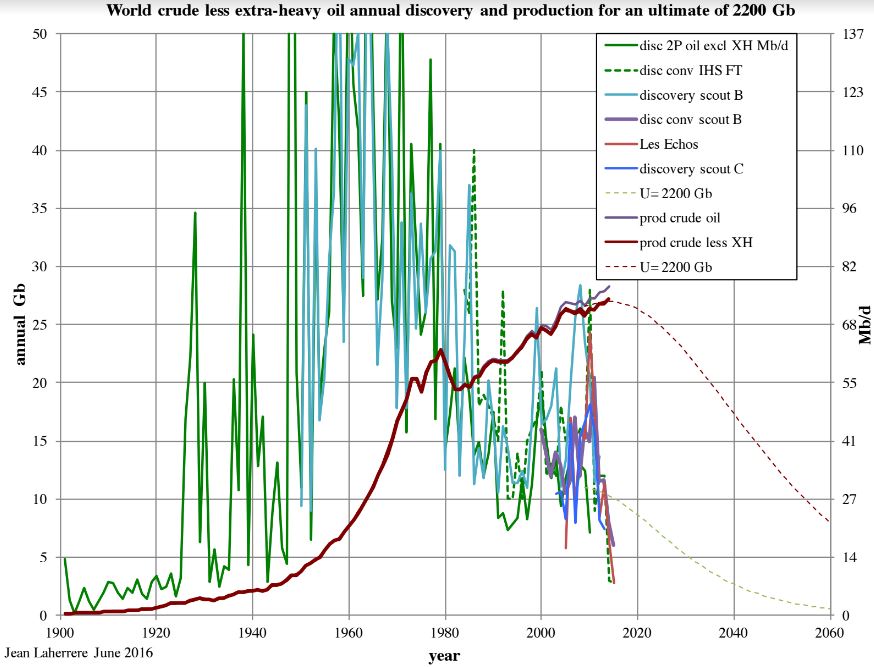
Everybody knows that world oil discoveries are well below oil production since a long time ago and that remains reserves should be decreasing.
Proved reserves increase by adding tar sands & extra-heavy reserves (Canada and Venezuela) in the 2000s when they were in production since 1967 & 1979.
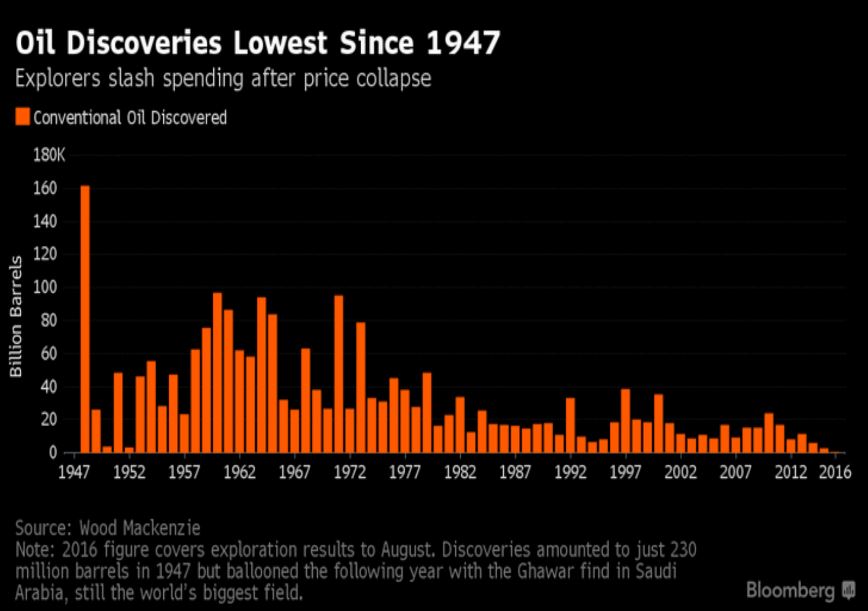
Annual crude less extra-heavy oil 2P discovery has peaked in the 1960s and annual production is peaking now.
Proved reserves is a very poor practice, but pleasing bankers, shareholders and operators because leading later to growth reserves because its wrong aggregation!
Proved OPEC reserves are plain political shows, without any connection with reality.
During the fight for quotas between OPEC members from 1985 to 1989 300 Gb of so called proved reserves were added which were described in 2007 in London by Sadad al-Husseini (former VP Aramco) as speculative resources.
Best regards
Jean
______________________________________________________________
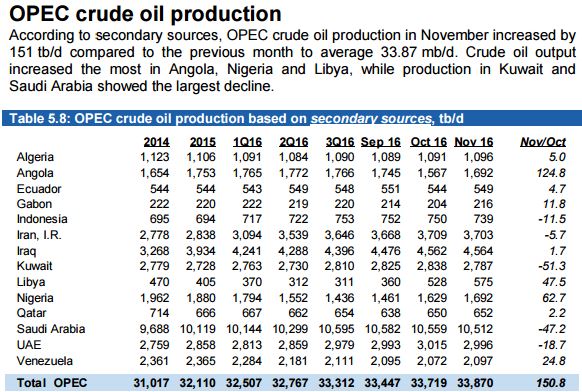
The new December OPEC Monthly Oil Market Report is out with crude only production numbers for November 2016. All charts are in thousand barrels per day.
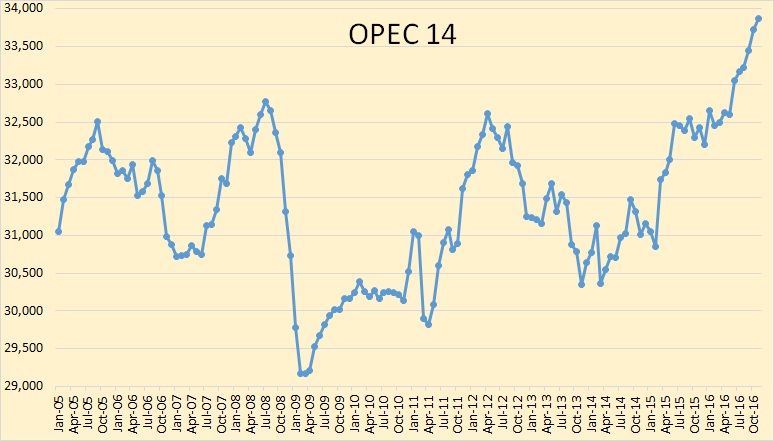
OPEC crude only production reached 33,870,000 barrels per day in November. This includes Gabon. Since May, OPEC production has increased 1.372 million barrels per day.
Net oil importer Indonesia leaves OPEC, again
Indonesia has suspended its membership of the Organization of Petroleum Exporting Countries (OPEC), after the oil cartel decided to cut total crude-oil production by 1.2 million barrels a day.
The decision came as the cartel agreed its first oil output cut since 2008 in a bid to tackle overcapacity and prop up prices.
Indonesian Energy Minister Ignasius Jonan said the country was told to lower its output by 5%, or 37,000 barrels per day, but that it could only afford a reduction of 5,000 barrels.
OPEC is still including Indonesia in its MOMR but they will likely be dropped next month.
Note: When a country is either added or dropped from OPEC, their historical production is also added or dropped. Therefore there is never a sudden increase or decrease in OPEC production due to a country being added or dropped.
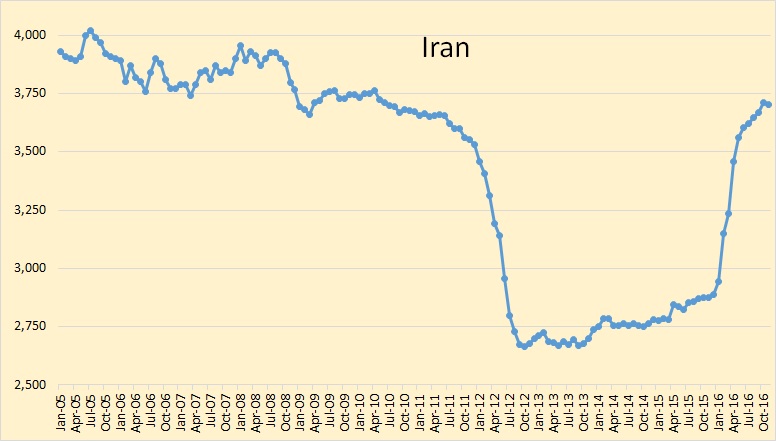
In November Iran showed the first down tick in production since June 2015.
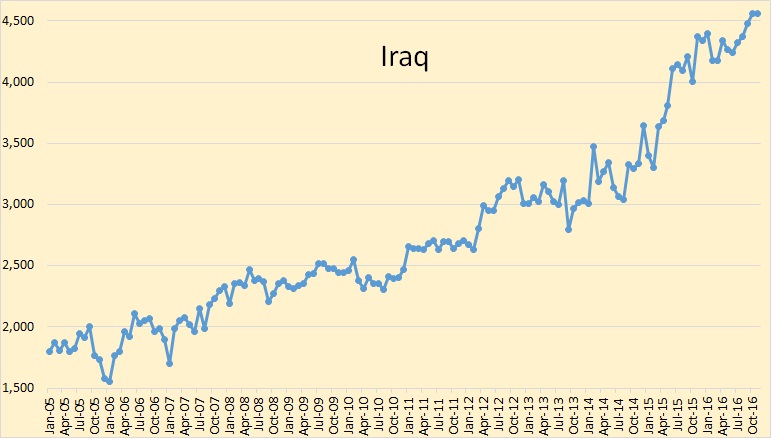
Iraq’s production was up 97,000 bpd in September and another 89,000 bpd in October but was almost flat in November. Iraq, like everyone else in OPEC, is positioning themselves for an OPEC cut in oil production. So they are producing every barrel possible in order to still produce as many barrels as possible after the OPEC ordered cut.
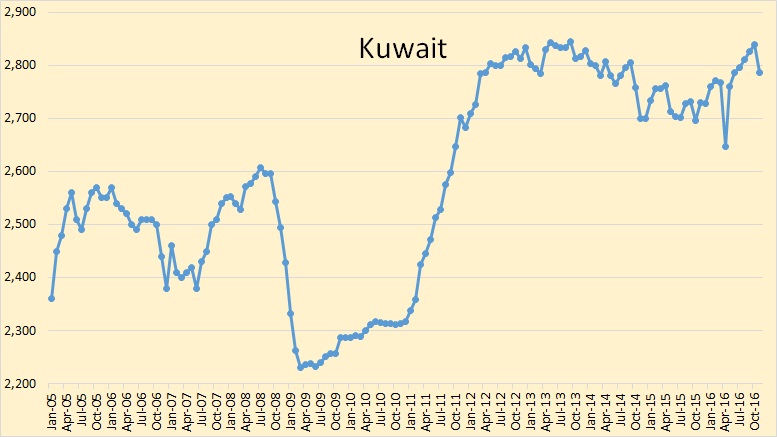
Kuwait has recovered from the problems they had in April but took a hit in November, down 51 thousand barrels per day.
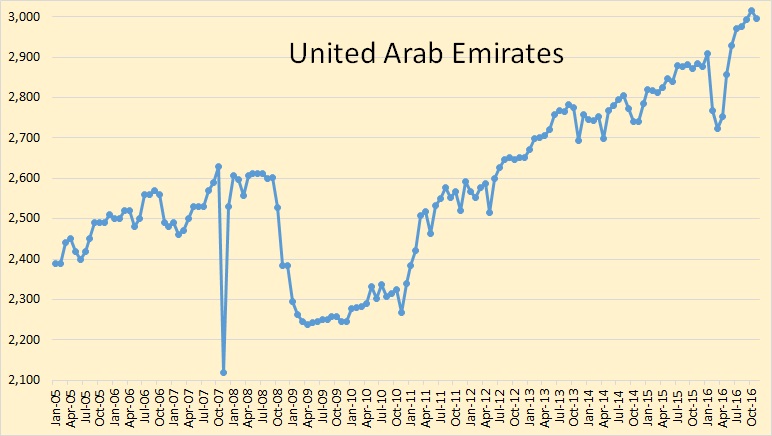
The UAE was down 19,000 bpd in November and is now back below 3 million bpd.
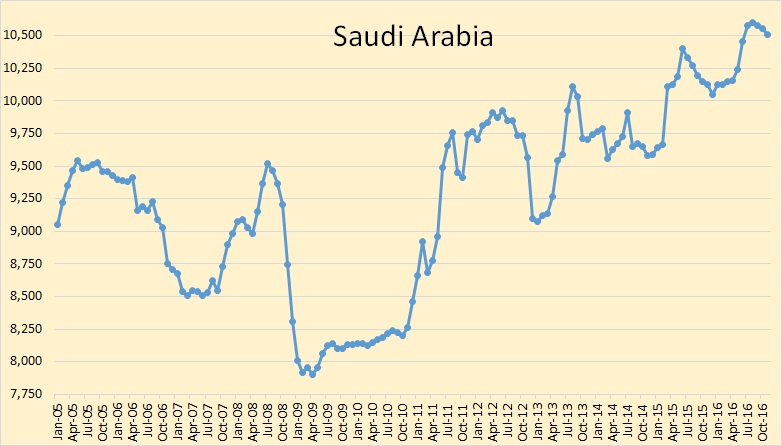
There can be little doubt that Saudi Arabia, and every other OPEC nation, is producing every barrel they can possibly produce. They have all made “heroic efforts” to get production as high as possible before the cut.
Opec has agreed to a 1.2m bpd cut at the end of November. Also 11 non-Opec members including Russia agreed to cut their production by around 550,00 barrels per day.
That cut would put OPEC production at about 32,700,000 barrels, about the average for the first half of 2016. But then Nigeria has vowed to raise production by 500,000 bpd. That would put them at about 2,300,000 bpd, a level they last saw in early 2006.
My opinion, for what it’s worth. Expect less than one million bpd cut from OPEC and no cut whatsoever from non-OPEC. Anything more than that will be due to natural decline rather than any deliberate cut.
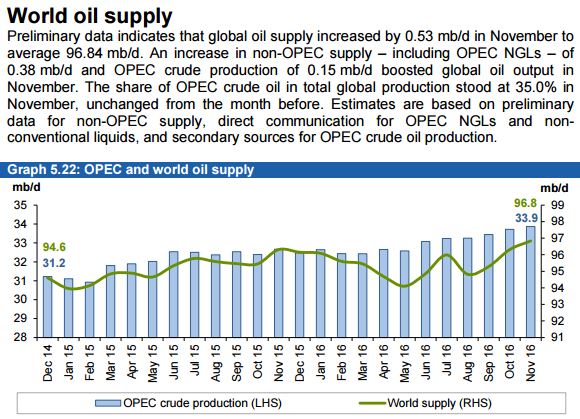
World oil supply has now surpassed its November 2015 peak. However the 2015 average is still above the 2016 average.
Updated charts of all OPEC countries can be found at: OPEC Charts
87 responses to “Jean Laherrere on Proven Reserves”
Talking of reserves have there been any comments on the EIA AEO2016 report yet? They have huge increase in shale reserves (e.g. over 18 Gb for Bakken now). These have been commented on by David Hughes at Resiliance.org.
http://www.resilience.org/stories/2016-12-15/2016-tight-oil-reality-check
But I was particularly struck by this on the GoM:
“In the Lower 48 states, offshore production (which is less sensitive to short-term price movements than onshore production), increases to 2.0 million b/d in 2021, led by new deepwater projects in the Gulf of Mexico, including the Heidelberg and Appomattox fields that are scheduled to begin operations in 2016 and 2017, respectively. After 2021, Lower 48 offshore crude oil production declines to roughly 1.6 million b/d in 2030 and remains at about that level through 2040, as production from newly developed fields is offset by declines in legacy fields.”
(I think they mean Big Foot or Stampede, not Appomattox, which isn’t due until 2020.)
Plotting out their predicted flow (as below) and adding a 10% decline rate after 2040 indicates required reserves from 2014 of about 20 Gb left to produce. Currently there are maybe 4 or 5 (depending on how strict on commerciality you want to be), and exploration and discovery is falling towards zero so it’s unclear how all the rest is going to be found and developed. I think the AEO is written entirely by economists and is wholly demand driven, whereas the other EIA publications at least have some input of people familiar with the oil E&P side.
The EIA has a history of inflated production forecasts. Looking back at the AEO2003 they were predicting that GOM oil production in 2010 would be 2.4 mb/d. That is the sum of shallow and deep water production. Actual production was 1.55 mb/d. They were high by 850,000 b/d.
At that time they were projecting GOM oil production above 2 mb/d through 2025. For the 2010-2015 period, the highest production level was in 2010 at 1.55 mb/d.
Reserves and forecasts deserve no trust.
George,
Where did your quote above come from?
“In the Lower 48 states, offshore production (which is less sensitive to short-term price movements than onshore production), increases to 2.0 million b/d in 2021, led by new deepwater projects in the Gulf of Mexico, including the Heidelberg and Appomattox fields that are scheduled to begin operations in 2016 and 2017, respectively. After 2021, Lower 48 offshore crude oil production declines to roughly 1.6 million b/d in 2030 and remains at about that level through 2040, as production from newly developed fields is offset by declines in legacy fields.”
I agree with you George. I have a hard time seeing how GOM production will be sustained at the levels shown in your chart through 2040. After my GOM post a few months ago, I had some email correspondence with Jean Laherrere. He forwarded me some field specific GOM reserve estimates from EIA. He wanted to know my opinion of the estimates. The list included 57 discoveries that had been made in the deepwater GOM since about 2006. Some of the fields were on production, but many were not. In my opinion, the EIA reserve estimates for these fields, in total, were inflated by a factor of 2. In some cases, there were fields that I know with certainty are either non-commercial, or, will at best be say 5-10 mmbo fields where EIA is estimating 100 to 200 mmbo of recovery. I suspect it is the reserves from many of these fields that is the largest contributor to what I believe is an over-estimate of future production.
Found the quote – in the EIA 2016 report – page “ES-4” (executive summary)
George,
The EIA numbers for unproved technically recoverable resources of LTO cited by David Hughes are from the Annual Energy Outlook 2015, not from the AEO 2016.
We had discussed these numbers many times in the past.
You can see them here:
http://www.eia.gov/outlooks/aeo/assumptions/pdf/oilgas.pdf
Table 9.3. U.S. unproved technically recoverable tight/shale oil and gas resources by play (as of
January 1, 2013) (p.6)
“Oil and Gas Supply Model” is part of the assumptions, which are released several months after the release of the AEO (in this case in September 2015).
Assumptions for the AEO 2016 were not released yet, and probably will not be released at all, as in January the EIA will issue the AEO 2017.
The EIA’s TRR estimate for the Bakken is actually 22.7 billion barrels:
I have found that the EIA did not change its TRR of LTO estimate in the AEO 2016, at least for the Bakken. If the estimate for other shale plays also remained unchanged, it would be interesting to know, why the EIA has risen its projections for the U.S. LTO production growth to 2040.
Here is a quote from “Today in Energy”, August 22, 2016:
“Based on projections in the U.S. Energy Information Administration’s Annual Energy Outlook 2016 (AEO2016), U.S. tight oil production is expected to reach 7.08 million barrels per day (b/d).
……………………………………………….
U.S. production of tight oil and shale gas has increased significantly from 2010 to 2015, driven by technological improvements that have reduced drilling costs and improved drilling efficiency in major shale plays, such as the Bakken, Marcellus, and Eagle Ford.
Production from tight oil in 2015 was 4.89 million barrels per day, or 52% of total U.S. crude oil production. From 2015 to 2017, tight oil production is projected to decrease by 700,000 barrels per day in the Reference case, mainly attributed to low oil prices and the resulting cuts in investment. However, production declines will continue to be mitigated by reductions in cost and improvements in drilling techniques. The use of more efficient hydraulic fracturing techniques and the application of multiwell-pad drilling, as well as changes in well completion designs, will allow producers to recover greater volumes from a single well.
As oil prices recover, oil production from tight formations is expected to increase. By 2019, Bakken oil production is projected to reach 1.3 million b/d, surpassing the Eagle Ford to become the largest tight oil-producing formation in the United States. The Bakken, which spans 37,000 square miles in North Dakota and Montana, has a technically recoverable resource of 23 billion barrels of tight oil that can be produced based on current technology, industry practice, and geologic knowledge. Bakken production is projected to reach 2.3 million barrels per day by 2040, almost a third of the projected U.S. total tight oil production. ”
http://www.eia.gov/todayinenergy/detail.php?id=27612
In my view, the EIA’s estimate for the Bakken looks at least questionable.
Also, projected sharp growth from “Other shale plays” seems speculative.
These include some plays in the Permian (except Wolfcamp and Spraberry), Niobrara, Woodford (SCOOP, STACK) – what else?
Would be interesting to know opinions of our Texan oilers if Austin Chalk can increase LTO output to some 700-800 kb/d.
I just looked at the David Hughes numbers as below. I don’t know where they came from but I think he knows his business. All the EIA ones look way high to me. The AEO2016 came out in August/September, there is a section giving changes to model and assumptions but I don’t know if it is complete.
David Hughes may have access to some EIA’s internal files not distributed to the public.
There is no excel files with LTO production projections by play in the AEO 2016 pages in the EIA website. They provide only combined US LTO production numbers.
The page with assumptions is for AEO 2015.
Next time assumption will be released with the AEO 2017
ASSUMPTIONS TO AEO2015
Release Date: September 10, 2015 | Next Release Date: January 2017
http://www.eia.gov/outlooks/aeo/assumptions/
Alex – it uses the AEO2015 assumptions but then lists any changes starting on page iii, i.e.:
“The Annual Energy Outlook 2016 (AEO2016) Reference case included as part of this complete report (released in July 2016) has been updated from the Annual Energy Outlook 2015 Reference case (released in April 2015). The updated Reference case reflects new legislation and regulations enacted since April 2015, model changes, and data updates. The key model and data updates include: …” and then there’s several sections listing the updates. Most of it is economic and legislative in nature.
Based on a report, linked to by “Tight Oil Reality Check” from oilprice.co, found at Green Car Congress,
Not So Prolific: US Shale Faces A Reality Check
” PCI sees these projections as fanciful. For example, the Bakken would need to double production to more than 2 mb/d, a scenario that “lacks credibility,” PCI says. The scale of drilling required is not realistic, and even today, “well interference is already evident in the former top producing county, Mountrail, indicating that available locations are running out,” the report finds. The Bakken would need to see at least double the current maximum of 2,000 new wells drilled per year, which is not only an unlikely development, but would lead to even worse problems of well interference, negating some of the gains that could be achieved from additional wells.
PCI says that the EIA’s “optimism bias” for production is extremely high for not just the Bakken, but also the Niobrara and even for a few of the highly-touted formations in the Permian Basin, such as the Wolfcamp. The EIA is overestimating what can be recovered from nearly all the major shale basins in the country, PCI argues.
Overall, the notion that shale production can continue to rise for another 25 years is doubtful. And given that policy decision are being made on such assumptions—the incoming Trump administration is under the impression that it can drill its way to “energy independence”—the errors at the EIA could have serious implications for the US. “
It really seems it is virtually impossible to put this puzzle together, given that some of the pieces are missing, some of the pieces have been altered, and some of the pieces only exist in the context of price.
I would love to see someone do a spreadsheet that lists/aggregates:
1. physically extractable “reserves” for each known source;
2. EROEI factor for each–which would somehow factor in likely production cost in terms of likely method and ENERGETIC cost of method;
3. availability of product of 1 & 2 versus price.
Is it out there?
Of course. Many places. All with different results.
Watcher,
Could you direct me to a source or two that you believe have made a good assessment–which specifically include the EROEI factor?
Thanks.
Anyone have a good fix on the relative biofuel production energy production (relative to C+C) in the USA and world? If not, I may have to start digging out the sliderule and google.
My impression is that it is a relatively small percentage contribution to the total, and comes at at big environmental cost.
Thanks
A few years ago there was interest in oil-producing algae. But my impression is that biofuels are no longer a big alternative energy story. Or maybe it is just that solar is getting all the press now.
U.S. and rest of world (ROW) biofuels production forecast (mb/d) and share of biofuels in total liquids production
source: EIA Annual Energy Outlook 2016
This may a stupid question (and, contrary to the popular notion, there are stupid questions), but why can’t the numerous Middle East countries with reserve bases much larger than the US reserve base produce at levels at least comparable to the US (excluding, of course, Saudi Arabia)? I realize the geopolitical issues with Iran and Iraq keep their production levels low, but, to pick on 2 countries, what is the deal with Kuwait and the United Arab Emirates? These two countries, both relatively stable, both with quoted reserves of around 100 billion barrels, (compared to about 40 for the US) pudder along at 2-3 million barrels a day. At that rate, they can keep producing for 100 years.
I realize in this era of low prices, it’s probably a good thing they are producing at those levels, (at least if you are in the oil business) but even when prices were high, and the world could use all the oil it could get, these countries were only producing 2-3 mmbopd.
Is it intentional, are their reserves overstated, or is it a case of underinvestment?
Did you not read Jean’s post?
“Proved OPEC reserves are plain political shows, without any connection with reality.”
Why does OPEC lie about its reserves.
How many real oil barrels do you see here? The OPEC wants you to believe there are 3. But only 1 is real, they made up the other 2.
Back in the early 80s, OPEC decided to allocate production quotas on proven reserves. In the next few years, every country that was a member of OPEC at that time, dramatically increased their “proven” reserves. And some countries, primarily Iran and Iraq, have recently increased their reserves even further.
This was all done with a pencil of course. As a result current listed “proven” reserves, as Jean states, are “without any connection with reality.”
I realize the geopolitical issues with Iran and Iraq keep their production levels low,
Those geopolitical issues in Iran are gone now and they are producing every barrel they can possibly produce. Iraq still has some issues nevertheless they are also producing near what their capacity would be if they had none.
Kuwait oil reserves only half official estimate-PIW
PIW said the official public Kuwaiti figures do not distinguish between proven, probable and possible reserves.
But it said the data it had seen show that of the current remaining 48 billion barrels of proven and non-proven reserves, only about 24 billion barrels are so far fully proven — 15 billion in its biggest oilfield Burgan.
Note: PIW is the publication “Petroleum Intelligence Weekly”.
Far from stupid that might be one of the most important questions facing us in the next few years. Hopefully there are politicians and civil servants asking it themselves, but I suspect it is only really considered by the upper echelons of the armed forces in strategic defence scenarios.
Apart from adding all the reserves in the 80’s and 90’s the OPEC members never show any reduction – i.e. effectively they all report ultimate recovery, not remaining reserves. Even though they all cheated on the numbers they are (were?) a cartel with the specific original aim of limiting production to maintain prices – generally they developed their large fields on 2% depletion per year – a lot less than typically used on smaller fields. In the last ten years or so it’s been fairly easy to add in-fill wells onshore and in shallow waters to maintain production rather than allowing decline (or developing other fields if they found any). In the last couple of years they’ve pretty much run out of options for easy oil and don’t have the money to suddenly boost production, and developing the surface facilities needed would need another 5 years anyway.
Let me tell you what happens at the upper echelons of the armed forces in strategic defense scenarios.
1) If oil is going to be scarce, great! If we are the ones with it, we win all the battles.
2) Wait. If oil is scarce, and we are the ones with it, we don’t want any battles. We don’t want to kill the enemy. We want him alive consuming food so they run out faster and starve and surrender and spare us casualties and also turn over all their factories to us in the surrender — factories we didn’t have to destroy.
3) Wait, what is this crap. If we don’t destroy things, there is no promotion for officers from achieving victory. There is no victory in having to feed civilians. That’s not our job.
4) Hmmm, because there are no battles and this is an unpleasant situation if one wants promotion, maybe the whole premise is wrong and there is no scarcity. Let’s just plan for no scarcity.
5) We’re not stupid. We aren’t going presume there’s no scarcity if there is scarcity. How do we find out? Let’s hire some consultants.
6) Consultants examine the situation and determine what answers they can provide that will get them hired to consult next year, too. Scarcity isn’t the path to additional contracts, so there will be no scarcity. The glory hounds like hearing this, and the consultants sense they liked hearing it. So they will say it again.
7) Generals are pretty smart people and they suspect this is going on, but much of their staff likes what they are hearing and the Generals change jobs often, or retire. Some may even become consultants.
But keep in mind that not all services are seeing battle in equal amounts. If you are in the Navy, you are getting promoted without killing people.
So the idea that the military wants to see combat doesn’t hold across all services.
Also, the Navy has some advantages over the other services because it has ships that are mobile and can quickly move around when a display of force is needed. And those ship contracts are big deals.
So if you want to spend a lot of money on defense contracts, especially ones that create jobs in the US, but you don’t want the messiness of having service people coming back with war injuries, beefing up the Navy is the way to go.
The politics of the military is more complex than saying they always need a war to foster promotions.
The drinking toast for the Royal Navy on Thursdays is:
“A Bloody War or a Sickly Season” (and a quick promotion!)
I hope someday to find a conversation with less cynicism about people’s motives and, sadly, less reason in the world for cynicism.
I updated my charts for new production in GoM. Otis is a small tie back to Delta House hub which I’d previously left off. Odd Job is another similar at around 5000 bpd, which was due next year but got completed last month – no production yet. (I remember Marmalard, Bluto and Otis from the movie but not Odd Job – maybe a James Bond reference?). Coelacanth is a new facility with 30000 bpd nameplate also ready for production last month.
I also reordered the chart to be in order of initial flow. One thing this shows more clearly is a problem with tie-ins to existing hubs like the Mars field to the Olympus spar. New tie backs can maintain a plateau but often cannot increase flow if production is hitting a limit on the surface facilities rather than in the wells – new tie ins have to wait for capacity space to be made from decline. Small tie backs tend to have fairly rapid decline even compared to other deep water projects.
How accurate are U.S. DOE/EIA Projections?
Here are some projections I made in 1999 which are compared to what the EIA projected in 1999.
Author’s Projections Peak Prod. Year Peak Prod. (mb/d) 2010 Projected Prod. (mb/d) % Error
Norway …………………………2001 …………..3.2 …………………………….1.6 …………………………+14.4
U.K. …………………………1999 …………..2.7 …………………………….1.5 …………………………-22.0
Sum …………………………………………..5.9 …………………………….3.1 ………………………….0.0
U.S. DOE/EIA’s Projections
Norway ………………………..2005 …………..3.9 …………………………….3.7 …………………………+97.9
U.K. ………………………~2006 …………..3.3 …………………………….3.0 ………………………..+143.9
Sum …………………………………………..7.2 …………………………….6.7 ………………………..+116.1
Actual Production Values
From U.S. DOE/EIA
Norway ………………………..2001 ………….3.226 ………………………1.87
U.K. ………………………..1999 ………….2.684 ………………………1.23
Sum …………………………………………..5.91 ………………………………3.1
The 2010 values for the US DOE/EIA are based upon an interpolation between the peak projected values and the 2020 projected values
Actual Production data is based upon data from the US DOE/EIA
Mexican Oil Production
In 2003, the U.S. DOE/EIA was projecting that total liquid hydrocarbons production (crude oil + condensate + liquefied petroleum gas + biofuels + refinery gain) for Mexico would rise above 4.2 mb/d by 2010. Specifically, here is what they stated in their International Energy Outlook 2003:
“Mexico is expected to adopt energy policies that will encourage the efficient development of its resource base. Expected production volumes in Mexico exceed 4.2 million barrels per day by the end of the decade and remain near that level through 2025.”
It was clear by 2003 that Cantarell complex oil production (crude oil + condensate) would start declining in approximately 2005. Since the Cantarell complex produced about 60% of Mexico’s oil production in 2002, it appeared obvious that as Cantarell complex oil production started declining, it would bring down Mexico’s oil production as well as its total liquid hydrocarbons production.
Mexico’s oil production peaked in 2004 at 3.48 mb/d. By 2010, it was down to 2.62 mb/d, a decline of ~860,000 b/d. In 2010, Mexico’s total liquid hydrocarbons production was down to 2.98 mb/d according to US DOE/EIA data. The U.S. DOE/EIA was high by at least 1.22 mb/d for their 2010 Mexican production forecast.
Bottom line, if Ron P and Jean and the many others in their camp are right, then someday within the easily foreseeable future we are going to be looking at some damned scarce and expensive oil!
An economy wrecking shortage might come about in as little as just two or three years, if the cards fall wrong.
Personally I plan on having a substantial personal stash of diesel, working on the assumptions that it’s about as good as money in the bank and that the interest the bank would pay me won’t even begin to cover the likely rising cost of buying it later as needed.
And while I think it is very unlikely that I will live long enough to see a time when I CAN’T buy diesel fuel, I’ve already seen a time when the local suppliers were out, temporarily, and you couldn’t get a delivery in less than a week or two, unless you were an old customer. Even then, some people waited a few days.
Not many people are situated to store large amounts of anything, but living on a farm has some advantages.
We better be praying to the Deity of our personal choice that the electric car industry grows like crabgrass in hot wet weather.
Some of the customers are going to react violently to high prices and uncertain deliveries, and it’s just about foregone conclusion that hot oil wars are in the cards………. unless we can get away from oil before the oil gets away from us.
Now I was badly fooled back in TOD days by experts assuring us we were about to run very short on oil……. so I won’t predict when TSHTF.
But the old Frenchwoman DID eventually die.
https://en.wikipedia.org/wiki/Jeanne_Calment
She sold her home using an arrangement similar to modern reverse mortgage at the age of ninety and lived past 120. The buyer lost his backside on the deal.
Some things, such as this old French woman, seem to last just about forever, but anything that comes out of a hole in the ground WILL eventually come up in short supply.
Personally I’m spending the next year converting all remaining household appliances to electricity, and then getting solar and batteries to make my house grid-independent, and then putting my investments into the companies selling electric cars, solar, and batteries. I figure if-and-when the economy-wrecking oil shortage comes, I’ll have low running costs, others may even want to pay me to access my electricity (& car), and my investments will be in businesses whose products people will be buying as fast as they can.
*Shrug*. What can I say. I’m a capitalist. Not philosophically; I mean I’m actually a member of the capitalist class, although on a pretty small scale. I have partial control over the profit from the means of production, without doing the labor myself. That makes me a capitalist. I’m pretty good at it. I firmly intend to be positioned to profit from any oil shortage.
Jean Laherrere’s scenarios for the World are pretty close to my Medium scenario.
This is not surprising because most of my World scenarios are based on Laherrere’s excellent work.
Dennis – to be clear ’cause I’ve already got myself confused once between the Bakken numbers and global, the remaining reserves are the dark green line which looks to be around 790 in 2014, so maybe 760 now? That is C&C less XH.
How do you think this is split between developed, undeveloped and undiscovered? I’d suggest 620 developed – that would give an nature decay rate assuming exponential decline of 4.35% per year if we are at 27 Gb annual production (or exponential time constant of 0.0445 if I can still remember the maths properly). That sounds pretty much as IEA are saying. Then there would be 120 Gb discovered but undeveloped – I think that can support about 20 mmbpd maximum that could come on say at 2 mmbpd this year and linearly decline to zero over twenty years. That is pretty much what I see from projects on books at the moment (including cancelled ones that could return).
Then 20 Gb yet to be found – that could support about 0.35 mmbpd added over 20 years declining linearly, assuming 2 Gb per year discovery initially (it would more likely tale off exponentially and the development would lag behind a bit but I don’t think that makes much difference). There’s also some heavy oil to add, but that would probably be limited by development effort rather than resources – say 0.2 mmbpd added for 50 years.
If I use those numbers and assume non exports stay constant (there are arguments either way that they could increase or decrease) I get zero net exports around 2036, and 50% available around 2026. With the logistic curve shown things get pushed out a bit in the near term and falls steeper later on, so these figures are 5 or so years later, but not much more.
I guess my simple model was a bit too simple. With some refinement. so the new conventional fields ramp up, plateau and decay, I get fall to 50% current exports (assuming producer countries internal use stays constant) in 2032 and to zero in 2041. That looks to fit pretty well with the Laherrere logistic curve. Given current development plans it won’t look quite like that because there is a big hole coming in both conventional oil and XH projects in 2019 to 2023.
Oil gets most of the discussion here but I wonder if natural gas might start to get more attention in the coming years. The chart below was from IHS. I think oil discoveries this year might be about the same as, or a bit less than, last year (assuming the Caelus Alaska 10 Gb stated resource isn’t included, which I don’t think it will be) – there’s still a couple of weeks to go though and companies like to announce finds around now to make the yearly statement look good. However gas discoveries look to be well down, unless someone here has been following and can advise differently. The nat. gas market is a bit different to oil because most is used by the producer country and an LNG spot market is only just developing, so most export gas is sold on long contracts. But there is still a similar delay built in between signal and development of new supplies – probably longer than for oil as the LNG projects are even more costly. So the current LNG glut will likely translate into shortages at some time. There is a lot of stranded offshore gas in medium and small sized fields – the next boom might be FLNG to develop this, using standard designs that can be urned out in a couple of years.
Having just posted the above I’ve seen that the ExxonMobil Liberia well is dry. I think thats the third or fourth high impact well in a different frontier territories that has come up dry this year, and might be the end for prospects offshore Liberia. These failures are as important in determining future discoveries as successes. I think that future undiscovered reserve numbers, such as those from Rystad, assume that discoveries in frontier territories go on at about the same rate as we’ve previously seen, but even if prices rise significantly exploration will not resume there if the prospectivity has been shown to be low.
George,
The situation with global natural gas is different.
1) There is significant spare capacity in a number of countries. For example, Russia has reduced gas production in the past few years due to falling demand from Europe, but can easily increase it if demand returns.
2) There are significant developed and undeveloped proven reserves. Reserves/production ratio is much higher for natural gas (see the chart below).
3) Natural gas resources are generally explored less than oil. Potential for increase in proven reserves is much bigger for natural gas.
The countries and regions with significant resource potential and able to sharply increase production include: Iran, U.S., Russia, East Mediteranean, several countries in Asia (including China).
Several countries in Africa are not producing at full potential.
Global proven reserves / production ratio for oil and natural gas
source: BP Statistical Review of World Energy 2016
What’s shocking about that chart AlexS is that even with the sharp price increases of oil between 2000 and 2014, the oil R/P ratio has still steadily declined. With investment having been crushed in the last few years, looks like we are facing a Seneca cliff.
George Kaplan,
I got a bit of a shock when I read the caption in small print: Data excludes onshore Canada, US lower-48 onshore, and US shallow-water.
The chart is named “Annual conventional oil and gas volumes discovered”.
Onshore Canada production is dominated by oil sands; US lower-48 onshore – by tight oil.
Conventional output in both cases is from mature fields; and there were no major conventional discoveries for many years.
US shallow-water GoM is also a mature province. New discoveries were made in deepwater GoM.
AlexS,
Oh my, I overlooked “discovered.”
Thanks.
The gas market is weird because so much gas is produced as a byproduct of oil production. This massively distorts the market. Standalone dry gas wells are usually pretty poor investments, and I’m not sure how expensive gas would have to be for most of them to break even *with no liquids or condensate*. Maybe one of you knows.
I’m sure some have cheaper production costs than others. I’ve heard $6 to $8 for fracked shale if there’s no liquids and no condensate sales, but I have no idea whether that’s correct. I suppose North Sea gas is probably cheaper than that to produce but it’s running out now, right?
Anyway, at the moment so much gas is produced from oil wells that the gas prices are seriously depressed and new dry-gas wells are typically unprofitable. This seems pretty clear. With the GOR going up on pretty much all oil wells, this won’t change until there’s a serious decline in oil production. If any of you can game out the future of natgas beyond that, you’re doing better than me.
I am beginning to think that the oil industry is too big world-wide for any analysis to accurately determine what the major price factors truly are – current production, reserves, storage, potential production, cost of production, etc. Most oil companies threw money away [not intentionally] trying to find more oil in an already glutted market. Some of the [supposedly] most sophisticated executives pulled off their hedges when prices plunged to $75. The people with the most money, and the most oil, in the Mideast decided to pump all out for an expected “short” period of time to drive prices down to $60 and put competitors out of business. I do not see any expert making $millions because they have it all figured out.
I do not think than anyone accurately knows right this minute what the world-wide inventory glut is. It has been months since I have read a story documenting the excess storage floating in ships. How much of the inventory in Cushing, OK is an unwanted storage glut? How much can Russia really produce? What is current production and current demand [with demand defined as oil required to continue business as usual (the objective being to not count “demand” that is unwanted and going into excess storage)]?
I guess that I view trying to analyze the “oil market” like trying to solve a giant Rubik’s Cube, with any number of people controlling different sections of the cube, and many of them feeding misinformation to the other people concerning the position of the colors in the section of the cube that they control. It may be like a giant liars poker game [either intentionally or not].
“I am beginning to think that the oil industry is too big world-wide for any analysis to accurately determine what the major price factors truly are – current production, reserves, storage, potential production, cost of production, etc.”
Words of wisdom, clueless. For so many years people have been estimating, predicting, suggesting, conjecturing, doing back of the envelope calculations and they all get fudged, adjusted, recalculated, crossed out, graphed, re-graphed, changed, altered but never is there any clear consensus. At this point it all seems like a lot of wild guesses, at best dart tosses in the dark at a laterally moving, undulating, murky target.
Interesting. So supply and demand doesn’t tell you the story.
Well, it might tell you something if anyone had any good information. A lot of opacity out there.
Looks like at current levels of consumption and assuming a price range of $45-$55 the US has about 10-11 years of gas and oil available.
http://oilprice.com/Energy/Energy-General/Huge-Decline-In-US-Proved-Oil-And-Gas-Reserves.html
“Proved reserves of crude oil in the U.S. declined by 4.7 billion barrels or 11.8 percent from their year-end 2014 level to 35.2 BBbls at year-end 2015. Natural gas proved reserves decreased 64.5 Tcf to 324.3 Tcf, a 16.6 percent decline.”
Important stuff, but far too glib.
President Trump will never let Americans starve because oil would not come out of the ground fast enough to move food — because the economics of oil would not support it coming out of the ground.
There just isn’t a way to make a case for that to be a credible scenario for any Prez. If oil is scarce, but price won’t let it flow, you go make it flow anyway. Why would this be even worthy of debate?
“President Trump will never let Americans starve because oil would not come out of the ground fast enough to move food”
Why do you assume Trump wouldn’t let people starve? There are quite a few conservatives who don’t want to provide health care to the poor. Or free food to poor mothers and children, for that matter.
We have let people die prematurely in the US because we don’t want to provide them with enough healthy food or medical care. And we have homeless who die of exposure.
So don’t assume the government would pay a high price for oil just to make sure everyone has enough to eat.
Watcher can play all the word games he pleases. I guess he believes in them.
But the cost of production of any good or service, no matter what it may be, is ALWAYS paid, or else the production of it STOPS. CEASES. ENDS.
This is so obvious it ought to be as clear as the high noon sun on a cloudless day, even to a kid.
The cost of production can be shifted from the consumer to some other person or agency, via subsidies, or robbery, at gun point.
But the cost is ALWAYS paid.
And there are hard limits to the costs than can and will be paid even by a government in bad bind, politically, but with some remaining capital or cash to be spent, or borrowed and spent.
Boomer is a little too pessimistic.
Trump is bad news, but he is not so stupid as to allow very many people to go seriously hungry, as Maduro is doing in Venezuela at the moment. He and the rest of the R clowns know damned well they would be quickly voted out of office if they were to do so. Elections here in the USA are still basically honestly run, compared to what happens in some countries, such as ……..Venezuela.
The production of oil will pretty much cease if and when it takes too much of what is produced just to keep the rest on the way to consumers and industry.
Burning three or four barrels to produce five , with only one or two left as the “profit” won’t giterdone, unless the energy needed to run the oil industry can be sourced from coal or gas or nukes or renewables.
It seems very likely, to me at least, that there will be ample oil , but probably at a somewhat higher price, to keep the economy functional for at least a few more years.
Dubai (or was it Abu Dhabi?) is already using solar panels to operate its oil pumps. Speaking of sourcing the energy to run the oil industry from renewables…
Oil’s not magic and it’s already priced itself out of every market except transportation.
BTW . . . 35B barrels is < 5 yrs supply for US consumption.
20 mbpd X 365 is 7.3 B barrels
Watcher,
I take a more optimistic view of US oil reserves. While 35 billion barrels would be used up with 5 years of US consumption, it would take at least twice as long to use up at 2015 levels of US production (which were at near record levels). The US has been an oil importer for decades, and will continue to be an importer. And the largest contributor to the cut in reserves, even larger than 2015 production, was a big cut in revisions, and this was largely due to reduced oil prices (5.6 vs. 3.4 billion barrels).
A question to any of you that are great a mining the EIA data – How is the 5.6 billion barrels of downward revisions split between the different US states/basins?
Anyone know if EIA uses SEC criteria for reserves evaluation as a function of price, or their own calculation?
Additionally . . .
https://upload.wikimedia.org/wikipedia/commons/f/f0/US_Proved_Crude_Oil_Reserves.svg
As reserves fall, aren’t we supposed to see a production fall? If not, the right side of that curve should be getting steeper?
Answer to your question is here:
http://www.eia.gov/dnav/pet/pet_crd_pres_a_EPC0_R01_mmbbl_a.htm
NoDak down 14%
Texas down 4%
Louisiana down 20%
Alaska down 28%
New Mexico up
Japan Importing Less Crude Oil; Gives Iran, Russia Cold Shoulder | OilPrice.com: “In addition to the decline in Japan’s crude oil imports, crude oil shipments from Iran to Japan dropped by 33 percent in October, while those from Saudi Arabia jumped by 26 percent. Japanese imports from Russia plummeted by 48 percent, while imports from Mexico, although significantly lower in volume compared to the others, soared by 232 percent.”
Japan will lose the #4 slot for global oil consumption to KSA this year.
No it’s not electrics. No it’s not renewables.
Their people aren’t renewable. That’s the cause. Population decline.
“That’s the cause. Population decline.”
But decreased oil consumption because of demographic shifts is a legitimate reason for declining oil demand. And it will happen in the US, too, as people get older and don’t drive as much.
In fact, we’re counting on it. It doesn’t matter whether people are dying, choosing not to drive, or using more efficient machines. All contribute to less demand for oil.
“No it’s not electrics. No it’s not renewables.
Their people aren’t renewable. That’s the cause. Population decline.”
Bold statements. Do you have any hard data which support these?
Hint 1: If the demand for oil decreases by more than 2% it is highly unlikely that population decline rate, which is smaller than 1%, is the main driving force.
Hint 2: After Fukushima a lot of electrcity was actually generated by fossil fuels, IIRC a lot by diesel generators etc. A return to to more nuclear generation and addition of REs would of course reduce demand.
Hint 3/question: What is the influence of weather on the primary energy demand of Japan?
Uncorrected y-o-y data often create more questions than give answers.
Japan’s oil consumption has been in somewhat steady decline since 1996. 2010 to 2011 was a decline, though more shallow a rate of decline than previous, and there was a small uptick 2011-2012. Since then, 5 yrs of again steady decline. Fukishima’s impact was thus temporary and had offsets of lower economic activity.
Car sales fell after April 2014. Appears to have been a national sales tax change that reduced sales. The car industry defends with noting sales are at about 2013 level so the fall off may not be permanent.
I suspect that one reason Japanese oil consumption is declining is that young people there are losing interest in cars, to some extent, the same way they are here in the USA.
You can buy one hell of a lot of electronic toys, high speed internet, nice clothes, and fancy food, with what it costs to own a new car, and still have money left over for a nicer place to live and an occasional cab fare or lots of transit tickets.
Furthermore , the Japanese government has made a habit of goosing the economy in various ways, which sped up the economy to some extent, for a while, at different times.
Most other governments apparently do the same thing.
One downside of this goosing is that the good times thus brought about are apt to be followed by a slow period, maybe even a recession, in some industries.
The Japanese have goosed domestic car sales in the past by putting in some patently ridiculous automobile maintenance rules, requiring expensive work to be done on relatively new cars, which is not at all needed.
This work costs so much that perfectly good fairly new low mileage cars are broken up for the easily salable parts, such as the engines and transmissions, which are exported to countries such as the USA.
If anybody wants details, google JDM used auto parts, that’s for Japanese Domestic Market. JDM engines and transmissions, etc, are the gold standard in the eyes of a LOT of mechanics who work on high mileage but nicely maintained Japanese makes of cars. BETTER than factory rebuilt, better than from domestic wrecks, which might have a LOT more miles on them, and usually do.
People give up on owning and driving cars when the cost of doing so gets to a certain point. The manufacturers got what they wanted, short to medium term, they sold more new cars, at high prices.
Long term, they may have driven young Japanese people right out of the automobile market because of the high prices.It is my opinion that they did so, this opinion being based on reading articles and comments in the auto trade press, plus hanging around garages sometimes, although I don’t work on cars anymore, except minor jobs on my own.
Japan imports 94% of its energy (net-% of use) as of 2013, and the USA 14% for comparison
[http://data.worldbank.org/indicator/EG.IMP.CONS.ZS?year_high_desc=true]
One can look at Japan and its energy consumption trends, along with the trends in demographics, marriage, suicide, etc, as the kind of early gradual transition a country can be expected to undergo when faced with loss of its cheap energy supply. First chapter, so to speak, in long story that has just begun.
And if they are lucky it will be gradual and peak up steam from here. An aging population, with less children and less consumption is exactly the kind of downsizing that will enable a transition to a future with less energy available to import. This is a much less unpleasant path than the alternative faster and jolting scenarios- think the kind of unrest we have seen in Egypt, Syria, Venezuela as starters ( and the election of fascists as an additional symptom).
Japan now has 127 million and has lost 1 million in the past 5 yrs. If they had only 20 million, they would struggle to remain a modern society without imported energy, even with solar all over.
Korea has a similar level of reliance on imported energy (83%) and Germany (62%), for example. I believe it would wise to begin a managed downsizing- should have started in 1970 when the writing was on the wall. Doubt it will happen.
I doubt many people will bother, but this Greer essay is well worth reading for historical perspective and political insights.
http://www.resilience.org/stories/2016-12-16/why-the-peak-oil-movement-failed
I read it and it is a good essay. Nobody else has to now. Of course, I am kidding.
Not that it is a required reading, but is indeed recommended.
There are plenty, a plethora, of words in the essay, so it will take some time to read them all.
Oil consumption never stops and depletes what is there. We’re not in Titusville anymore.
Havn’t seen any link on this blog to the IEA OMR (december ed. released: 13 December 2016)
“If OPEC promptly and fully sticks to its production target, assessed at 32.7 mb/d, and non-OPEC producers deliver the agreed cuts of 558 kb/d outlined on 10 December, then the market is likely to move into deficit in the first half of 2017 by an estimated 0.6 mb/d. This is not a forecast by the IEA, it is an assumption based on the numbers in OPEC’s 30 November agreement, subsequently reinforced by the non-OPEC producers.”
http://www.iea.org/media/news/2016/1612Chartforweb.png
Texas Numbers are out – will there be a new post on this?
Looks like production dropped slightly (?) from last month (comparing only initial preliminary data) to 2,683,302 bpd (c+c)
I hope investment money continues to pull out. I don’t think this is a cost-effective, environmentally friendly way to get oil.
Statoil Turns Its Back On Canada’s Oil Sands | OilPrice.com
Did money actually pull out? Somebody bought it so must thinks it’s still a good investment. Though Statoil took an impairment which I guess means the value has gone down. Other’s are pulling out: Koch cancelled a small project this week – they explicitly blame the NDP climate plan (NDP are the Alberta provincial government), but with the Koch’s that might just be posturing.
http://calgaryherald.com/business/energy/ndp-climate-plan-cited-in-koch-bid-to-cancel-oilsands-project
“Somebody bought it so must thinks it’s still a good investment.”
True, the stake was sold. But if enough companies sell, that should discourage others from planning new projects.
It looks like WTI is pushing on $55. Brent has surpassed $55.
Joint action by OPEC and Russia, announced but not yet in effect, appears to be making a significant impact on oil prices already, similar to earlier periods of similar announcements.
This time the effect will be longer and more substantial than earlier this year.
There will be real cuts in output, albeit much less than the announced 1.8 mb/d.
As I have stated, we will do fine at $55-$65 WTI. But we are very small in a niche area.
Will be interesting to see LTO earnings at $55-$65 WTI.
Are you restarting idle wells?
We did this summer.
We have a number of wells that must be shut down in cold weather anyway, so we did not fight keeping them going with $19-25 wellhead oil prices. We also did not pull some of the wells that had well failures.
Prices this summer were high enough to justify restarting most, and the few that still probably are losers at $40-60 we went ahead and started anyway. Have two that we have not, probably will plug next summer unless prices are above $65 at wellhead, which we do not anticipate, but who knows?
There are scenarios in which prices may reach $65, but I wouldn’t count on them.
AlexS.
Do you agree that if supply cuts are focused on lowering US imports, the oil price reaction will be more favorable?
A build in US inventories due solely to a 1.1 million bopd week over week increase in US imports is caused over a $1 pull back.
In the US media, at least, I never hear of oil market reaction to weekly inventories in China, Russia, KSA or other countries.
shallow sand,
supply cuts are focused on turning current excess supply into supply deficit and thus gradually reducing huge excessive global inventories.
U.S. inventories are a significant part of global inventories, and are reported on a weekly basis. So it is not surprising that the market is so much focused on U.S. inventories.
What is surprising: few experts pay attention on what is causing changes in U.S. inventories: changes is demand, domestic production, refinery throughtput, imports, exports, etc.
China’s commercial inventories and strategic reserve are an important part of global equation, but the numbers are opaque and not weekly reported.
Inventories in oil-exporting countries are not that big and not particularly important.
JODI has released a new report.
Saudi crude storage is interesting, since it continues to drop. Their crude reserves have now dropped 53 MM BBL since last October (whilst produt stock remained flat). Funilly enough this is exactly the same the US reserves have increased.
Apologies. Was a bit quick in typing. Reserves should obvioisly be storage
Interesting indeed. KSA spare capacity has been very low (or negative).
I see it reported that yesterday the most active oil trade was 12/18 $100 calls.
Was that you, Dennis? LOL!!
Jean Laherrere just posted this:
OGJ has reported the world oil proved reserves at end of 2016 in their 5 December issue
As usual before no one oil company has YET estimated the value, because they wait at least the end of the year to do so!
For the first time since 1999, the world oil proved reserves has declined!
Thanks Jean.
Perhaps a peak in proved reserves is another definition of peak oil, certainly an indication that the peak of production is nearby, and painful declines ahead.
Jim
copied from Forbes, with the link as well , in the non petroleum thread.
“” Meanwhile investment banks have been scrambling to update their forecasts. Morgan Stanley recently raised its projection for battery only cars up to three times, now predicting by 2025 an electric car global market share of between 10 and 15%. Volkswagen is now assuming this will hit 25%.”
I don’t yet see much real indication that batteries for heavy trucks and construction and farm machinery will be available any time soon but cars and light trucks can go oil free, within the near term, except for about one barrel equivalent every five or ten years for lubricants. We could easily manufacture that much lube oil and grease using any common hydrocarbon as the feed stock, if necessary.
Heavy trucks will go fairly fast, they just haven’t hit the tipping point for the transition to start in earnest. BYD has a lineup already, Tesla’s designing one, there are lots of startups. There’s serious pressure to get rid of truck emissions near ports and railyards. Trucks have short lifespans.
Construction machinery will take longer. But it’s all available in electric form already, mainly for mining. And the lifespans aren’t that long, and the fuel machines are super inefficient due to idling and wide variation in power draw. Just a matter of getting the price down, which should happen as batteries get cheaper.
Farm machinery has that ridiculous duty cycle which you described, and farmers keep their old tractors *forever*, so that will take a long time.
I have made a spreadsheet with oil production numbers from norwegian athorities. The Norwegian Petroleum Directorate fact page is infact amazingly detailed with per field information. Main story is that 4 major new fields are coming online in 2016/beginning 2017:
Edvard Grieg (jan 2016): 67 kb/d in 2016, 80+ kb/d est in 2017
Goliat (march 2016): 53 kb/d in 2016. 100 kb/d est in 2017
Ivar Aasen (jan 2017): Est 67 kb/d in 2017
Gina Korg: (beginning 2017): plateau production 40 kb/d
This will keep decline in chess and even increase production at the current time, but from 2h 2017 there will be no major field coming online until Johan Sverdrup (2h2019). The decline rate will be steady until then. This is very alike the conclusions I see from Kaplan posts from Gulf of Mexico (thanks for posting here btw). So when you see posts from Seeking Alpha or from similar websites screaming about increased Norwegian oil production, keep in mind that this is the real story.
I think the entire concept of “proven reserves” dates from the days when oil was really cheap to drill, so if you found oil, you were *definitely* going to be able to produce it at a profit.
It makes much less sense today, because the reserves “proven” to be extractable at a profit fluctuate with the oil price. Daily.
That is true Nathanael. And if you look if you look at Rystad global reserve estimate overview (they got their backs covered btw by the different reserve categories, typical for consulting services… have done that myself some time ago) you can view the situation as a catastrophy coming if you only count proved reserves or even 2P like reserves. But it is a fact that 100+ oil price will cause an investment boom so servere that we could likely see an uptick in oil supply to keep global “plateau” production after a few years of lag time. At least my take on it.
Yes, thank you. And similarly if oil drops to $10, there are suddenly practically no proven reserves.
So the price modeling is very very important.