By Ovi
All of the Crude plus Condensate (C + C) production data, oil, for the US state charts comes from the EIAʼs Petroleum Supply monthly PSM which provides updated production information up to March 2025.
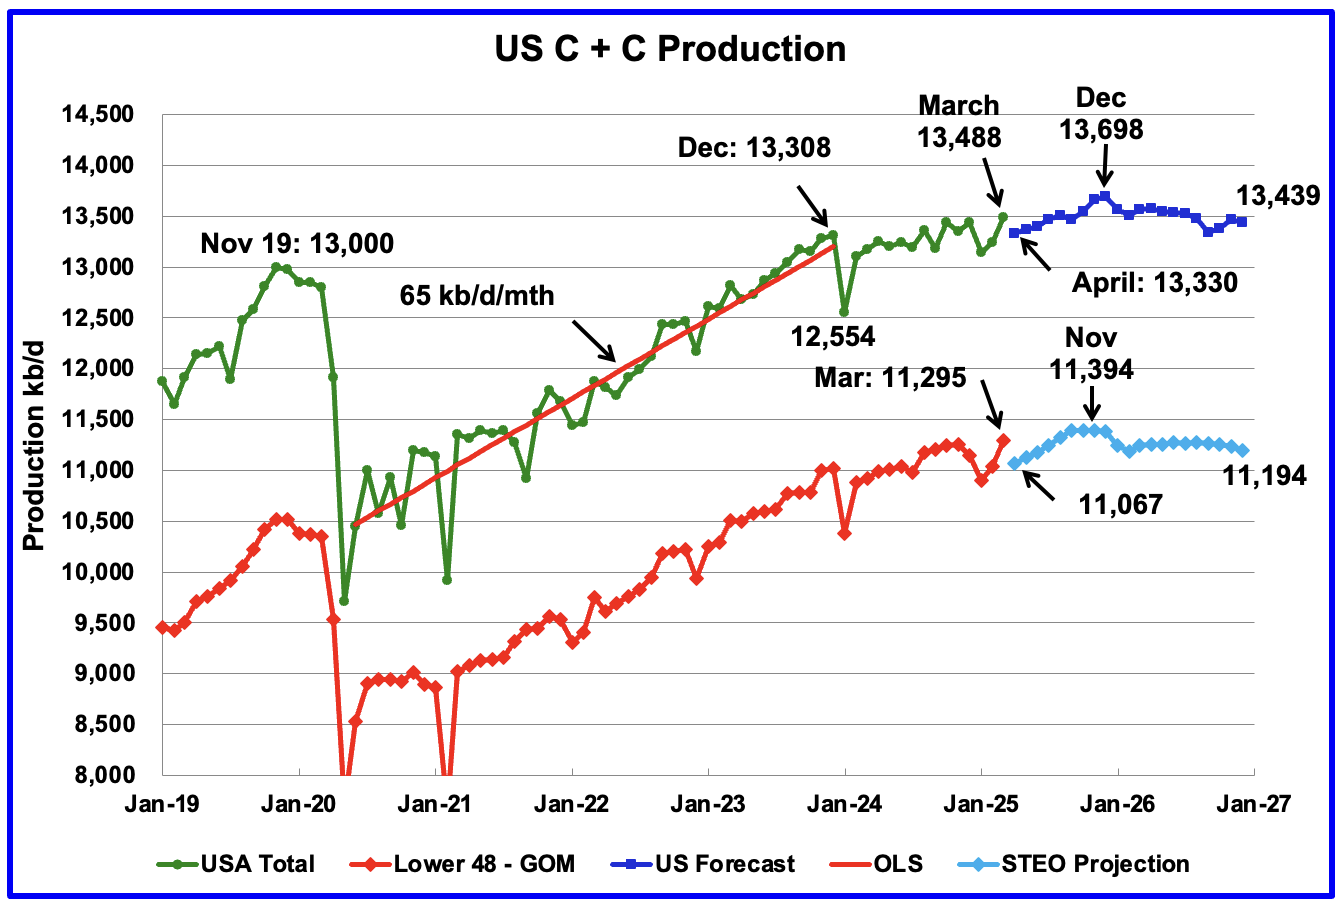
U.S. March oil production increased by 248 kb/d to 13,488 kb/d, a new high. The largest increases came from Texas and New Mexico.
Production in April is expected to decrease by 158 kb/d. For January and February the STEO forecast was really off the mark, too high by a significant amount. February was too high by 379 kb/d. However March was much better, high by just 59 kb/d.
The dark blue graph, taken from the May 2025 STEO, is the U.S. oil production forecast from April 2025 to December 2026. Output for December 2026 is expected to reach 13,439 kb/d, revised down by 64 kb/d from last month. From April 2025 to December 2026 U.S. production is expected to rise by 109 kb/d kb/d.
The light blue graph is the STEO’s projection for output to December 2026 for the Onshore L48. March’s Onshore L48 production rose by 257 kb/d to 11,295 kb/d. From April 2025 to December 2026 production is expected to increase by 127 kb/d to 11,194 kb/d. December 2026 production was revised down by 24 kb/d from last month. Note how production starts declining in late 2025 to December 2026.
Here is another long Article on US oil production peaking.
- “Oil production in the U.S. is expected to peak by 2027 and then taper
- U.S. domestic oil output growth has weakened OPEC’s influence“
U.S. Oil Production Ranked by State
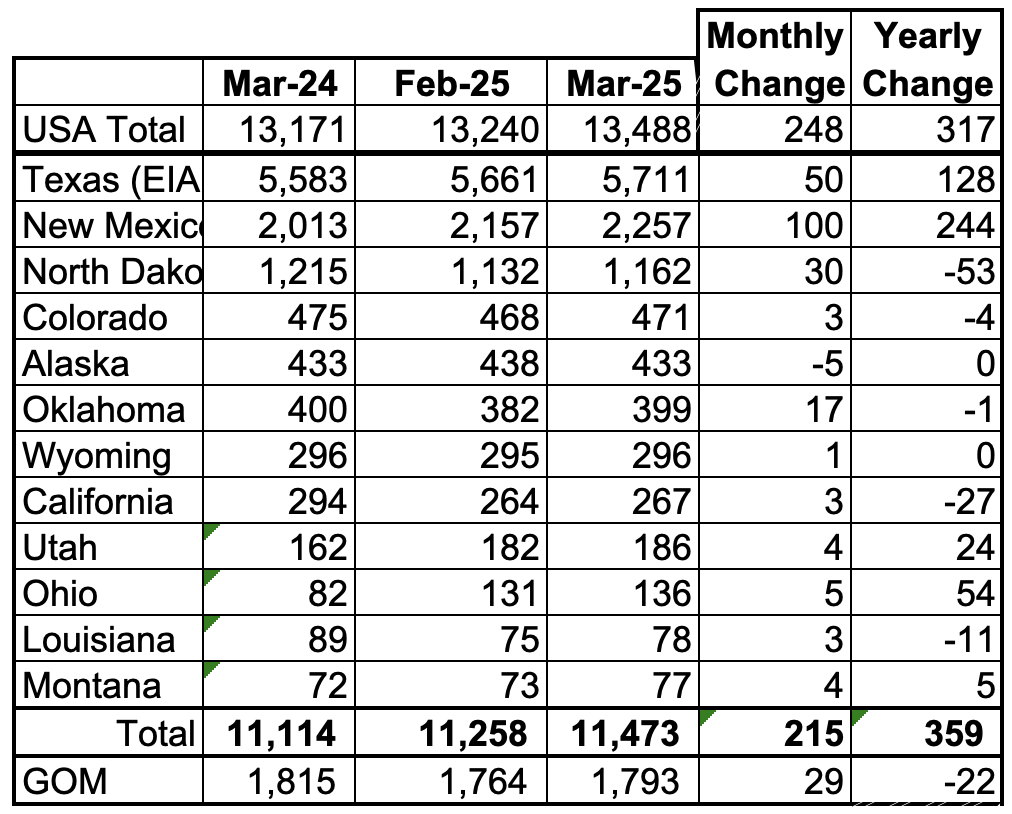
Listed above are the 12 US states with the largest oil production along with the Gulf of Mexico. Montana was added to this table a few months back since its production exceeded Louisiana’s production and we wish to keep tracking Louisiana.
These 12 states accounted for 85.0% of all U.S. oil production out of a total production of 13,488 kb/d in March 2025. On a MoM basis, March oil production in these 12 states rose by 215 kb/d. On a YoY basis, US production increased by 317 kb/d with the biggest contributors being New Mexico and Texas.
State Oil Production Charts
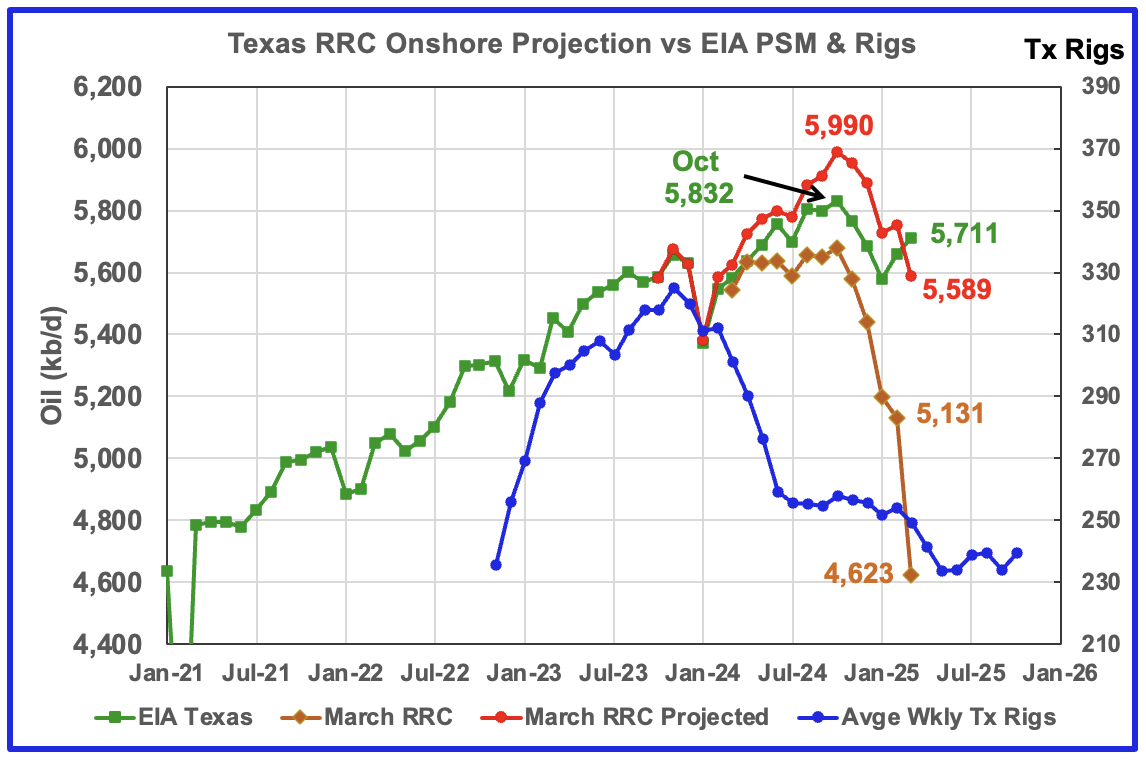
March’s production increased by 50 kb/d to 5,711 kb/d.
Texas production has been dropping from October to January. The drop could be related to the drop in completions that started in October while the January drop could be a combination of cold weather and low completions. However production in February and March has rebounded but still is 121 kb/d lower than October 2024.
The red graph is a production projection using February and March Texas RRC data. Due to more production revisions than typical to earlier months in the March report, the projection for October 2024 is too optimistic by roughly 158 kb/d compared to the EIA report. However, note that both the projection and the EIA show production rolling over in October and dropping in January and increasing in February. However there is a big divergence for March. At this time I think that the March Texas RRC update was incomplete.
In the February report, the month over month production drop between January and February was 319 kb/d. However for the March report, the drop was 508 kb/d, see March RRC graph. If the March drop were closer to 308 kb/d, the March projection would show an increase and would be 78 kb/d higher than the EIA report, which makes me think the Texas March update was incomplete.
The blue graph shows the average number of weekly rigs reported for each month, shifted forward by 10 months. So the 276 rigs operating in July 2023 have been shifted forward to May 2024. From February 2024 to July 2024, the rig count dropped from 312 in time shifted February 2024 to 256 in July 2024. That drop of 56 rigs has had no impact on production up to August 2024 but November may be the first month when the impact of the rig drop on oil production starts to show up along with fewer completions.
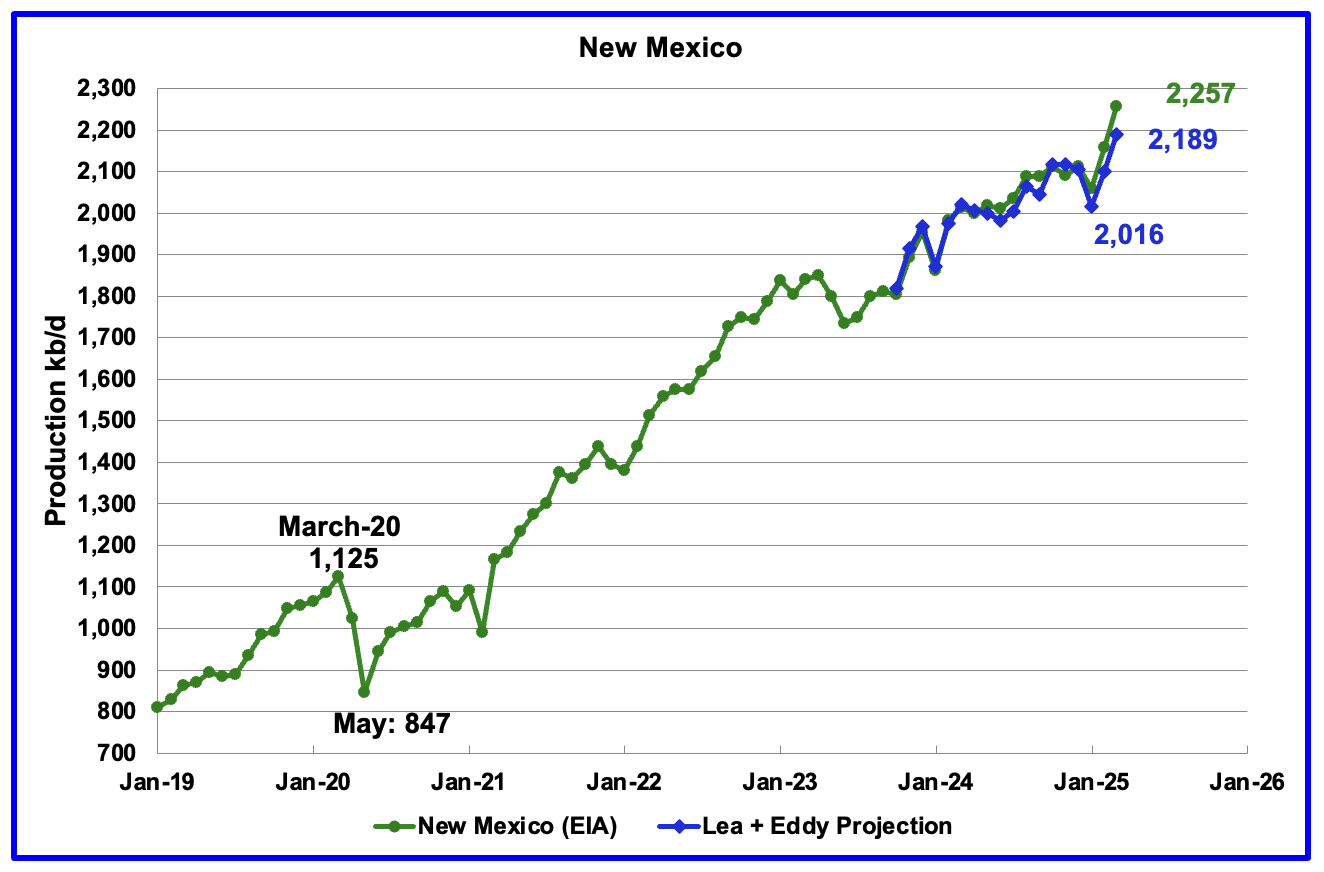
According to the EIA, New Mexico’s March production rose by 100 kb/d to 2,257 kb/d.
The blue graph is a production projection for Lea plus Eddy counties. These two counties account for close to 99% of New Mexico’s oil production. The difference between the February and March preliminary production data provided by the New Mexico Oil Conservation Division was used to make the projection. A 1% correction was added to the Lea plus Eddy production projection to account for their approximate fraction of New Mexico’s oil production. The methodology used for projecting New Mexico production is identical to that used for Texas.
The projection estimates March production was 2,189 kb/d an increase 89 kb/d over February, similar to the EIA’s report. The increase is related to March production increases in both Eddy and Lea counties and is discussed further down in the Permian section.
More oil production information for a few Texas and New Mexico counties is reviewed in the special Permian section further down.
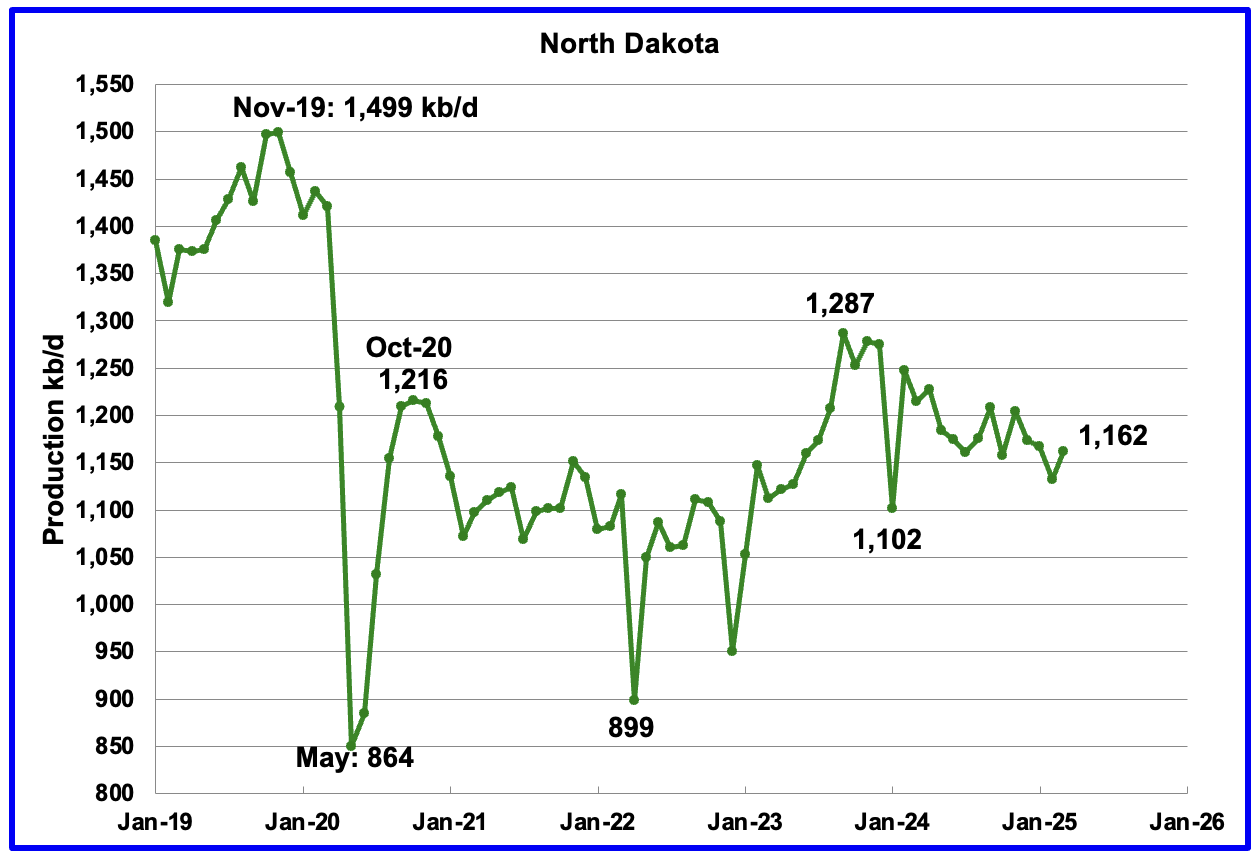
March’s output rose by 30 kb/d to 1,162 kb/d. Production is down by 125 kb/d from the post pandemic peak of 1,287 kb/d. The North Dakota Department of Mineral resources reported March production rose by 28 kb/d to 1,193 kb/d, which is 31 kb/d higher than the EIA’s.
According to this Article March’s production increase was a rebound from a cold February.
“February had the extreme cold temperatures so a rebound was expected during the month of March,” Anderson said.
Currently 31 rigs are actively working in the state, a drop of one rig from February, March and April. He said there’s 33 rigs in the Williston Basin, with a couple of them working in Montana.
He said the rig count and frac crew numbers are expected to soften slightly due to the soft prices, which leads to some volatility. Currently, West Texas Intermediate stands at around $62 a barrel.
He said the number of wells completed is trending up for May. In April, 43 wells were completed and as of mid-May, 45 wells were completed, and 108 wells were permitted.
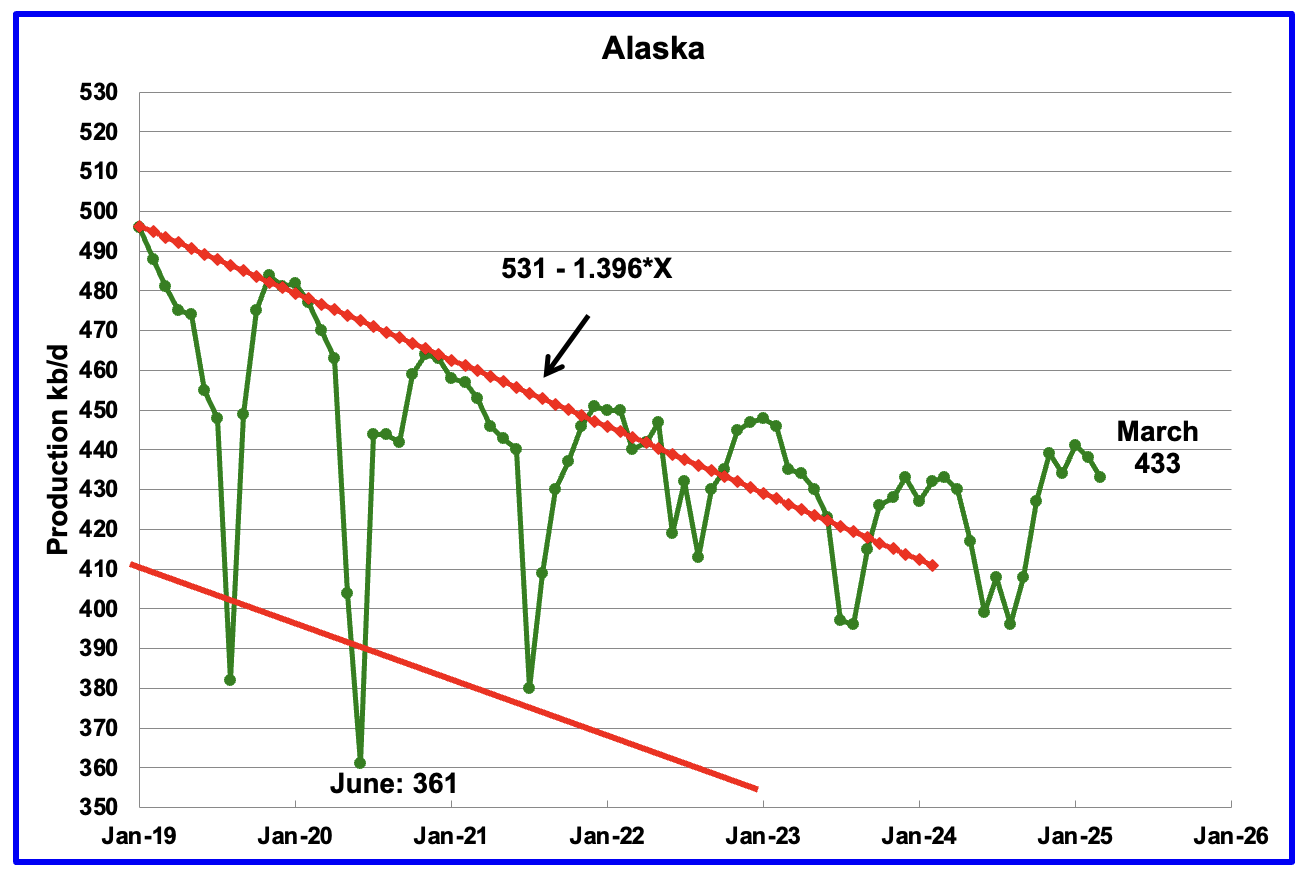
Alaskaʼs March output dropped by 5 kb/d to 433 kb/d while YoY production was flat. The steady production close to 435 kb/d over the last five months is an indication that production for the next few months will be on its regular plateau after summer maintenance.
Alaska has recently brought new fields online to consistently have YoY and monthly production gains which have broken away from the earlier dropping production red trend lines.
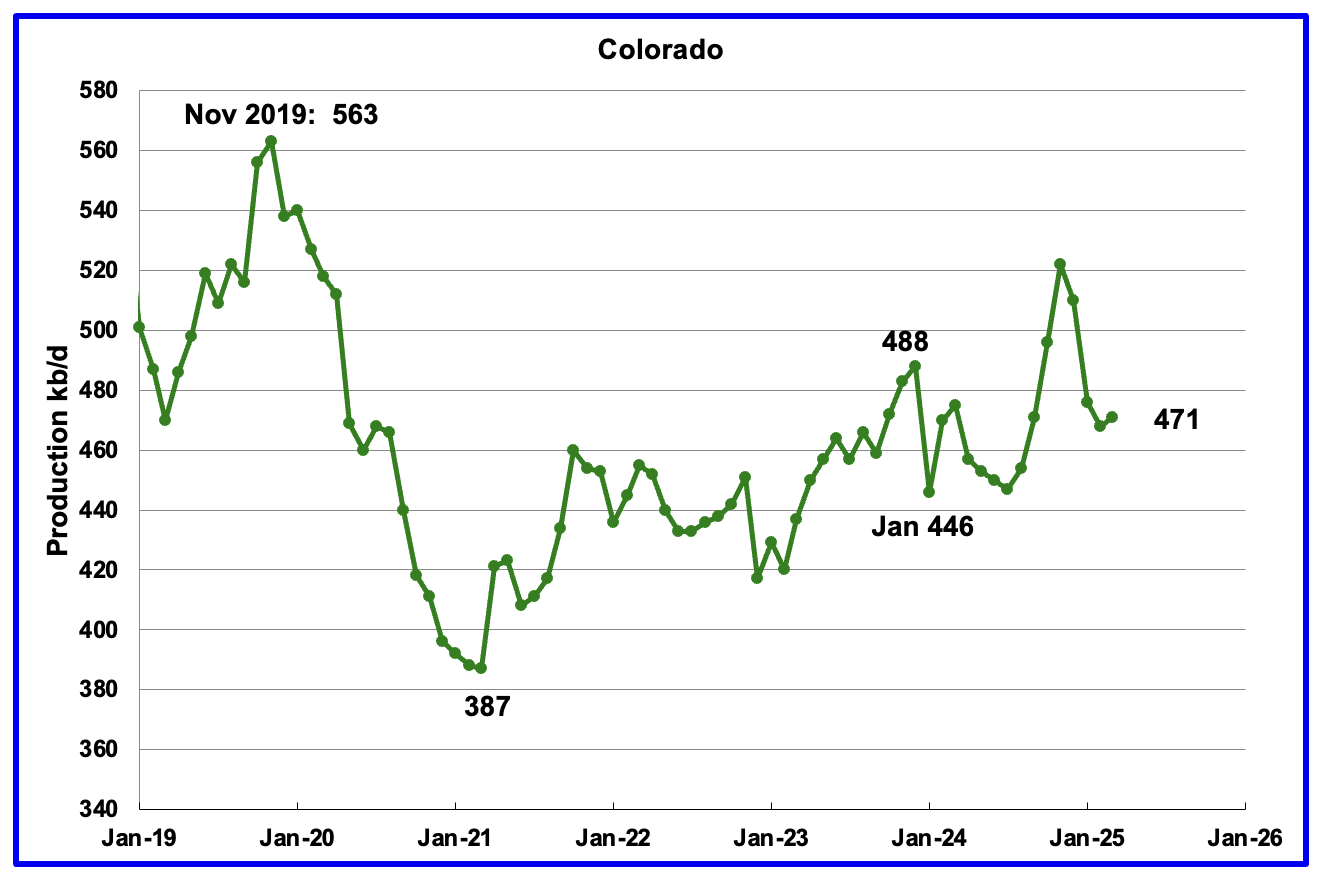
Coloradoʼs March oil production increased by 3 kb/d to 471 kb/d.
In August 2024, Colorado had 10 rigs operating and ended the year with 7. Colorado began 2025 with 7 rigs in January and February and then dropped to 5 in March/April/May. Is the dropping rig count beginning to show up in dropping oil production?
It should be noted that Colorado drillers are facing increasingly stricter environmental rules according to this Article which could be reducing drilling locations.
Part of Colorado’s oil comes for the Uinta Basin. The Uinta Basin’s role in Colorado’s oil production has come into focus over the past few years as a producer of a waxy type oil. Currently it is shipped out of the basin via trucks to local refineries in Salt Lake City and production is close to 170 kb/d. A proposal has been made to build a 100 mile railway to a pipeline terminal. There has been opposition to building the pipeline but the Supreme Court made a judgement this week that sided with the railway proponents.
However there are questions as to the viability of building the railway according to this Article.
“We also described the challenges of storing and transporting waxy crude, the fast rise in Uinta production (now averaging more than 170 Mb/d), the demand from distant refineries and blenders, and the strain being put on existing midstream and downstream infrastructure. That’s all spurred talk of expansion projects, but E&Ps, rail terminal developers, refiners and blenders are wary of making big up-front investments without having a clear understanding of the Uinta’s long-term prospects and, with that, a high degree of confidence that the basin will remain economically productive long enough for their investments to pay off.”
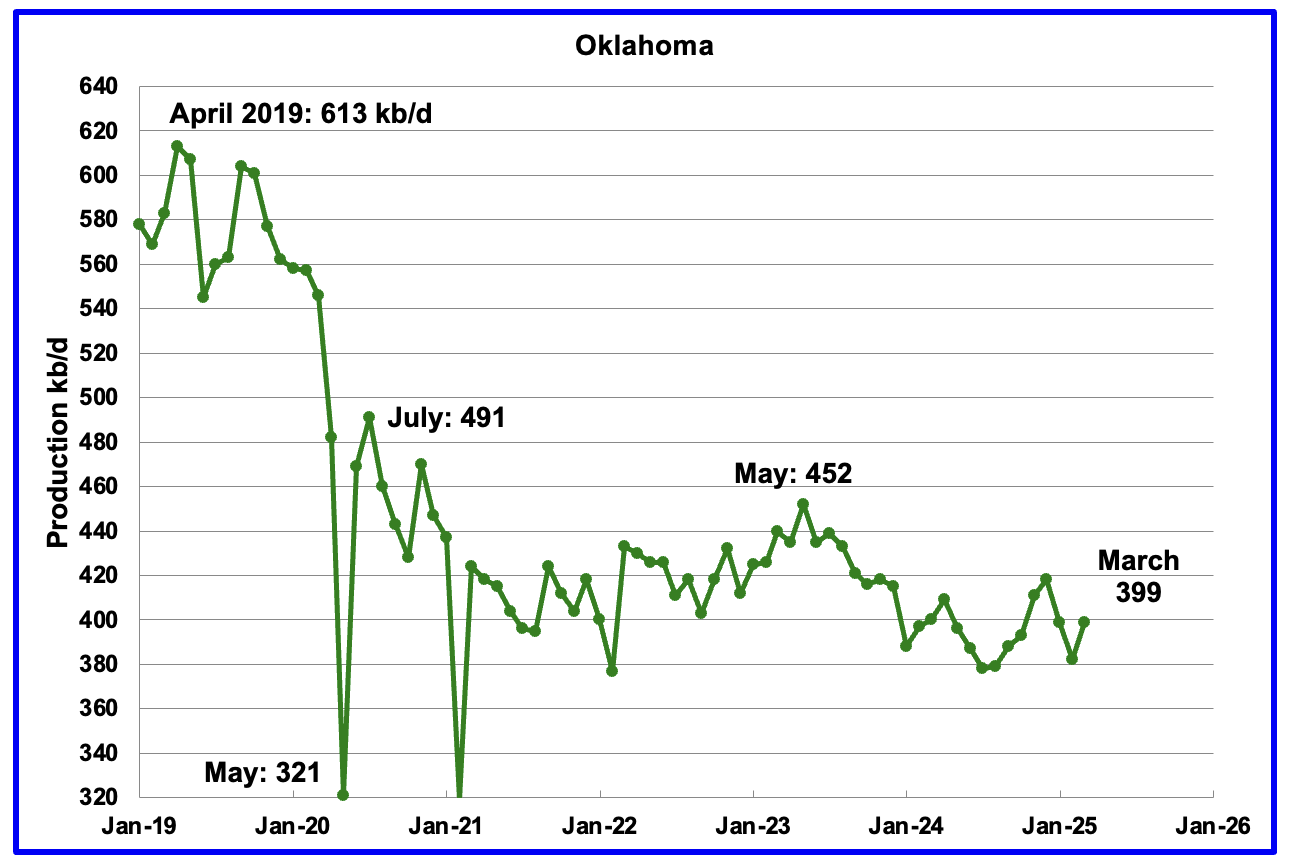
Oklahoma’s output in March rose by 17 kb/d to 399 kb/d. Production remains below the post pandemic July 2020 high of 491 kb/d and is down by 53 kb/d since May 2023. Output entered a slow declining phase in June 2023.
At the beginning of the year, there were 40 operational rigs. In February 6 rigs were added to bring the total to 46 and an additional 4 were added in March to raise the count to 50 in March/April/May. Will the increase in the rig count result in increasing oil production going forward?
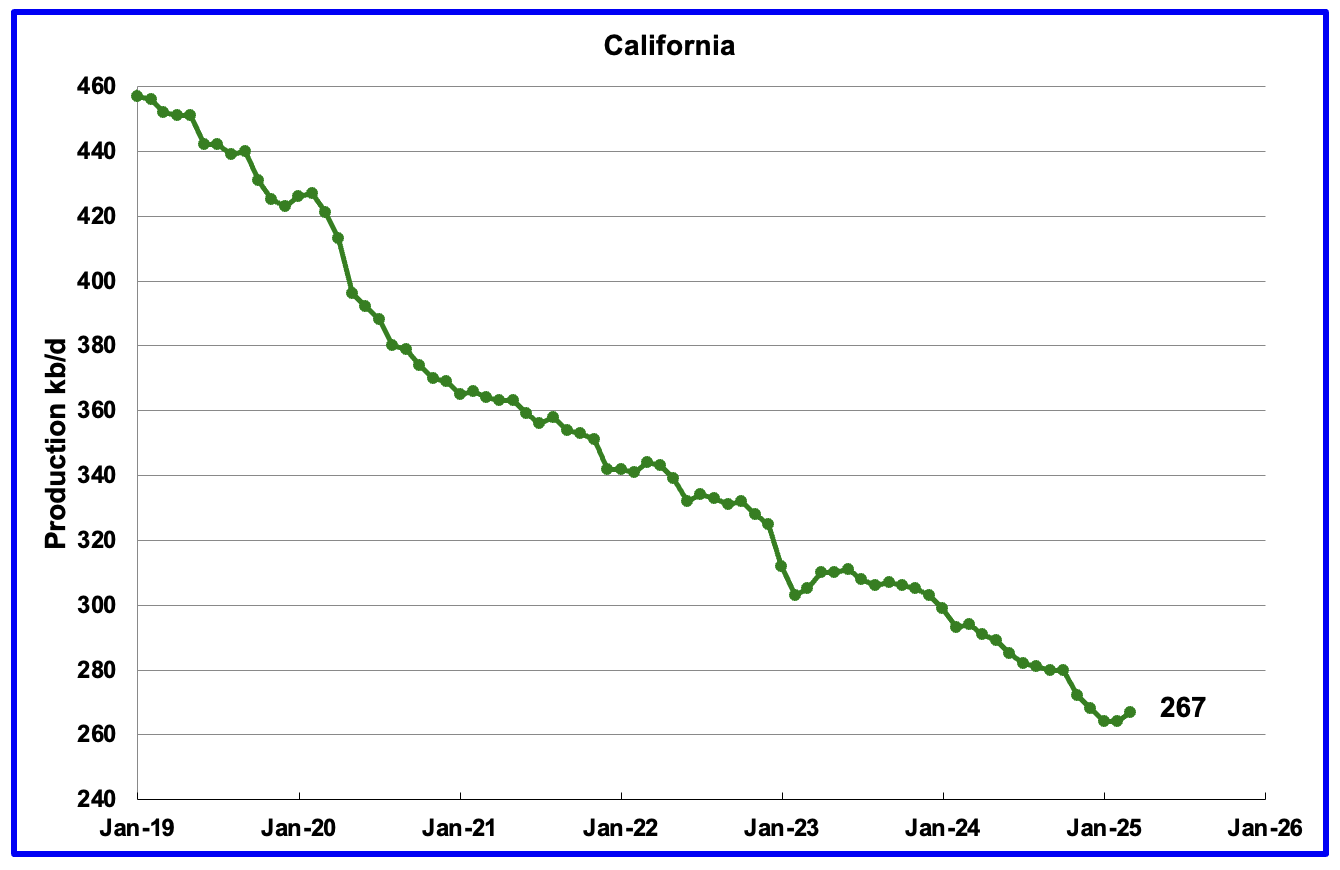
California’s declining production trend continues but March saw a small increase to 267 kb/d.
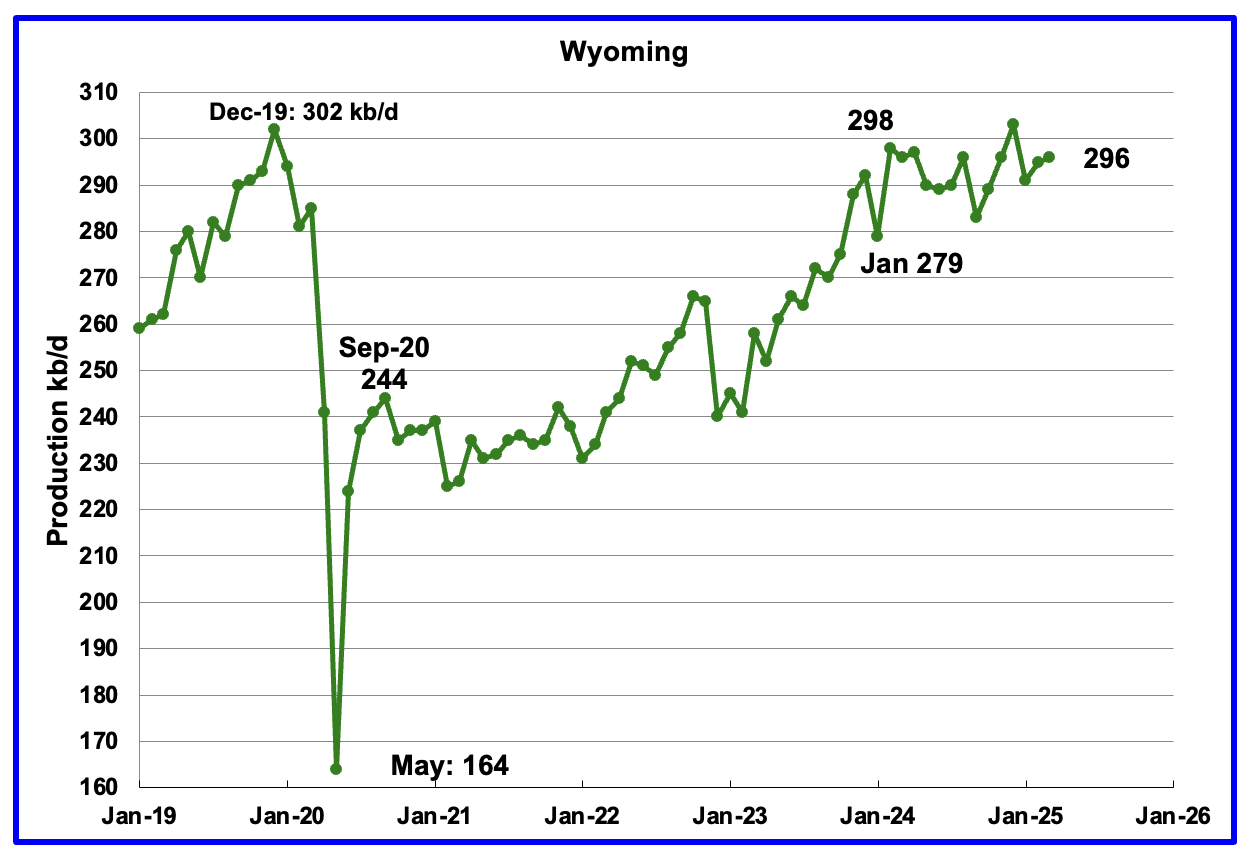
Wyoming’s oil production has been rebounding since March 2023. However the rebound was impacted by the January 2024 storm. Production reached a post pandemic high in February 2024 and is now showing signs of being on a plateau. March’s production rose by 1 kb/d to 296 kb/d.
In August Wyoming had 8 operational rigs. The rig count has slowly risen to 14 from November to January and to 15 in May.

March’s production increased by 4 kb/d to 186 kb/d. Utah had 8 rigs operating from October through May.

Ohio has been added to the Louisiana chart because Ohio’s production has been slowly increasing since October 2021 and passed Louisiana in November 2023.
Louisiana’s output entered a slow decline phase in October 2022 and continues to fall but recovered a bit in March. March’s production rose by 3 kb/d to 78 kb/d. As of all of 2025, there are no oil rigs operating in Louisiana. In November 2024, one rig was operating. Anybody have any thoughts on this and can it be confirmed?
Ohio’s March oil production increased by 5 to 136 kb/d, a new record high. The most recent Baker Hughes rig report shows 8 rigs were operational at the end of May.
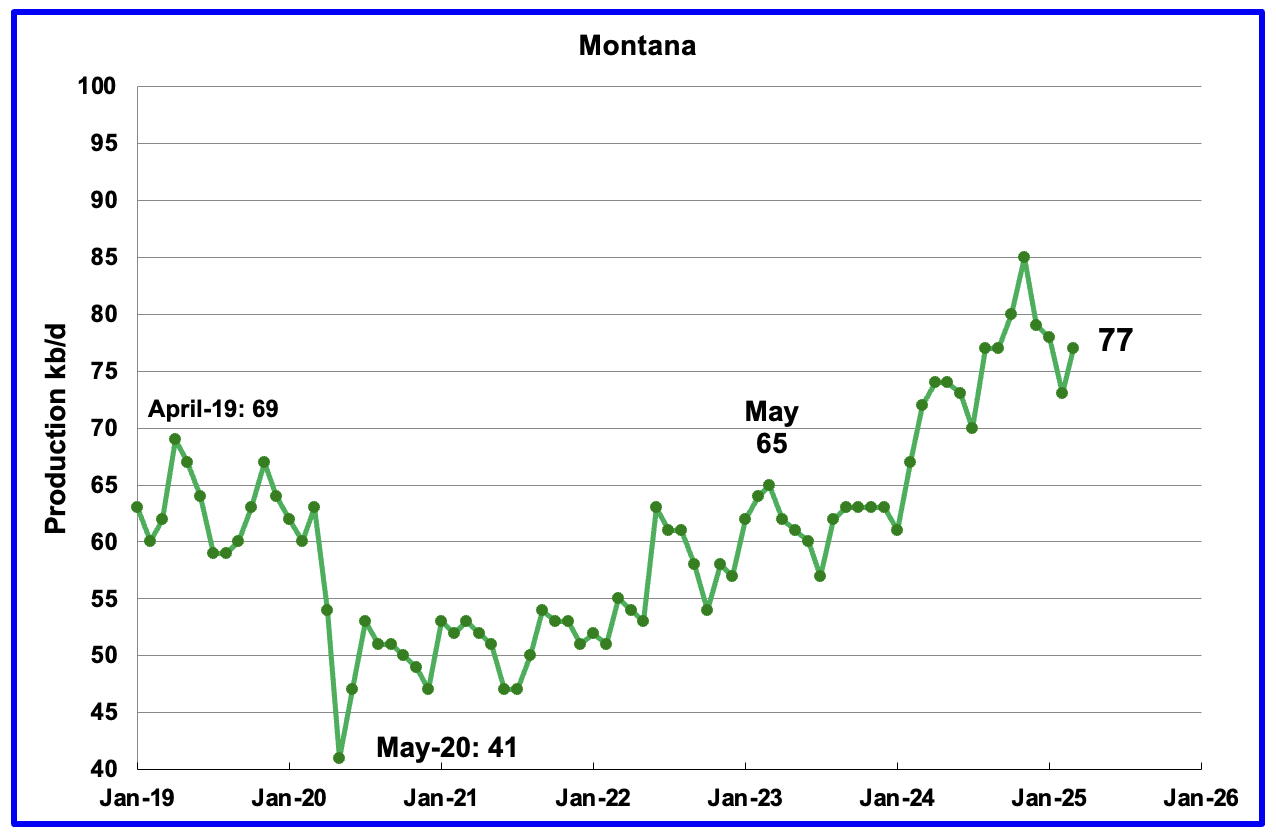
March’s oil production rose by 4 kb/d to 77 kb/d. Montana had one oil rig operating from December 2024 through May 2025.
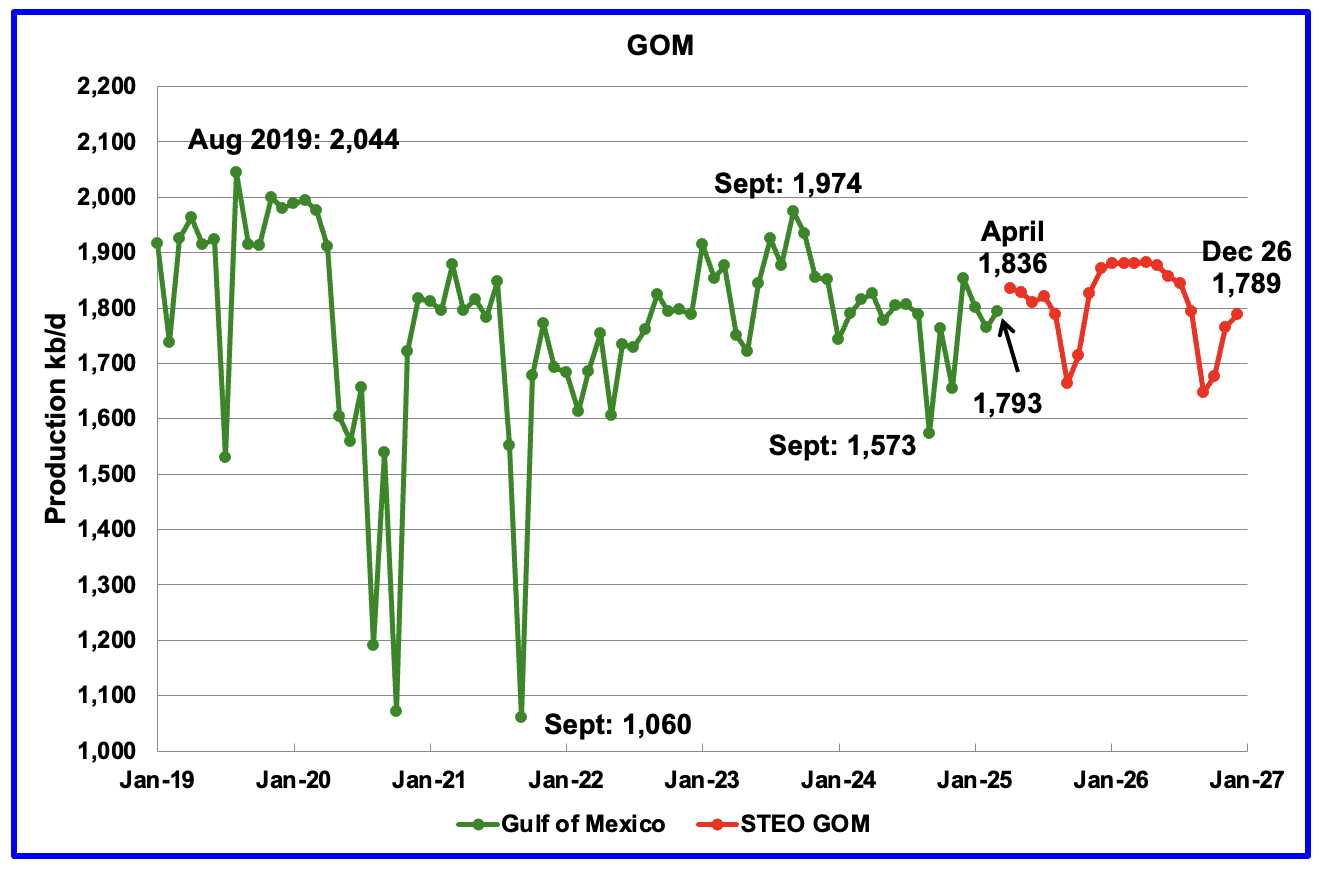
GOM production rose by 29 kb/d in March to 1,793 kb/d vs the STEO forecast that it was expected to rise to 1,845 kb/d in March, a 52 kb/d over estimation. April production is projected to rise to 1,836 kb/d.
The May 2025 STEO projection for the GOM output has been added to this chart. It projects production in December 2026 will be 4 kb/d lower than March 2025 at 1,789 kb/d.
According to this Article, GOM production is expected to reach 2,400 kb/d by 2027.
- Gulf of Mexico’s output is projected to rise from 1.8 million barrels per day (bpd) to 2.4 million bpd by 2027.
- Recent BOEM assessments estimate the Gulf holds 29.59 billion barrels of oil and 54.84 trillion cubic feet of gas in technically recoverable.
A Different Perspective on US Oil Production
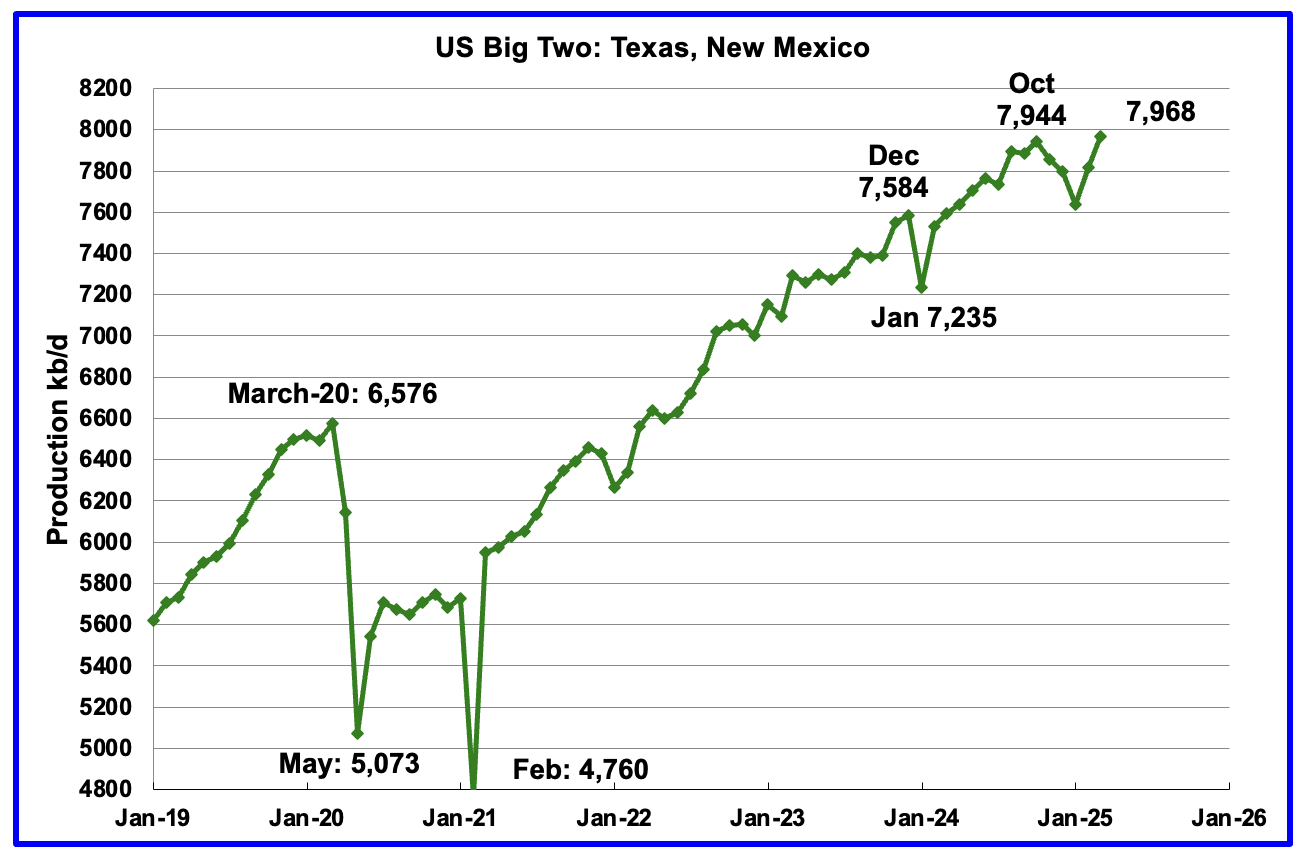
Combined oil output for the Big Two states Texas and New Mexico.
March’s production in the Big Two states increased by a combined 150 kb/d to 7,968 kb/d, a new high, and is 24 kb/d higher than October 2024. Clearly these two states were the drivers of US oil production growth up to October 2024. Will the trend change in the next few months?
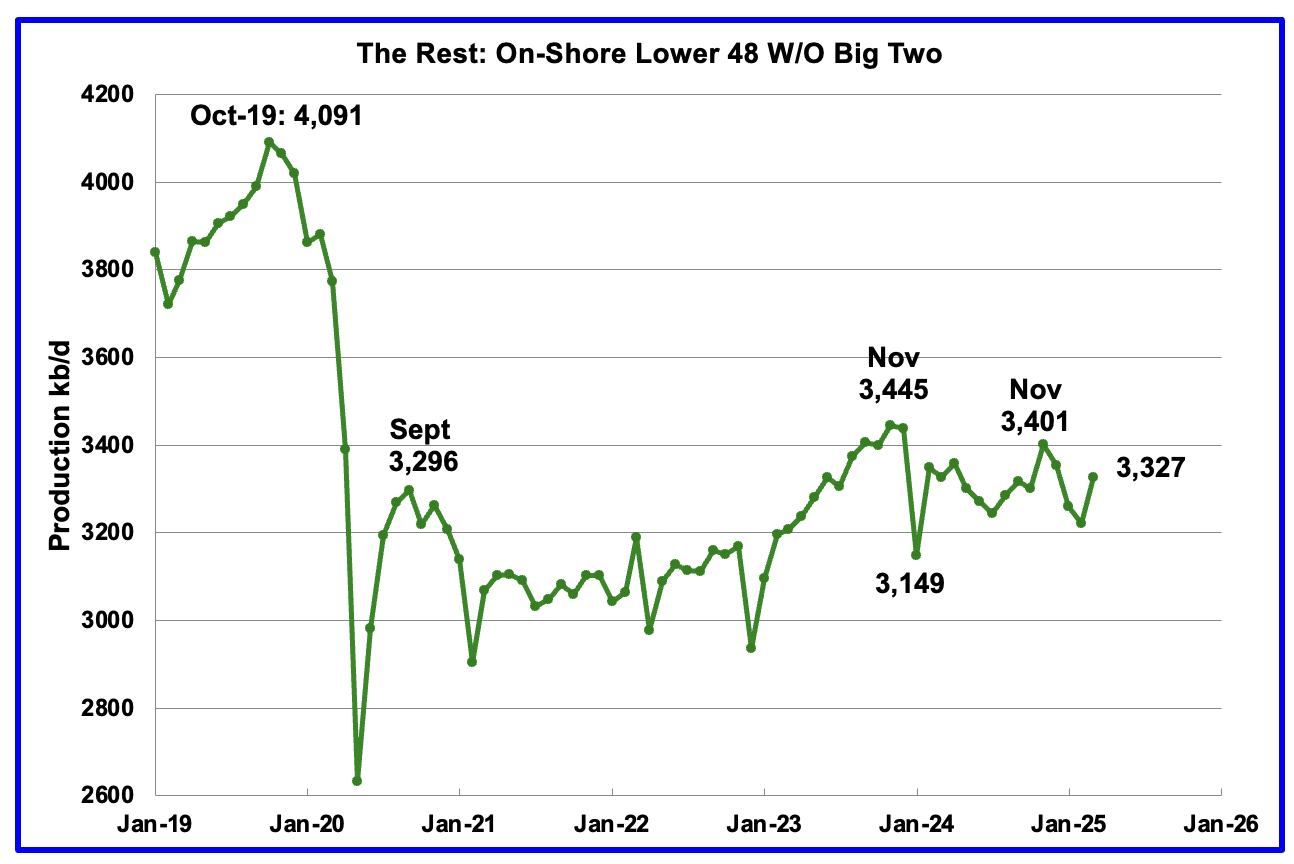
Oil Production by The Rest
March’s oil production by The Rest rose by 107 kb/d to 3,327 kb/d and is 118 kb/d lower than November 2023.
Permian Basin Report for Main Counties and Districts
This special monthly Permian section was added to the US report because of a range of views on whether Permian production will continue to grow or will peak over the next year or two. The issue was brought into focus recently by two Goehring and Rozencwajg Report and Report2 which indicated that a few of the biggest Permian oil producing counties were close to peaking or past peak. Also comments by posters on this site have similar beliefs from hands on experience.
This section will focus on the four largest oil producing counties in the Permian, Lea, Eddy, Midland and Martin. It will track the oil and natural gas production and the associated Gas Oil Ratio (GOR) on a monthly basis. The data is taken from the state’s government agencies for Texas and New Mexico. Typically the data for the latest two or three months is not complete and is revised upward as companies submit their updated information. Note the natural gas production shown in the charts that is used to calculate the GOR is the gas coming from both the gas and oil wells.
Of particular interest will be the charts which plot oil production vs GOR for a county to see if a particular characteristic develops that indicates the field is close to entering or in the bubble point phase. While the GOR metric is best suited for characterizing individual wells, counties with closely spaced horizontal wells may display a behaviour similar to individual wells due to pressure cross talking . For further information on the bubble point and GOR, there are a few good thoughts on the intricacies of the GOR in an earlier POB comment and here. Also check this EIA topic on GOR.
New Mexico Permian
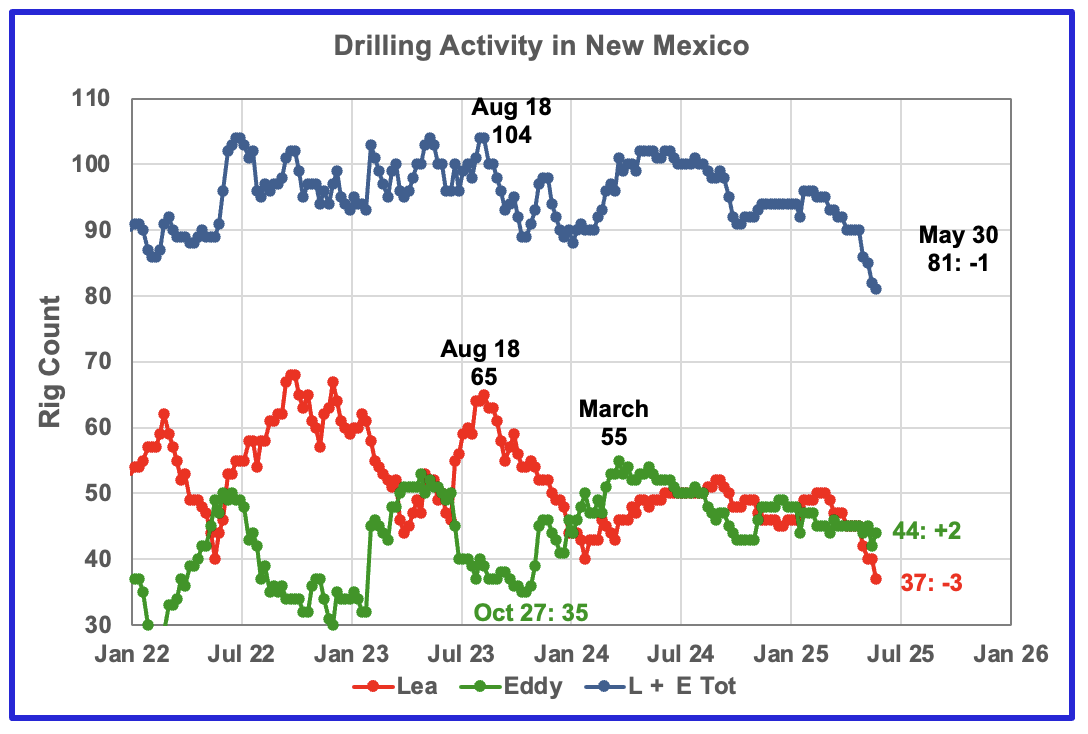
The total rig count in Lea and Eddy counties in the week ending May 30 was 81 down 9 over the past month and is down 14 from the January 2025 count of 94. The total rig count began to drop in early March.
Eddy county rigs have stabilized close to 44/45 over the last few months but Lea has dropped from 50 at the beginning of March to 37 at the end of May.

Lea County’s oil production entered a plateau phase in May 2024 at 1,227 kb/d, revised down from 1,240 last month and the plateau continues into March. March’s projected output rose by 27 kb/d to 1,226 kb/d. Preliminary March data from New Mexico’s Oil Conservation Division (OCD) indicates Lea County’s oil production increased by 18 kb/d to 1,197 kb/d.
Production has been essentially flat to slightly down since May 2024 as the rig count fell. March’s production rise is still a continuation of the slow declining plateau phase that started in May 2024 and is another indication that Lea County production has peaked or is very close to peaking.
The rising rig count starting in January 2025 may be contributing to the slowing decline in this plateau phase. The writing on the wall is saying that Lea County is very close to peak production.
The blue graph shows the average number of weekly rigs operating during a given month as taken from the weekly rig chart. The rig graph has been shifted forward by 8 months. So the 64 Rigs/wk operating in August 2023 have been time shifted forward to April 2024 to show the possible correlation and time delay between rig count, completion and oil production.
Note that rig counts are being used to project production as opposed to completions because very few extra DUCs are being completed at this time.
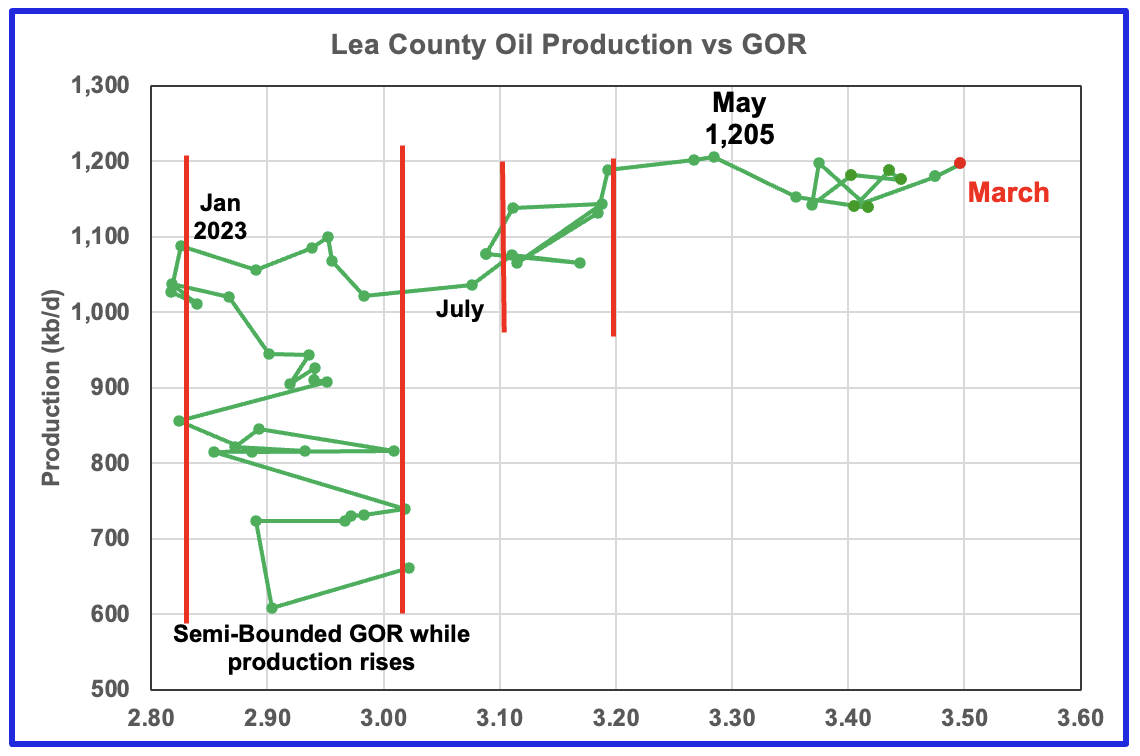
After much zigging and zagging, oil production in Lea county stabilized just below 1,100 kb/d in early 2023. Once production reached a new high in January 2023, production appeared to be on a plateau while the GOR started to increase rapidly to the right and entered the bubble point phase in July 2023.
Since July 2023 the Lea County production continued to increase as the GOR remained within a second semi-bounded region. This may indicate that additional production was coming from a new field/area since the GOR’s behaviour since August 2023 to March 2024 time frame appears once again to be in a semi bounded GOR phase accompanied with rising production.
The GOR moved out of the second semi-bounded GOR region in April 2024 and hit a new high of 1,205 kb/d in May 2024. Since July 2024 the GOR has bounced around 3.4 but March saw a production rise while the GOR increased to a new high of 3.5.
This zigging and zagging GOR pattern within a semi-bounded GOR while oil production increases to some stable level and then moves out to a higher GOR to the right has shown up in a number of counties. See a few additional cases below.
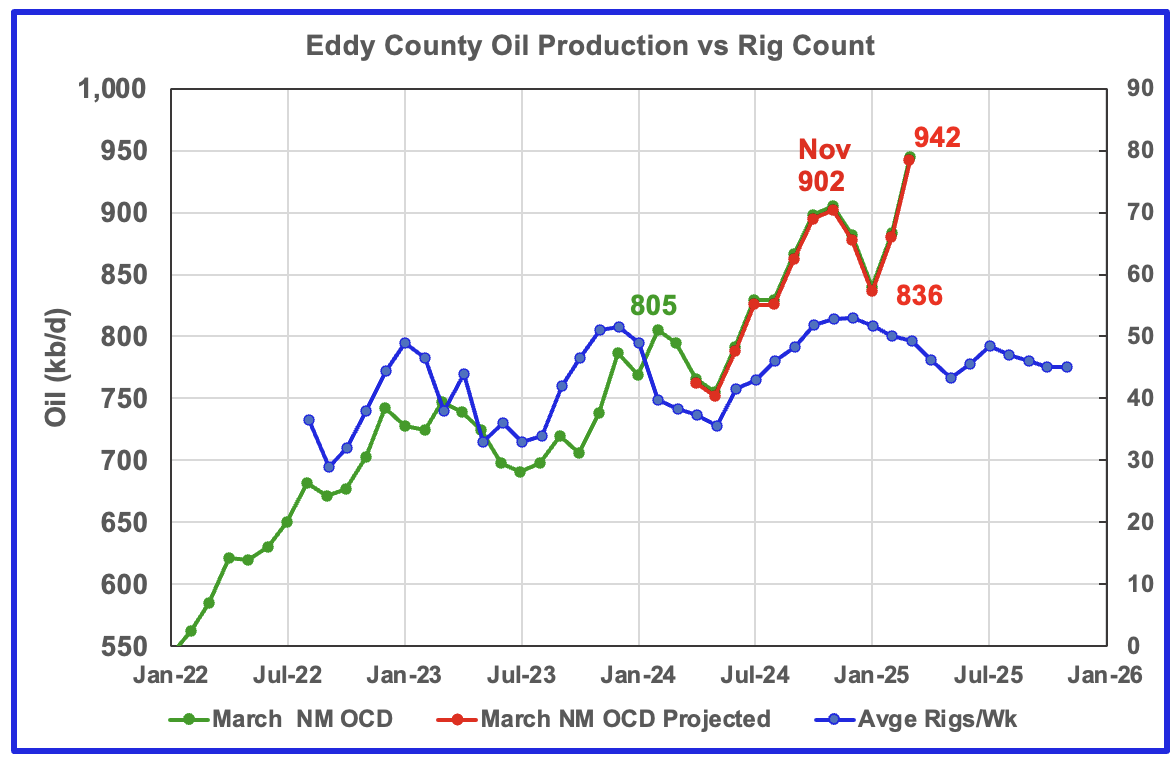
March’s projected oil production increased by 62 kb/d to 942 kb/d, a new high. Also preliminary production from the NM OCD increased 61 kb/d. Eddy county’s month over month production updates are very few and small and primarily occur in the last two months which indicates their preliminary production is very close to final. This is indicated by the red graph covering the green graph, i.e, there is no separation between the two graphs whereas there is separation in the Lea county production chart.
Eddy County’s recent oil production rise and fall is related to the rise and fall in the rig count. From May 2024 to November 2024, production rose from 752 kb/d to 902 kb/d, an increase of 150 kb/d, while essentially paralleling the increasing rig count. Over that same time shifted rig period, 14 to 15 rigs were added to Eddy County as production rose. Was a new Tier 1 region/area discovered to attract such a large increase in the rig count?
According to this Article, a lot of refracing may be occuring, which could be the source of short term production increase.
“The following (Possible typo, “falling’) rig count in the United States is raising concern about a future drop in U.S. oil production at the same time though many of the producers are refracting current riggs.” (Possible typo, “current wells”). Note no source provided for refracing comment.
The blue graph shows the average number of weekly rigs operating during a given month as taken from the above weekly drilling chart. The rig graph has been shifted forward by 7 months to roughly coincide with the increase in the production graph starting in November 2023.
Clearly the production rise up to November 2024 is closely associated with the rise in the rig count and associated well completions delayed by roughly seven months. The rising production starting in February 2025 does not correlate with the dropping rig count.

The Eddy county GOR pattern is similar to Lea county except that Eddy broke out from the semi bounded range earlier and for a longer time and then added a second semi bounded GOR phase. For March New Mexico’s Oil Conservation Division (OCD) reported oil production increased by 60 kb/d to 945 kb/d and stayed within the second semi-bounded region.
Texas Permian
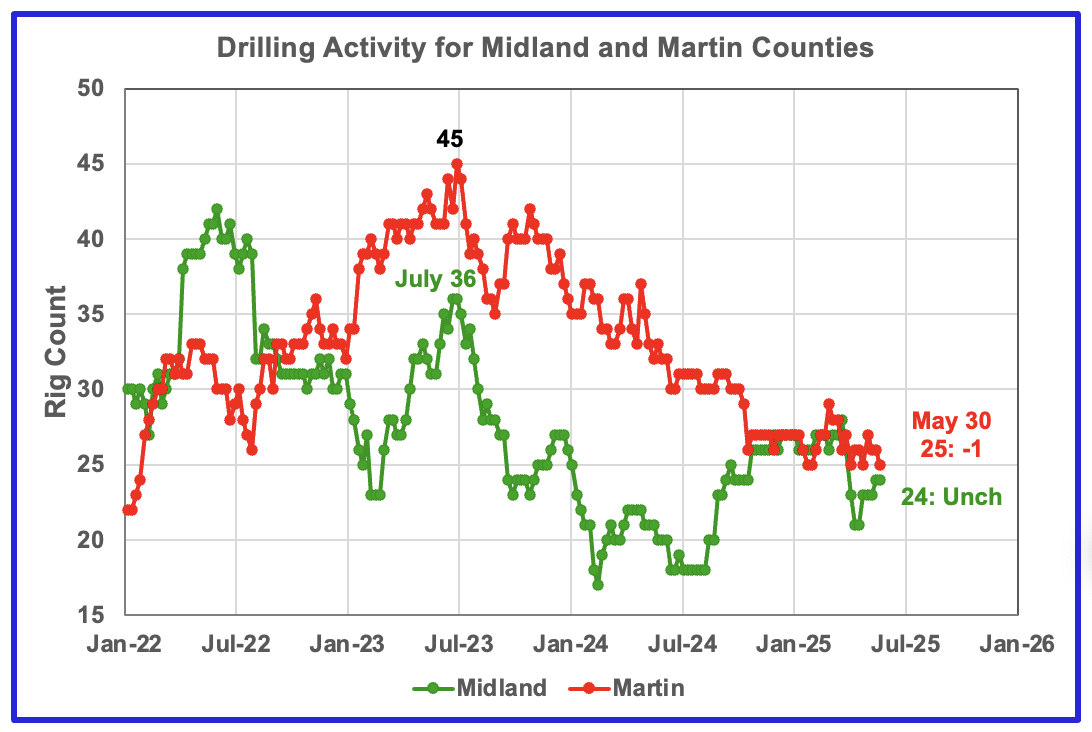
The Midland county rig count has been rising again since mid-April from 21 to 24 at the end of May.
The opposite is true for Martin county. In the week ending May 30, 25 rigs were operational, down 19 from 45 in July 2023. Since the end of October Martin’s rig count has been bouncing around 26.
Oil Production in Texas Counties

March’s projected production dropped 10 kb/d to 594 kb/d, a new recent low. Both January and February projected production reported in the previous post have been revised lower as expected because large updates to earlier months did not occur this month as occurred in previous reports. For example, February’s projected production in last month’s report dropped by 51 kb/d from 655 kb/d to 604 kb/d.
The orange and green graphs show the oil production for Midland County as reported by the Texas RRC for February and March. The red graph uses the February and March data to project production as it would look after being updated over many months.
Dropping production starting in November through March is a strong signal that Midland production has passed peak production.
The blue graph shows the average number of weekly rigs operating during a given month as taken from the weekly drilling chart. The rig graph has been shifted forward by twelve months to better align with production. So the average 34.5 Rigs/wk operating in July 2023 have been moved forward to July 2024 to show the possible correlation and time delay between rig count, completions and oil production. This shift is much larger than the typical six to eight months used in other counties. Not clear why there should be such a difference.
If the twelve month shift in the rig count is approximately correct in that oil production can be tied to the rig count, oil production in Midland county should increase slightly starting in August for about six months before resuming its decline.
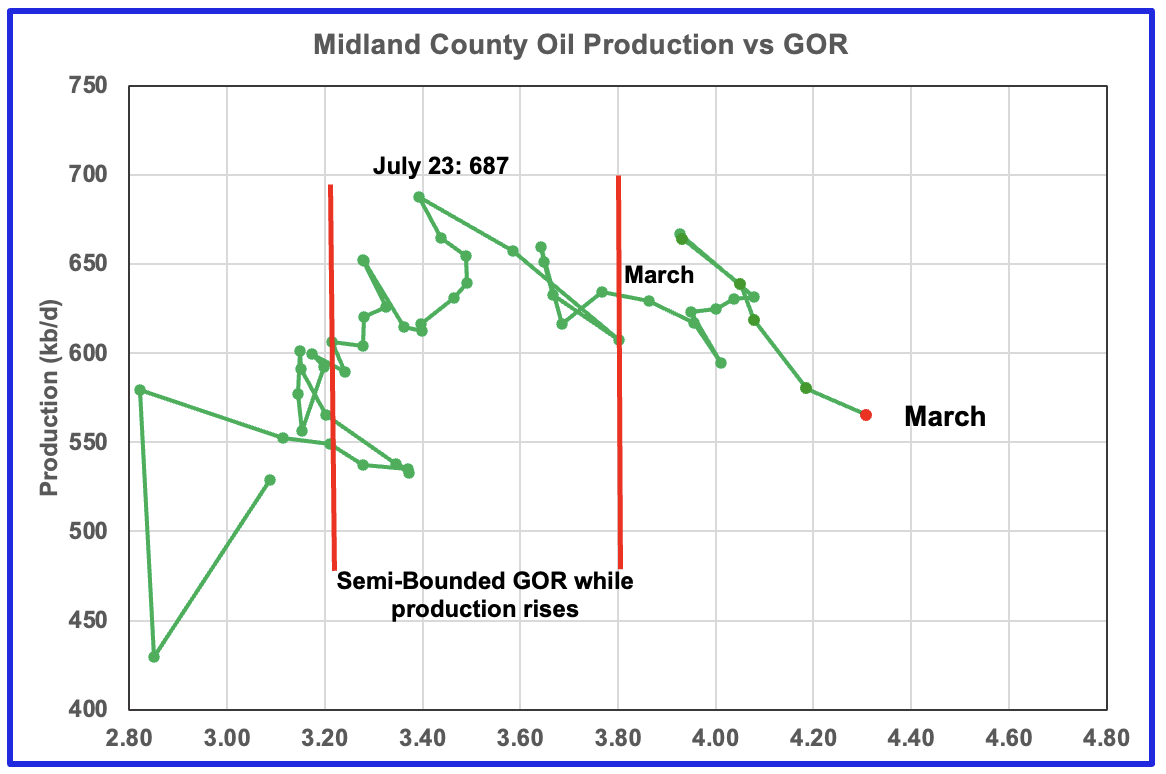
For March the GOR ratio increased to 4.31 from February’s 4.19 while reported preliminary oil production dropped 15 kb/d.
With Midland county into the bubble point phase, oil production and the GOR have stayed within a narrow range outside of the initial Semi-Bounded GOR region since March 2024. However the March 2025 GOR has broken out to new highs.
The oil production and GOR shown in this chart are based on the RRC’s March production report. Note that while the last few months are subject to revisions, the July 2023 to May 2024 production data has been steady for a number of months.

For Comparison: Martin county’s oil production posted last month.
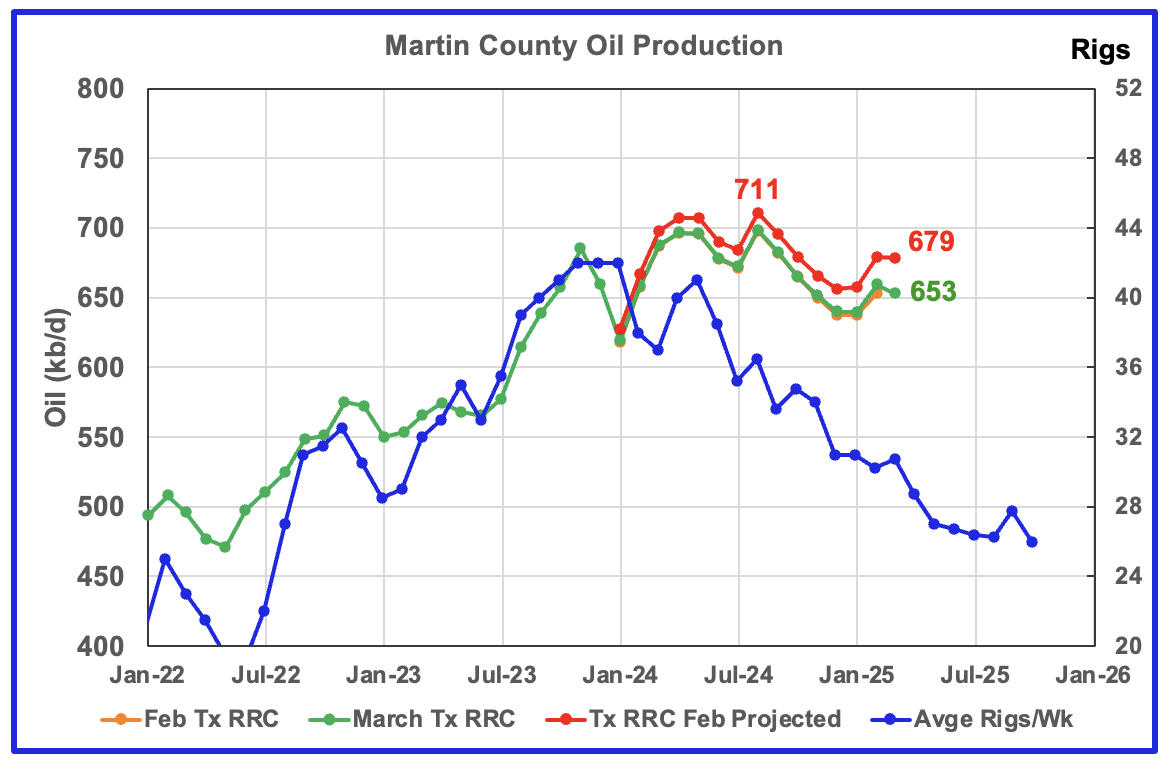
Martin county’s projected March oil production was unchanged at 679 kb/d. The March projection is more realistic than the previous one shown above due to the smaller month over month revisions compared with those that occurred last month. Compare the gap between orange and green graphs starting in January 2024. For example, February production reported in the previous post has been revised down from 765 kb/d to 679 kb/d. August 2024 now appears to be peak production for Martin County.
The orange and green graphs show the production for Martin County as reported by the Texas RRC for February and March. The blue chart shifts the rig count ahead by 6 months.
The red graph is a projection for oil production as it would look after being updated over many months. This projection is based on a methodology that uses preliminary February and March production data. The green graph shows oil production reported by the Texas RRC for March and is 16 kb/d lower than February’s. Note how production has dropped from September 2024 to January 2025, green graph. The February and March projected increases could be the beginning of a short term plateau before production begins to fall again.
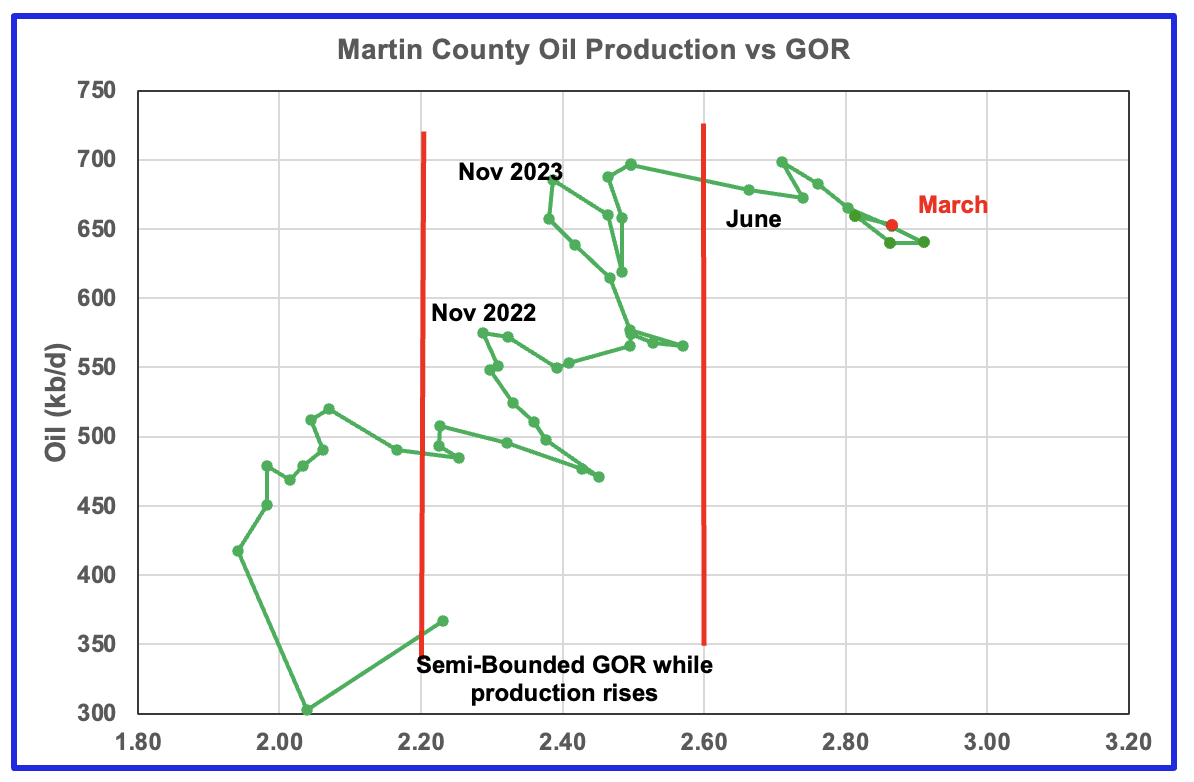
Martin county’s oil production after November 2022 increased and at the same time drifted to slightly higher GORs within the semi bounded range. However the June 2024 GOR saw its first move out of the semi bounded region. The preliminary Texas RRC’s March production for Martin county shows an increase in the GOR accompanied by a drop in oil production.
Martin county has the lowest semi-bounded GOR boundary of the four counties at a GOR of close to 2.60. In March the GOR rose to 2.87 from 2.81 in February while production dropped by 6 kb/d. The GOR is clearly out of the semi-bounded region. Martin County has now entered the bubble point phase that should result in oil production possibly entering a slowly dropping plateau phase.
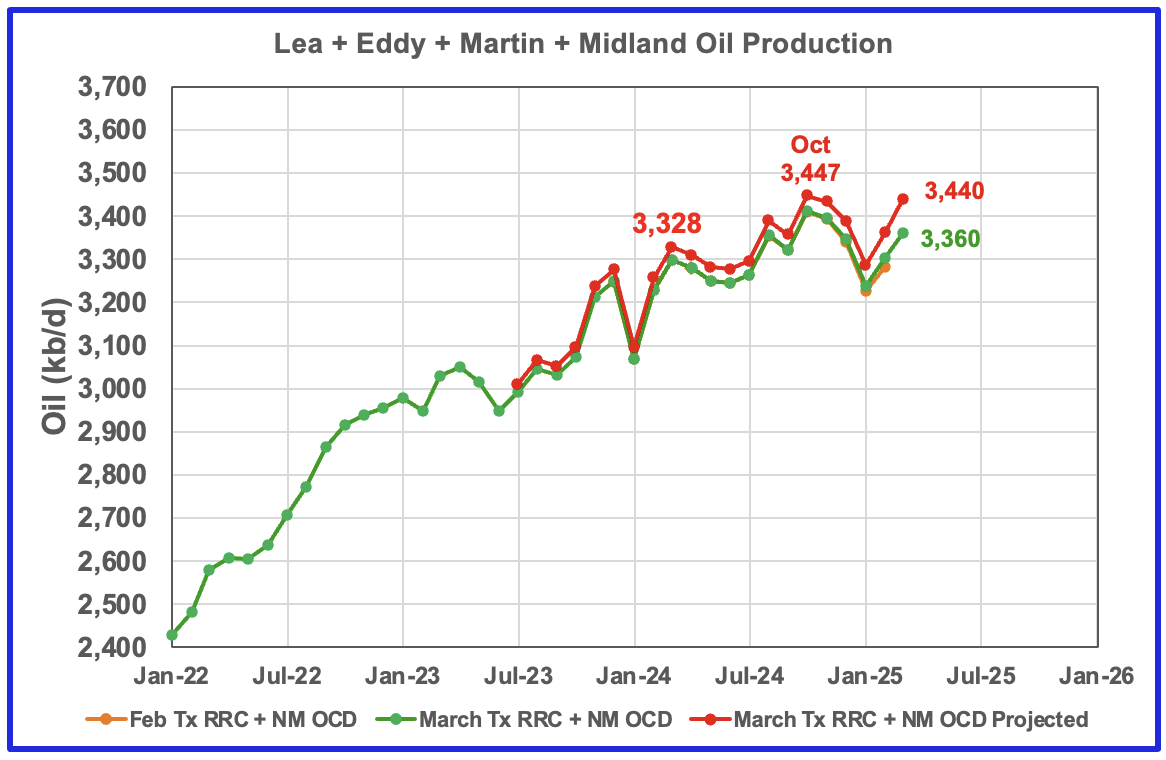
This chart shows the total oil production from the four largest Permian counties. Assuming that current March Permian production is close to 6,400 kb/d, these four counties account for 54% of the total. March is the first month giving indications that the projected and preliminary combined oil production from the four largest counties may have entered a plateau phase. The increases in the two New Mexico counties are being offset by losses in the Texas counties. March’s projected production rose by 78 kb/d
The February and March initial production data is shown in the orange (slightly visible after January 2025) and green graphs respectively. The red graph uses the February and March data to project an estimate for the final March production. The large March increase is related to the production rise in the two New Mexico counties.
Findings
– The March preliminary production data was in general good and the projections are reasonable to good. The four largest Permian county production charts are in different phases of their production life. Of the four, one is at a new high, one is in its plateau phase and two are in decline. Taking into consideration that the price of WTI is stuck close to $60/b, the rig and frac spread counts are starting to drop, taken all together, they all point to peak production occurring in the onshore lower 48 within the next three to six months.
– Lea county entered a plateau phase in May 2024. While oil production is not following the rig count graph directly, the dropping rig count is resulting in Lea production currently being in a slowly declining plateau phase.
– Eddy county’s production hit a new high in March.
– Midland county first peaked in July 2023 and has roughly followed the declining rig count graph up to May 2024. Midland county peaked a second time in November 2024. Dropping production starting in November through March is a strong signal that Midland production has passed peak production.
– August 2024 now appears to be peak production for Martin County and it may enter a plateau phase at a lower production level around 650 kb/d.
Texas District 8
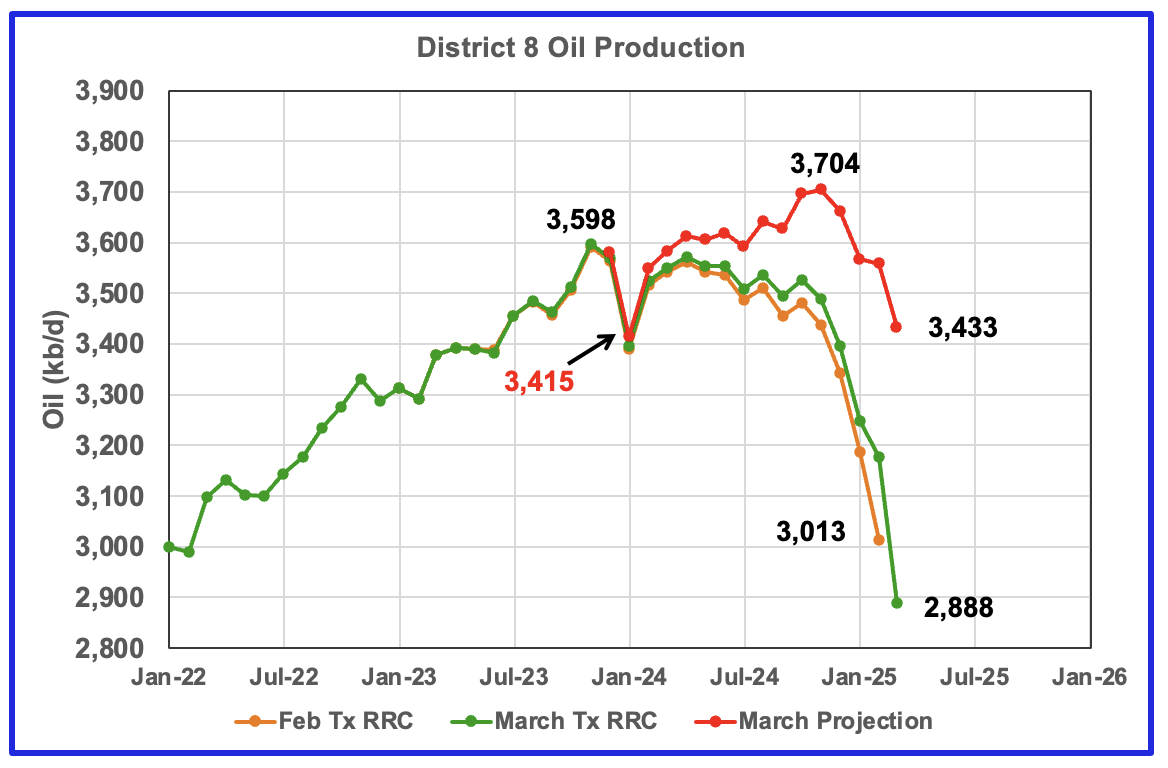
District 8’s oil projected production peaked in November 2024 at 3,704 kb/d. March’s projected production dropped by 125 kb/d to 3,433 kb/d and is 271 kb/d lower than November 2024.
Texas District 8 contains 20 counties. Of the 20, six are reviewed/tracked in this post, Midland, Martin, Loving, Reeves, Howard, and Glasscock. Of the total production of 3,433 kb/d, these six counties accounted for 76% of the total. From November 2024 to March 2025, production in District 8 decreased by 271 kb/d. Of the 271 kb/d decrease, those six counties accounted for 246 kb/d or 91% of the decrease.
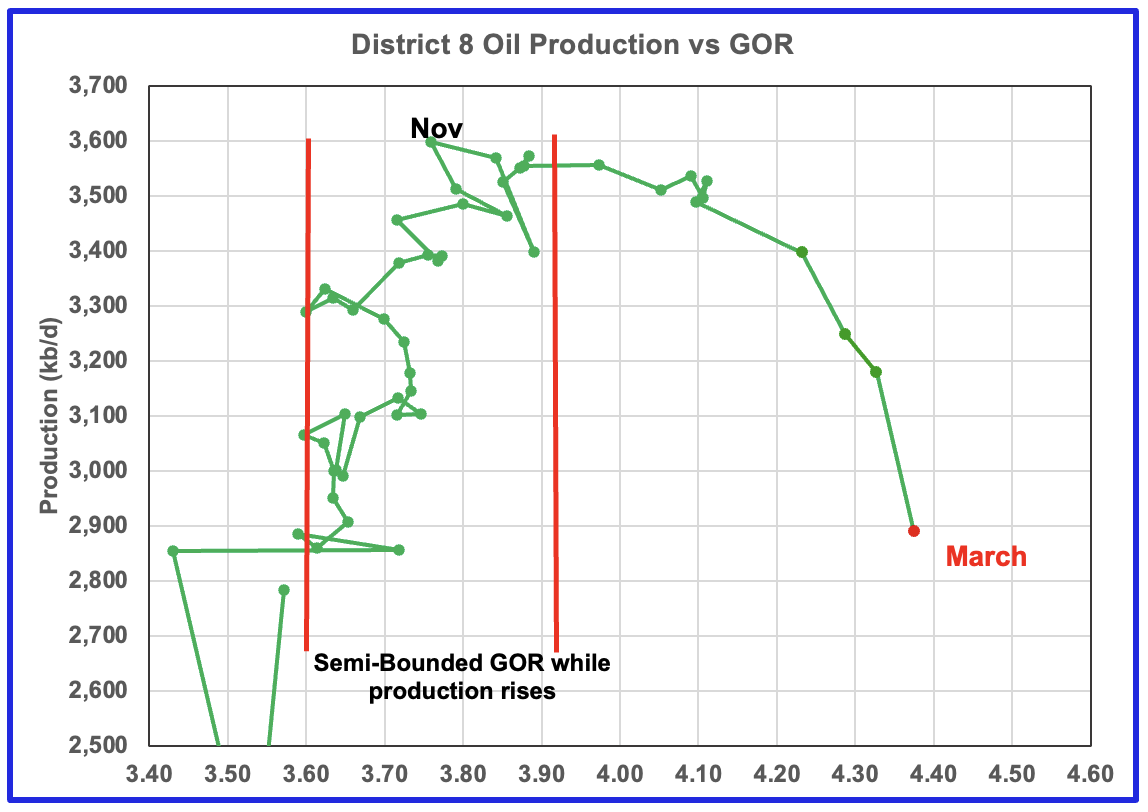
While revisions in the production chart affect the projection, it does not affect the GOR.
Plotting an oil production vs GOR graph for a district may be a bit of a stretch. Regardless here it is and it seems to indicate many District 8 counties may well be into the bubble point phase. The GOR continued to increase in March to 4.37. This is another indicator that implies District 8 may be on a production plateau.
Oil Production and GOR Charts for a number of Larger Texas Oil Producing Counties
Below are charts for the next six top oil producing counties in Texas.


March’s projected oil production for Reeves county dropped 2 kb/d to 468 lb/d. Reeves county peaked in May 2024 at 522 kb/d. The GOR chart indicates that Reeves County entered the bubble point phase in December 2024 and production is in a declining phase.
Reeves county GOR is high because it is the number 1 Texas county ranked by gas production. The current C + C production is equally split between crude and condensate.
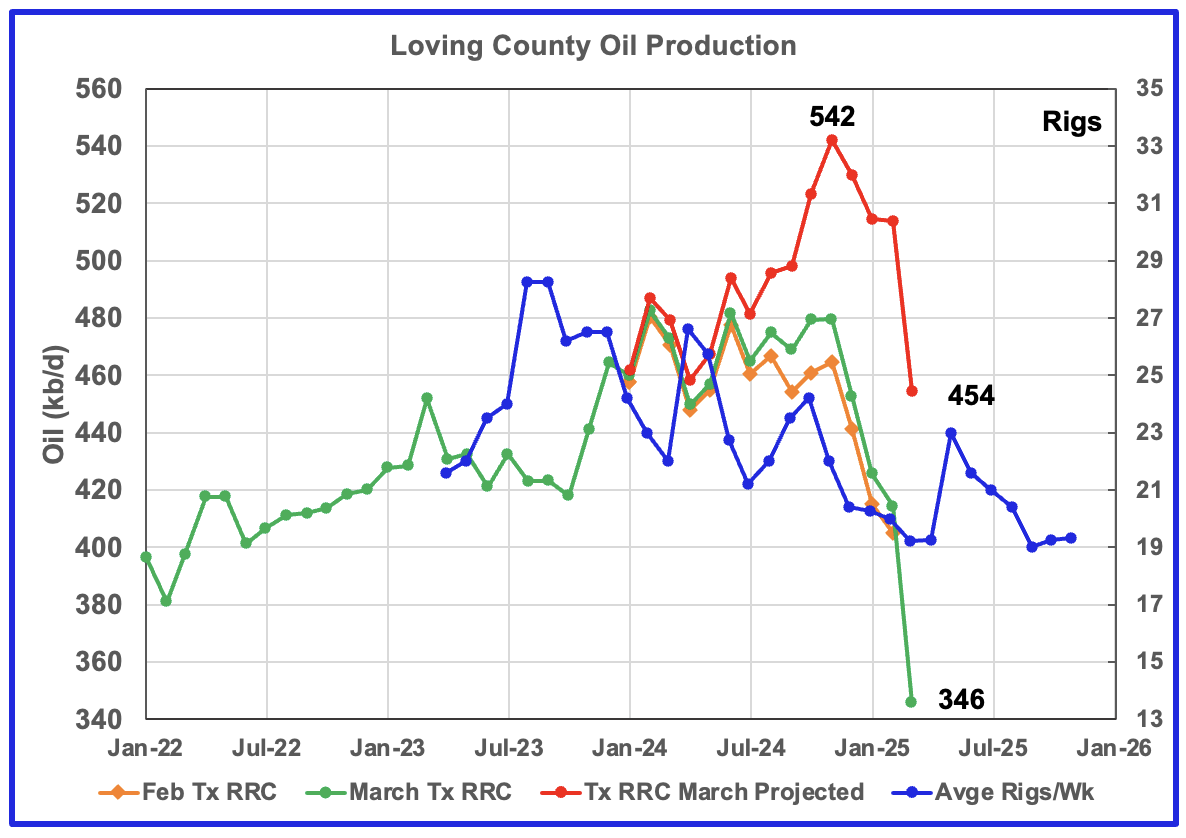
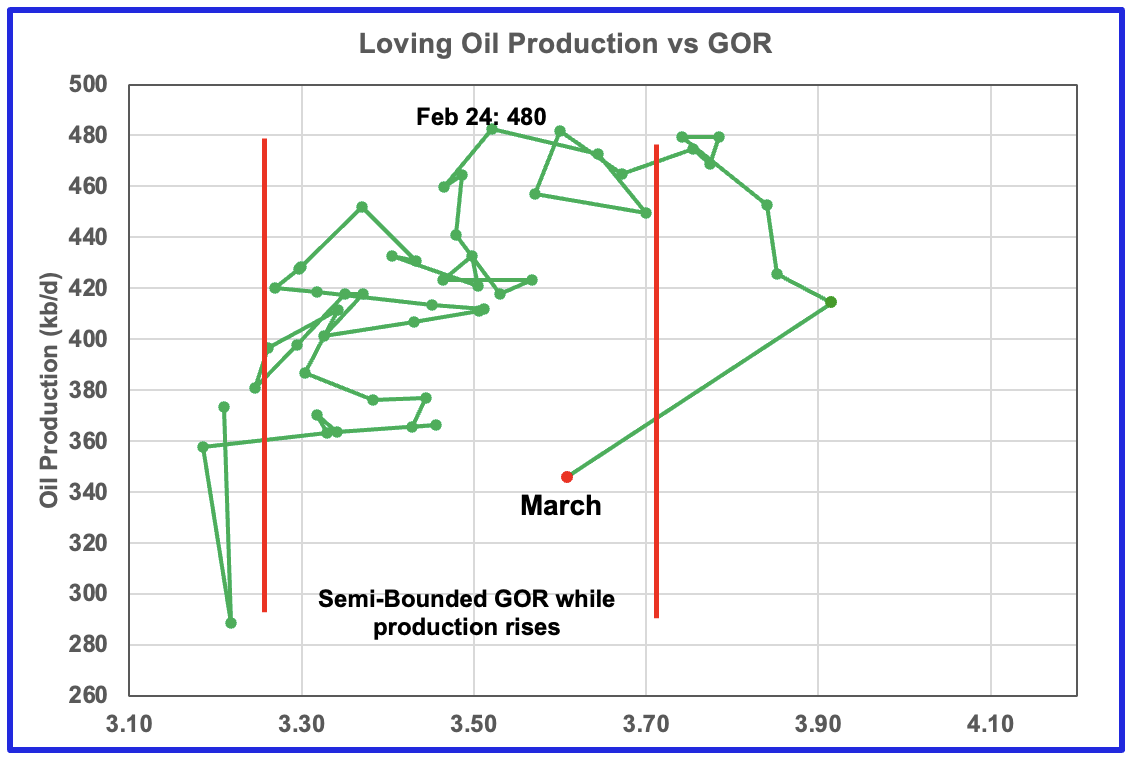
Loving county had a large production drop of 60 kb/d in March to 454 kb/d. Loving production peaked at 542 kb/d in November 2024.
For March, the GOR has moved back into the original Semi-Bounded region which is an indication that production came from an”oilier” area, i.e. one that has a lower GOR.

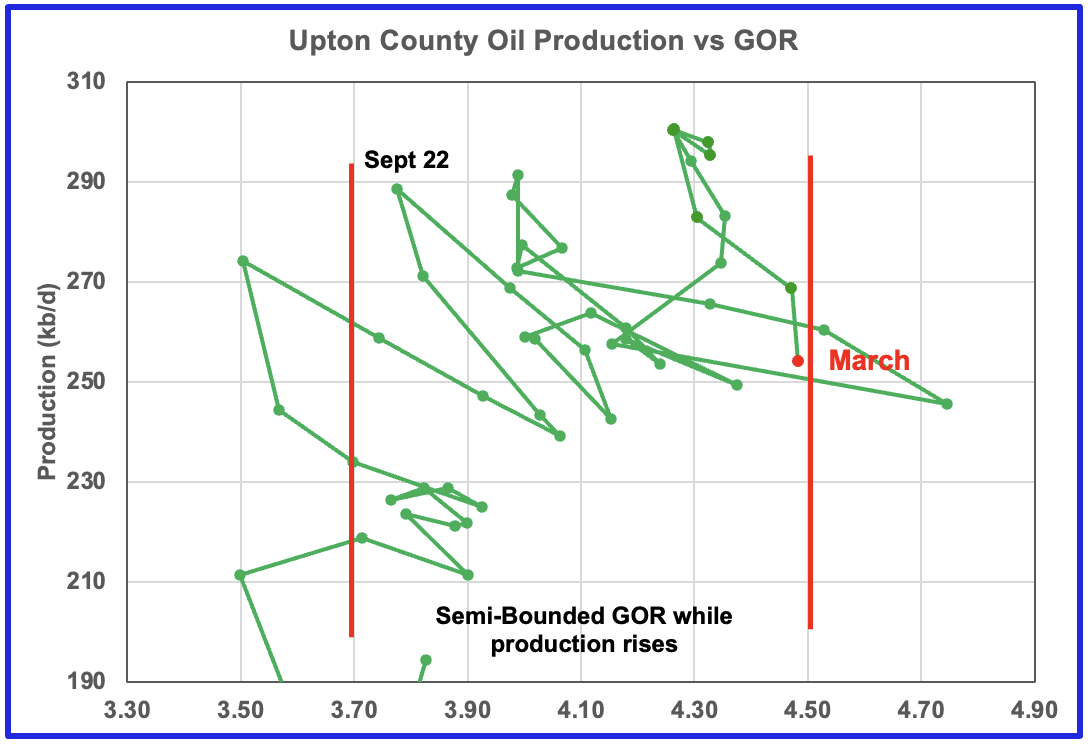
Upton county production has followed the rig count graph since January 2024 and peaked in December 2024. March saw another drop in both the preliminary production and the production projection. The GOR may be on the verge of moving out of the semi-bounded region.
March’s projected production dropped 12 kb/d to 257 kb/d.
The rig graph in the oil production chart has been shifted forward by six months.

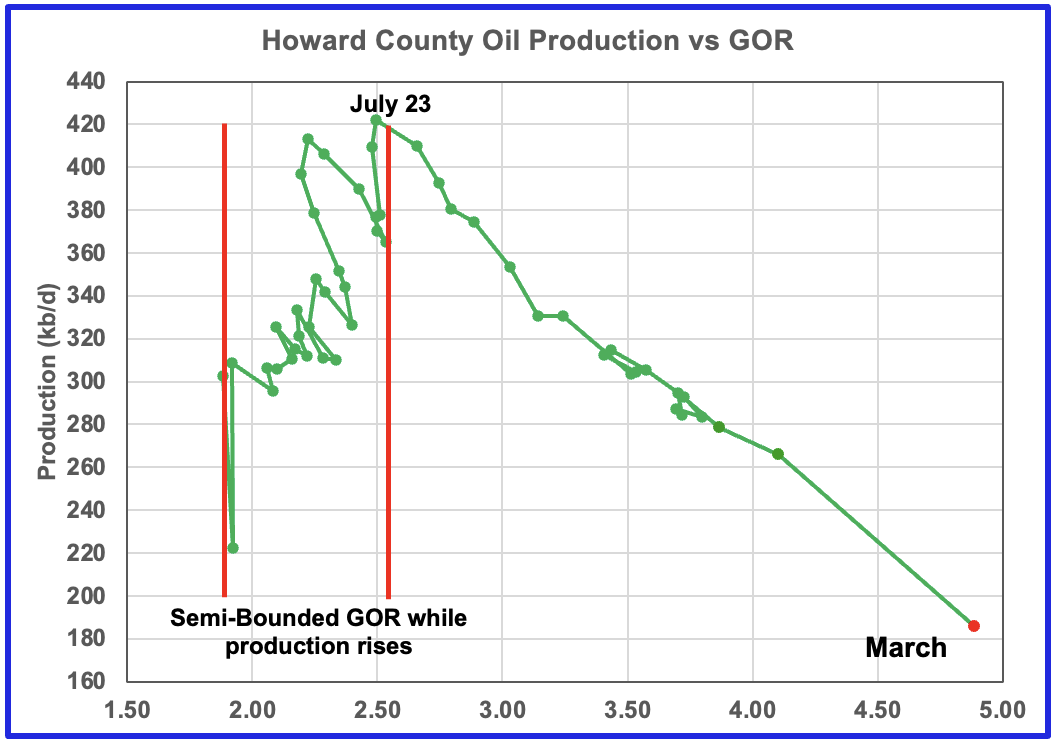
Howard county peaked in July 2023 at 428 kb/d. Note the rapid movement of the GOR to higher ratios once it broke out of the Semi-Bounded GOR range. While the GOR has risen to new highs, preliminary production has kept on falling. However the projected production rise shown after July 2024 may be an indication that production has moved into new and lower plateau zone.
March’s projected production dropped 34 kb/d to 281 kb/d.
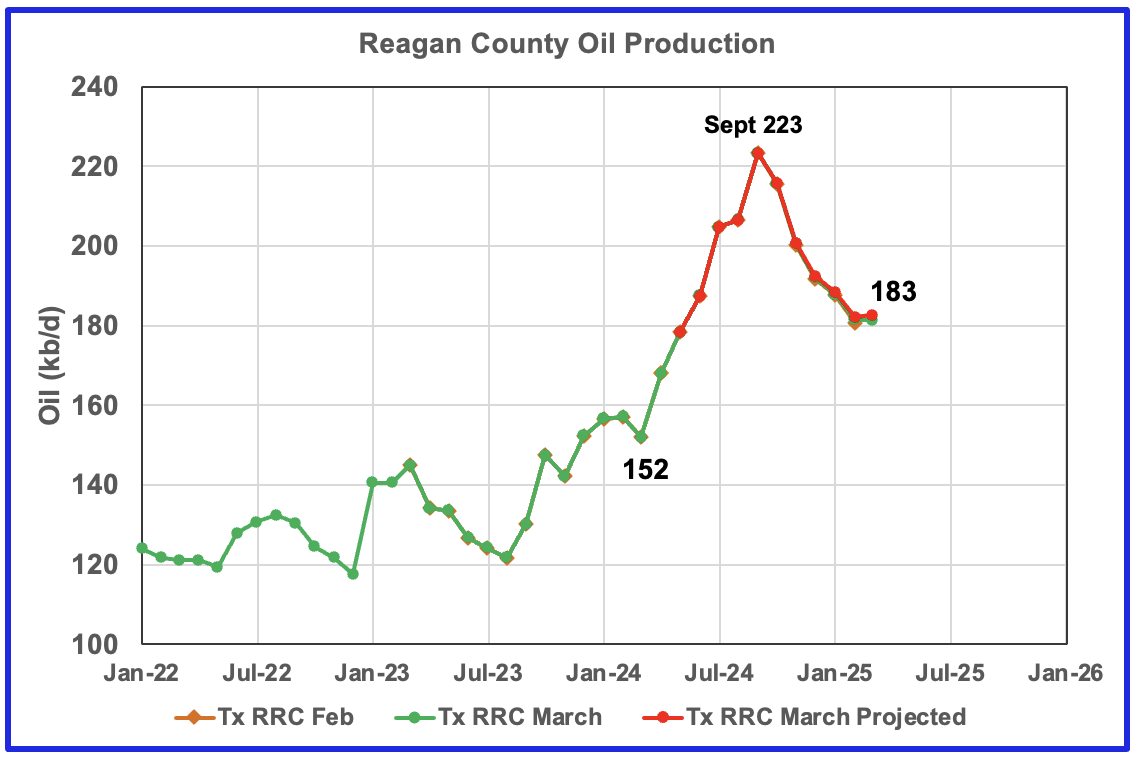
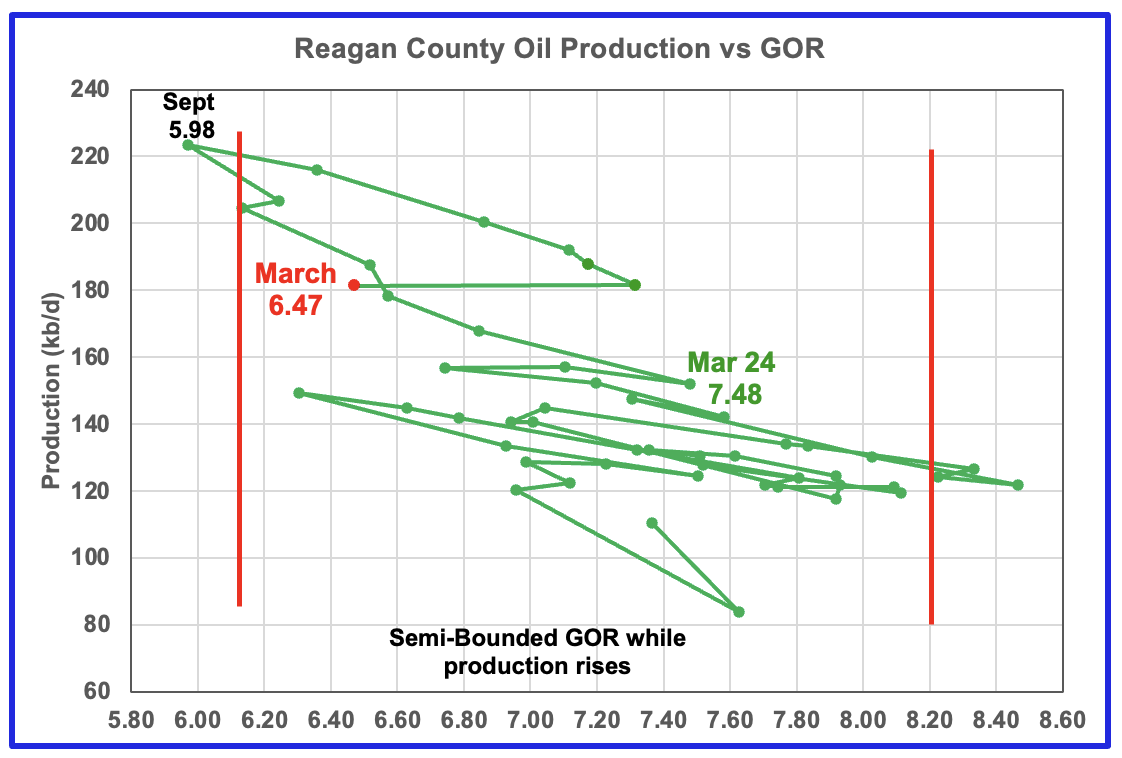
Reagan county oil wells have a very high GOR and passed peak production in September 2024. The production chart indicate that oil production has been falling since September along with an increasing GOR.
March’s projected production increased by 1 kb/d while the GOR fell.
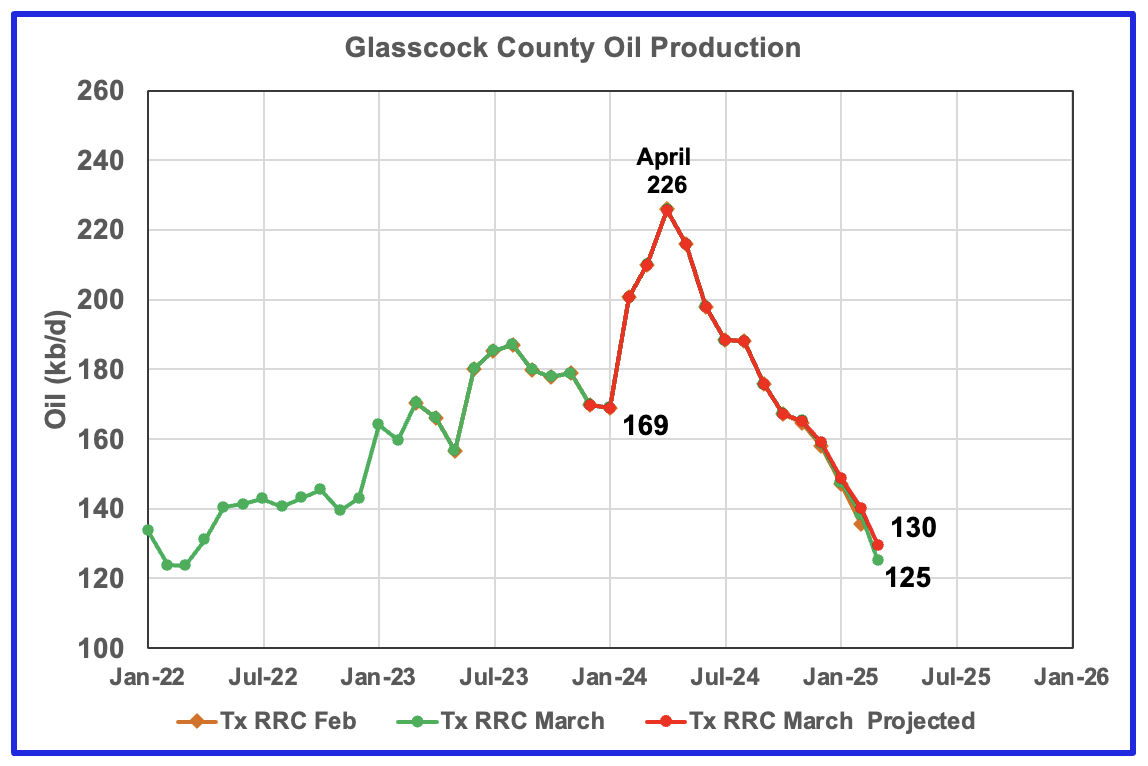
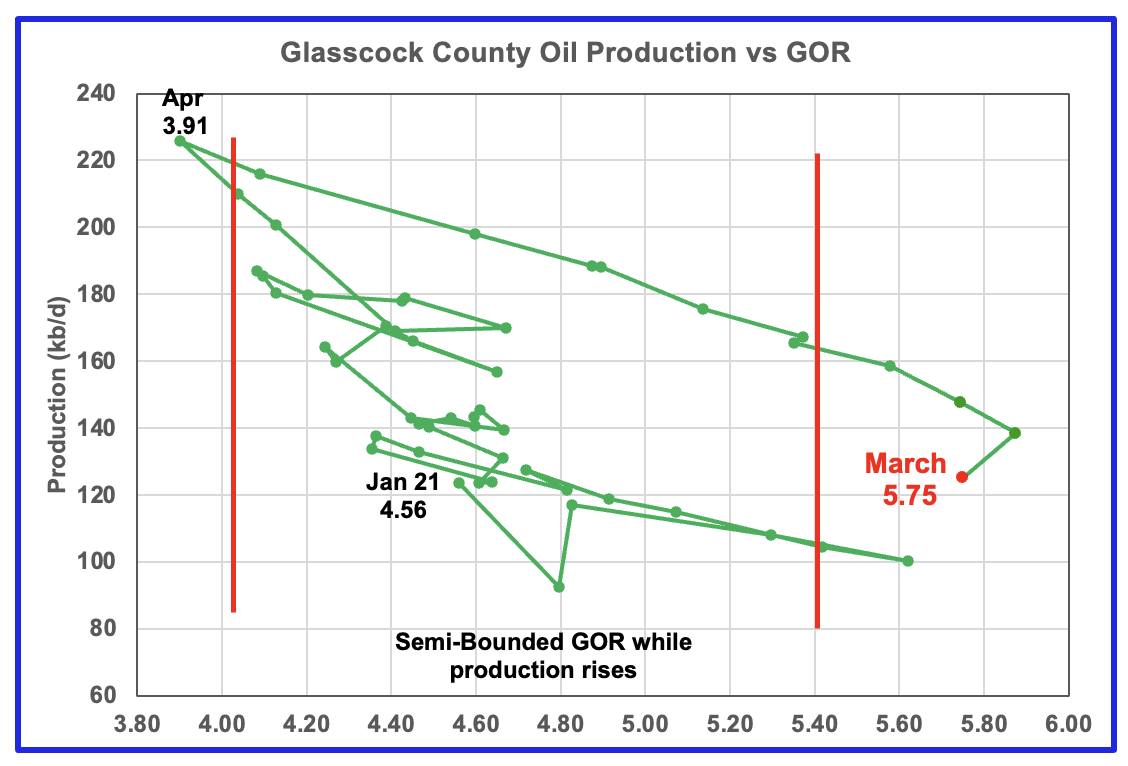
Glasscock’s production has been falling since April 2024 and does not show any sign of slowing. The GOR moved out of a very wide Semi-Bounded region to a new high of 5.84 in February. Note the rapid increase in the GOR starting from 3.91 in April 2024.
March’s projected production dropped 10 kb/d to 130 kb/d while the GOR dropped back to 5.75.
Drilling Productivity Report
The Drilling Productivity Report (DPR) uses recent data on the total number of drilling rigs in operation along with estimates of drilling productivity and estimated changes in production from existing oil wells to provide estimated changes in oil production for the principal tight oil regions. The new DPR report in the STEO provides production up to April 2025. The report also projects output to December 2026 for a number of basins. The DUC charts and Drilled Wells charts are also updated to April 2025.

The oil production for the 5 DPR regions tracked by the EIA’s STEO is shown above up to April 2025. Also the April 2025 STEO projects production out to December 2026, red markers. Note DPR production includes both LTO oil and oil from conventional wells.
April oil output in the five DPR regions increased by 90 kb/d to 8,943 kb/d. Production is expected to rise by 65 kb/d in May to 9,008 kb/d. Note the sharp production rise of 265 kb/d from May 2025 to September 2025 to 9,274 kb/d. After that production growth plateaus for four months before declining. Considering the flat rig count and low completion rate, it is not clear why production should rise over this period.
Production in December 2026 is forecast to be 9,187 kb/d.
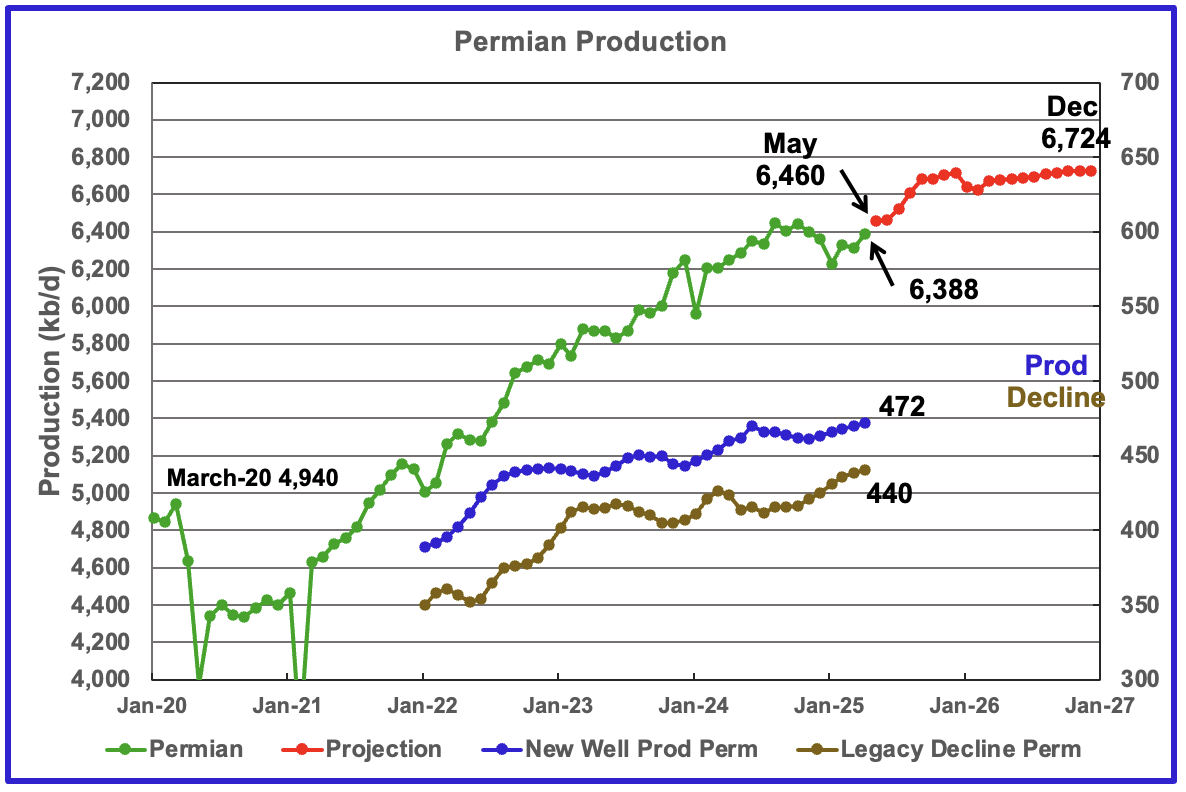
The EIA’s May STEO/DPR report shows Permian April output rose by 73 kb/d to 6,388 kb/d. From May 2025 to December 2026 output is expected to rise by 264 kb/d to 6,724 kb/d. Note that December 2026 production has been revised down by 61 kb/d from 6,785 kb/d.
Production from new wells and legacy decline, right scale, have been added to this chart to show the difference between new production and legacy decline.
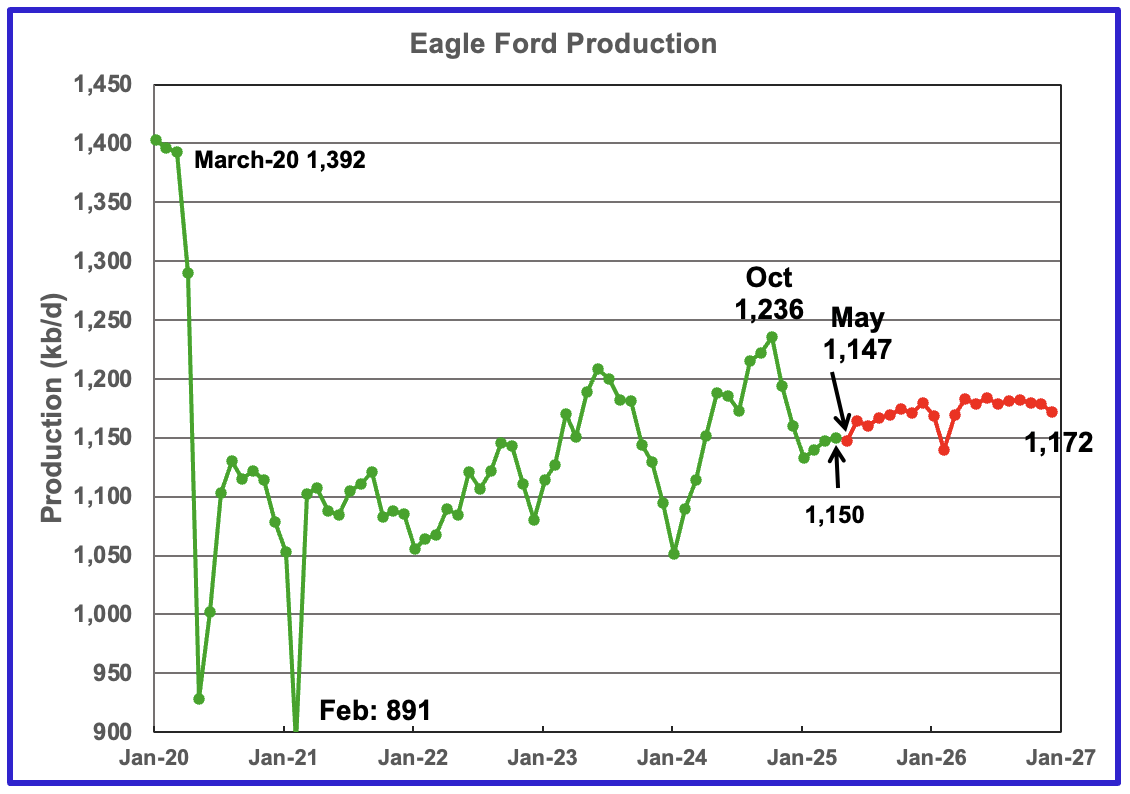
Output in the Eagle Ford basin had been increasing since January 2024 and appears to have peaked in October 2024 at 1,236 kb/d and then dropped every month until January 2025. April production increased by 2 kb/d to 1,150 kb/d. May 2025 production is forecast to drop by 3 kb/d to 1,147 kb/d.
Production over the next two years is expected to peak in June 2026 at 1,184 kb/d. Output in December 2026 expected to be 1,172 kb/d.
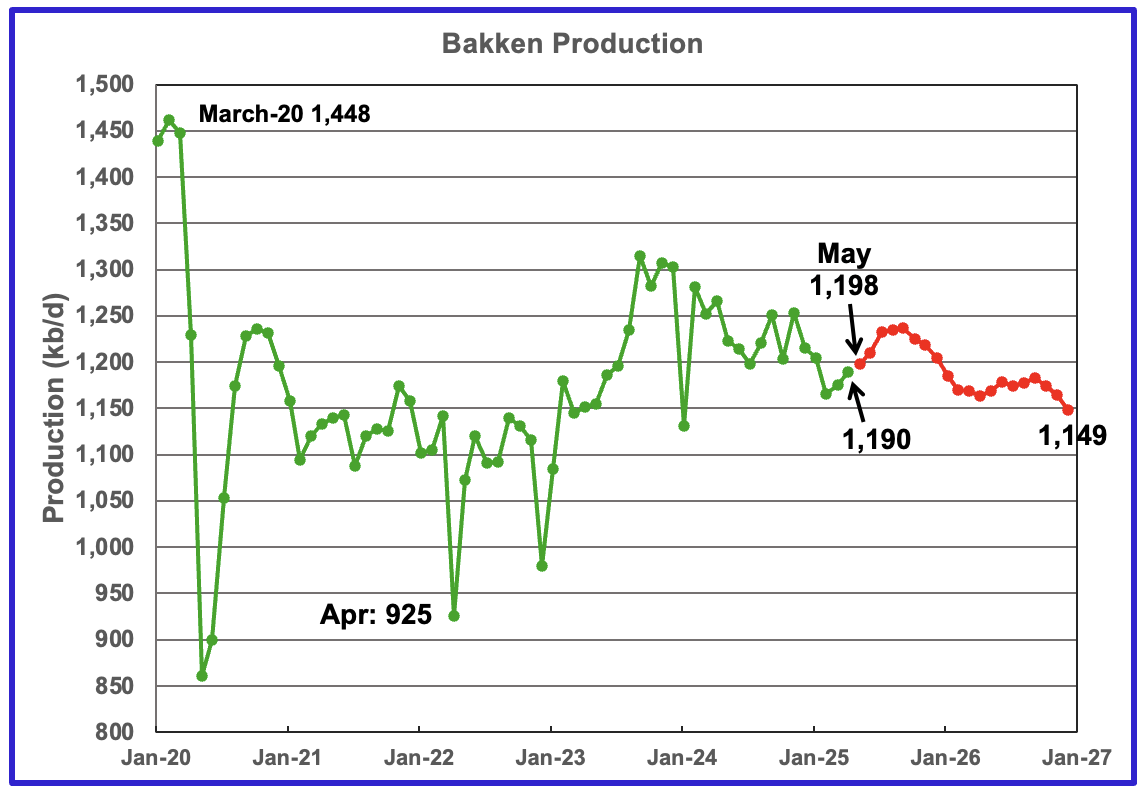
The DPR/STEO reported that Bakken output in April rose by 15 kb/d to 1,190 kb/d. The STEO/DPR projection, red markers, shows output to be essentially in decline after October 2025, dropping to 1,149 kb/d in December 2026.
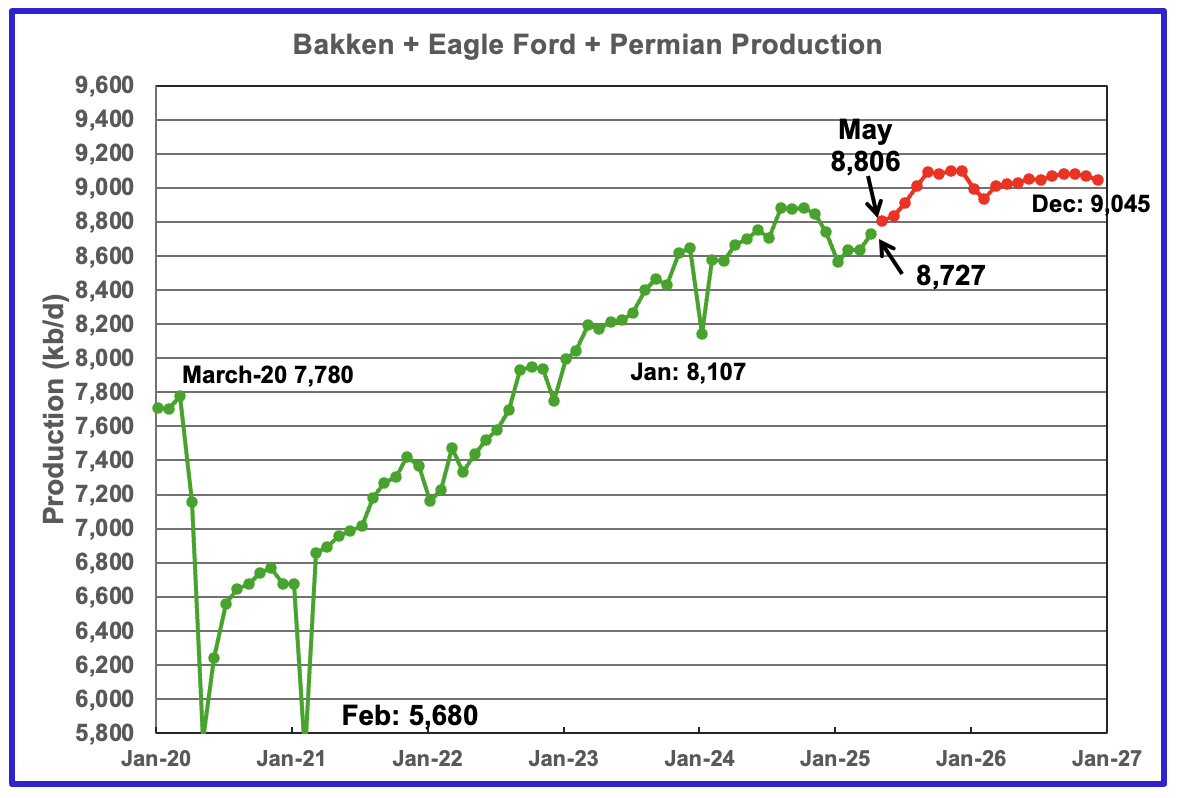
This chart plots the combined production from the three main LTO regions. For April output rose by 89 kb/d to 8,727 kb/d. Production for December 2026 is forecast to be 9,045 kb/d, a downward revision of 11 kb/d from the previous report.
March’s production forecast of 8,929 kb/d in last month’s post turned to be 202 kb/d too high compared with the currently reported production of 8.727 kb/d.
DUCs and Drilled Wells
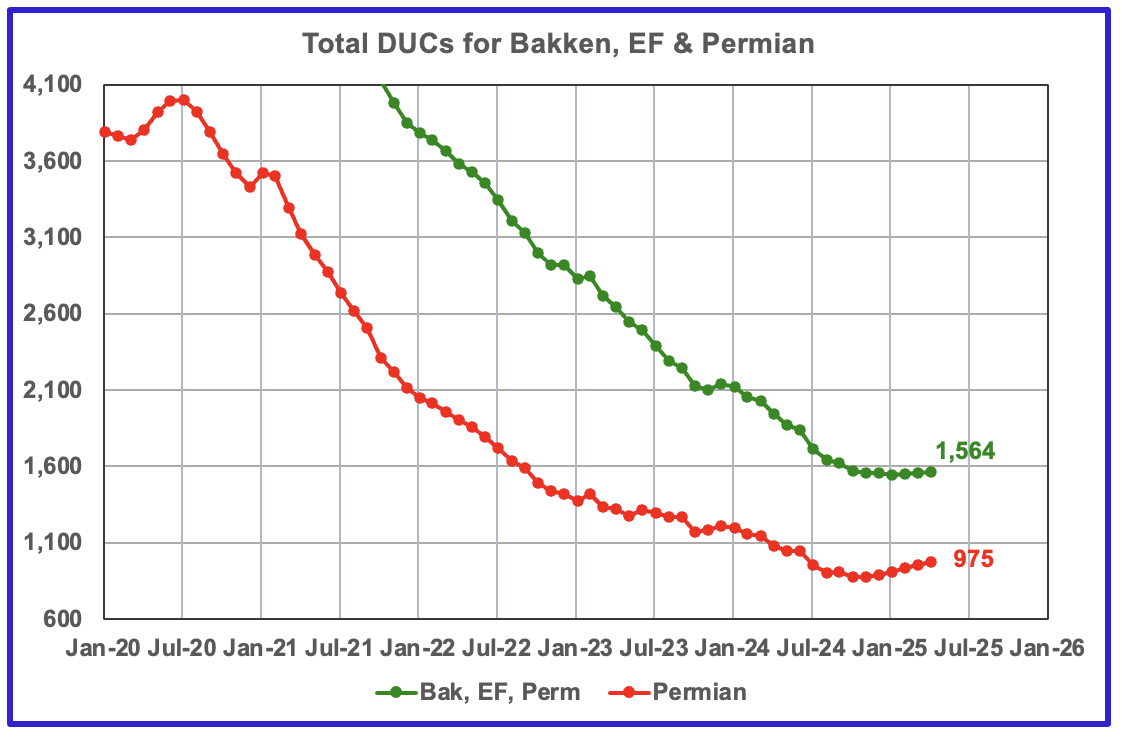
The number of DUCs available for completion in the Permian and the three major DPR regions has turned from a dropping trend to a rising one. April DUCs for the three basins rose by 6 to 1,564. In the Permian the DUC count increased by 23 to a total of 975.
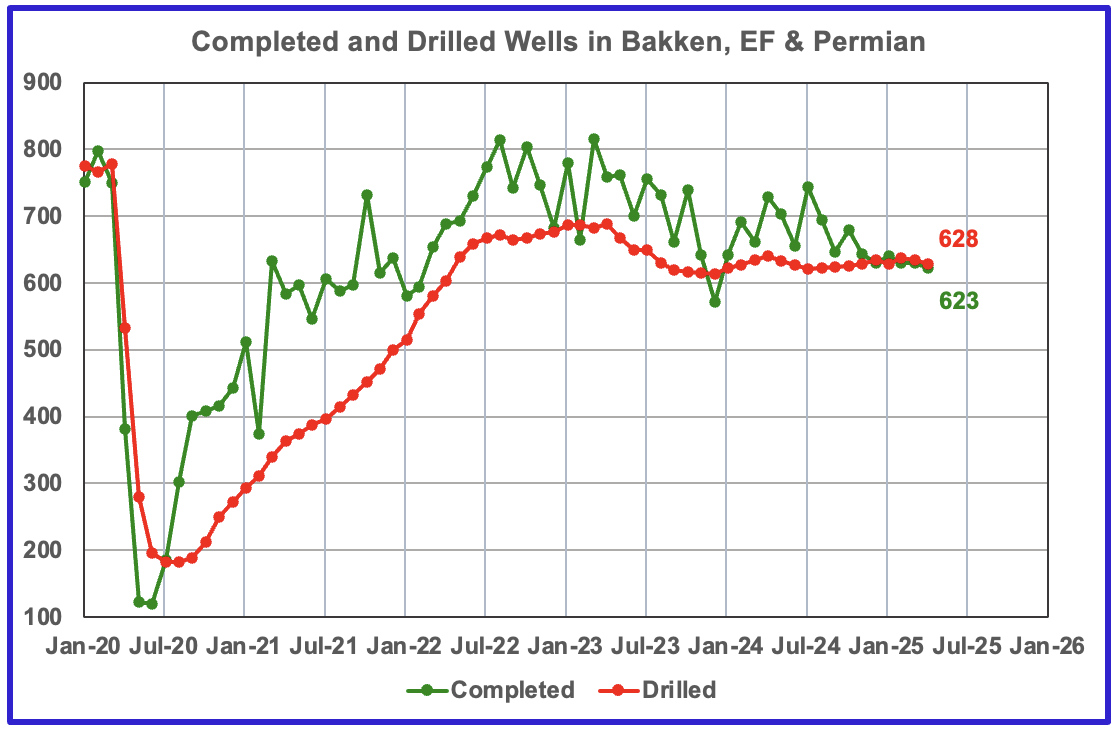
In the three primary regions, a total of 623 wells were completed and 628 were drilled.
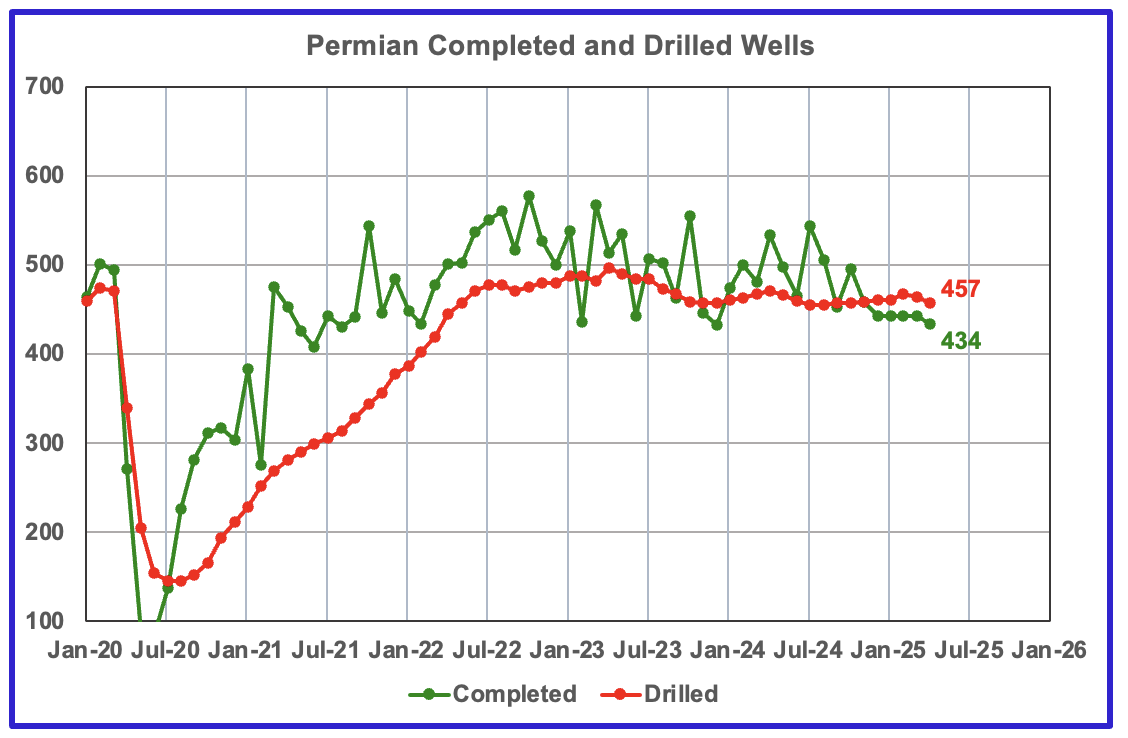
In the Permian, the monthly completion and drilling rates have begun to drop.
In April 2025, 434 wells were completed while 457 new wells were drilled. This is the fifth month in a row in which the number of wells drilled exceeded the number of completed wells.
Thank you Ovi for your work! I’ve been revising the last four months of US production and this is in fact the first time that such a pronounced December peak is visible. While the peak might move forth and back in the next couple of months, I think it’s safe to call the plateau (looking back, it began in Dec. 2023). There was a saying, as goes Saudi Arabia, so goes the world. After fracking, this could well fit the US. So here we go?
Westexasfanclub
Thanks
The big surge in US production has come from NM and has occurred over February and March. February added 98 kb/d to 5,661 and March 100 kb/d. These large monthly NM increments have happened in the past. There is something in Lea and Eddy county’s that just keeps on giving. However Lea’s rig count is dropping and which may signal a drop in Tier 1 sites.
There were a large number of smaller production increments from states along with the GOM that helped to create this new peak.
Thank you Ovi, excellent post.
I would note that on the Permian completion and drilling rate chart at the end of the post that the completion rates for the final 5 months of the chart look like estimates, notice how the variability is far lower than the earlier period. If we look at the December 2024 STEO for Permian drilled and completed wells the Months from July to Dec 2024 averaged 445 wells completed vs 491 completed wells for the same 5 months in the May 2025 STEO.
Main point is that recent 5 months for completions might not be accurate.
Note that I agree with Ovi that the STEO forecast for increased output of 330 kb/d for L48 excluding GOM from May to Sept 2025 looks wrong. My expectation is flat output plus or minus 100 kb/d from May to Sept 2025 for L48 excluding GOM.
Chart below shows this chart for the Dec 2024 STEO for comparison.
Dennis
Thanks
I have also noticed that the last 4 or five months are not as volatile as the earlier months. As you say, that may imply they are estimates
A very simple scenario for US output using the OLS trend of the past 14 months to project future US C plus C output. This does not take account of falling oil prices and rig counts so may be optimistic. After December 2025 I would expect either flat or declining US output based on the EIA STEO forecast for oil prices and expected increases in OPEC plus output.
Note also the May STEO has December 2025 output for US at 13698 kb/d (167 kb/d higher than my very simple scenario).
An alternative scenario using OLS trend of past 12 months for US C plus C output would have output in December 2025 at about the same level as March 2025.
Dennis
I think a number of counties came together in March to create this new peak. As usual we will have to see if this is the end.
Ovi,
I would be very surprised if this simple scenario proved to be anywhere near actual output. Also the choice of 14 months was arbitrary (trying to leave out the low month in Jan 2024.) Using the 12 month trend is a lower annual rate of increase of 157 kb/d and would be roughly the same output in Dec 2025 as March 2025, my guess is an undulating plateau between 13475 and 13495 kb/d from April to Dec 2025, in 2026 I expect decline in 2026, if the STEO oil price forecast is correct.
Mostly we will just have to see what happens.
A bit tangential but this is a followup to some commentary from late last post, and before.
“New nuclear power capacity could meet about 10% of the projected increase in data center electricity demand by 2035, Deloitte said in an April 9 report.”
https://www.utilitydive.com/news/nuclear-power-smr-data-center-deloitte/745390/
Meaning that 90% of this new electricity demand will have to be met by other sources- especially NG and Solar.
New nuclear industry momentum (SMR’s in particular) is strong but the economic viability remains a big open question. Industry experts have predicted that the output electricity will be more expensive than from large scale nuclear power due to lack of scale advantages. Perhaps that will gradually be offset as experience in the sector grows, but that relative cost improvement will likely take until at least 2040 to prove itself, if ever.
We’ll have to see how many of these designs actually achieve ‘modularity’.
The last nuclear plant project in the US did not go well. It took much longer to complete at a much higher price than projected-
“The electricity from Plant Vogtle is extremely expensive, costing $10,784 per kilowatt-hour (kWh), according to a report from Third Act. This cost is significantly higher than the $900 – $1,500 per kWh for electricity from wind, solar, and natural gas sources.”
Hickory,
Also for long term electricity, natural gas may be an expensive option as the resource becomes scarce. It may be a useful bridge resource, but exporting most of it is probably not a great idea.
Also those investing in LNG export capacity would do well to look carefully at my chart and check to make sure they will get an adequate return on investment, my guess is they will be shirtless.
What kind of NG pricing assumption are you using for that projection Dennis?
I assume that prices will be going up and up for NG from here on out. That should be very stimulative for production attempts.
I wonder which year it be when a US president orders the cessation of NG exportation?
Jan 2032? Right after inauguration….if we are still having those.
The timing of export cessation would be a worthy betting subject.
Hickory,
I use the EIA AEO price assumptions.
https://www.eia.gov/outlooks/aeo/
Dennis,
While I disagree with close to 100% of what you say over all these years, I always respect the integrity which you ‘bring to the table’ in preparing your analysis.
Case in point … the above chart showing a peaking of natgas production around 2030 is beyond ludicrous, IMHO.
However, using the EIA’s absurd pricing of sub $3 HH out for the next 5 years MIGHT indeed result in stifled/curtailed output.
Howsabout using your Brainiac approach with the HH price of, say, $4.35/mmbtu?
This $4.35 price point is an actual, real world figure – right this moment on June 6 – being the average of today’s spot ($3.70) and January 2026 contract (($5.03).
Imma figgerin’ that the gas boys will produce a whole lot more natty at 4 bucks plus than well under 3.
In addition – in a continued convo regarding data center buildout in the previous post – on-site natgas power plant electricity generation is taking hold rapidly. (That project mentioned by Mr. Maddoux regarding the Liberty/IMG/Range operation is but one of several that are planned with Texas, West Virginia, Ohio and Pennsylvania leading the pack as in-basin pricing is so relatively low and supplies are so vast.
Keeping an eye on this data center frenzy might prove to be very enlightening.
Coffeeguyzz,
I take account of current pricing, STEO forecast and AEO, the scenario is mostly based on Mean TRR from USGS, shale gas proved reserves, historical production, and the tight oil ERR to TRR ratio of about 2/3. Also keep in mind that as tight oil peaks and declines a lot of associated gas from tight oil plays is no longer produced.
Also realize that if natural gas prices rise, there will be less demand from electric power plants as they won’t be able to compete with lower price sources of electric power. In addition LNG exports also will not be viable as the spread between Henry Hub and European prices narrows. So wishing for long term high natural gas prices will not make it so, as a wise oil man has pointed out, hoping for high prices is not much of a business plan.
Current HH price is about $3.70/MMBTU. STEO forecast is $4.10/MMBTU in 2025 and $4.80/MMBTU in 2026. We will see what happens, I expect natural gas output will rise up to 2030, though much depends on the price of natural gas in the future which is unknown. Note that the futures price in Jan 2026 changes daily, or we could choose the May 27 futures contract trading at $3.50/MMBTU (which also changes every day). See alternative scenario below
https://peakoilbarrel.com/us-march-oil-production-at-new-high/#comment-789806
Dennis,
Not a good model on US Shale Gas. Extreme unlikely downside. You continue to ignore the geology and are too focused on actuarial accounting which is, as you say, never correct.
LNG export biz should do good for the foreseeable future, even though you don’t like it. Still not sure why you hate LNG exports so much. Peculiar.
Gungagalonga,
The Scenario is based on mean USGS undiscovered TRR for shale gas and shale gas reserves along with historical production. My guess is the geophysicists at the USGS have this right. They do a pretty good job on tight oil, shale gas is also likely to be about right. Note that the economically recoverable resources (ERR) are assumed to be about 67% of the mean technically recoverable resources (TRR) as is the case for tight oil.
I think it is stupid to export a scarce resource that some day will be needed in the US.
Note also that US consumption of natural gas increased by 1.7 BCF/d each year on average for past 20 years. US Conventional natural gas output has been declining since 2001, so all of this increased consumption came from shale gas. Up to 2029 we would need another 8.5 BCf/d of shale gas if the consumption continues to increase at the average annual rate of the past 20 years. Add to this an increase in net exports of natural gas of 9.5 BCF/d (from AEO up to 2029) and we need 18 BCF/d more shale gas produced between 2024 and 2029 an average annual increase of 3.6 BCF/d. This would put US dry shale gas output at 100.7 BCF/d in 2029 to meet projected demand (consumption plus net exports). Marketed shale gas would be about 109 BCf/d (typically about 92% of marketed gas is dry gas). Scenario in comment below trys to meet this level of demand, URR=890 TCF.
Also keep in mind that as the Permian Basin peaks and declines (probably in 2026) associated gas from this play will also decrease, this will also occur in Bakken, Eagle Ford, Niobrara, and other tight oil plays. The resource that is profitable to produce is not unlimited and as prices increase in the US, LNG exporters may make little money.
Scenario with higher peak for shale gas
Associated dry gas from US tight oil plays forecast (based on tight oil scenario with GOR assumed to increase from 3.5 in 2020 to 5.3 MCF/bo in 2050.)
Thanks for another thorough post Ovi.
Schinzy
Thanks.
As I have mentioned in the past, these charts are like watching grass grow. However there is always that anticipation of: What will next month bring?
Thanks, Ovi:
Gas production was also at an all time high of 130 bCF/d, total withdrawals, up 3. And that is with AK flat (so not a gyration from differing reinject cycle).
LA was up 1 BCF/d on its own, which is pretty massive. 10% increase. And that is dry gas, being drilled for its own sake. I guess prices support it. Strip has prompt in high 3s and DEC25 is in high 4s. Also, clearly the Haynesville is not as “in decline” or as “mature” as the peak oil/gasers like David Hughes and Tad Patzek were saying over 10 years ago.
Marketed gas is the interesting number, this deducts gas reinjected, vented and flared gas, and non-hydrocarbon gas, this was also at an all time high of 117.8 BCF/d, up 2 BCF/d (1.7%) from previous high in Dec 2024. Dry Gas also at all time high at 107 BCF/d in March, about 79% of the US dry gas was from shale gas and tight oil associated gas in March 2025.
Nony/Dennis
Thanks for updating the NG story that is happening in the US. I always had the impression from articles in the past that NG was a nuisance to oil drillers. How times have changed.
Ovi,
In some cases the associated gas is a problem if there is no easy way to get it to market and in that case the oil producers prefer to flare the gas which seems a waste to many people. Often there is not enough pipeline capacity to transport the gas to LNG facilities or to other markets that need the gas (electric power plants, heating in the winter, fertilizer, petrochemicals, etc). In 2023 about 0.6% of gross withdrawals was vented or flared, 8% is reinjected with 83% of this reinjected gas occurring in Alaska, and 0.6% of grosswithdrawals is non hydrocarbon gas, and 7.4% of gross withdrawals gets extracted as NGPL. Dry gas was 83% of gross withdrawals in 2023 for all of US. If we look at L48 only (exclude Alaska) 89.1% of gross gas is dry gas and 1.5% of gas is reinjected, about 8% of gross gas is extracted as NGL, the remaining 1.4% of gross gas is a combination of non-hydrocarbon gas or is vented or flared (about a 50/50 split).
Ovi, gas is a nuisance if you don’t have pipes to market (often blocked by Democrats/environmentalists) AND you have restrictions on flaring. Because it literally limits development of the oil, which is (in an oil play) 80%+ of the value. So…yeah it’s a huge nuisance in that case. It’s a method for stopping production in that case.
Also, if you are looking at two streams of “BOE”, you want more oil and less gas percentage. This is because BOE accounting is equal in energy (BTUs), but the liquid product is easier to use/transport/store and safely power various engines. As well as being more suitable to chemical uses (it is very hard to do organic chemistry reactions on methane!) Thus despite being absolutely equal in BTUs, they are not equal in economic value. Similarly (but at a much lower amount), equal volumes of heavy oil is worth LESS than light sweet oil, despite the heavy oil having more BTUs. It’s not just about energy content…but economic value in applications.
If you can get it to market though, gas is OK…and even a benefit (it’s extra revenue). And of course there are wells (many in OK) that are sort of 50/50 in terms of value from oil and gas…or just in general need both the oil and gas to justify the drilling.
Also, in general (not always, depending on infrastructure bottlenecks) “rich” or “wet” gas is worth MORE than dry gas. NOT LESS! NGLs are a premium product compared to dry gas. It’s basically oil>NGL>gas in terms of the $ value of same unit of energy.
Also, within NGLs, the purity products are generally worth more the larger the molecules (can think of it as spectrum from dry gas to C&C). So C2 ethane is worth more than C1 (methane, dry gas). C3, propane is worth more than C2. C4, butane (normal and iso) are worth more than C3, with isobutane worth more then normal butane (the branch in iso is helpful in building higher octane molecules…basically “branching” gives better octane, for hydrocarbons. Pentanes plus (mostly c5 of 3 different isomers, but also some c6 and higher) is worth more than C4s. And pentanes actually are a (very high API) liquid stream–sometimes called “plant condensate”, although even higher API than lease condensates.
The U.S.
Makes a good deal of money selling Propane and Butane.
https://info.opisnet.com/hubfs/2024%20NGL%20Summit%20Presentations/OPIS%20NGL%20Summit%20Europe%20.pdf
Also price of NGLs and Natural Gas in the States is very low so exporting actually increases the price which in turn reduces flaring.
Loadsofoil,
I was referring to the export of liquified natural gas (LNG) rather than NGL (natural gas liquid) such as ethane. propane, or butane. You may have thought I mistyped. The flaring happens because there is inadequate pipeline capacity to move the gas to market, the price at WAHA in West Texas is usually much lower than at Henry Hub in Louisiana near the LNG export facilities on the Gulf Coast, often the spot price is close to zero due to lack of pipeline capacity.
Dennis
Yes but are companies not building pipelines to export gas and ngpl? Don’t they need pipelines for both?
https://www.eia.gov/todayinenergy/detail.php?id=62383
That’s why flaring is being reduced, Wyoming not doing so well.
https://www.eia.gov/todayinenergy/detail.php?id=64744
Texas and North Dacota reduced flaring by over half, better to sell it rather than flaring.
The pipelines increase the price of gas and ngpl so good all round.
Loadsofoil,
Yes pipelines are built, often not as fast as production increases, so in many cases there is a shortage of capacity. Also note that the pipelines are expensive and to get an adequate ROI you need to have a guarantee that the pipeline will be full for 20 to 30 years, sometimes this condition is difficult to meet.
I agree reducing flaring is a good policy, I also agree that more pipelines help, but if was a company investing in such infrastructure I would look carefully at resource estimates to make sure the pipe will be used long enough so I make some money on the project.
Dennis
Gas in America is far too cheap.
Your own coal should be used for power, and gas for cooking and heating.
https://www.eia.gov/energyexplained/coal/how-much-coal-is-left.php
Gas brings in vast amounts of money which you desperately need.
Loadsofoil,
Mostly the market allocates resources in the US. I disagree that using coal is a good idea, better to increase the use of wind, solar, batteries, hydro, geothermal and nuclear power, natural gas can be used as backup when the other 6 sources of power don’t produce enough to meet demand. That makes the most sense from a scientific perspective when the risks of climate change are taken into account.
Feel free to ramp up coal in the UK, you will find it is an expensive option.
Loadsofoil,
I agree natural gas, coal, and oil are all too cheap in the US. If I were in charge there would be a substantial federal carbon tax which could be used to reduce the deficit or could be returned to tax payers in a fee and dividend type program. Paper on such a program linked below (US focused).
https://csas.earth.columbia.edu/sites/csas.earth.columbia.edu/files/content/Fee-and-Dividend-Miller-Hansen-20191110-1.pdf
Like it or not, American LNG exports are poised to take off, and also to perform well into the future. The Haynesville/Bossier shale formations are thicker, stacked, and much more extensive than previously thought, not only extending along the strip of La. parishes along the Louisiana-Texas border and the three or four Texas border counties but also deeper into Texas: Leon, Robertson and Freestone counties. The Lower Bossier NG is deep and hot: oil would have been cooked. Comstock leased (cheaply, on the sly) roughly a million acres and they’re going to drill the snot out of it. This will all feed into the Gulf Coast LNG trains. It is going to be massive. So massive that it’s hard to conceive of an eventual peak of NG. Again, this is dry gas, not to be confused with associated gas that has been considered a by-product coming up with much shallower shale oil.
However, as has been mentioned repeatedly, there is more and more associated gas coming up with the shale oil as the GOR has increased dramatically in several areas of the Permian. Add that in and there is certainly going to be ample feedstock for the LNG trains for the foreseeable future. In fact, there will be so much that the price should be kept reasonable, a good thing for countries that are suffering energy poverty. I disagree with putting all this NG in some sort of populist trust for the future: there seems to be enough to go around and a world starved for energy is susceptible to chaos and affiliation with rogue nations.
I believe nuclear energy will become prevalent in the future, and SMR’s will be developed faster than is usually considered, but it’s going to be very difficult to compete with the vast amount of NG about to come through the Henry Hub. These deep Bossier wells are big suckers. It’s still sort of a shocker that they can drill in those temperature extremes and pressures safely but they’re developing a format, tweeking it here and there, and soon it will be commonplace to have these big wells coming online quickly. No one knows the extent of the productive interval of the Bossier quite yet. Heck, Bossier isn’t even a buzz word in energy circles. Yet.
Peak oil? Probably. Peak NG? Different animal.
Gerry,
I agree the LNG will continue to be exported. I dont think it is a good idea to build any new facilities beyond those that have started construction. If I were an investor I would stay far away from such projects as the resource is probably not as large as the very high estimates from the Colorado School of Mining. Probably a high risk/high reward scenario.
Sounds very much like the claims about the Permian, it was big, but not as big as many claimed. Perhaps you are correct, time will tell. Often the USGS over estimates resources, perhaps in this case they have underestimated. I am not a geophysicist, just use the data and reports available.
From Chat GPT:
economically recoverable resource from Haynesville /Bossier shale gas formation
ChatGPT said:
The economically recoverable resource from the Haynesville/Bossier shale gas formation depends heavily on natural gas prices, development costs, and technology assumptions. While technically recoverable resources (TRR) are often cited (~304 Tcf), the economically recoverable portion is always smaller and more sensitive to market conditions.
Key Estimates of Economically Recoverable Resources (ERR):
1. U.S. Energy Information Administration (EIA) – 2023 Reference Case (AEO 2023)
Economically Recoverable Resource (ERR) from Haynesville/Bossier:
At Henry Hub prices of $3–4/MMBtu, estimated ERR is roughly:
140–180 Tcf (mid-range estimate based on modeling output)
The EIA does not publish a single figure for ERR but uses price scenarios to model future production and recovery.
2. U.S. Geological Survey (USGS) – 2017
The USGS assesses technically recoverable resources, not reserves.
However, industry analysts often assume ~50–60% of TRR is economically recoverable at moderate prices.
So, economic recoverability at ~$3–$4/MMBtu may be in the 150–180 Tcf range.
3. Rystad Energy & Industry Sources (2021–2024)
Some operator-level economic break-even estimates suggest that:
~60–65% of Haynesville/Bossier TRR is economical at $2.75–$3.25/MMBtu.
This translates to ~180–200 Tcf under favorable development assumptions.
Summary Table:
Source Estimate Type Price Assumption Economically Recoverable Gas
EIA AEO 2023 Modeled ERR $3–4/MMBtu ~140–180 Tcf
Industry Rule of Thumb 50–65% of TRR $3–4/MMBtu ~150–200 Tcf
USGS (TRR only) N/A N/A 304 Tcf (TRR, not ERR)
Key Points:
Economically recoverable gas is context-specific — lower prices or tighter capital access reduce the viable volume.
Infrastructure, well spacing, and completion costs affect economic cutoffs.
High-productivity cores in the Louisiana portion of the Haynesville are more likely to be developed profitably.
At higher prices more of the resource is viable according to Chat GPT
Summary Table:
Price Scenario Estimated ERR % of TRR (304 Tcf)
$3.00/MMBtu 140–180 Tcf 45–60%
$5.00/MMBtu 230–260 Tcf 75–85%
$6.00/MMBtu 250–275 Tcf 80–90%
Note that for my scenario I use 200 TCF for Haynesville/Bossier, basically 67% of USGS mean TRR estimate, based on the info from Chat GPT it might correspond to natural gas prices in the $3-$5/MMBTU range.
D C,
there seems to be a forever lasting luck with LNG investors.
25 years ago, they were starting to build the largest LNG importing tank and gassification facility;
and 5 years later, the tanks finished, and gas price in US tanked to lower than international price;
and then they convert it to LNG export.
In China, there seems to be a concensus now that the Coal-Rock-Gas, or the shale gas in Coal, will be much larger and easier to produce than shale gas in China, and in 5 years it will be over 5BCFPD. If all opened up for “dill baby drill” like in US, in 5 years it could hit 10BCFPD and maybe even more.
In US, similar coal-rock-gas geology is everywhere, like in Appalachian especially. Just drill deeper tha 5~6K feet and frack like shale, and there are TCFs of gas.
Sheng wu,
Perhaps correct, but the question is economics, generally in the US if it is a profitable idea, it will be pursued.
Strange, the EIA website seems to be down, never have seen that before.
Maybe the cuts in staff are causing problems
https://www.propublica.org/article/the-latest-trump-and-doge-casualty-energy-data
Coal bed methane output for US BCF/d, used chat GPT because EIA website is down, only data through 2017 is available at present.
AEO 2025 forecast for US Coalbed methane
Mr. Maddoux,
I could not agree more wholeheartedly with everything that you just posted.
Those temperature/pressure numbers in the Deep Bossier are simply astounding.
This is where the technology developed/employed in operations like Chevron’s Anchor project will come to be utilized.
Along with this vast expansion of highly productive acreage in the Haynesville/Bossier is the virtually unreported ongoing stepping out of the Utica/Point Pleasant formation in Pennsylvania.
One well from CNX – the Bell Point BP6NHSU, east of Pittsburgh – has produced almost 12 Bcf (11.8) in under 11 months ON RESTRICTED CHOKE!!
For those more familiar with oil matters, this one well has produced the energy equivalent of more than 2 million barrels of earl in less than 11 months online.
Amazing.
When one couples the rich geology with ever-improving technology (Expand just averaged ~2,800 feet per day drilling a ~35 ,000 TMD well in West Virginia), one should easily recognize that the US has vast, vast amounts of inexpensive hydrocarbon resources in gaseous form.
No bout adoubt it.
12BCF in 11 months with restricted choke!!!
That’s 335 days with over 1 million cubic meter per day! Comparable to a conventional well in North Dome.
Sheng Wu,
Yes, very impressive production numbers.
Economics are exceptionally favorable as well.
The only other company targeting the Utica/Point Pleasant in Pennsylvania is Seneca … currently focusing on Tioga county, almost 200 miles northeast of that Bell Point pad.
Seneca brought online a 7 well Utica pad – the Bauer – 6 months back wherein all 7 wells are also on restricted choke. Daily pad flow rate is over 150 MMcfd (~26,000 bbld in oil energy equivalence). Tioga county has been (relatively) regarded as Tier 2 rock as it is no where near as overpressured as SWPA is.
The amount of gas to be extracted is near unfathomable.
Utica Dry Shale Gas trailing 12 month (TTM) average in BCF/d.
Kazakhstan must have hit an artery in February. They were up 254,000 barrels per day.
Data is through February 2025.
Ron,
This is due to upgrades in equipment at the Tengiz oil field see
https://oilprice.com/Latest-Energy-News/World-News/Chevron-Starts-Up-260000-Bpd-Expansion-at-Kazakhstans-Biggest-Oilfield.html
the expected increase is 260 kb/d. This is really pissing KSA off, my guess is that Kazakhstan will leave OPEC plus at some point unless their quota is raised.
Ron:
It’s probably megaproject related, in the Caspian Sea. So, yes, there can be these sudden increases when a new platform comes on.
Probably a good comparable is Guyana (sp?) which has had some months with very sharp (200,000 ) increases. That’s not a progressive drilling campaign, like in shale. It’s a tie-in of a whole block.
[I think.]
It’s a New Oil field in Kazakhstan, Tengiz
“Kazakhstan’s largest oilfield, Tengiz, has achieved first oil coming from newly built production and processing facilities, the US Chevron-led operator, Tengizchevroil, confirmed on Friday.” (My comment: January 24, 2025)
Production start-up marks the beginning of a gradual ramp-up of 3GP output over the coming months, which is expected to expand Tengiz’s oil production by an additional 262,000 barrels per day at full capacity, the operator said.
FGP is the third processing plant to be brought into operation at the Tengiz oilfield since the Chevron-led consortium took over the reins in 1993.”
In the January World and Non-OPEC report, crude production for Kazakhstan was posted. February crude was up 260 kb/d, similar to EIA’s C plus C, and March added another 40 kb/d for a total of 300 kb/d, January to March.
https://www.upstreamonline.com/field-development/giant-field-in-kazakhstan-sees-first-oil-from-newly-built-facilities/2-1-1769348
@Hickory,
In the last thread you posed a question about the ten ‘things that would enable us to keep national and personal economic activity rolling with much less fossil energy’.
I agree with your suggestion that it is relatively easy to create a list of 10 technical things like increased mass transit that would reduce fossil energy dependence. However, my single #1 item would be pricing that reflects the true costs of carbon and then let the market respond. If we all had to pay our fair share, behavior would change.
Fossil fuels emissions have real, harmful consequences. Think Hurricane Helene in North Carolina or the increasing destabilization of the US housing markets where insurance costs are accelerating or are just no longer available due to climate change risks.
It appears that the true cost of carbon is likely greater than $300/ton of CO2. That’s roughly $16/MMBtu of natural gas or $2.7/gal at the pump. And that is before the real ugly tipping points. What price would we put on shutdown of the AMOC and the end of agriculture in Europe?
Of course this type of true cost sharing hasn’t happened widely and won’t.
If carbon pricing was to be enacted it would have to be worked in very slowly. Would have been better 20-30 years ago, with the proceeds having been used for long term energy resiliency projects.
There is very little interest in being proactive on depletion, and global warming.
A little more so in countries that are energy importers.
It looks like we’ll deal with the repercussions primarily on an reactive emergency basis.
Rig Report for the Week Ending June 6
The rig count drop that started in early April 2024 when 450 rigs were operating, continues and hits a new low.
While the oil rig count is correct, the drop is not. Baker Hughes has recategorized the Oil rigs in Ohio to NG. So Ohio’s NG rigs have gone from 3 to 11 while the oil ones have gone from 8 to zero.
– US Hz oil rigs dropped by 17 to 409. Of the 17, 8 were from shifting the Ohio rigs NG. The correct hz oil rig drop for this week is 9, 18 lower than the previous July 24 low of 427. Note the 427 should really be 419.
– New Mexico rigs were down 1 to 80 while Texas dropped 5 rigs to 224, primarily from EF. Texas Permian dropped 2 to 184.
– In Texas, Midland and Martin were unchanged at 24 and 25 respectively.
– In New Mexico, Eddy was unchanged at 44 while Lea dropped 1 to 36. Lea is down 14 rigs from the end of February while Eddy is down 1.
– Eagle Ford dropped 5 to 32.
– NG Hz rigs were up 14 to 96 of which 8 were moved from oil to NG.
Frac Spread Report for the Week Ending June 6
The frac spread count dropped by 4 to 186 to where it was two weeks ago. It is also down 61 from one year ago and down 29 spreads since March 28.
Again, about Gulf of America production,
the numbers seem to be flat in the past year at 1.8MBOPD, and news says it could hit over 2.4 in 3 years
https://oilprice.com/Energy/Crude-Oil/US-Offshore-Oil-Production-Set-To-Jump.html
My guess is that the lower GOR in DEEP water GOA really help the production ramp up and improve the recovery based on PVT bubble point — lower bubble point with lower GOR and yet higher pressure with deeper depth.
D C, your last post about the projection for GOA is at the best 2.2MBOPD
https://peakoilbarrel.com/december-non-opec-and-world-oil-production-rose/#more-54683
The 2.4MBOPD if true will make the URR over 50GB for GOA OCS and over 30GB for GOA deep water.
Sheng Wu,
I defer to experts for GOM output like Bob Meltz (aka SouthLaGeo) and George Kaplan.
https://peakoilbarrel.com/update-on-the-wilcox-in-the-offshore-northern-gulf-of-mexico/
https://peakoilbarrel.com/gulf-of-mexico-update/
https://peakoilbarrel.com/gom-summary-part-v-possible-futures/
D C,
Thanks for the links, just looked into the one by George Kaplan,
Even George suspect more gas might help the production, and ultra-deep fields with lower gas might not help. George also mentioned EIA give higher URR numbers probably is a result of higher recovery (“Just small changes in the recovery factor results in a significant change in reserves”) for deep and ultra-deep fields.
Also, I see the figure here seems to give ultra-deep faster decline,
https://peakoilbarrel.com/wp-content/uploads/2020/10/GOMProj005-1.png
This lower GOR oil might actually help production/recovery is really against intuition, and it was not fully understood until 1 century ago, when Standard Oil and AIP sponsored the research of PVT and phase flow of oil, gas and water.
https://calteches.library.caltech.edu/2580/1/37.pdf
https://calteches.library.caltech.edu/1338/1/Project37.pdf
This PVT-bubble point model is now widely accepted, but there is still huge huddle for most to easily accept that a lower GOR oil with higher viscosity and lower API (higher density) could actually produce better and recover more than higher GOR oil.
Gas or coal power stations or wind solar and importantly storage.
European costs tell us a lot
https://ec.europa.eu/eurostat/statistics-explained/index.php?title=Electricity_price_statistics
The countries with the highest levels of wind and solar have the highest costs €400 per megawatt.
The taxes are to pay for all the new infrastructure that wind and solar require.
China burns the most coal in the world, this year it will burn 4.9 billion tonnes, as much as the U.K. in the last 60 years, or the next 400 years. There goes any hope of preventing climate catastrophe.
Is Dennis correct to say coal is expensive?
China electricity price.
https://www.china-briefing.com/news/chinas-industrial-power-rates-category-electricity-usage-region-classification/
$88 per megawatt hour.
Costs of wind and storage, after 20 years of hearing that they are getting cheaper.
https://www.lazard.com/media/xemfey0k/lazards-lcoeplus-june-2024-_vf.pdf
To ensure a safe and reliable supply you are looking at $250 to $500 per megawatt hour.
Funny we usually end up paying the high end of projected costs. If you keep gas power stations as backup as we have they are very expensive to maintain and run at fraction of their intended output.
Does not take an economist to work out why Chinese steel companies and factories are winning when their power costs are a fraction of ours.
the west extremists/idealogists had some worst ill-planned schemes for the energy transitions.
They never had a plan a fraction as decent as the CCP government did in China or the solar transition market in Pakistan or Saudi.
They never bother to do a detailed accounting for the cost of energy like Dennis here did for projection of oil and gas productions.
The result of this ill-planned energy transition is out-of-control inflation, unreliable energy and electricity. like what Steve Miller the right-extremists here pointed out,
https://www.youtube.com/watch?v=b6N6CdF2ZE8
China only started massive solar and wind deployment in the past 6~8 years, and only after have some sort of cost-effective storage and transport solutions. China did all these only when the cost of coal and FF keeps going up fast and cost of wind and solar drops to a break-even point for majority of customers and suppliers.
At the end first quarter 2025 in China, total capacity of wind and solar installations at 1.483Peta Watt, already higher than coal fired installations at 1.451Peta Watt.
Total wind and solar electricity now at 22.5% or 4.3% higher than last year; and non FF electricity at 39.8% or 4.8% higher than last year.
US average industrial power rates according to Chat GPT
Question for Chat GPT:
US industrial electric power average cost in 2024?
ChatGPT said:
In 2024, the average retail price of electricity for the U.S. industrial sector was approximately 8.01 cents per kilowatt-hour (kWh). This figure reflects a modest increase from the previous year, indicating a 5.51% rise compared to 2023 .
So $80.1/ MWH average industrial power cost for the US, less than the China cost you cited.
The rates vary by region, Texas has some of the highest penetrations of wind and solar power in the US.
I asked Chat GPT:
Average industrial electric power costs in Texas in 2024?
ChatGPT said:
In 2024, the average industrial electricity price in Texas was approximately 5.83 cents per kilowatt-hour (kWh), as reported by the U.S. Energy Information Administration (EIA) for March 2024 . This rate is notably lower than the national industrial average of 8.01 cents per kWh for the same period.
eia.gov
Texas’s lower industrial electricity rates can be attributed to several factors:
Deregulated Electricity Market: Texas operates a deregulated electricity market, allowing industrial consumers to choose from multiple electricity providers, fostering competitive pricing.
Abundant Natural Gas Supply: The state’s substantial natural gas resources contribute to lower energy production costs, benefiting industrial electricity rates.
Growing Renewable Energy Sector: Texas has seen significant growth in renewable energy sources, particularly solar and wind, which can lead to more stable and potentially lower electricity prices .
However, it’s important to note that electricity rates can vary based on specific utility providers and the structure of individual contracts. For instance, Entergy Texas offers various rate schedules and riders that may affect the final cost for industrial consumers .
So for Texas the average electric power rate is $58.30/MWh.
Dennis
How can a source which is totally dependent on factors you can’t control be reliable.
Posted on this website was an essay by an electrical grid engineer who said, wind and solar are driving up costs and instability. Electricity being dumped causing all sorts of issues.
https://www.electricrate.com/top-electricity-generation-sources-in-texas/
Texas has access to vast amounts of gas which is so cheap it is a quarter the price uk gas was at our peak of production. Cheap coal, reliable delivering electricity exactly when it’s needed.
https://oilprice.com/Latest-Energy-News/World-News/Trumps-Coal-Comeback-Goes-Global.html
You may not like Trump but he knows a good deal and you don’t.
U.S. and China burning vast amounts of cheap gas and coal. Our expensive wind and solar is killing our industries.
India aims to burn 1.6 billion tonnes of cheap coal to provide stable electricity at prices people can afford. If wind and solar are less than 30% the costs are not too bad. Once you get to German level or Netherland levels you have €400 per megawatt hour. Against China and India not a chance.
it’s true that subsidies to solar and wind are not counted in cost, and not to mention the cost to back them up with battery, transfer grids and FF power plants.
This inherently low cost property of coal is vital for industrialization, from UK 200 years ago, to Germany and US later, along with iron ores.
South america countries like Brazil and Argentina failed a more complete industrialization because they lack cheap and vast amount of coal mines.
Loadsofoil,
US average electricity rate is less than China, that’s the main point. Texas produced the most electric power from wind and solar combined of any US state, yes Texas has cheap natural gas and the US in general, it is sometimes cheaper than coal.
Using several different types of electric power is probably the best approach. Trump does not understand climate science, ignoring the future problems that will be caused by rising carbon dioxide levels in the atmosphere is a bit like ignoring increasing debt, it is a cost that will be imposed on future generations. Costs today should not be the only factor considered, future costs should also be taken into account in my opinion.