By Ovi
All of the Crude plus Condensate (C + C) production data for the US state charts comes from the EIAʼs Petroleum Supply monthly PSM which provides updated production information up to August 2025.

U.S. August oil production increased by 86 kb/d to 13,794 kb/d, another new high. Note that July was revised up by 66 kb/d from 13,642 kb/d to 13,708 kb/d for a combined increase of 152 kb/d. The largest increases did not come from the usual suspects but rather came from Alaska and the GOM. The October STEO prediction for August production was 13,712 kb/d vs reported 13,794 kb/d, an 84 kb/d miss.
The dark blue graph, taken from the October 2025 STEO, is the U.S. oil production forecast from September 2025 to December 2026. Output for December 2026 is expected to drop to 13,514 kb/d. From August 2025 to December 2026 U.S. oil production is expected to drop by 280 kb/d.
The light blue graph is the STEO’s projection for Onshore L48 output to December 2026. August’s Onshore L48 production dropped by 11 kb/d to 11,428 kb/d. From August 2025 to December 2026 production is expected to decrease by 403 kb/d to 11,025 kb/d.
Note that the small August drop in the Onshore L48 was due to very small gains and losses in NM and Texas respectively, almost rounding errors.
U.S. Oil Production Ranked by State

Listed above are the 10 US states with the largest oil production along with the Gulf of Mexico.
These 10 states accounted for 83% of all U.S. oil production out of a total production of 13,794 kb/d in August 2025. On a MoM basis, August oil production in these 10 states rose by 67 kb/d. On a YoY basis, US production increased by 383 kb/d with the biggest contributors being New Mexico and Ohio.
State Oil Production Charts

August’s production decreased by 9 kb/d to 5,840 kb/d according to the EIA.
Texas production has rebounded since the weather related January 2025 drop. August’s production is essentially the same October 2024. The point to note here is both the production projection and the EIA’s production are going in the same direction from January 2024 to July 2025. However for August the projection deviates from the EIA because last month’s July production was too low which affects the August projection by making it too optimistic..
The red graph is a production projection using the July and August Texas RRC data. The projection trend follows the EIA’s production up to July but not for August. The projection is higher starting in March 2025 because of the cumulative effects of the MoM production increases starting in January 2024.
The blue graph shows the average number of weekly rigs reported for each month shifted forward by 10 months. So the 276 rigs operating in July 2023 have been shifted forward to May 2024. From February 2024 to July 2024, the rig count dropped from 312 in time shifted February 2024 to 256 in July 2024. That drop of 56 rigs had no impact on production up to October 2024 but November was the first month when the impact of the rig drop on oil production started to show up along with fewer completions.
The rising production after January 2025 is difficult to explain considering the continuing drop in the rig count.

According to the EIA, New Mexico’s August production rose by 13 kb/d to 2,297 kb/d, a new high. YoY production rose by 229 kb/d, the biggest contributor to rising US production.
The orange graph is August’s preliminary oil production provided by the New Mexico Oil Conservation Division (OCD). The blue graph is the projected output for August. The production projection of 2,279 kb/d adds 73 kb/d to the OCD’s preliminary production. The 73 kb/d increment is due to the under reporting of July production. Lea county accounts for 50 kb/d of the increase and is discussed further in the Permian section below.

August’s output dropped by 9 kb/d to 1,167 kb/d. Production is down 120 kb/d from the post pandemic peak of 1,287 kb/d.
The North Dakota Department of Mineral resources reported August production dropped by 11 kb/d to 1,153 kb/d, which is close to the EIA’s estimate.
According to this Article, more than two unit trains leave ND daily and are headed for the Pacific North West.
“We’ve gone from a pretty steady period of roughly two unit trains per day leaving the Williston Basin loaded,” said State Pipeline director Justin Kringstad. “We’re not quite at three, but probably north of two and a half unit trains of oil loaded per day. That’s somewhere in that 180 to 190-thousand barrels per day.”
Kringstad says that oil is headed toward the Pacific Northwest.
“They’ve got a very strong appetite for light sweet barrels,” Kringstad said. “That Bakken barrel works well.”
Kringstad said there is rail connectivity towards those facilities.
“I don’t think we’re going to see major shifts,” Kringstad said. “It could grow. But at this time, it’s been relatively steady now for several months, and that 180,000 barrel per day range.”

Alaskaʼs August output rose by 30 kb/d to 387 kb/d while YoY production decreased by 9 kb/d. The EIA’s weekly July reports indicated that August production would rise and would average close to 365 kb/d.
Alaska has recently brought new fields online to consistently have flat YoY and monthly production gains which have broken away from the earlier dropping production red trend lines.
In early 2026 the Alaska Picca field is expected to come online. At its peak, Pikka could produce up to 80 Mb/d from 45 wells. The production expected from these projects may be enough to flip Alaska oil production into a steady growth period.

Coloradoʼs August oil production dropped by 1 kb/d to 465 kb/d.
The biggest oil producing county in Colorado is Weld County and its production has been added to the chart. The two graphs have been almost parallel since January 2024 but diverged over the last two months. Weld’s production rose by 11 kb/d in August to 385 kb/d.
Colorado began 2025 with 6 rigs in January and February and then dropped to 5 in March/April/May. In October the average weekly rig count rose to 11.

Oklahoma’s output in August rose by 6 kb/d to 401 kb/d. Production remains below the post pandemic July 2020 high of 491 kb/d and is down by 52 kb/d since May 2023. Output entered a slow declining phase in June 2023 and now appears to be range bound around 400 kb/d ± 20 kb/d.
In May Oklahoma had 51 operational rigs. However by July the number had dropped to 41. In October 39 rigs were operating.

California’s overall declining production trend continues. August’s production dropped by 2 kb/d to 253 kb/d, a new low. YoY production dropped by 54 kb/d. The mid 2023 Spike is new as of July.

Wyoming’s oil production reached a post pandemic high in February 2024 and appears to have entered a plateau phase around 295 kb/d. August’s production dropped by 3 kb/d to 296 kb/d.
At the beginning of 2025 Wyoming had 14 operational rigs and they rose to 15 in May and June. The rig count In September and October dropped to 8..

August’s production was flat at 187 kb/d. Utah had 8 rigs operating from October 2024 through May 2025 but dropped to 6 in early June but returned to 8 in September and 9 in October

Ohio’s August oil production increased by 3 kb/d to 155 kb/d. The last Baker Hughes rig report shows no oil rigs operating in Ohio. They were all re-classified to NG rigs. In late October Ohio had 11 NG rigs operating and an oil rig was added for a total of 1.

GOM production rose by 67 kb/d in August to 1,979 kb/d. September’s production is projected to increase by further 14 kb/d to 1,993 kb/d.
The October 2025 STEO GOM projection has been added to this chart. It projects production in December 2026 will be 10 kb/d higher than August 2025 at 1,989 kb/d.
A Different Perspective on US Oil Production

Combined oil output for the Big Two states Texas and New Mexico.
August’s production in the Big Two states increased by a combined 4 kb/d to 8,137 kb/d, a new high. Clearly these two states were the drivers of US oil production growth up to October 2024. The rising trend had slowed since October 2024 but re-emerged in July.

Oil Production by The Rest
August’s oil production by The Rest dropped by 15 kb/d to 3,291 kb/d and is 195 kb/d lower than November 2023.
Permian Basin Report for Main Counties and a District
This special monthly Permian section was added to the US report because of a range of views on whether Permian production will continue to grow or will peak over the next year or two. The issue was brought into focus many months back by two Goehring and Rozencwajg Reports and Report2 which indicated that a few of the biggest Permian oil producing counties were close to peaking or past peak.
A more recent report was issued and can be reviewed Here. In this report they state:
“For years now, we have outlined with what we hoped was clarity, and what we now submit was prescience, the view that U.S. shale oil, that great source of modern supply, could not grow forever. It would mature, crest, and begin its long descent. That moment, by our models and measures, has arrived: shale has plateaued, and 2024 appears to be its high-water mark. And yet, investor sentiment has scarcely been more downbeat.”
This section will focus on the four largest oil producing counties in the Permian, Lea, Eddy, Midland and Martin. It will track the oil and natural gas production and the associated Gas Oil Ratio (GOR) on a monthly basis. The data is taken from the state’s government agencies for Texas and New Mexico. Typically the data for the latest two or three months is not complete and is revised upward as companies submit their updated information. Note the natural gas production shown in the charts that is used to calculate the GOR is the gas coming from both the gas and oil wells.
Of particular interest will be the charts which plot oil production vs GOR for a county to see if a particular characteristic develops that indicates the field is close to entering or in the bubble point phase. While the GOR metric is best suited for characterizing individual wells, counties with closely spaced horizontal wells may display a behaviour similar to individual wells due to pressure cross talking . For further information on the bubble point and GOR, there are a few good thoughts on the intricacies of the GOR in an earlier POB comment and here. Also check this EIA topic on GOR.
New Mexico Permian

The rig counts in Lea and Eddy county have started to move in opposite directions but appear to be stabilizing at new levels.. However the overall total rig count in Lea and Eddy counties has remained close to 92 for the month of October, an increase of 10 over September and essentially back to where it was in January 2025..
Eddy county rigs have dropped below 40 since July and have averaged close to 37 rigs in October. Lea county added 10 rigs in October to 55. What is driving the increased drilling activity in Lea County?
New Mexico Permian

Lea County’s oil production started its plateau phase in April 2024 at 1,201 kb/d and the plateau continues to July 2025. However August’s projected production rose to a new high of 1,259 kb/d by adding 50 kb/d. I think this projection is over optimistic because last month’s July oil production was under reported at 1,146 kb/d which in turn over projects the August projection. A more realistic projection for August would be 1,235 kb/d essentially breaking the plateau trend if confirmed in September.
Last month I had the impression that Lea county was on the verge of entering a slowly declining phase. However after looking at this month’s data showing very flat production from April 2024 to July 2025, one cannot infer/see a start to slowing production. In this piece at oilystuff, the author reports on a Novi Labs article that states “Delaware’s rock quality story is far from over, with Tier 2 offering a vast, underdeveloped opportunity”. A surprising report after seeing many articles along with the STEO predicting a peak in production in the next few months. It should also be noted that recently more rigs have moved into Lea county, even though the price of oil continues in the low $60s/b range and the results of this new drilling will not be known for at least 6 months. Something surprising may be happening in Lea County.
Preliminary August data from New Mexico’s Oil Conservation Division (OCD) indicates Lea County’s oil production rose by 5 kb/d to 1,197 kb/d, green graph. A rise is very surprising since a drop is more typical.
The blue graph shows the average number of weekly rigs operating during a given month as taken from the weekly rig data. The rig graph has been shifted forward by 8 months. So the 64 Rigs/wk operating in August 2023 have been time shifted forward to April 2024 to show the possible correlation and time delay between rig count, completion and oil production.
Note that rig counts are being used to project production as opposed to completions because state completion data is not available. However completion data from the Drilling Productivity report below indicates that extra DUCs are being completed in the Permian at this time.

After much zigging and zagging, oil production in Lea county stabilized just below 1,100 kb/d in early 2023. Once production reached a new high in January 2023, production appeared to be on a plateau while the GOR started to increase rapidly to the right and first entered the bubble point phase in July 2023.
Since July 2023 Lea County’s production continued to increase as the GOR remained within a second semi-bounded region. This may indicate that additional production was coming from an oilier part of a layer since the GOR’s behaviour since August 2023 to March 2024 time frame appears once again to be in a second semi bounded GOR phase accompanied with rising production.
The GOR moved out of the second semi-bounded GOR region in April 2024 as production hit a new high of 1,201 kb/d. From July 2024 to May 2025 the GOR was range bound between 3.35 and 3.45 but June’s, July’s and August’s GORs hit new highs. August’s GOR was 3.73 while preliminary production increased. Note that while August’s GOR of 3.73 is a new high, July’s preliminary estimate from last month was revised down from 3.87 to 3.69 in the August report.
This zigging and zagging GOR pattern within a semi-bounded GOR while oil production increases to some stable level and then moves out to a higher GOR to the right has shown up in a number of counties. See a few additional cases below. The rising GOR to new highs in Lea county is an indicator that production may be close to entering a declining phase even though the August projection does not confirm this.

August’s projected oil production increased by 20 kb/d to 972 kb/d, a new high while preliminary production from the NM OCD increased by 4 kb/d to 949 kb/d. Eddy county’s month over month production updates are very few and small and primarily occur in the last three or four months which indicates their preliminary production is very close to final. This month the updates/revisions were a bit larger than normal. While the July and August projected production increases are real, they may be slightly optimistic. The rising production could be linked to the increasing rig count starting in time shifted July 2025.
The blue graph shows the average number of weekly rigs operating during a given month as taken from the above weekly drilling chart. The rig graph has been shifted forward by 8 months to roughly coincide with the increase in the production graph starting in November 2023.
Clearly the production rise up to November 2024 is closely associated with the rise in the rig count and associated well completions delayed by roughly eight months.

The Eddy county GOR pattern is similar to Lea county except that Eddy broke out from the first semi bounded range earlier and then added a second wider semi-bounded GOR phase. For August New Mexico’s Oil Conservation Division (OCD) reported preliminary oil production increased by 4 kb/d to 949 kb/d while the GOR rose and remained within the second Semi-Bounded GOR range.
Texas Permian

The rig count in both Midland and Martin counties started to drop in early August but have recovered from their October lows.
The Midland county rig count dropped to 17 rigs at the end of July. From late September to late October, 4 rigs were added to Midland county.
Martin county’s rig count has been slowly dropping since March 7 high of 29 rigs. July and August saw continuing drops. In mid October the rig count rose to 20 but dropped back to 18 rigs in the last week.
Oil Production in Texas Counties

For comparison. July’s Midland County chart

August’s projected production rose by 7 kb/d to 710kb/d. However I think August’s projected production looks optimistic because of production revisions starting in June 2024. August’s increment of 7 kb/d appears to be reasonable. I think a more realistic production projection for July and August is in the 680 kb/d to 690 kb/d range. Projected production for September to November may see an increase associated with the rising rig count starting in time shifted August 2025.
The impact of the monthly revisions starting in June 2024 on August’s projected production can be seen by comparing it with the comparison July chart above. A more realistic projection for August production is 680 kb/d and that Midland county at best may be on a plateau.
The orange and green graphs show oil production for Midland County as reported by the Texas RRC for July and August. The red graph uses the July and August data to project production as it would look after being updated over many months.
The blue graph shows the average number of weekly rigs operating during a given month as taken from the weekly drilling chart. The rig graph has been shifted forward by 12 months to better align with production. So the average 34.5 Rigs/wk operating in July 2023 have been moved forward to July 2024 to show the possible correlation and time delay between rig count, completions and oil production.
The 12 month rig time shift is much larger than the typical six to eight months used in other counties. It is not clear why there should be such a difference. If the twelve month shift in the rig count is approximately correct in that oil production can be tied to the rig count, oil production in Midland county should continue falling up to July 2025. The preliminary production fell but the projection didn’t.

For August the Midland GOR ratio rose to 4.38 from 4.32 in July while reported preliminary oil production dropped by 15 kb/d to 588 kb/d.
With Midland county into the bubble point phase, oil production and the GOR stayed within a narrow range outside of the initial Semi-Bounded GOR region from March 2024 to March 2025. However the April to August 2025 GORs have broken out to new highs.
The oil production and GOR data shown in this chart are based on the RRC’s August production report. Note that while the last few months are subject to revisions, the January 2024 to May 2024 production data has been steady for a number of months.

For Comparison: July’s Martin County chart.

Martin county’s projected August oil production rose by 2 kb/d to 679 kb/d.
The August preliminary production data along with the MoM updates are reasonable. In the comparison chart above, production revisions started in March 2024 and raised the July 2025 production but did not affect the production trend for the last 4 months. For the current August chart, the revisions start in June 2024 and are small. The projected production increase starting January 2025 is real but then peaks in April before starting a new declining trend. The more significant part of the projection is the last four months which shows production fell by 35 kb/d from 714 kb/d in April to 679 kb/d August. Note how April 2025 was revised down from 739 kb/d in the comparison chart to 714 kb/d in the current chart.
Martin County appears to be in a plateau phase that started in April 2024.
The red graph is a projection for oil production as it would look after being updated over many months. This projection is based on a methodology that uses preliminary July and August production data. The green graph shows the preliminary oil production reported by the Texas RRC for August. Production since May might have begun to track the time shifted rig chart.
The orange and green graphs show production for Martin County as reported by the Texas RRC for July and August. The blue rig graph time shifts the rig count ahead by 6 months.

Martin county’s oil production after November 2022 increased and at the same time drifted to slightly higher GORs within the semi bounded range. However the June 2024 GOR saw its first move out of the semi bounded region. The RRC’s preliminary August 2025 production for Martin County shows an 18 kb/d decrease in production accompanied by a pull back in the GOR to 3.04.
Martin county has the lowest semi-bounded GOR boundary of the four counties at a GOR of close to 2.50. The GOR is now clearly out of the semi-bounded region. Martin County has now entered the bubble point phase that should result in oil production possibly entering a slowly declining plateau phase.

This chart shows the total oil production from the four largest Permian counties. Assuming current Permian production is close to 6,400 kb/d, these four counties account for 57% of the total. August’s projected production increased by 82 kb/d to 3,621 kb/d and is the fourth consecutive month showing increasing production.
The rising production is the result of rising production in Lea, Eddy and Midland counties. As noted above, production in Lea and Midland counties for the last few months is a bit optimistic and a more likely scenario is that production from these four counties is in a plateau phase closer to the 3,530 kb/d.
The July and August initial production data are shown in the orange and green graphs respectively. The red graph uses the July and Jul August production data to project a more realistic estimate for the final updated August production.
Findings
– The preliminary August production data for New Mexico and Texas had MoM revisions that resulted in slightly optimistic projections.
– Lea county entered its plateau phase in May 2024. While oil production is not following the rig count graph directly, the dropping rig count is resulting in Lea production currently being in a steady flat plateau phase up to July. However August had a 50 kb/d production increase which as noted above may be slightly optimistic.
– Eddy county’s production hit a new high in March 2025 but had a big drop in April while July and August saw an increase, possibly signalling the beginning of a plateau phase at a higher production level.
– While Midland county’s production in previous reports showed decreasing production after November 2024, August’s projected production increase may not be real since it may be associated with under reporting of last month’s July production. August’s projected production looks optimistic because of production revisions starting in June 2025. The addition of six new rigs to Midland county in real August 2025 to 24 is an unexpected surprise and makes one wonder what it implies going forward.
– Martin County appears to be in a plateau phase that started in April 2024.
Texas District 8

The District 8 production chart is showing rising production. However due to revisions to last month’s production all the way back to January 2024, the projection is optimistic. A more realistic production level for April to July production is 3,700 kb/d.
August saw an increase of 48 kb/d to 3,831 kb/d.

Plotting an oil production vs GOR graph for a district may be a bit of a stretch. Regardless here it is and it seems to indicate many District 8 counties may well be into the bubble point as the August GOR increased slightly to a record 4.54.
Oil Production and GOR Charts for Three of the Next Larger Texas Oil Counties
The Texas RRCs August production data has revisions back to January 2024 that result in optimistic projections..


August’s projected oil production for Reeves county rose by 10 kb/d to 588 kb/d. The production projection is reasonably close up to February 2025 but too optimistic after that. A more realistic August projection would be closer to 540 kb/d or lower. I think that Reeves is in its plateau phase around 540 kb/d and possibly lower due to the falling rig count. Reeves county is ranked as #3 for oil production in Texas, after Midland and Martin counties.
The GOR chart indicates Reeves County initially entered the bubble point phase in January 2025 and then reversed back into the Semi-Bounded region. August’s GOR is 7.43 and is at a record high. The May 2025 GOR was a definite breakout from the Semi-Bounded region.
Reeves county GOR is high because it is the number one Texas county ranked by gas production. The current C + C production is equally split between crude and condensate.
The rig count is time shifted forward by 7 months.
In Real June, 29 rigs were operational in Reeves. By late October the rig count had dropped to 18.


Loving’s projected production rose by 11 kb/d to 502 kb/d in August. Its production first peaked at 505 kb/d in November 2024, when it entered its plateau phase. For August the GOR increased to 4.24, a new high. The rig count has been time shifted forward by 8 months.
While Loving had 19 operational rigs in real June, they jumped by 3 to 22 in real September and dropped to 19 in October. Loving has had roughly 20 rigs operating all year.


Upton County entered its plateau phase in September 2024. August’s projected production dropped by 5 kb/d to 303 kb/d. Upton’s oil production may be on the verge of entering the bubble phase as of August as the GOR barely moved out of the Semi-Bounded region. Upton’s rig chart has been time shifted forward by six months.
Upton began the year with 13 rigs. In real September, 17 rigs were operating.
Drilling Productivity Report
The Drilling Productivity Report (DPR) uses recent data on the total number of drilling rigs in operation along with estimates of drilling productivity and estimated changes in production from existing oil wells to provide estimated changes in oil production for the principal tight oil regions. The new DPR report in the STEO provides production up to August 2025. The report also projects output to December 2026 for a number of basins. The DUC charts and Drilled Wells charts are also updated to September 2025.

The EIA’s September STEO/DPR report shows Permian August output dropped by 8 kb/d to 6,613 kb/d. SEptemerb is expected to drop by 6 kb/d to 6.607 kb/d. From September 2025 to December 2026 output is expected to drop by 236 kb/d to 6,371 kb/d. Note that December 2026 production has been revised down by 43 kb/d from 6,414 kb/d to 6,371 kb/d.
Production from new wells and legacy decline, right scale, have been added to this chart to show the difference between new production and legacy decline.

August’s output in the Eagle Ford basin increased by 2 kb/d to 1,097 kb/d. September’s 2025 production is forecast to drop by 1 kb/d to 1,097 kb/d.
Output in December 2026 expected to be 1,082 kb/d, a decrease of 17 kb/d from the previous report of 1,099 kb/d.

The DPR/STEO reported that Bakken August output dropped by 6 kb/d to 1,190 kb/d. September production is expected to increase by 7 kb/d to 1,197 kb/d. The STEO/DPR projection, red markers, shows output rising up to January 2025 before dropping to 1,185 kb/d in December 2026.

This chart plots the combined production from the three main LTO regions. For August output decreased by 12 kb/d to 8,900 kb/d. Production for December 2026 is forecast to be 8,638 kb/d, a downward revision of 43 kb/d from the previous report.
DUCs and Drilled Wells

The number of DUCs available for completion in the Permian and the three major DPR regions has returned to a dropping trend. September’s DUC count for the three basins dropped by 30 to 1,554. In the Permian the DUC count dropped by 22 to 956.

In the three primary regions, a total of 619 wells were completed in September, one more than in August.. There were 589 wells drilled in September, 3 more than in August. For comparison, In January 2023, 722 wells were drilled.
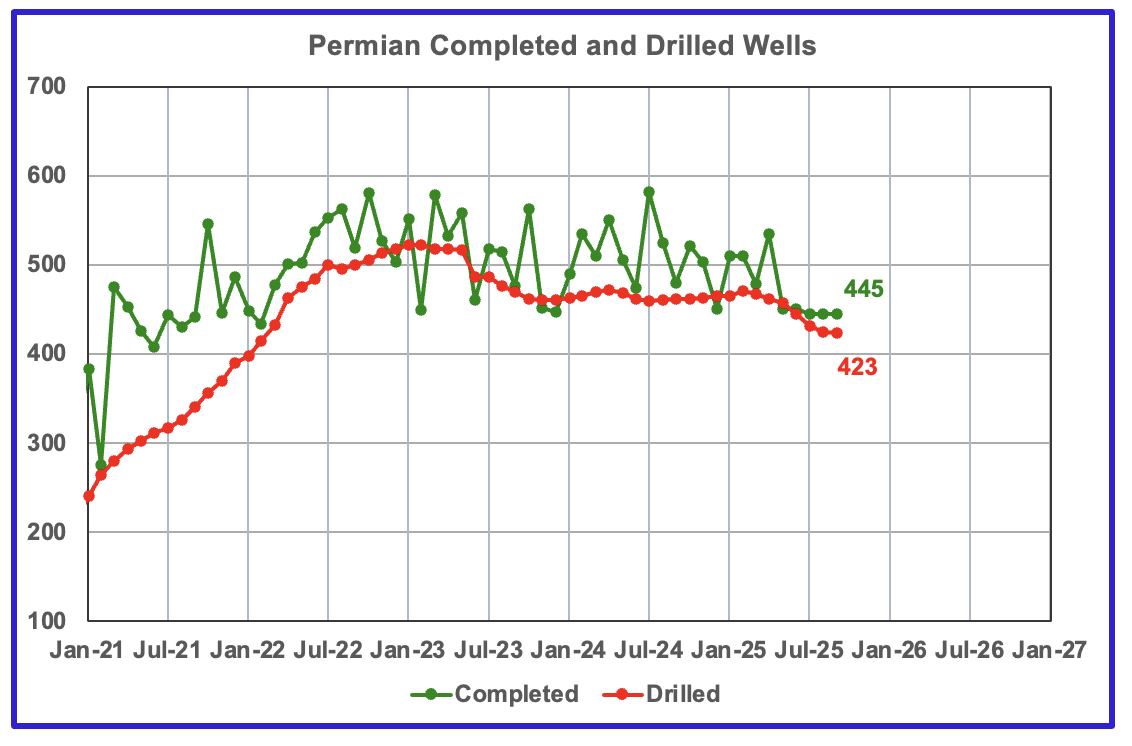
In the Permian, the monthly drilling rates have stabilized at 445 for the last 3 months.
In September 2025, 445 wells were completed and 423 new wells were drilled. This is the seventh month in a row in which the number wells drilled has dropped
129 responses to “US August Oil Production New High”
https://www.nytimes.com/2025/11/01/world/africa/trump-nigeria-military.html
Trump threatens to attack Nigeria.
Nigeria has significant oil potential, but is hampered by tribalism and piracy.
General Jim Mattis was Trump’s first Secretary of Defense and organised the US Military Peak Oil 2015 paper (google it).
Trump would see this as a way to make money!!!!!!
Venezuela and Nigeria!!!!! OIL
I can’t find a 2015 report. Closest I find is the Joint Operating Environment 2010 report which included a foreword by General Mattis.
Survival,
You are correct. It was 2010.
The highlight was that peak oil would be 2015. But if you read the report they said “might be” and likely by 2018.
But they didn’t say oil would go into permanent decline.
They also predicted a pandemic was coming (Covid?)
It is actually quite a high quality report.
My point again is this guy was having meetings with Trump as his advisor on military…
do you think he forgot to mention this?
now look at how Trump is behaving $$$$$$
Trump is smart enough to know people depend on oil and it would be hugely profitable for him if he can cut deals with the oil producers or some other scam
Trump sold a version of the Bible (Pro-Trump), that his staff edited for profit..
This grifter is all about making money for himself
https://www.youtube.com/watch?v=RSt1donzX58
Former US General.
If this was about “narco terrorists” the coast guard would be used.
This is about the flow of oil.
His words not mine….”Deeply Concerning”
The lives of 1000s of Christians must mean nothing to you.
Ervin,
I never said I didn’t care about human suffering.
There are human rights abuses all around the world.
What about the child slave labor in the Congo so we can get cobalt for our Iphones?
Why are only countries with oil being targeted?
“ Mr. Trump has already targeted American aid work around the world, working to dismantle the U.S. Agency for International Development, which has long been central to distributing foreign aid. Nigeria has been a major recipient of U.S. global health funding, relying on it for about 21 percent of its national health budget.”
People of all religions in Africa have often been left unprotected by the US historically, but it has tried to help, even if unevenly. Now we have a total abdication under Trump.
The fact that he has made it transparently clear that he cares only about white and Christian lives throws the blackest mud on the US’ reputation.
So shameful. So embarrassing.
Trump has done so much damage to US political, moral and economic leadership in the world – so much damage in so little time. Russian and Chinese nationalists are rejoicing. American nationalists seem to be delusional in their faith in Trump.
“The lives of 1000s of Christians must mean nothing to you.”
For the Epsteinth time, I care deeply about 1000’s of Nigerian Christian’s. Always have. Always will.
https://www.msn.com/en-us/news/world/putin-ally-floats-sending-venezuela-nuclear-capable-missiles-to-deter-us/ar-AA1PO1xT
Putin floats sending nuclear capable hypersonic missiles to Venezuela.
“Narco Terrorists”?????
Hi gang, Sorry I haven’t posted for a while, but I have had other things on my mind.
I have a new book out. Actually, it came out in June buy I have been busy triying to promote it. I have had some success but not a lot. The title is Blind to the Blatantly Obvious
I am gibing a FREE copy of the book to anyone on this list who might like it. It will be a digital copy, in Word format. You do not need Word or Microsoft Office to read a word flli, just a computer and email address. Post me at [email protected] and I will post your copy post haste. Then, after you have read it, you can post me at that email address and tell me what you thought of it.
I have a new website also. It is RonOPatterson.com Not t lot there yet but I will be posting articles and perhaps a video in a few moonths.
Bought a Kindle version for me. Buying a paperback for my Dad.
I’ve been following Ron since Oil Drum days ( Darwinian )…
Love his thinking style and his first two books were good too…
Thanks Andre, I do appreciate that kind review. And thanks also for the book purchases. But my first two books, I think, were not that good. In fact the first four were, in my opinion awful. But I am proud of this one. And I have one more planned, if I live long enough. It will be out next summer, about the time I turn 88.So you know what I mean when I say, “If I live long enough.”
Thx for the heads up Ron. Good to see your work.
https://www.youtube.com/watch?v=NvNsWhOQ4VY
4 minutes
US Military parks Super Carrier off coast of Venezuela (world’s largest oil reserves).
The geopolitical strategist thinks it will be “Bomb it and Forget it” as Venezuela is unmanageable.
What do you think?
I am afraid to think anything since we have an idiot for a president. There is just no way of knowing what that damn fool might do.
I think not much will happen. Trump needs a distraction from the Epstein List. That’s what this is about.
Opec announces a three-month pause from January to March 2026 in its campaign of ouptput hikes, after an increase of 137 000 barrels per day for December
It looks like China, the main engine of oil demand growth since 2000, is using less and less of it for transportation.
https://www.reuters.com/business/energy/evs-put-an-end-chinas-usual-holiday-surge-gasoline-use-2025-10-30/
OPEC looks like it wants to “pause” production increases on fears of an oil glut.
https://www.nytimes.com/2025/11/02/business/opec-plus-oil.html
I’m starting to wonder if Trump’s attacks on Nigeria, Venezuela and (indirectly) Russia are happening because of panic about falling prices.
But as Ron says, who knows what’s going on in his head.
My guess is that by December OPEC+ may be out of spare capacity, rather than announce this they are claiming that they fear a glut of oil (this may be true, but their Monthly Oil Market Report estimates suggest this is not the case, if the forecasts are accurate). I think that the OPEC forecast for World demand is too high, perhaps in private meetings the OPEC oil ministers agree with my assessment. For the 5 OPEC nations that are subject to these adjustments (Algeria, Iraq, Kuwait, Saudi Arabia, and UAE) crude output is expected to increase by 492 kb/d above the September 2025 output level for the Dec 2025 to March 2026 period. This increase (if it actually happens) might be offset by decreasing output in the US, Russia, Venezuela, and Nigeria.
It will be interesting to see what happens.
Chart below combines EIA’s PSM data up to August 2025 with the EIA STEO forecast for US C+C from Sept 2025 to December 2026 and calculates the centered 12 month average from July 2018 to July 2026, the mid-point for each year (roughly July 1 each year) is displayed on the chart as well as the new peak in December 2025.
cc ctma
Thanks, OVI!
Nice and detailed analysis!
Chatbot explains that the rising production and rigs in Lea and Eddy is a result of drilling on Federal land.
https://www.api.org/products-and-services/statistics/chart-gallery/new-mexico-crude-oil-production-has-continued-to-set-new-records
Sheng Wu
Thanks. Much appreciated.
Interesting to see the 3 way oil production split. The Lea federal lands production growth starts to slow in January 2025. I wonder if it is possible to get an update on these charts.
Attached is the CVX conference call with a lot of reference to the Permian. They say they are more efficient at drilling and completions than smaller drillers. Is CVX in both Tx and NM or just concentrated in one?
https://www.gurufocus.com/news/3175906/q3-2025-chevron-corp-earnings-call-transcript?r=caf6fe0e0db70d936033da5461e60141&utm_source=yahoo_finance&utm_medium=syndication&utm_campaign=headlines&utm_content=chevron_corp_%28cvx%29_q3_2025_earnings_call_highlights%3A_record_production_and_strategic_growth_initiatives&utm_term=CVX
Ovi,
lots of acreage in NM as well as in TX are previously held by big oil companies thru legacy production (conventional) . During bubble time, they were subleases to small startups, and tapped different shale formations. Now, the smaller ones with values all bought up by the large one. There are lots of acreage owned by CVX, COP, XOM, Shell and Marathon.
https://www.cnbc.com/video/2025/10/31/exxon-mobil-ceo-darren-woods-on-q3-results-the-highest-eps-weve-ever-delivered.html
XOM bragged that they could still have 2-digits margin with $35/bbl oil price — maybe Guyana, but certainly not Permian.
Ovi,
From Novi Update in March 2024, here is Chevron’s Permian output by county.
https://public.tableau.com/shared/JTPZZZJCD?:toolbar=n&:display_count=n&:origin=viz_share_link&:embed=y
199 wells in Eddy, and 150 wells in Lea of 1786 total wells.
Chart by state at link below
https://public.tableau.com/shared/M8J956MK8?:toolbar=n&:display_count=n&:origin=viz_share_link&:embed=y
Chart at link below has Chevron Permian wells completed from 2017 to 2023 by county, most of them were in Reeves(493 wells) and Culberson (305 wells) County. A total of 1469 horizontal wells were completed from Jan 2017 to Jan 2024 by Chevron in the Permian Basin. with 54% of those wells completed in Reeves and Culberson.
https://public.tableau.com/shared/FNFRSZWZW?:toolbar=n&:display_count=n&:origin=viz_share_link&:embed=y
Sheng Wu,
Nice charts thanks.
Looks like a fairly steady increase from Lea and Eddy federal lands from 2019 to 2025 so this doesn’t seem like something new in the past 12 months, just an ongoing use of Federal leases in New Mexico.
Sheng WU
Thanks for the charts. Chevron seems to have good rock in good layers and probably good technology.
Let’s keep tracking production for the big 4 counties to asses whether they are on a plateau or are still capable of increasing production. With prices in the low 60s and a dropping rig count, a production drop could quickly turn around if prices rose.
According to the CEO of Texas Pacific, the Permian still looks good.
https://www.mrt.com/business/oil/article/permian-peak-texas-pacific-21022433.php
Dennis
OPEC production in 2017 was 32mb/d, since then Angola and Ecuador have left, removing close to 2mb/d.
Do you think OPEC has lost over 2 million barrels of capacity in that time. What proof do you have. These kind of decline stories have been around for years a have come to nothing
Iver,
I was incorrect in my initial guess, spare capacity for the Big 4 will fall to about 482 kb/d. I wonder if Iraq will be able to raise its output to the December 2025 target of 4273 b/d, this is 210 kb/d above the September 2025 output level and this capacity might not be available (this level last reached in 2023).
OPEC nations are producing all they can with the exception of Algeria, Iraq, Kuwait, Saudi Arabia, and UAE. Algeria’s spare capacity is minimal, perhaps 50 kb/d at most as of Sept 2025, for the Big 4 (5 nations just mentioned minus Algeria), their peak centered 12 month output was in 2022. I define spare capacity as demonstrated peak 12 month output minus the most recent (Sept 2025) crude output according to secondary sources. See the OPEC post for details on my estimate of spare capacity. If the December 2025 OPEC output levels are reached (as reported by OPEC at link below) the Big 4 will have about 482 kb/d of spare capacity by my definition. We don’t really know what OPEC spare capacity is, but I don’t believe the spare capacity numbers reported by OPEC, those are wishful thinking in my view.
https://opec.org/pr-detail/579-02-november-2025.html
The main point is that OPEC spare capacity may be getting very thin. As of December most of the approximately 500 kb/d of OPEC spare capacity will be in Saudi Arabia which has demonstrated a maximum centered 12 month output of about 10600 kb/d (in 2022.)
A lot of capacity has been lost from Venezuela and Iran. with Iran’s output falling by 500 kbo/d since 2017 and Venezuela’s output falling by about 1000 kbo/d, so a loss of at least 1500 kbo/d from 2017 to Sept 2025. Also Algeria has lost about 20 kb/d of capacity since 2017 and Nigeria has also lost about 200 kb/d of spare capacity since 2017 so a total of roughly 1700 kbo/d of OPEC spare capacity has been lost since 2017. I focus in the Big 4 which has implemented most of the recent cuts in OPEC crude oil output since 2022, all other OPEC nations are producing very near their maximum sustainable capacity as of Sept 2025.
Dennis
A while back Iraq changed oil contracts to make the country more attractive to oil companies.
Some of these new contracts are starting to make a difference. Here are some of the companies now trying to raise production.
https://www.rudaw.net/english/middleeast/iraq/011020252
Once the common sea water project is complete Iraq may be able to produce 7 to 8 million barrels per day.
https://smartwatermagazine.com/news/smart-water-magazine/hyundai-ec-wins-316-billion-contract-iraqi-seawater-treatment-plant
They do have very large reserves, that’s why the Americans invaded it.
OPEC probably can produce 30 million per day. I simply don’t think Saudi Arabia would leave itself with practically no spare capacity. I don’t think they are that stupid. Over the years they have played an intelligent game regarding production.
Iver,
I am estimating current spare capacity, Iraq at one time claimed it would produce 12 Mbpd, I believe the numbers claimed when I see the production. The claimed reserves of OPEC nations are suspect.
Here is a webpage from 2010 claiming that Iraq could reach 13 Mbpd by 2017. See figure on page 2, so far Iraq seems to be following the low production scenario.
https://iraqieconomists.net/en/wp-content/uploads/sites/3/2013/08/Thamir-Uqaili-TG-on-INES-reformated-1.pdf
More recently they are claiming 6 Mbpd and in some places 7 Mbpd by 2029 or 2030.
I do not know what future capacity will be, but I do know the 12 Mb/d by 2017 forecast in 2010 was not correct, I remain skeptical of claims of 6 Mbpd by 2030.
The Saudis claim their spare capacity is 12.5 Mbpd, I will believe it when they produce at that level for a 12 month average and not before.
Here are Rystad’s estimates for Global Reserves and Resources
https://www.rystadenergy.com/news/discovered-recoverable-oil-resources-increased-by-5-billion-barrels-despite-produ
Remaining resources are 242 Gb for Saudi Arabia and 105 Gb for Iraq as of Jan 1, 2025. For Iraq cumulative production from 1960 to 2024 was about 52 Gb which suggests a URR of 157 Gb, if we assume peak occurs at 50% of URR that would be about 79 Gb. Lets say Iraq produces at their 2022 level until 2029 (1.6 Gb per year), that is about 6.4 Gb of output, getting us to 58 Gb of cumulative output at the end of 2029. Then let us assume output jumps to 6 Mbpd in 2030 (2.2 Gb per year), in 10 years by 2039 Iraq reaches 50% of URR. Likewise Saudi Arabia reaches 50% of URR (410 Gb) by 2034 at the 2022 level of production.
Resources are not unlimited, though low prices currently make people think so.
Currently OPEC can produce around 28 Mb/d, if sanctions were removed on Iran and Venezuela this might increase to 29 Mb/d short term and perhaps 30 Mbpd longer term. The smaller OPEC producers will continue to decline which will offset some of the increases we might see from Iraq ( I doubt this increases beyond 6 Mbpd for Iraq, perhaps 7 Mbpd at most by 2030).
Dennis
Why do you need to use utterly stupid previous claims to try and defend your predictions?
The 12 mb/d for Iraq was believed by nobody of sound mind.
The 7mb/d is not just claims, that is why I attached articles describing the contracts signed and the engineering work being done. There is obviously much much more being done than those described.
Iraq increasing oil production to 7 million in view of the oil companies actually having proper contracts is more than achievable.
Wake me up when oil prices are $150 for more than a year, then we may have peak oil.
In the mean time, we are at a new global high for Cand C and total liquids.
Peak oil was ~2018…
Actually to be precise:
South America and friends (Africa + China) peaked in 2010 at 24.5 mb/d.
Middle East peaked 2016 at 28 mb/d. In 2024 ME produced 26 mb/d.
Russia and friends peaked 2019 at 14 mb/d. 2024 was <13 mb/d
And final piece of the puzzle, North America peaked in 2024 (maybe 2025?) at around 20 mb/d.
This dynamic puts the global peak squarely in the 2016 timeframe…nearly 10 years ago…
If we exclude the unconventional supplies, current global oil production is at 20+ year lows,
I can’t for the life of me understand why anyone here believes that production could make a new peak…after nearly 10 years and it’s not even close???
Iver,
They started working on the CSSP in 2010, see link below for a summary of oil output plan on pages 1 to 4 and pages 17 to 24 for CSSP specifically.
https://www.qamarenergy.com/sites/default/files/Iraq%20Water%20Injection.pdf
The original bids called for 11.4 Mbpd of plateau output, by 2018 these targets had been revised to 8 Mbpd.
There have been many contracts signed over the years, the severe corruption in Iraq makes it difficult to accomplish much quickly. Maybe 2028 becomes 2038, we will see.
Also note that low oil prices do not make it more likely this investment will go forward, a big reason for delays in the project were the low oil prices we have seen since 2015.
I agree we will see a new global peak, probably by the end of 2025 (for centered 12 month average C+C). My guess for the final peak is 2027/2028, but it depends on how high the peak is and the rate of extraction, many different output paths are possible.
As Carnot pointed out elsewhere C+C is in fact a better measure for oil than C+C+NGL. see link below for Carnot’s comment
https://peakoilbarrel.com/opec-monthly-oil-market-report-october-2025/#comment-793575
Kengeo,
Why would we exclude unconventional oil? The peak for Global C+C was in 2018 for the centered 12 month average(CTMA), a new peak is likely for the Global C+C CTMA by the end of 2025, possibly early 2026.
In your comment you seem to be using total liquids output (US at 20 Mb/d, where C+C is about 13.5 Mb/d). For Global petroleum liquids and biofuels the peak for centered 12 month output is 103.9 Mb/d in January 2025. In early 2019 there was a peak at 100.9 Mb/d, that level was surpassed in Oct 2022.
Kengeo
So you think The EIA are lying, when did they start lying?
https://peakoilbarrel.com/june-world-and-non-opec-oil-production-rise/
Is the IEA lying?
https://www.iea.org/reports/oil-market-report-october-2025
Fact is we are swimming in oil that is why the prices are so low.
Dennis –
Just using the C+C annual data:
2024:
Total North America: 20.09 mb/d
Total Middle East: 26.12 mb/d
Total CIS: 12.91 mb/d
Africa+Asia+South America: 21 mb/d
We can now also pin the URR down to the current 2P estimate of ~700 Gb (adding cumulative of ~1600 Gb), so a total URR (most likely of 2,400 Gb), which suggests that 2/3 of conventional oil has been produced.
Importantly, to get a URR of 3,000 Gb, we’d need to see a conventional peak more recently (2023-2025), thus 2400 Gb is a reasonable estimate.
You can model shale/sands on their own, but they are much smaller than conventional so they skew the production profile significantly.
I think it will be apparent when annual decline is 3-4%, likely to start soon…
Hi Kengeo,
My mistake, sorry, I read North America as the US. In 2025 or later there is likely to be a new World C+C peak, conventional decreased because unconventional rose quickly displacing some conventional oil. 2PCX is a reasonable estimate and suggests a Global C+C URR of roughly 3100 Gb. If demand for oil falters we might see a URR of 2800 Gb, but I doubt it is lower than that. Cumulative C+C for the World will be around 1560 at the end of 2025, if we assume the peak is reached when cumulative output is 50% of URR, this would imply a URR of about 3100 Gb. In 2027 I believe we may reach a final peak for World output (my best guess certain to be wrong) with World cumulative output at 1622 Gb which could imply a URR of 3244 Gb, I think URR will be around 3000 Gb as demand may fall faster than supply of oil and extraction rates will fall as a result of low oil prices. I think we will see peak demand rather than peak supply, prices will tell the story, if they mostly remain under $80/bo in 2025$ that will tell the story.
Eventually we might see 4% annual decline rates, but only if demand falls that fast, it is not likely to be an issue with supply in my view. A decline rate of 3% is plausible after 2040 or so, but I think 2.5% to 3% is more likely.
Dennis –
Use 2016 as the world conventional peak, make sure you don’t mix conventional with unconventional as that will skew the peak.
For the 11 countries producing above 2.0 mb/d, we can see they had a cumulative output of 864 Gb by ~2018.
Let’s imagine those 11 countries had 864 Gb remaining 2018, they have produced 154 Gb so they have 710 Gb remaining.
Under the most optimistic circumstances there might be 800 Gb left to produce.
Under the most conservative scenario there is only half that amount….
Half the remaining oil is in the Middle East and 20% in North America and 20% in Russia…
kengeo,
Here is annual World C+C from EIA International statistics (in green) and an estimate in red for 2025 and 2026 based on STEO and a condensate estimate for World less US C+C using STEO World Crude and international EIA statistics for World C+C, the trend for condensate from 2003 to 2024 is extrapolated to estimate World minus US condensate. Then World minus US Crude is added to the World minus US condensate estimate plus the US C+C estimate from the STEO to arrive at the estimate for World C+C.
To me the EIA World C+C estimate for 2025 and 2026 looks reasonable, but I’ve been wrong before and this will repeat.
world C+C 2511
Kengeo and Iver,
That Iraq document from 2013 which had a low, medium, and high scenario I did not read carefully (just looked at the figure). In the text they say the high scenario is very unlikely, the medium scenario is a bit more likely and indicate the low scenario is most realistic. In hindsight this was quite accurate (though even the low scenario was a bit too optimistic). Perhaps Iraq gets to 8 Mb/d eventually, I just don’t think it happens by 2030 given the past history since 2010 or so.
Here is My recent guess for World C+C.
To me the EIA World C+C estimate for 2025 and 2026 looks reasonable, but I’ve been wrong before and this will repeat.
shock2511
about US soybean production and biofuel, below is what chatbot says:
1. US soybean production is over 100 million ton per year
2. more than 80% are used for domestic biofuel consumption, and produced over 15.5 billion pounds, or 50 million tons ! the conversion rate is over 50%!!!! yes, natural gas ->ammonia->soy bean->biodiesel, very efficient. This is the largest hydrogen economy already there for 100 years.
https://www.aga.org/news/news-releases/new-report-natural-gas-critical-to-agriculture-sector/
it is hard to imagine for Germany where Haber-Bosch and FT synthesis were invented and totally changed global population and famine history, could develop the crazy idea of going green wash carbon zero, and seriously practice it.
May 2025 from the American Soybean Council-
“Soybeans are almost never used whole but are instead “crushed” to produce soybean meal and soybean oil. Approximately 80% of the crushed bean results in soybean meal, which is used for protein content in livestock feed, and hulls. The other 20% is soybean oil, which is primarily used for human consumption and biofuels.”
About 50% of the US produced soy oil is used for biofuel production in 2025.
The demand primarily driven by CO2 mandates for transport fuel.
It is an expensive as a source of transport miles.
Soybeans are grown almost primarily for the value of the protein, with the crushed oil being a secondary product.
Apparently Trump is tryingto compensate for China switching to South American soy beans by increasing the biofuel mandate.
https://www.reuters.com/sustainability/climate-energy/biofuel-demand-soak-up-more-than-half-us-soyoil-production-next-year-usda-says-2025-07-11/
I can’t help thinking nobody really needs those soybeans. Mybe the government should pay farmers to restore the tallgrass prairie instead.
“ green wash carbon zero”
This is a little confused. “Green washing” refers to pretending to go carbon zero. Actually going carbon zero is not green washing.
So…you don’t believe the scientific consensus about climate change? Those who have acknowledged that climate change is a serious problem include Russia, KSA and XOM…
Farms don’t exist to make food,
They exist to make money.
Once the money making stops,
The spring planting will stop.
It’s easy to see.
We all know it takes along time ( and money$$$) to build a nuclear power plant.
Is there a big shortage of turbines for Nat Gas electrical production?
According to FERC (Federal Energy Regulatory Commission)
“Solar has now been the largest source of new generating capacity added each month for two consecutive years, between September 2023 and August 2025. During that period, total utility-scale solar capacity grew from 91.82 gigawatts (GW) to 156.20 GW [64.4 GW gain]. No other energy source added anything close to that amount of new capacity. Wind, for example, expanded by 11.16 GW while natural gas’ net increase was just 4.36 GW.”
It is important to realize that this is based on raw capacity, rather than electricity output. For solar the average capacity factor (CF) of utility scale solar is- “The capacity factor for U.S. utility-scale solar systems varies by region, but the national weighted average for 2023 was 23.5%”.
“The capacity factor for U.S. natural gas electricity production is around 59.7% to 60.5% for combined-cycle plants, reflecting recent trends and the increasing role of natural gas in the power grid. Newer plants have a higher capacity factor, reaching about 66% in 2022 for plants that entered service between 2014 and 2023. In contrast, older and less-efficient natural gas plants have lower capacity factors…”
Hickory,
Thanks I didn’t realize the capacity factor for CC Natural gas power plants was that low.
https://www.eia.gov/todayinenergy/detail.php?id=60984#
See also
https://www.eia.gov/electricity/monthly/xls/table_6_07_a.xlsx
Average coal power plant capacity factor was 43% in 2024 and for natural gas combined cycle about 60% in 2024, all other types of fossil fuel power plants had capacity factors of 20% or less.
Hickory/Dennis,
There regularly seems to be varied interpretations regarding capacity factors, utilization rates, and overall efficiencies.
The thermal efficiency (heat potential in versus energy output) of the latest CCGT plants is about 60/64 per cent.
The amount of electricity generated over a year’s time by a typical CCGT plant is indeed about 60% of the total, theoretical capacity if the plant were to run 24/7 365 days of the year at full throttle.
That completely misses the point.
As anyone who has glanced at the daily ‘duck curve’ can readily see, the ~4 hour morning/early evening ramps are when the greatest daily demand occurs and THAT is largely why CCGTs are not churning out the juice 24/7.
It is not needed.
This situation is greatly enhanced as solar (at least where the sun does glow) contributes most in mid day/early PM timeframe (see any CAISO chart) and wind traditionally has its highest output in ‘the midnight hours’ when – again – demand is lowest.
The fact that CCGTs can – and do – ramp up and down following demand is a huge reason why they are so economically efficient.
One need only look at the Lazard’s LCOE reports to verify that a huge cost component of CCGTs is the fuel cost … but these babies are only cranking when the grid has demand and offers premium pricing.
(ISO-NE shows this daily demand/price relationship ongoing).
So, yeah, natgas plants produce/sell about 2/3 of what their nameplate capacity is as if they were to run non stop for a year.
Financially, virtually all of their run time is producing (relatively high) revenue.
P.S.
Either checking in with ol’ chatbot or going to any of the Siemens, Mitsubishi or GE Vernova websites (or recent conference calls) readily verifies that there is a 3 to 5 year wait time for new turbines despite their ramping up production capacity.
I believe GE is requiring a multimillion dollar deposit to hold one’s place in the queue.
Coffeeguy,
I think you’re describing the basic operation of a NG peaker plant, and its effect on capacity factor. I think most of the people on this blog understand that. I suppose Dennis’ was surprised because he didn’t expect a CC plant to be used as a peaker – one expects a single cycle NG peaker, I think. OTOH, a 60% capacity factor suggests something like a mid-load plant: some baseload, some load following.
Now…I think a more interesting question is, have you compared the current economics of NG peaker plants vs batteries?
The big economic impact of solar, as I have said about a zillion times here, is reducing profit margins in electricity production. Because solar requires no fuel, no fuel-based energy supply can compete when solar is running.
CC gas was originally introduced as a peaker plant tech, intended to run when inflexible baseload plants, mostly coal, couldn’t ramp up. That is mostly during the day. CC gas plants were always low capacity factor. They profited from high daytime prices.
Thanks to their efficiency and low gas prices in America, CC gas plants have been eating into coal’s low-margin baseload business as well. Now solar (and increasingly battery supply) is pushing CC gas out of daytime hours. At the same time, CC gas is killing coal at night.
Ironically, solar’s greatest weakness, that it is intermittent, is exactly what makes it so disruptive. Unlike coal and nuclear (and traditional gas plants), CC gas is flexible enough to cope with the wild output swings of zero-marginal-cost solar. But CC gas shouldn’t be expected to ever run with high capacity factor.
The newest coal plants in China use new methods to make coal plants more flexible. (See my previous posts on this topic.) This and overinvestment explains why coal capacity factors are so low in China. But cheap gas in America means that tech won’t make it there.
Coffeguyz.
I understand the point about the nat gas power plant CF’s. I was just pointing out was is the actual performance –
“The maximum capacity factor for a natural gas power plant is theoretically 100%, but in practice, the highest actual capacity factors for the newest combined-cycle natural gas turbines (CCGT) can approach 65% or higher, with a 2022 fleet-wide average for units built after 2010 at approximately 64%. However, simple-cycle gas turbines (SCGT), which are used more for peak demand, have much lower average capacity factors, around 13% in 2022″.
Understanding the actual average CF’s of the nations power plants in operation is useful to help compare the various generating capacities being budgeted for,planned, or brought on line. For example 10GW nuclear with a 90% CF, vs 10GW photovoltaic with a 23% CF, vs Nat Gas with a 66% CF are clearly different animals, with different time-frames, costs , strengths and weaknesses.
And yes, a point I was trying to reaffirm is that there is long lead time for Steam Turbines, clearly hampering deployment of new nat gas generation. At some point here GEV is going to get back on its big uptrend- ” the two-year return for GE Vernova (GEV) stock is approximately 385.70% as of November 5, 2025, including dividends. This is calculated from its IPO date in March 2024″ . Its taking a breather currently.
I have been pounding the table on ‘electrification’ a long time now. China is eating our lunch and dinner on it. They are motivated primarily by being more heavily dependent on fossil fuel importation. But also seem to have a deeper realization how much more efficient electric motors are. Nonetheless they are way out in front on it.
coffeeguyzz,
I believe the EIA has a definition of capacity factor. As of 2020 it is described here
https://www.eia.gov/todayinenergy/detail.php?id=42995
100% capacity factor would mean the power plants run continuously. For the US electic power fleet in 2024 nuclear power had the highest capacity factor at about 90%. For some reason I thought natural gas combined cycle plants would have run at 70 to 80% capacity (or utilization rate).
Nick,
I thought combined cycle which is touted as low cost electric power would be used as baseload power, so I thought it would be 80 to 90% capacity factor.
Dennis/Nick,
CCGT plants are considered – by the EIA and others – as ‘hybrid/intermediate/mid-merit’ electricity providers precisely because they have both peaker (quick ramp) and baseload (incorporation of steam turbines via Heat Recovery Steam Generators) characteristics which economically, efficiently satisfy both demands when called upon.
When mid day and late hour demand slackens, they can stop producing. High demand timeframes prompt their implementation.
A ‘Real World’ perspective translates into having a very reliable source of electricity that – for the operators – only incurs significant cost (fuel) when the demand market offers commensurate revenues.
“ A ‘Real World’ perspective translates into having a very reliable source of electricity that – for the operators – only incurs significant cost (fuel) when the demand market offers commensurate revenues.”
A Real World perspective takes into account all of your costs, and all of your operational parameters.
For more and more locations and applications batteries are cheaper, cleaner, more reliable and more effective.
Batteries produce no pollution. If powered by solar, wind, hydro, geothermal etc there is no fuel cost. They don’t have to warm up (CCGT requires 1 to 12 hours from a cold start, and a warm start requires fuel to maintain readiness), and can provide power and grid services (frequency, voltage, etc) in milliseconds. There is no danger of NG lines freezing.
There is a reason that the EIA projects essentially no growth in NG electrical generation in 2025 & 26.
“Abu Dhabi, 27th October 2025: Kostantsa Rangelova, Electricity analyst at Ember participated in the groundbreaking of the world’s first gigawatt-scale round-the-clock renewable energy project, a major step toward making 24/365 clean electricity a global reality.
This project will integrate a 5.2 GW solar photovoltaic (PV) plant with a 19 GWh battery energy storage system (BESS) – the largest and most advanced solar-plus-storage facility worldwide. Once operational, as early as 2027, it will deliver 1 GW of continuous, clean power throughout the year, enough to supply electricity to over half a million homes; avoiding around 5.7 million tonnes of CO₂ emissions per year compared with a similar capacity gas plant.
Earlier this year, shortly after Masdar announced the project, Ember published an analysis demonstrating that 24-hour solar generation is no longer a distant goal – it is already achievable, thanks to the rapid advances in battery technologies and steep cost declines.
This project is a landmark moment for clean energy. For the first time, gigawatt-scale solar will operate around the clock, delivering reliable electricity every hour of the year. It shows that renewable energy is capable of meeting the same demand that was once only thought possible with fossil fuels.
The economics are shifting fast: global grid battery costs fell by 40% last year alone and are on for a large fall this year as well. The Masdar project demonstrates that round-the-clock clean power can be delivered at competitive tariffs compared with conventional baseload like gas turbines. Alongside rapid cost declines, the technology has also improved: grid batteries are increasingly “plug and play”, enabling faster and cheaper deployment; warranties now extend up to 20 years; fire risks have been reduced to near-zero and the mineral, carbon and land footprint is only a fraction of what it was.
As utility-scale solar farms expand worldwide, the question is no longer “if” they have batteries, but rather “how much”. Storage has evolved from minutes, to 2-hour and now 4 or even 8 hours durations, allowing solar to power evening demand reliably. The Masdar initiative extends that frontier, showing that solar and batteries can now serve around-the-clock needs for large power consumers that need uninterrupted electricity such as data centres.”
https://ember-energy.org/latest-updates/a-landmark-moment-for-24-365-clean-power-ember-at-groundbreaking-of-worlds-first-gigawatt-scale-solar-project/
Dennis
I meant to post this chart in your OPEC post.
The chart lists the OPEC + countries that have production targets. Columns 2 and 3 show the August and September targets for the listed countries. The 4th column shows the August to September Target Increment. The 5th column lists September production as taken from the October MOMR. The last column shows the August to September increment listed in the October MOMR.
The September MOMR increment was 78 kb/d above the target increment, i.e. 625 kb/d vs 547 kb/d, largely due to SA and Russia. Do we believe the Russia increment.
While overall September OPEC production, 32,795 kb/d was 85 kb/d below target, it would be larger if it weren’t for the over production from Kazakhstan. Three of the four big OPEC producers are slightly below target production with Iraq being the worst one.
It will be interesting to see what the November MOMR reports for Russian October production.
A OPEC
Dennis
You still have failed to read the report that you posted.
https://iraqieconomists.net/en/wp-content/uploads/sites/3/2013/08/Thamir-Uqaili-TG-on-INES-reformated-1.pdf
Why don’t you stop trying to pretend you know stuff you don’t?
The IEA Report on Iraq had a middle and high production estimate to 2020. Iraq oil production capability was over the middle estimate. The report also stated that the common sea water project was now delayed.
Iver,
Yes I said exactly that is this comment
https://peakoilbarrel.com/us-august-oil-production-new-high/#comment-793599
I am not really trying to defend anything, I just don’t find Iraqi claims about future production believable, perhaps I am wrong and your faith in Iraqi claims is justified.
Note however that contracts were signed with major oil producers in 2010, see XOM press release below
https://investor.exxonmobil.com/company-information/press-releases/detail/886/exxonmobil-signs-agreement-with-iraq-to-redevelop-and
I posted a link to the INES report and pointed to the figure on page 2, did not say I read it nor did I until later.
Here is a report from 2012 saying that Iraq was striving to reach 9 Mb/d between 2017 and 2020.
https://www.reuters.com/article/business/energy/iraq-sees-near-record-37-mbpd-oil-output-in-2013-idUSL5E8N93KG/
Link to chart below from 2013 analysis, with low, medium, and high scenarios (the basis for my initial comment.) Looks like they are near the low scenario, but delayed by 3 years in reaching the 6 Mb/d target. Maybe they get there, I have never pretended to be an expert, just giving my opinion that historically targets get missed in the case of Iraqi megaprojects.
iraq scenarios 2013
Dennis
You are doing it again. A one line written by some who knows what journalist, without any proper quotes one can verify.
Only when you read several articles on a country can you start to build a picture. Then best policy is to take the median view of what is being said. Both in terms of quantity and time scale.
Anyway the main thing.
Those who predicted peak oil in 2008 were wrong also the 2012 2016 2018 predictions.
https://www.eia.gov/outlooks/steo/data/browser/#/?v=30&f=Q&s=&start=200701&end=202604&id=&linechart=COPR_WORLD&ctype=linechart&maptype=0
They have now all fallen.
So being the most extreme sceptical obviously is wrong.
Iver,
I have now looked through many articles on the CSSP.
I agree predictions of peak oil in the past have been incorrect, though in the case of Iraq, the most skeptical (low output) scenarios from 2012 have proved most accurate.
Here is a link the the 2012 IEA report on Iraq.
https://www.iea.org/reports/iraq-energy-outlook-2012
The central case has Iraq output reaching 6.1 Mb/d in 2020, 6.9 Mb/d in 2025 and 7.5 Mb/d in 2030. New water requirements for the central scenario are 5.5 Mb/d by 2020, 6.5 Mb/d by 2025, and 7 Mb/d by 2030.
The current CSSP project is for about 5 Mb/d of water which is enough to bring Iraq’s output to about 6 Mb/d, to reach 7 Mb/d will require an expansion of the current project to about 6.5 Mb/d of water, maybe that happens by 2030, we will see.
The article linked below from May 2019, gives some background on the reasons for delay from 2011 to 2019.
https://www.offshore-technology.com/analyst-comment/cssp-project-2019/
Article below from 2021 discusses Total’s negotiations with Iraq in Oil and Gas
https://www.mees.com/2021/4/2/oil-gas/iraq-total-reach-initial-deal-on-7bn-of-projects/4fc05f50-93ae-11eb-adca-99baa3dac7be
Dennis – If we were in fact hitting new global production highs, how come trade movements are still below the 2016 to 2019 levels?
Another exercise you can do to see the full picture, exclude the top 11 producers and plot the production of the ‘Rest’, you will see that group peaked at 30.7 mb/d all the way back in 1998. Current level is <20 mb/d. For all/most other producers, you will see double peaks near 1980 and then later 2010-2020, so the centered peak is 2000 plus or minus. Everything in context, the actual URR for easily/econmic producible oil is 2,000 Gb. I think there may or may not be a couple hundred more Gb if the sponge is squeezed extremely tightly…
There’s an extremely steep production cliff coming soon,
Kengeo,
The trade is less because the US has reduced its imports of crude from 10.1 Mb/d in 2005 to about 6.1 b/d in 2021. So a reduction of 4 Mb/d in crude oil imports to the US. At the World level exports were 43045 kb/d in 2005 and 46656 in 2018 (last year with EIA international data on crude oil exports). The Energy institute data looks at crude plus products, for that it looks like 2016 was the peak, but if we look at US net imports over the 2016 to 2024 period the net imports were 4974 kb/d in 2016 and the US had switched to a net exporter of 1448 kb/d in 2024 so a reduction of 6422 kb/d in US net imports of petroleum. At the World level exports decreased by 1716 kb/d, this is explained by changes in the US with much fewer net imports from 2016 to 2024.
For crude output, looking at all nations makes the most sense, 2025 will be a new peak for World C+C. I expect 2025 will be surpassed in 2026 and possibly 2027, and perhaps even 2028. It will depend in part how high output goes in 2026 and 2027 whether 2028 might be the start of decline.
On the steep production cliff, you have been saying this for a few years now, still waiting.
For my best guess scenario World peak in 2028 at 85.4 Mb/d. Then from 2030 in Mb/d at 5 year intervals we have World C+C output as:
84.6
78.4
69.8
62.7
56.7
Average annual decline rates starting with 2030-2035 and proceeding to the next 5 year interval up to 2050:
1.5%
2.3%
2.1%
2.0%
Chart below gives output and decline rates at 5 year intervals 2030 to 2150 for scenario for World C+C. Maximum decline rate is about 2.8%/year for a scenario with a URR of 3000 Gb. If URR is lower as you believe then decline may be steeper, 4% average annual decline after 2030 reduces URR to about 2500 Gb, for a scenario with output like my best guess from 2025 to 2030.
shock + decline rate
Dennis, what assumptions are built into those predictions of decline rates?
Kengeo
Where do you get your import, export data?
Where do you get your import export data of finished products?.
Hideaway,
Many many assumptions. Future discoveries, rate that resources are developed, and extraction rates mostly. All guesses of the Future will be wrong. URR is 3000 Gb roughly consistent with Rystad 2PCX estimate for C+C resources (3100 Gb) and similar to USGS World Petroleum assessment from 2000. URR for conventional C+C is 2800 Gb, extra heavy oil (API gravity less than 10 degrees) URR is 120 Gb and US tight oil URR is 80 Gb.
The shock model is used with discoveries (including reserve growth) for conventional oil equal to 2800 Gb, unconventional oil (oil with API gravity <10 degrees from Canada and Venezuela and tight oil) has URR of 200 Gb. Mean development time(fallow, construction and mature stages) from discovery to field reaching full output is 39 years. Extraction rate for conventional oil shown in chart linked below. For model description see
https://oilpeakclimate.blogspot.com/2015/02/the-oil-shock-model-with-dispersive.html
and
https://oilpeakclimate.blogspot.com/2015/07/oil-shock-models-with-different.html#more
these earlier models included tight oil with conventional oil, now I use a separate US tight oil model and my assumption for XH oil output is far lower than my 2015 models. The older models used a simpler development phase where the fallow, construction, and maturation stages were collapsed into a singe development stage, the current model convolves discoveries with a maximum entropy (maxent) probability distribution to get fallow curve which is convolved with another maxent distribitution to get a build curve, the build curve is convolved with another maxent distribution to get a mature reserves curve (essentially proved developed producing reserves), then the production curve has oil extracted from mature reserves at some percentage of the previous years total. For example if in 2024 there were 600 Gb of mature conventional reserves and the extraction rate was 4.5%, then 27 Gb of conventional oil would be produced.
Chart of discovery, fallow, build, mature, production and extraction rate (right axis) for conventional oil shown below, the mature reserves (M) are those added to existing reserves each year, PDP reserves this year are PDP reserves in previous year plus M added this year minus conventional oil produced this year.
shock model 2511
Hideaway,
Chart below has my conventional model, and US tight oil model and extra heavy models together on the same chart, note that the conventional oil is on the right vertical axis and the scale from max to min is the same for both left and right vertical axes.
conv and unconv 2511
Hideaway,
One final chart with conventional producing reserves in Gb (left vertical axis), production of conventional oil in Gb/year and extraction rate % for conventional reserves on right vertical axis. Note that producing reserves aka proved developed producing (PDP) reserves.
The producing reserves are the sum of the area between the Mature curve and the conventional output curve in the “shock model 2511” chart. After 2024 when more is produced than is added each year in reserves (M<P) the PDP reserves start to decrease.
PDP reserves 2511
To our Participants
I forgot to add at the end of the post. If you like to see a production chart from some other Texas County, just ask.
To our Participants
I forgot to add at the end of the US post. If you would like to see a production chart from some other Texas County, just ask.
What relevance does your post have towards this blog.?
You seem to be delighted at the death of this man.
Why not post your vile comments elsewhere amongst others with similar twisted views.
Are you talking about Cheney dying and someone here mentioned him being a war criminal or something?
Ex politicians who work for oil majors and then re-entering politics and engaging in alleged war crimes over competition for soon to be scare oil resources seems an on point topic for a peak oil collapse blog.
I had assumed the skin would be thicker, so to speak, in the comment section of a peak oil collapse blog. Perhaps it’s not the skin or its thickness that’s at issue, perhaps it’s a lack of objectivity that pervades; MAGA hats vs Biden Bros… talking about peak oil and trying to understand the unraveling of humanity.
Great information, mediocre analysis and discussion due to increasing political fanaticism and butt hurt feelings.
Good post by Mike Shellman
https://www.oilystuff.com/group/engineering-and-geological-discussions/discussion/3d5b1ab8-2f7c-4f6a-b2d2-a741f851d9b2
He also pointed to this from the EIA, pretty big legacy decline for tight oil in the US for wells completed in 2024 results in L48 legacy decline rates in 2024 from 11 Mb/d to 6.7 Mb/d about 39% per year for all US L48 C+C. If we look at only wells completed in 2023, the annual decline rate for those wells is about 60% in their first year of output. Bottom line is we need about 4.3 Mb/d of output from new wells each year just to keep output flat, it will become more and more difficult to accomplish this over time.
https://www.eia.gov/todayinenergy/detail.php?id=66564
This is what is possible, even in this first inning of the photovoltaic buildout, at least in the sunnier half of the year-
“In a surprising move, the Australian government is advocating giving the public access to free electricity for three hours a day starting next July. The Solar Sharer energy reform will be available in South East Queensland, South Australia, and New South Wales. Other states will join in 2027. The reform is expected to reduce electricity bills by AU$800 per year for those who plan wisely. Of course, electricity retailers are screaming about loss of profits.”
Filling up your home/business batteries and vehicle charging will be very popular at mid day.
Of course this is already available for those who have their own photovoltaic array, once paid off.
I bring this topic up because i think that the US is making a big government policy mistake being fairly hostile to photovoltaics rather than enthusiastic.
Its a huge natural resource that we are barely taking advantage of.
Kind of a juvenile delinquent attitude the federal government has about it. You can guess where that comes from.
Just my opinion, but the facts of the issue very compelling.
Hickory
What’s stopping people buying solar panels themselves
People can buy panels, but very few places allow them to install them by themselves – they have to go through contractors and a permitting process. Residential PV is about twice as expensive in the US, compared to Germany, because of slow and excessive permitting requirements. A few places, like Utah, are simplifying the process for very small installations, but resistance to change is a big problem – some of it comes from Koch/oil industry sponsored roadblocks: Google ALEC legislative exchange.
The Trump administration is ending tax breaks for residential PV.
Small & distributed PV is great, but we need large utility-scale PV most, and the Trump administration is cancelling that left and right.
The Trump administration is making electricity more expensive in order to protect FF.
Iver. People need a few things- money/credit, a sunny roof, permit, electrical contractor.
“More than 300,000 rooftop solar systems were installed across Australia in 2024, bringing the total number to more than 4 million.”
Also, in many places you can go to hardware store and purchase small plug and play systems…self installed.
And then there are the small scale balcony systems gaining traction in places like Germany, even though its not a very sunny country-
“Germany Has Installed 550,000 Balcony Solar Panels”. No electrician or permit required as I understand it.
But utility scale photovoltaic is much less expensive, given scale advantages.
Hickory,
Those are good thoughts, except the plug and play and balcony type systems aren’t legal in the US except Utah. And even there the systems are still waiting for NEC and UL certifications. Now, if you don’t connect them to your house wiring in any way they’re fine, but a lot less useful…
There’s a push on to get more states to pass sensible legislation ala Germany (which actually has millions of systems, many of them unregistered). Write a letter to your rep!
Iver —
What’s stopping people from buying solar panels themselves?
Tens of thousands buy panels every day, and the trend is growing.
This is a somewhat breathless but still interesting blog post on solar in Africa.
https://climatedrift.substack.com/p/why-solarpunk-is-already-happening
What inhibits people from buying solar panels is high upfront costs, limitations related to their property and location, and various logistical and regulatory barriers. As well, 2/3 of Americans, maybe you’ve heard of them, live paycheck to paycheck.
I was not speaking only about the US Nick. Energy happens in all countries.
And yes, Survivalist points out correctly that most individuals do not own power producing facilities because they can not afford to do anything but purchase small amounts of energy of any source on a strictly daily need basis.
Global utilities (funded collectively by their customers) do purchase large amounts of photovoltaic power facilities. Particularly in sunny regions.
“Utility-scale solar power capacity in China reached more than 880 gigawatts (GW) in 2024, with 277 GW of utility-scale solar capacity installed in China in 2024 alone ”
Using an assumed capacity factor of 20%, this 2024 added photovoltaic capacity is equivalent to the electricity output of 50 new 1000MW Nuclear power plants with an assumed CF of stellar 90%.
So yes Iver- people do buy solar.
Survival —
In Germany plug-and-play 800 W solar systems (“Balkonkraftwerke”) start at €179. No licensing required, battery not included.
“277 GW of utility-scale solar capacity installed in China in 2024 alone”
For comparison the total (all sources) US generating capacity additions for the first 8 months of 2025 comes in at 26 GW.
The combined total of the last 4 months additions of solar in China add up to 42GW, yet the average for 4 months last year was over 90 GW.
No-one wants to talk about what’s happening in China since they levelled the playing field, it’s always look at the past!!
Well, which four months are you referring to, and what’s your source?
Dennis,
Some contrary info regarding your skepticism about the ever-expanding productive footprint in the Appalachian Basin …
Relatively small operator – Gulfport – had their quarterly conference call yesterday.
Quite a bit of discussion on the new U shaped laterals which are being drilled in the various basins throughout the US.
The Gulfport suits claim that their recent U shaped laterals may increase their viable Marcellus locations (gross, which would include partial mineral ownership sites) to about 200.
Considering that only about 100 – total – Marcellus wells have been drilled to date in Oho (versus ~4,500 Utica wells), widespread future adoption of this U shaped configuration could have a very significant expansive influence throughout the AB … especially as there are NO geometrically uniform, pre-set Drilling Units in this region.
Tailoring staggered lateral lengths/positioning throughout smaller, odd shaped leaseholds could make the operations economically viable.
The Gulfport suits expects EURs to be similar to standard, straight laterals.
This could have a huge effect on future development potentialities.
Final observation … the UAE is now joining the KSA in developing its shale natgas resources.
Sure as heck won’t be the last country to join the party.
the Marcellus Ohio part is just as amazing as the WV part, the 15Kft lateral could probably have close to 300KBO, and 6BCF of wet gas. Yet the vertical depth is only 6,500ft or less and thickness of Marcellus shale is only 30ft or less thick.
“have” means what, Sheng? An EUR of 300K BO and 6 BCF gas? What is your point, exactly? The WI, the folks paying the bills, would then “have” 225 K BO net to their interest, and 4.5 BCF.
At $55 net oil at the WH, that well has a net back of $23 per incremental BO= $5.2MM total revenue. Maybe. 4.5 BCF at $1.65 net, after all costs= $7.9 MM net revenue. Maybe. That’s $13 B of possible net revenue over 24 years. Maybe. The well costs, even at that shallow depth, $11 mm to drill and complete. Lets say $10MM to make you feel better.
The ROI on that Ohio well is then $3MM over 25 years, or 1.3:10, which is to say you RISK $10MM to earn $3MM over 25 years…less than 1% annual rate of return. Would you do that with your own money? Would your buddy, Coffee, or Annoying? Hell no you would NOT.
You guys are full of shit. You REALLY need to learn some well economics before you attempt to persuade America it is floating on 100 years of natural gas supply. Its embarrassing to me as an oil man. You are only fooling lazy people who can’t balance a check book.
But hey, come to think of it, that’s probably 90% of Americans! Keep up the good work.
Thanks Mike,
Also note that the average 2019 OH and WV wells produced about 60 kbo in their first 24 months, so oil produced is probably more like 150 kbo at most. Their might be some NGL but that is discounted by about 65% compared to crude. The average gas output at 24 months is about 4.7 BCF for 2019 wells. , similar to PA average wells in 2019.
See chart at link below for gas from OH and WV for average 2019 well
https://public.tableau.com/shared/792B9NNCJ?:toolbar=n&:display_count=n&:origin=viz_share_link&:embed=y
link below has chart for average 2019 OH and WV wells for oil
https://public.tableau.com/shared/99W5QCFG5?:toolbar=n&:display_count=n&:origin=viz_share_link&:embed=y
main point is that it is even worse than what you outlined at current prices.
So for NGL, the net revenue would likely be around less than $20/b, because gross revenue is typically 33% of WTI so about $21.60 for gross revenue and after gathering, transportation, processing and marketing costs the net revenue would be knocked down to under $20/b and about $15/b to the WI. For an average Ohio NG well the NGL extracted would be 700 kb over the life of the well. So perhaps $10.5 million in revenue from NGL, the average well probably produces about 11 BCF over its life with 8.25 BCF to the WI, at $1.65 net per MCF that would be another $13.6 million, also the average well produces about 125 kbo over its life, with 94 kbo to the WI for another $2.1 million. So total net revenue of $26 million over 20 years in a $10 million investment, about a 4.8% average annual return over 20 years. Probably not enough for the risk involved.
Not sure how much of the revenue from NGL would be retained after all costs, I would note that for EOG only about one third of gross revenue flows to the bottom line. Using one third of gross revenue we get net revenue of about $16.7 million over the life of the well, about a 2.6% annual rate of return over an assumed 20 year well life.
I am talking about the Marcellus condensate wells in the 3 Northern counties in WV and now counties on the Ohio side, along the Ohio river, not any of those wet gas wells in PA and further south in WV.
These condensate wells yield higher values with the prolific condensate liquid which is way higher than the other WV wet gas Marcellus and Ohio wet-gas-condensate Utica wells.
Again, this is not a huge area, and only along the river.
Those other Utica and Marcellus wells with much less could generate way more gas though — Range claim their SWPA wells could have gas EUR at 2BCFe/1k ft, that’s 30BCFe for 15k ft lateral. we already calculated their return.
Again, all shale gas/oil wells have their total recovery front loaded, probably over 90% for shale oil wells in 5 years, and here in WV/OH Marcellus, probably they are >80% front loaded in 5 years, and 90% in 10 years.
Sheng Wu,
I used data for Ohio wells only, in Northern WV, the 3 counties with the highest cumulative condensate output for wells completed in 2019 had about 88 kb of cumulative production at 24 months. Probably no more than 160 kb of condensate for these wells. Only statewide data is available to me for NGL, If we figure 90% of revenue over 10 years we would see an annual rate of return of 4.1% at current prices, still not enough to make the risk worthwhile for such a risky investment. If you can’t beat the average long run rate of return on VOO, probably not a good investment, the aim is to do better than about 7% per year for a nominal annual rate of return.
the Ohio part so far has no more than 10 Marcellus wells, so you are probably looking at Ohio Utica wells?
Sheng Wu,
Yes Ohio Utica/Point Pleasant wells. For WV I looked at 3 counties with highest cumulative output at 24 months for wells completed in 2019. US report from 2021 at Novi, basin filtered to Appalachia WV, showed wells by county then selected highest 3 counties by cumulative oil output at 24 months.
July 2025 World Oil Production at All Time High
As noted in last month’s post, July would be a new All Time High.
July 2025 oil production is 84,726 kb/d vs November 2018 at 84,593 kb/d, an initial increase of 133 kb/d.
It should be noted that this production will be revised over time.
A World
I wonder what global oil production could be if supply was having to chase higher demand and there were decent governments in Russia, Venezuela, Iran and therefore no sanctions.
No corruption in Mexico, Nigeria, Iraq.
High enough oil prices so drilling would not be curtailed as it is now in so many places.
Probably C&C could hit 90mb/d.
Dennis would probably disagree.
Dennis
I have reserved publishing the 12 mth CTMA for the World post. I agree it will also exceed the 2018 average.
The next big question is whether this next upcoming monthly peak, 6 to 12 months down the road, will be the ultimate peak.
The other question/unknown I have is what is OPEC’s game here. SA is trying to please T by over producing but to what extent are they OK with $60/b for WTI. What happens when the over supply causes the price of WTI to drop to $50/b.
Note that the price of NY harbour gasoline has been around $1.98/gal for while but the pump price has been $3.15 +/- 10¢ over the past year. XOM and CVX are capturing their profits down stream. Same thing is happening here in Canada. SU reported nice downstream profits the other day.
So is there a production war on the horizon or does OPEC revert to being the adult in the room.
As a side note I find it difficult to believe the Russian production numbers in the EIA report.
Dennis
I am not sure what the ultimate production peak will be.
Initially production the peak will actually be due to a demand peak.
Of course Ukraine could really ramp up the destruction of Russian oil infrastructure. They do appear to be getting much better at hitting targets.
At some point I think global production decline will overtake demand decline. There is no way in my mind that electric cars will cause a 2% year after year decline in oil demand.
21 million will be sold this year yet demand is still increasing.
The world would have to see 70 or 80 million ICE vehicles removed from the fleet each year to get a decline rate close to 2%. In other words not a single ICE vehicle could be sold after 2030. Not a chance.
https://ourworldindata.org/grapher/car-sales
So I think Peak Oil will have a serious impact.
Hi Iver,
I also do not know what demand or the final peak will be. The price of EVs and plugin hybrids will fall and if oil supply is short as you foresee, then oil prices would rise. Both of these trends will accelerate the transition to electric land transport. In addition heavy duty vehicles might transition to natural gas (this already occurring in China). In any case a huge amount of uncertainty on future oil output and your guess may be better than mine.
Dennis, Iver,
It’s worth keeping in mind that light vehicle mileage is much higher for new vehicles and drops quickly. 50% of Vehicle Miles Traveled come from vehicles 6 years old or less (per FHWA).
Peak ICE was back in 2016!
Iver,
I agree, but higher output would result in steeper decline later, if my guess for URR is correct. I tend to think of the World as it is.
What is your best guess for World URR for C+C?
Dennis
Is your model reserve and production based? I.E. global production increases each year based purely on URR?
Then based on URR production at some point starts to decline.
Iver,
Model is based on past discoveries and reserve growth, the average rate of development of resources, and past production and rates of extraction. URR is just a piece of the puzzle, My best guess is about 3000 Gb for URR, but it might be as high as 3500 Gb for World C+C, my best guess for NGPL URR is about 400 Gb. So for C+C+NGPL my 90% CI would be 3000 Gb to 4000 Gb. I am using 300 to 500 Gb for 90% CI for NGPL.
Obviously URR determines the area under the curve, but many different future output curves are possible for any assumed URR.
Do you have a URR in mind? When you did your 50 nation estimate with high and low cases did you come up with a total URR for low and high cases?
Iver,
My previous comment where I guessed NGPL URR (in barrels not boe) I was going by memory, I was away from my computer and misremembered. My best guess URR for World NGPL is about 640 Gb with 90% CI of 540 to 740 Gb, so the corrected World C+C+NGPL URR would be 3640 Gb for my best guess with 90% CI of 3240 Gb to 4140 Gb. Also I modified the extraction rates for my shock model under an assumption of no sanctions on Iran. Venezuela, and Russia and perhaps no political conflict in Libya and Nigeria and robust demand with all nations taking a Trumpian stance on fossil fuels.
I get the scenario below which I think might be possible in some alternate reality. I think the odds are low we would see such a scenario (maybe 1 in 100). URR remains 3000 Gb for World C+C for this modified scenario, annual decline rates about 3% per year after 2060. Chart at link below.
shock high 2511
Dennis
No I did not attempt to work out URR. I do not think I could do any better than the major energy researchers such as BP statistical review and USGS.
I was only interested in putting minimum and maximum parameters on global production.
I tried to gauge what factors are at play in the real world that would effect the production increases each year such as in IRAQ.
URR is as you say pointless by itself. Who could have predicted ISIS causing so much instability? What contracts were being signed, how long would it take to see any results?
It also provided extreme ranges of oil consumption growth. The highest production figures would cause a massive amount of spare capacity, oversupply and price collapse. Which would in turn moderate supply.
As you say, URR does not really indicate how high a peak will be or when, that is determined by the economy.
It is reasonable that the global economy would grow at a middling rate. Which required an amount of oil production that coincided with my median production values.
What my study did is showed me that people who were claiming peak oil in 2012 or 2018. Did not know what they were talking about.
As I said before 110mb/d total liquids at around 2028 to 2032 is a pretty good estimate. Or about 88mb/d of C&C.
Your high shock model looks about right for a global production limit and it will be less than that.
The conflicts we are witnessing and the corruption in so many countries reduces production and demand.
Iver,
Thanks. Your estimate seems reasonable.
Note that the only change for that “high model” (or scenario) was only a change in the assumed extraction rate for conventional PDP reserves compared to my best guess scenario.
Given the fact that there are sanctions, war, corruption, and an ongoing transition to electric land transport which has reduced World demand and has led to relatively low oil prices, I do not believe that extraction rates are likely to rise to the level of that high scenario. My “high” scenario for C+C+NGL peaks in 2032 at 107 Mb/d (uses C+C high scenario presented earlier). So fairly similar to your estimate of 110 Mb/d total liquids. Note that in 2024 other liquids and refinery processing gain was about 6.9 Mb/d, if we assume it is this same level in 2032 (and it would likely be higher), my scenario would be about 114 Mb/d for a total liquids peak in 2032.
Scenario for World C+C+NGPL at link below (add 7 Mb/d to this for a rough guess at total liquids).
C+C+NGPL
Iver,
Notice that the rise in extraction rates after 2024 in my “high” scenario is quite a bit steeper than the fall in extraction rates from 1993 to 2015. If we assumed in stead that exctraction rates rose more slowly (similar to the rate that they fell from 1993 to 2015), the resulting scenario would be different, see medium scenario below, where different future extraction rates are assumed.
shock medium
Nice post from Novilabs on Delaware Basin.
https://www.linkedin.com/posts/jorge-garzon-ph-d-00633672_top-tier-rock-doesnt-always-mean-top-tier-activity-7391485912427311104-0RcM?utm_source=share&utm_medium=member_desktop&rcm=ACoAABDV_wMB3QBPTlgD0zpWSJp3xTFeAV0uqvA
Only about 35k locations in the Permian Delaware sub-basin deliver tier 1 and tier 2 economic results due to parent/child pressure depletion. With approximately 2700 wells completed per year (the recent rate) we run out of viable locations at current completion rate in about 13 years. The Midland sub-basin runs out sooner, roughly 5 years. If we assume that after 5 years all completions(5400/year) occur in the Delaware, then we run out of Permian Tier 1 and tier 2 locations in 9 years under the assumption that low prices lead to 100 % drilling of only tier one and tier 2 locations. At low oil and gas prices the tier 3, 4 and 5 locations are probably not viable economically.
Dennis, with all due regard, the above is more apt for a comic book than a respected oil and gas blog. I don’t care what artificial intelligence tells Novilabs about the Delaware Basin, this 35,000 tier 1/2 locations is nothing but horseshit for sale by the wheelbarrow load. I mean, my god, someone has to start calling these people out on this stuff!
I made a solemn vow to refrain from writing on the Internet, but I like to read the comments–and it finally got bizarre enough that it triggered me. These days it’s okay to print some utter nonsense and say, “This came from deep neural circuits that are machine learning,” and everyone automatically thinks it somehow is smarter than reality. Here’s some reality: The robots have not reached singularity. They are “thinking” what they are told to think. And it’s catching on.
Even if this happy horseshit was some bizarre facsimile of the truth, where in the name of god would they put the produced water? In many of those Delaware wells the water cut is six times the oil yield, and NM is not about to take all that produced water, nor should they, when it would eventually wind up in Carlsbad Caverns, or maybe even the WHIPP site. This entire propaganda scheme with the Permian Basin has become laughable. Okay, carry on, I’ll go back to my cave now.
Gerry,
That reminds me: whatever happened to water recycling? Wouldn’t it be cheaper to filter (maybe even with reverse osmosis, if needed) the water and recover and re-use 3/4 of the water vs injecting all of it into disposal wells?
Gerry, I am glad you are back.
Too many people believe in the data sell companies analysis. Most have not seen an oil well let alone gotten their hands dirty. As Neils Bohr said, “predictions are never easy, especially when they involve the future”. You can do all the analysis you like but it rarely is correct, simply because the longer the look forward to more error prone the outlook becomes. We can all reasonably predict the oil production next month, but in 10 years? Moreover certain people on this blog need to read up on discounted cash flows. Like it or not, investments decisions by large companies will use this metric when looking at an investment (as well as IRR). As Mike Shellman stated would any sane person risk $10 million to get a return of $3 million over 25 years. You would do better betting on the horses.
Then we have the internet expert Nick G on frac water re-use. Ignorance hath no boundaries. The idea of treating frac water with reverse osmosis only shows a complete lack of knowledge. Saline water is not suitable for R.O treatment because of the mineral loading. As the ionic loading increases the osmotic pressure rises and the produced permeate water reduces. In most cases RO is used on brackish water not sea water and definitely not produced water.. What RO does is to split the input water into permeate and retentate streams. In most cases the retentate stream is 50-90% of the input stream. It is also not cheap as the power demand is high and the RO membranes do not last forever, and can easily scale up. Another option is multi stage flash evaporators (MSFE). These plant also have a large reject stream reject which needs to be disposed off, usually back into the sea. You course revert to evaporation ponds in which case you would have a solid salt mass to dispose of and no recovered water.
Carnot,
Is it not possible to recycle the water to be reused for fracking?
I imagine when water disposal costs rise to a high enough level that recycling may be more cost effective. I am not a chemical engineer, perhaps it is not possible, I do not know.
Gerry,
Thanks.
The Novi estimate seems more reasonable than other estimates that claim 150k or more future well locations in the Permian. So this reduces that number to perhaps 48.5k future well locations in the Permian basin, perhaps this is also too high, especially at current prices.
Gerry,
Note that recent completion rates in the Permian Basin have been about 5400 wells per year, if we assume that rate continues, how many years would you guess we have left at this rate. Let’s throw out 5 years, that would be about 27k wells at current rates, let’s assume a linear decrease to no completions 5 years after that, that would be another 14.5k wells for a total of 40.5k wells. No idea what it will actually be, depends in part on oil and natural gas and NGL prices and the cost to drill, complete, equip, and operate the wells. Also interest, taxes, royalties, and dividends need to be paid. Prediction is difficult or more accurately impossible.
Rig Report for the Week Ending November 7
The rig count drop that started in early April when 450 rigs were operating dropped again this week.
– US Hz oil rigs dropped by 3 to 366, down 84 since April 2025 when it was 450. It is also up 4 from the low of 362 in the week ending August 1. The rig count is down 19% since April.
– New Mexico Permian was unchanged at 92 while Texas dropped 1 rig to 176.
– Texas Permian was unchanged at 137 for the last 3 weeks. Midland and Martin were unchanged at 23 and 18 rigs respectively.
– In New Mexico Eddy and Lea were unchanged for the last 3 weeks at 37 and 55 respectively.
– Eagle Ford dropped 1 rig to 29.
– NG Hz rigs rose by 3 to 112.
A Rig
Frac Spread Report for the Week Ending November 7
The frac spread count dropped by 2 to 173. From one year ago, it is down 54 and down by 42 spreads since March 28.
A frac
Oil companies should be forced to properly treat and reuse all the water they use
https://www.hcn.org/articles/can-fracking-wastewater-be-reused/
Dennis:
I’m not putting down the Delaware Basin—it’s prolific and mind-boggling. I don’t really know how many Tier 1/2 drilling sites are left, but I doubt it’s half of the 35,000 range they tout. That shale is laminated quite a bit more than a lot of shales (all shales are laminated). That feature allows it to hold more oil inside its matrix, but it also causes the shale to fracture longitudinally, and from the communication of infill wells, those fractures can go a very long way out. That of course increases the oil collection perimeter for a single well, but to get away from the pressure drop that goes along with that, as well as the depletion from its long reach, the spacings need to be twice or three times what they had in mind when their AI toady came up with those figures. Try 1200′ spacings.
And seriously, some of those wells make water like crazy. I think the average water cut is now up to 60%. Somebody will learn to clean up the water enough to reuse some of it, but it’s going to be energy-dense and expensive to do, and probably only after it’s been transported to Texas.
Add to that the fact that many of the new wells in Eddy county are coming in with a 5:1 GOR selling into the WaHa hub. That hub will eventually be drained and the price of NG will go up, but when, and by how much.
Maybe it’ll happen, 35,000 Tier 1/2 wells, because the macroeconomics look good from their data. The devil is in the details, however, and my deep suspicion is that the Novilabs robot has a problem in his deep neural circuits.
Gerry
Please keep checking my four main Permian counties and provide input. Based on this month’s data, it appears we are on a plateau. Depending on the quality of the September data the plateau trend could change.
Here’s an interesting article on water reuse. It provides some cost detail, and finds that there are significant savings:
“The case for reuse (15% savings between high and low reuse approaches) is important in low drilling scenarios, most likely associated with low trading prices and margins, and tight cost controls. The case for reuse is compelling in both medium and high drilling scenarios, with price savings at 23% and 25%, respectively. However, the savings apply to vastly larger volumes of activity, resulting in a greater bottom line impact on industry profit.”
The low reuse approach is 15% of completion volumes, and the high is 85%.
https://www.hartenergy.com/exclusives/determining-true-cost-water-177877/
Black Sea Port in Flames: Russia’s $20 B Lifeline to Moscow Explodes | Rachel Maddow
I watch a lot of youtube videos. There are dozens every day on the Ukraine-Putin war. But she did and this one is a real doozie. It’s all about oil! And Ukraine has hit Putin where it hurts, in oil exports. I say Putin instead of Russia because I believe this is Putin’s war, not Russia’s. Anyway this is a fantastic video narrated by Rachel Maddow. I love that girl. Check it out if you are interested in the survival of a world without a dictator like Putin or Trump.
alternative link to video
https://youtu.be/_e6pFsbhnJs?si=89QOuSDdlDuJcf5L
IEA’s World Outlook 2025 has been published see link below, I have not read it yet, but here is a brief excerpt describing the “Stated Policies Scenario”
https://www.iea.org/reports/world-energy-outlook-2025/stated-policies-scenario
“Oil demand peaks at 102 million barrels per day (mb/d) around 2030 before gradually declining. Global electric car sales share rises from over 20% today to over 50% by 2035, despite lower electric vehicle (EV) sales in the United States in this Outlook. In 2035, over 840 million EVs displace 10 mb/d of oil, mainly in Asia and Europe. Oil use for petrochemicals and aviation continues to increase to 2035 and 2050. Natural gas demand increases nearly 1% annually to 2035, supported by abundant supply and major liquefied natural gas (LNG) expansions in the United States and Qatar, then levels off. Coal demand peaks before 2030 as declines in China outweigh increases in India and Southeast Asia. “
Predictions 😂
https://www.reuters.com/sustainability/boards-policy-regulation/world-oil-gas-demand-could-grow-until-2050-iea-says-2025-11-12/
They are covering their backsides by predicting every possible scenario. They actually get paid for this.
Iver,
These are scenarios, not forecasts nor predictions. They make a set of assumptions about what might happen and show what needs to occur to make that a reality. As far as what actually happens in the future, that cannot be known in advance, doesn’t matter how much money is paid, what is unknown remains so.
An update for World Oil Production has been posted.
https://peakoilbarrel.com/july-world-oil-production-new-all-time-high/
just ran into this link by TGS weekly report that Uinta has its newly tapped shallower stack, Douglas Creek, actually higher EUR at >600KBO than the deeper 2 stakes at <500KBO.
https://www.tgs.com/weekly-spotlight/2024-11-18
This is amazing that the the shallower stack which has obviously lower GOR and API(higher density) could produce so amazingly, and validate my Low-GOR-Black-Shale Oil advantage model.
But, somehow, the production in Utah has not picked up yet, and probably due to transportation issues.