By Ovi
All of the Crude plus Condensate (C + C) production data, oil, for the US state charts comes from the EIAʼs Petroleum Supply monthly PSM which provides updated production information up to April 2025.
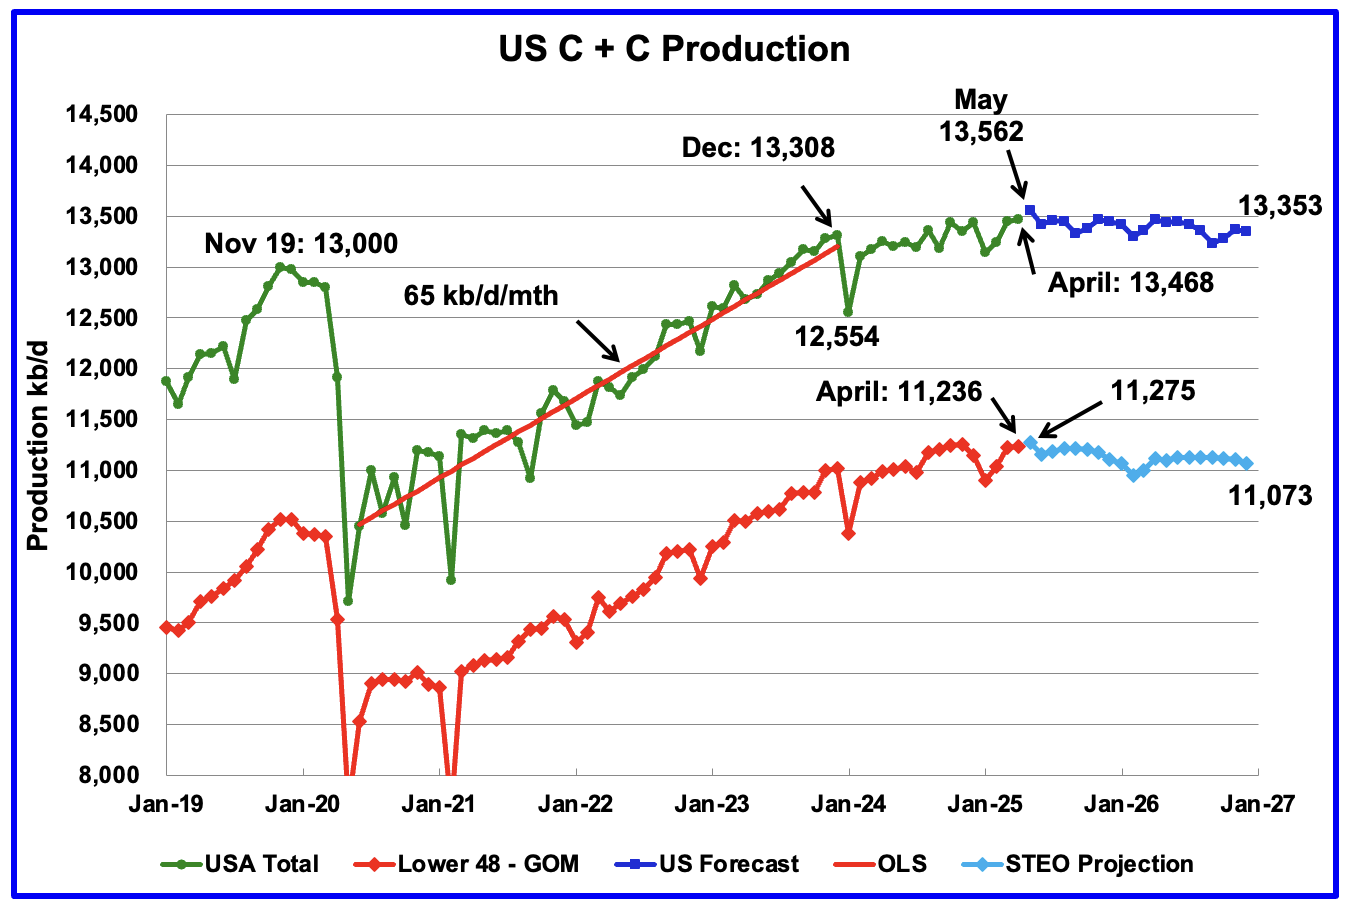
U.S. April oil production increased by 18 kb/d to 13,468 kb/d, a new high. The largest increase came from Texas offset by a large drop in New Mexico.
Production in May is expected to increase by 94 kb/d to 13,562 kb/d, another new high.
The dark blue graph, taken from the June 2025 STEO, is the U.S. oil production forecast from May 2025 to December 2026. Output for December 2026 is expected to reach 13,353 kb/d, revised down by 86 kb/d from last month. From April 2025 to December 2026 U.S. production is expected to drop by 115 kb/d kb/d.
The light blue graph is the STEO’s projection for output to December 2026 for the Onshore L48. April’s Onshore L48 production rose by 10 kb/d to 11,236 kb/d. From April 2025 to December 2026 production is expected to decrease by 163 kb/d to 11,073 kb/d. December 2026 production was revised down by 121 kb/d from last month. Note how production starts declining after May 2025 to December 2026.
U.S. Oil Production Ranked by State
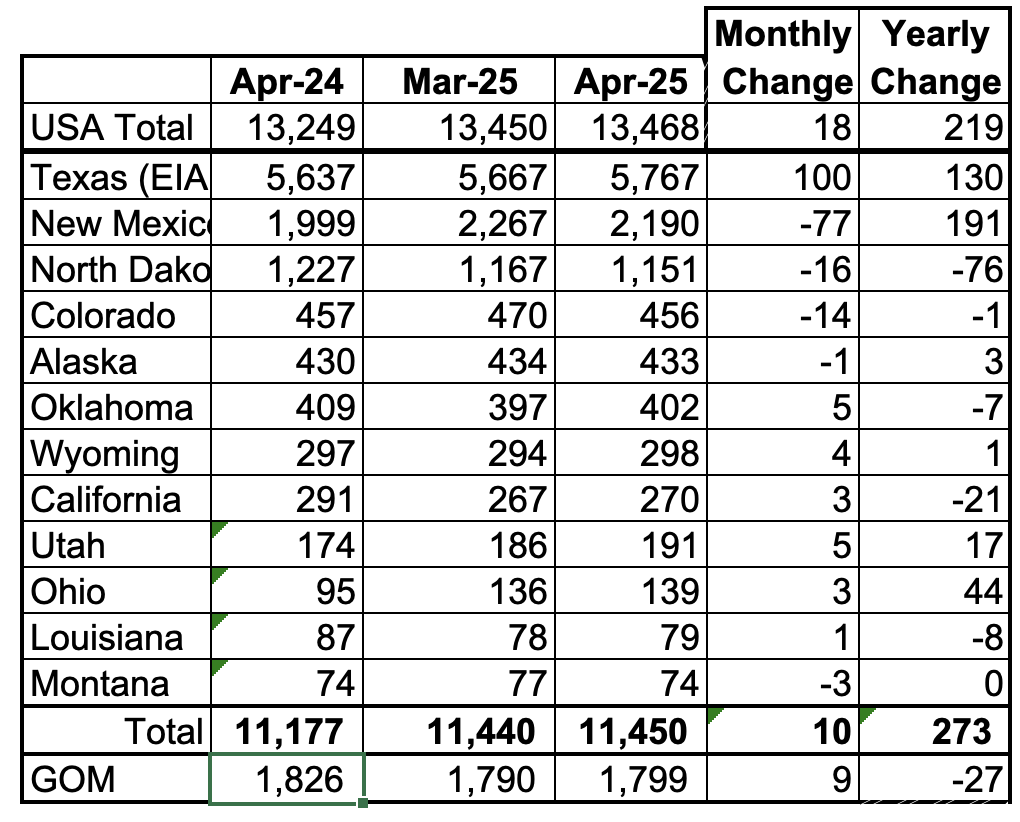
Listed above are the 12 US states with the largest oil production along with the Gulf of Mexico. Montana was added to this table a few months back since its production exceeded Louisiana’s production and we wish to keep tracking Louisiana.
These 12 states accounted for 85.0% of all U.S. oil production out of a total production of 13,468 kb/d in April 2025. On a MoM basis, April oil production in these 12 states rose by 10 kb/d. On a YoY basis, US production increased by 219 kb/d with the biggest contributors being New Mexico and Texas.
State Oil Production Charts
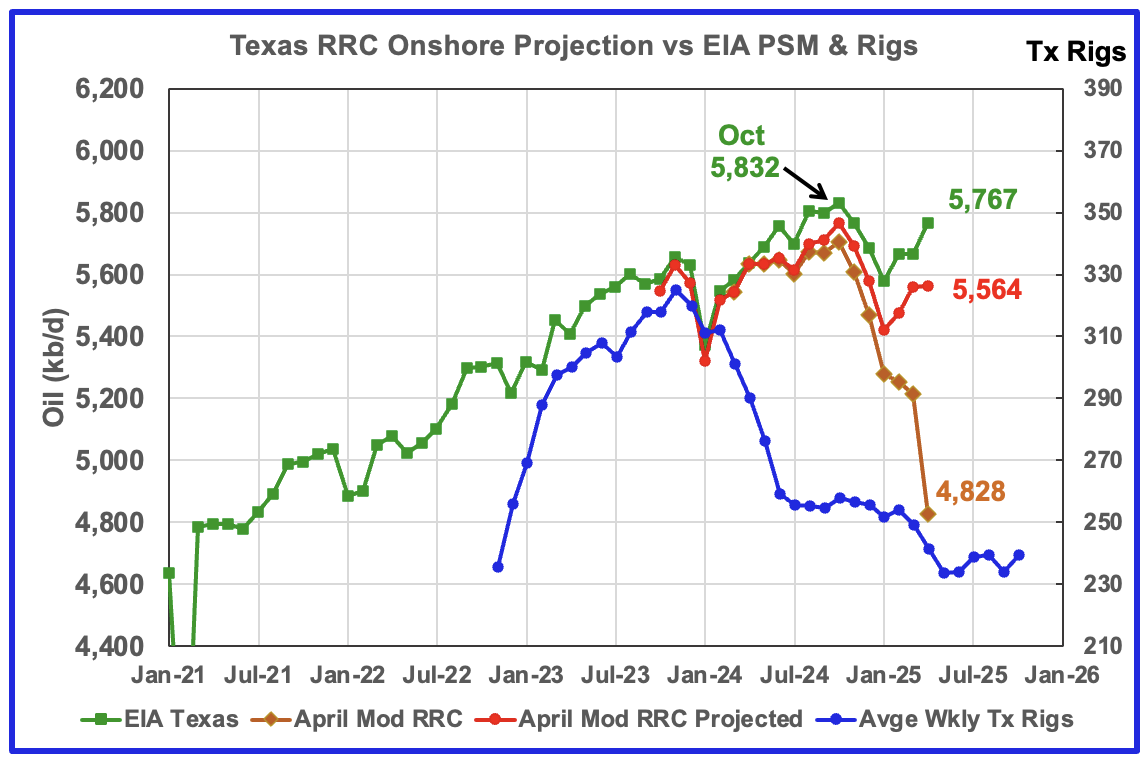
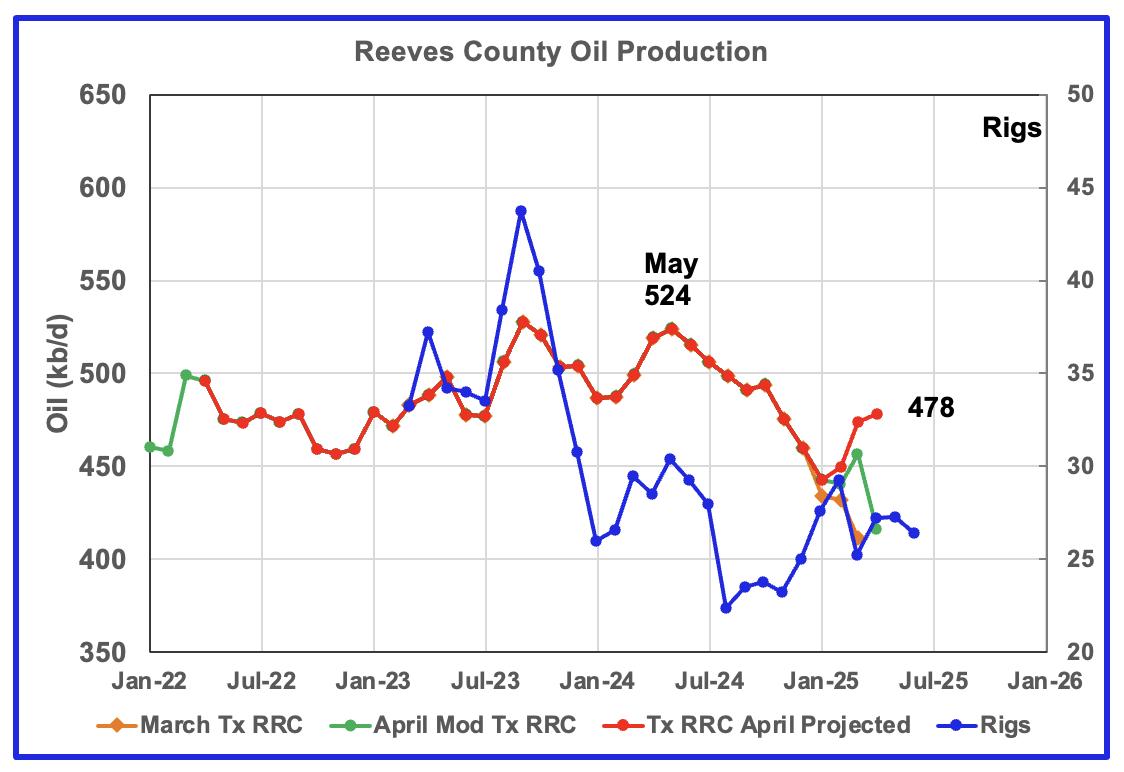
April’s production increased by 100 kb/d to 5,767 kb/d. However March was revised lower from the previous report from 5,711 kb/d to 5,667 kb/d, a downward revision of 44 kb/d. Could April also be an over estimated production figure?
Texas production dropped from October to January. The drop could be related to the drop in completions that started in October while the January drop was a combination of cold weather and low completions. However production in February, March and April has rebounded but is still 65 kb/d lower than October 2024.
The red graph is a production projection using some March and April Texas RRC data. Due to more production revisions and errors in the overall Texas data, the projection is a modification of the normally used methodology. See next chart. Regardless the projection trend follows the EIA’s production up to March but not for April, due to the large drop in the April’s RRC preliminary production.
The blue graph shows the average number of weekly rigs reported for each month, shifted forward by 10 months. So the 276 rigs operating in July 2023 have been shifted forward to May 2024. From February 2024 to July 2024, the rig count dropped from 312 in time shifted February 2024 to 256 in July 2024. That drop of 56 rigs had no impact on production up to August 2024 but November was the first month when the impact of the rig drop on oil production started to show up along with fewer completions. The rising production after January is difficult to explain.

Note the huge increase in the revised December 2024 oil production for Reeves county. The 2025 Reeves data is the more typical monthly production level. This increase also affects the overall Texas and District 8 production. The Texas production projection is a combination of the 2025 data and a correction to the 2025 Texas production. The Texas RRC has been made aware of this anomaly.
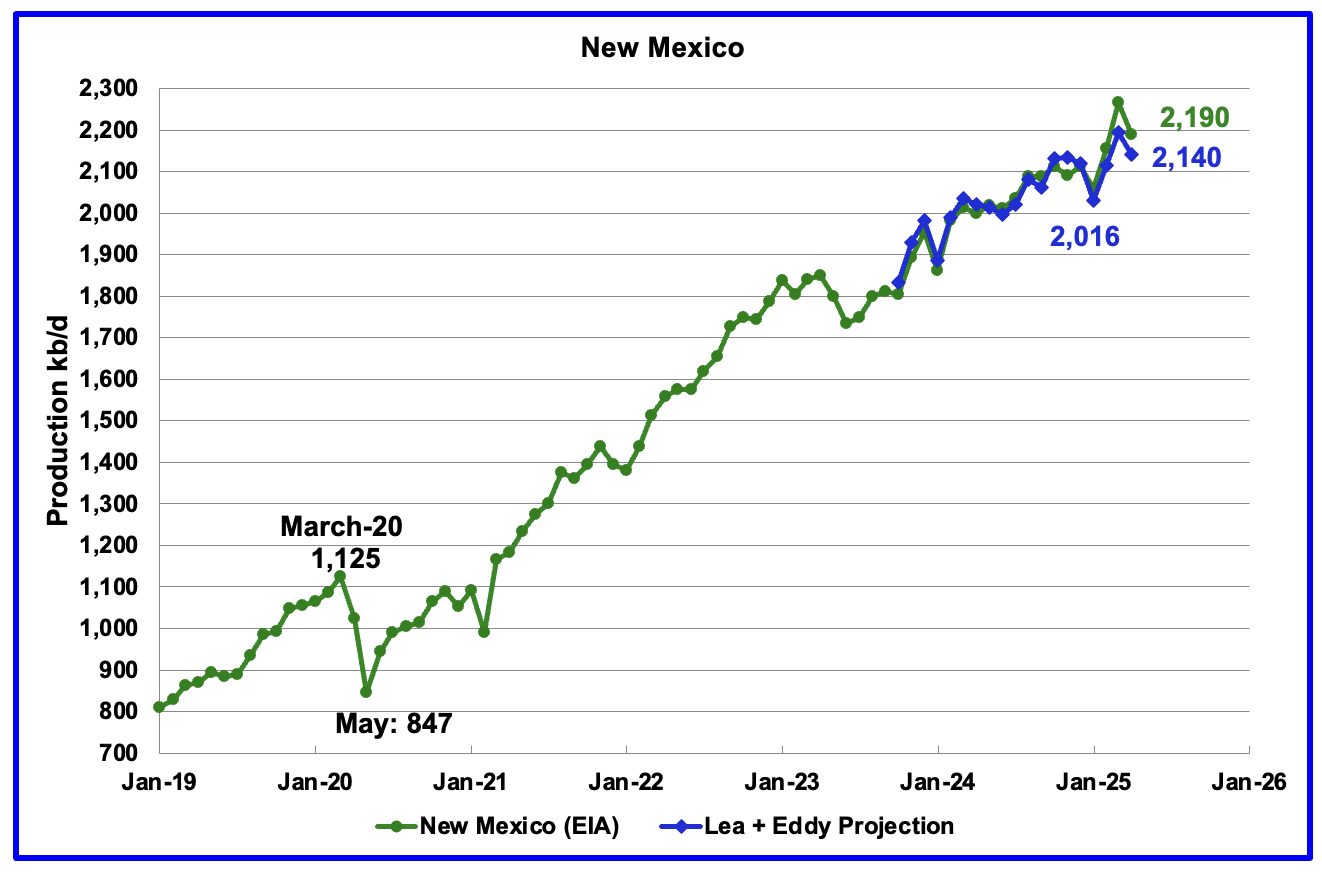
According to the EIA, New Mexico’s April production dropped by 77 kb/d to 2,190 kb/d.
The blue graph is a production projection for Lea plus Eddy counties. These two counties account for close to 99% of New Mexico’s oil production. The difference between the March and April preliminary production data provided by the New Mexico Oil Conservation Division was used to make the projection. A 1% correction was added to the Lea plus Eddy production projection to account for their approximate fraction of New Mexico’s oil production. The methodology used for projecting New Mexico production is identical to that typically used for Texas.
The projection estimates April production was 2,140 kb/d a decrease 55 kb/d from March. The decrease is related to April production decreases in both Eddy and Lea counties and is discussed further down in the Permian section.
More oil production information for a few Texas and New Mexico counties is reviewed in the special Permian section further down.
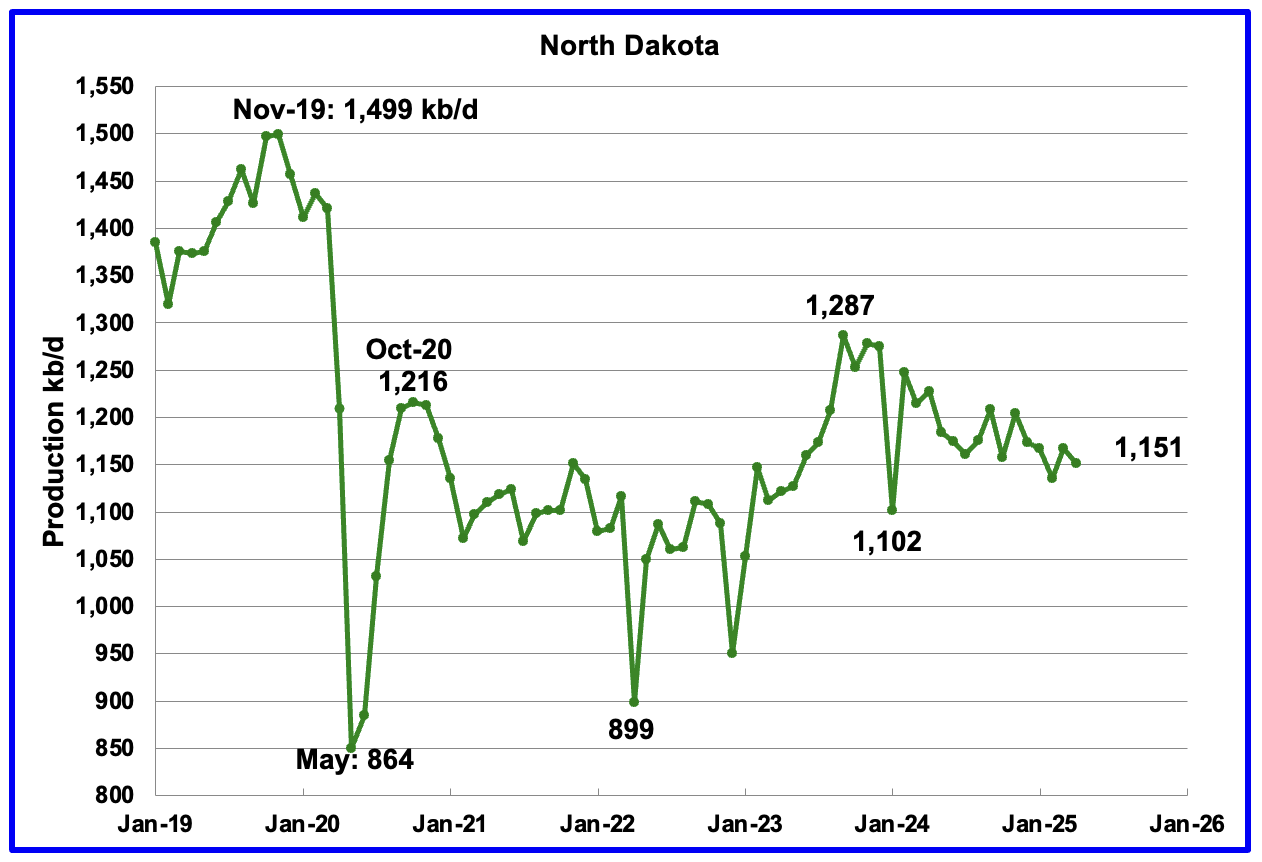
April’s output dropped by 16 kb/d to 1,151 kb/d. Production is down by 136 kb/d from the post pandemic peak of 1,287 kb/d. The North Dakota Department of Mineral resources reported April production dropped by 21 kb/d to 1,172 kb/d, which is 21 kb/d higher than the EIA’s.
According to this Article McKenzie County produced 32% of North Dakota’s oil.
“Of the top five counties (McKenzie, Dunn, Mountrail, Williams and Divide) for oil production, Anderson said, “McKenzie County actually strengthened a little bit to 32% of North Dakota production coming out of that county.” He said the top five counties produce 97.5% of the state’s oil production.”
“Anderson said the number of wells permitted in the state remains really strong with 105 in May, 108 in April and 94 in March.”
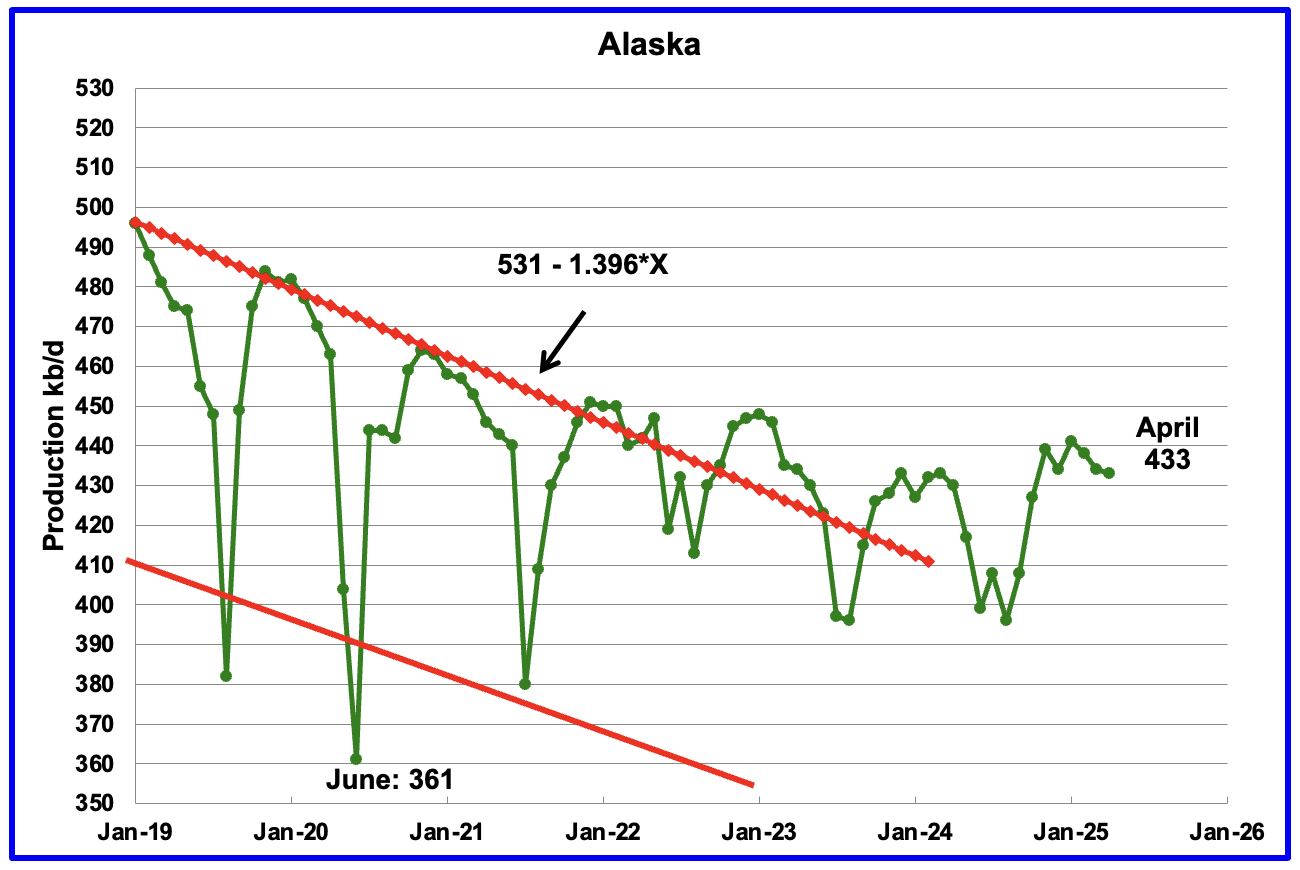
Alaskaʼs April output dropped by 1 kb/d to 433 kb/d while YoY production increased by 3 kb/d. The steady production close to 435 kb/d over the last five months is an indication that production for the next few months will be on a plateau after summer maintenance.
Alaska has recently brought new fields online to consistently have flat YoY and monthly production gains which have broken away from the earlier dropping production red trend lines.
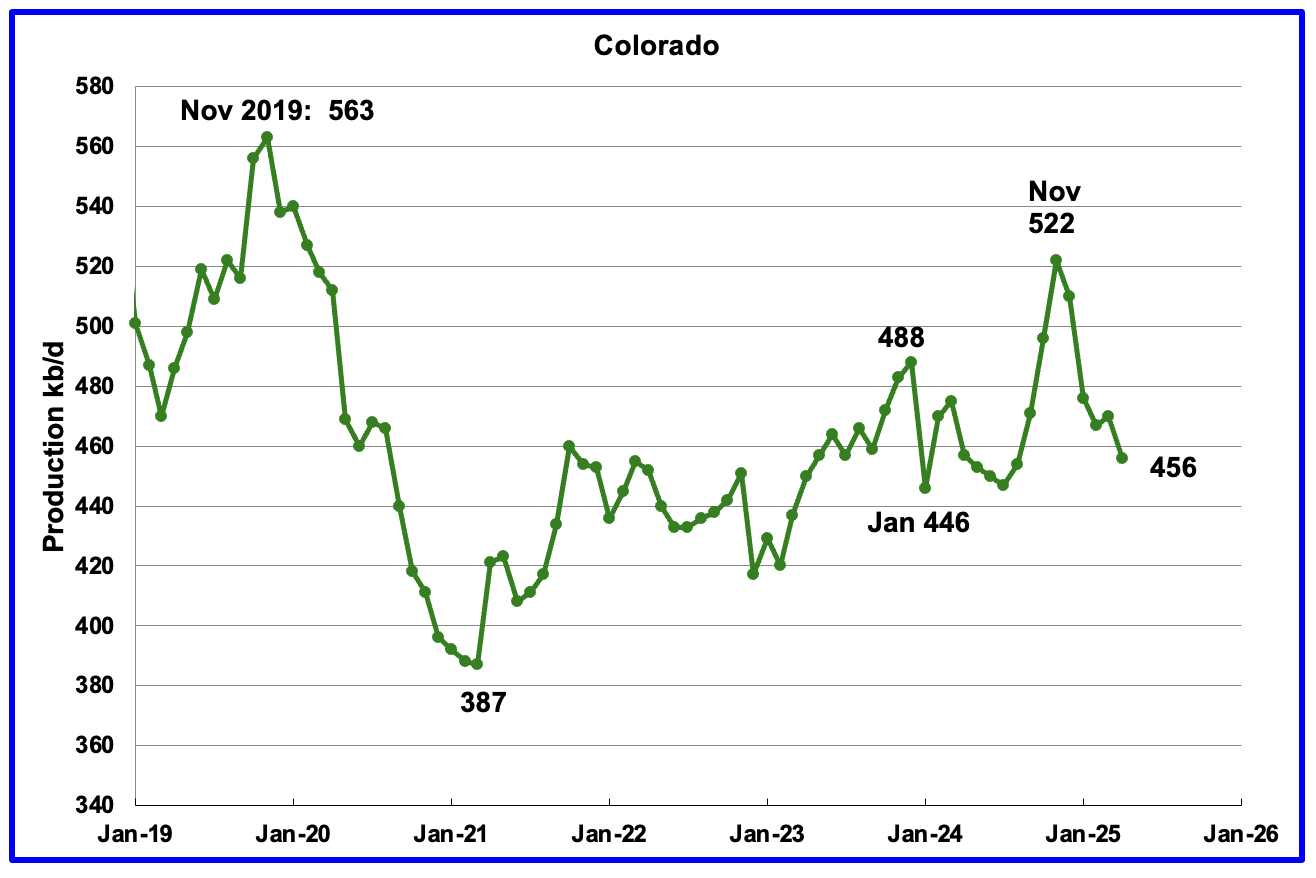
Coloradoʼs April oil production dropped by 14 kb/d to 456 kb/d.
In August 2024, Colorado had 10 rigs operating and ended the year with 7. Colorado began 2025 with 7 rigs in January and February and then dropped to 5 in March/April/May. In late June the rig count increased to 7.
It should be noted that Colorado drillers are facing increasingly stricter environmental rules according to this Article which could be reducing drilling locations.
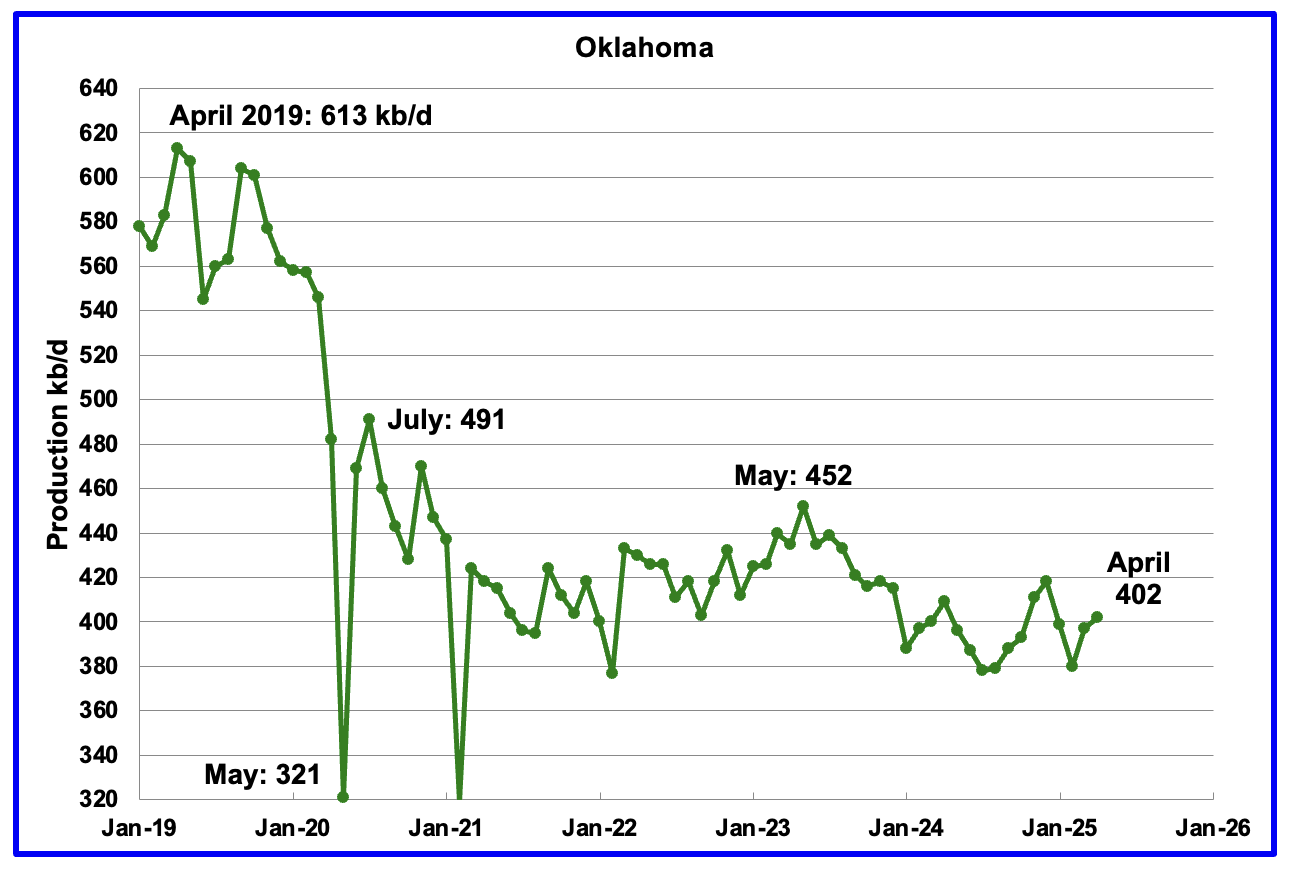
Oklahoma’s output in April rose by 5 kb/d to 402 kb/d. Production remains below the post pandemic July 2020 high of 491 kb/d and is down by 50 kb/d since May 2023. Output entered a slow declining phase in June 2023 and now appears to be range bound around 400 kb/d
In May Oklahoma had 51 operational rigs. However by late June the number had dropped to 43.
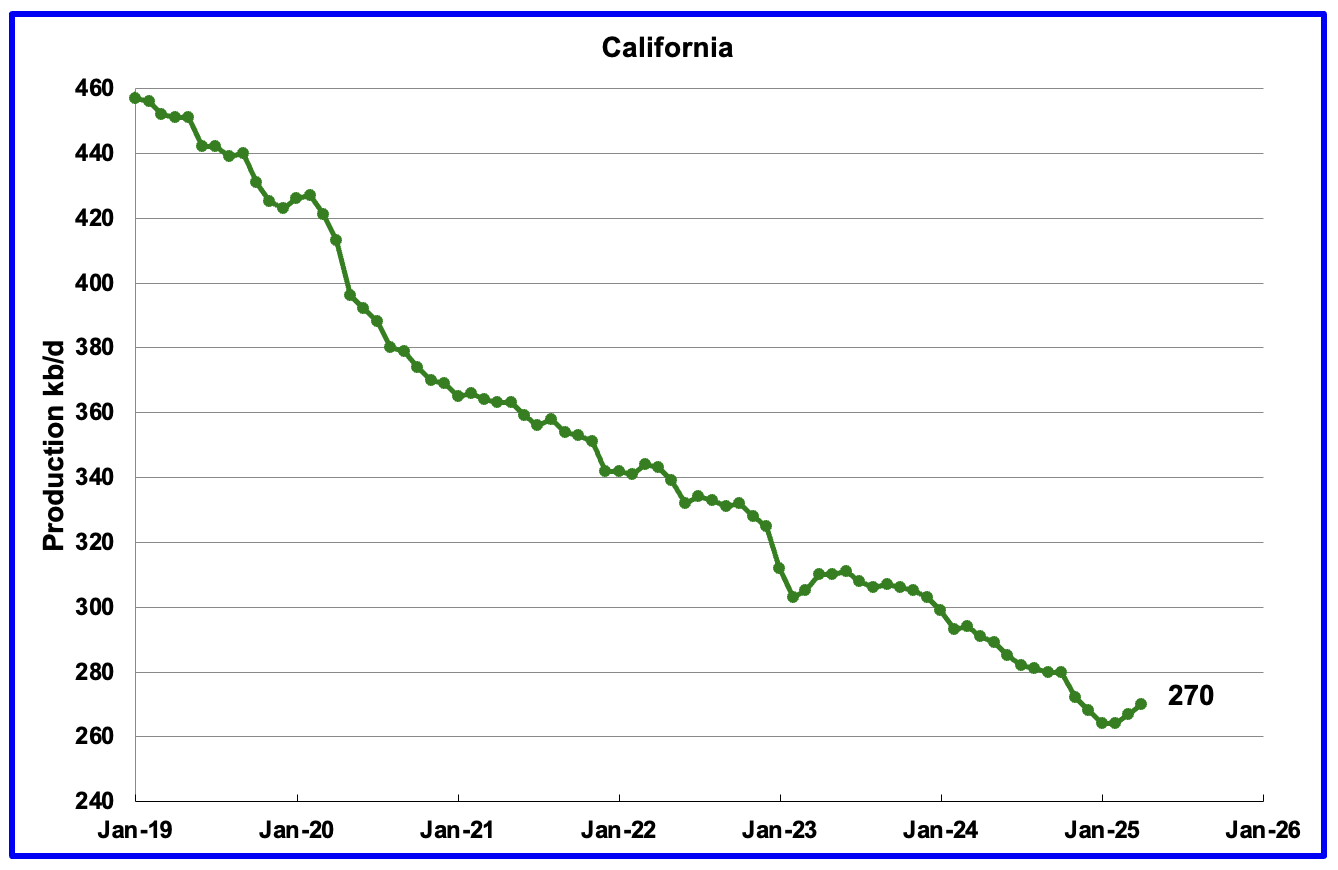
California’s overall declining production trend continues but April saw a small increase to 270 kb/d.
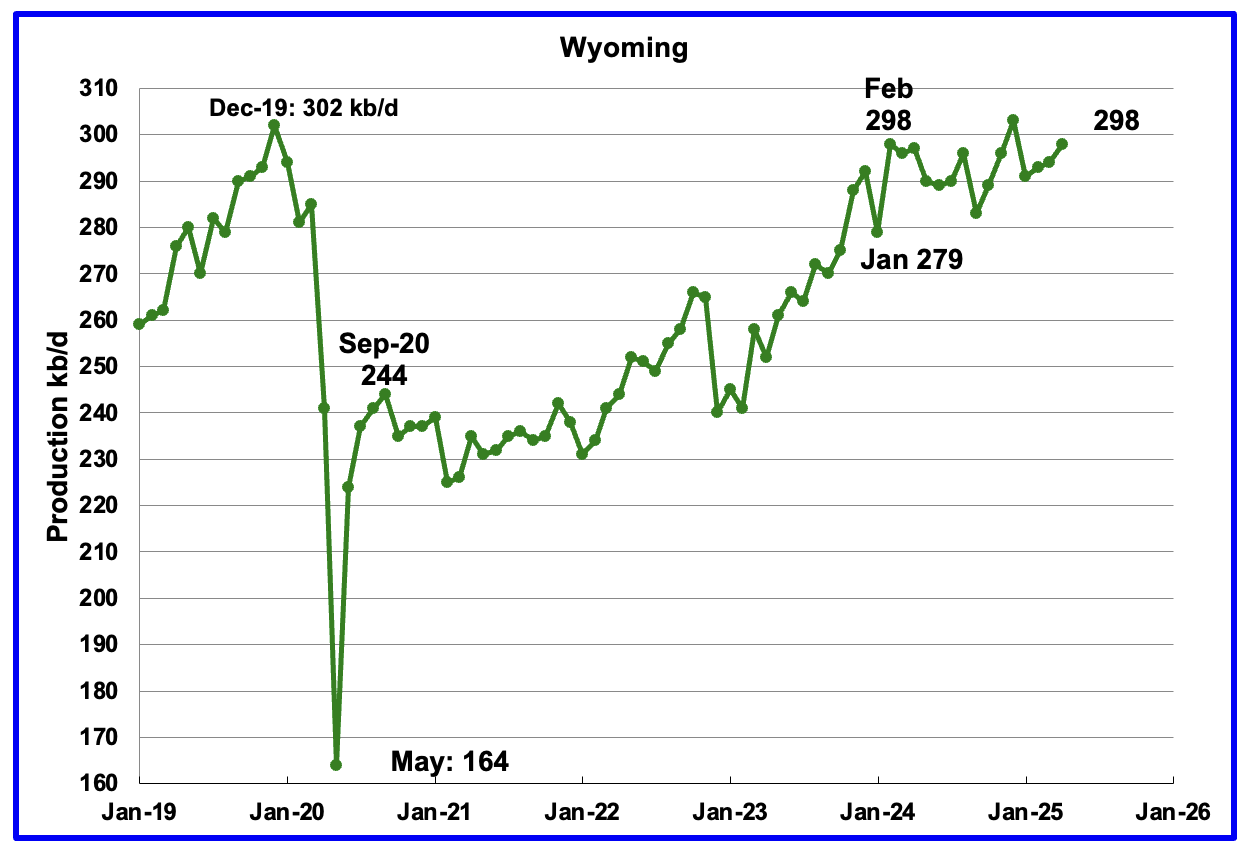
Wyoming’s oil production has been rebounding since March 2023. However the rebound was impacted by the January 2024 storm. Production reached a post pandemic high in February 2024 and appears to have entered a plateau phase. April’s production rose by 4 kb/d to 298 kb/d.
In August 2024 Wyoming had 8 operational rigs. The rig count has slowly risen to 14 from November to January 2025 and to 15 in May/June.
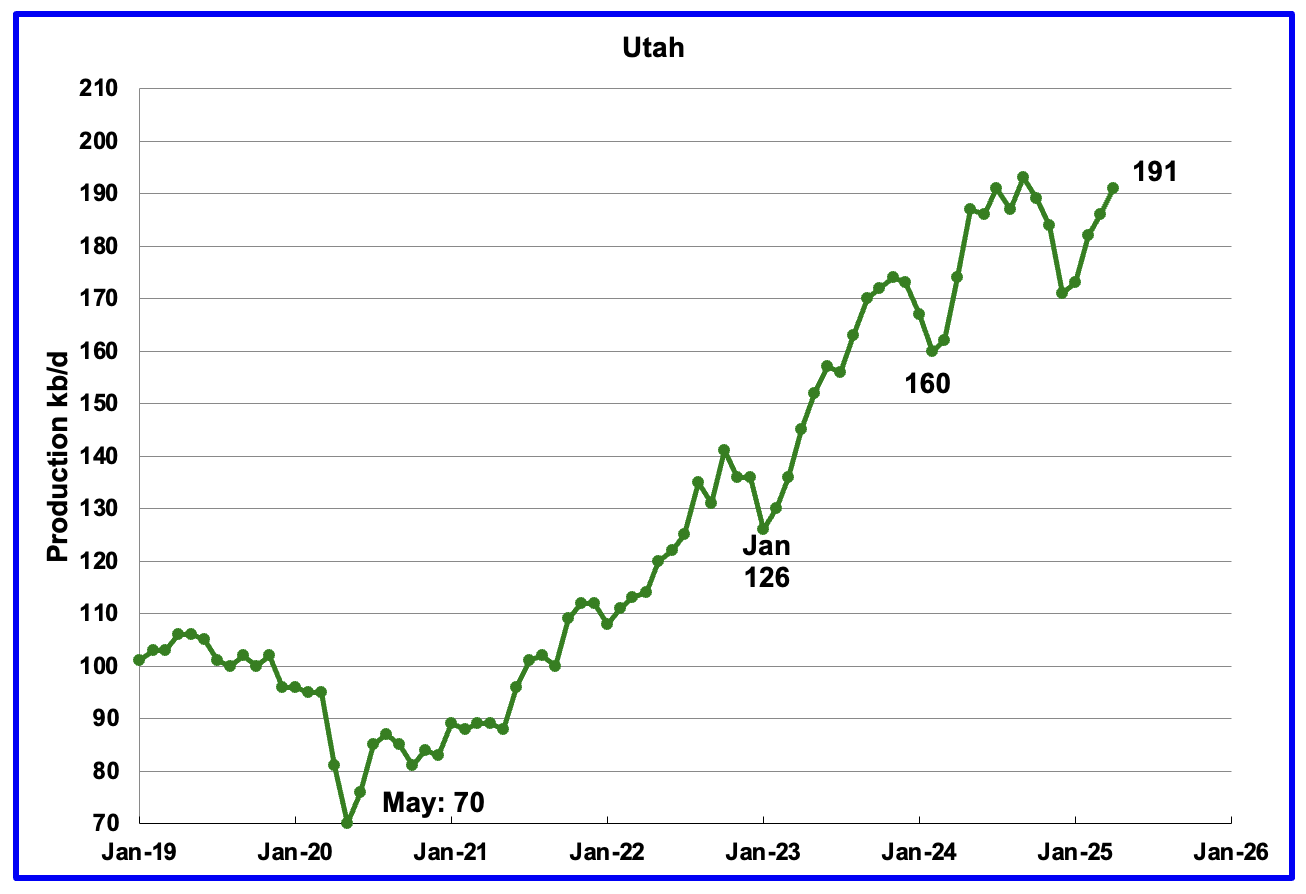
April’s production increased by 5 kb/d to 191 kb/d. Utah had 8 rigs operating from October 2025 through May 2025 but dropped to 7 in June.
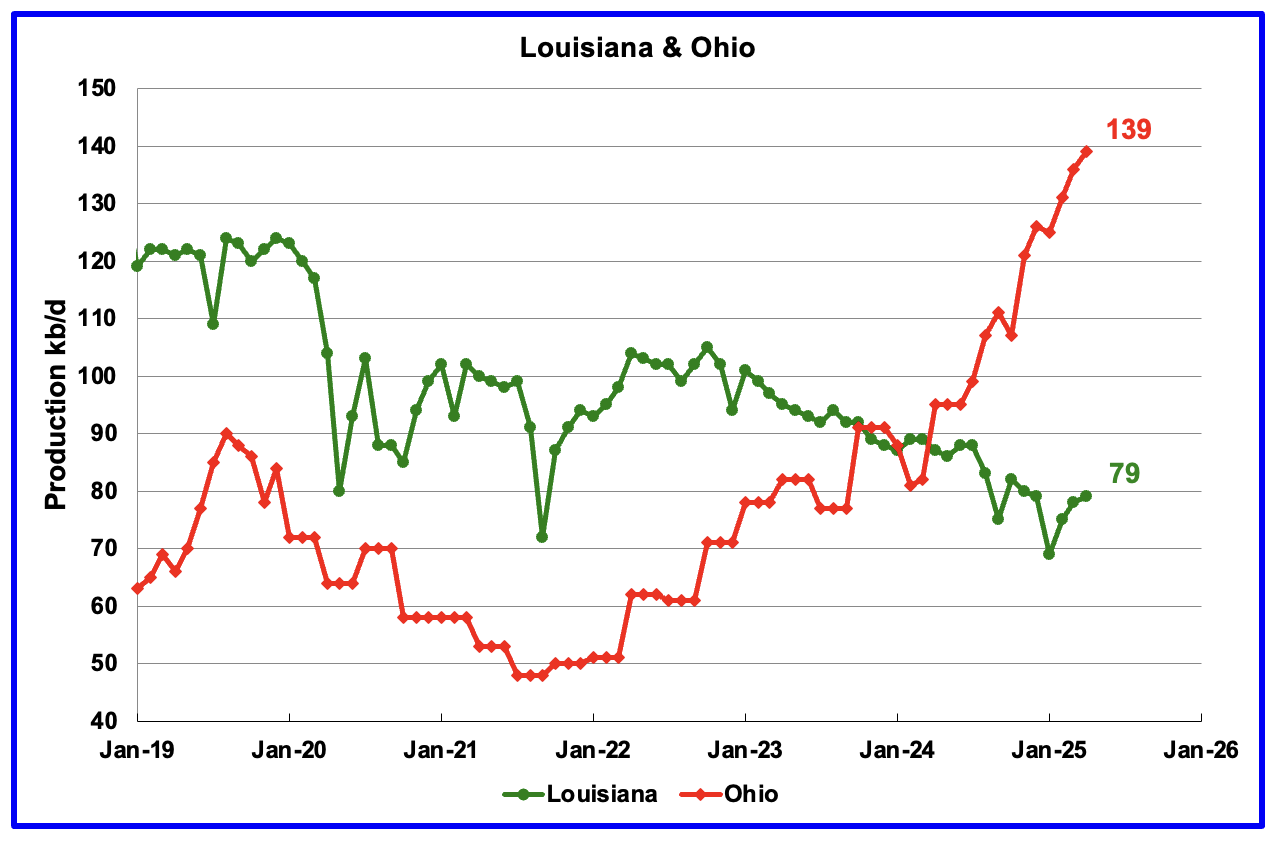
Ohio has been added to the Louisiana chart because Ohio’s production has been slowly increasing since October 2021 and passed Louisiana in November 2023.
Louisiana’s output entered a slow decline phase in October 2022 and continues to fall but recovered a bit after January 2025. April’s production rose by 1 kb/d to 79 kb/d. As of all of 2025, there are no oil rigs operating in Louisiana.
Ohio’s April oil production increased by 3 kb/d to 139 kb/d, a new record high. The most recent Baker Hughes rig report shows no oil rigs operating in Ohio. They have all been re-classified to NG rigs.
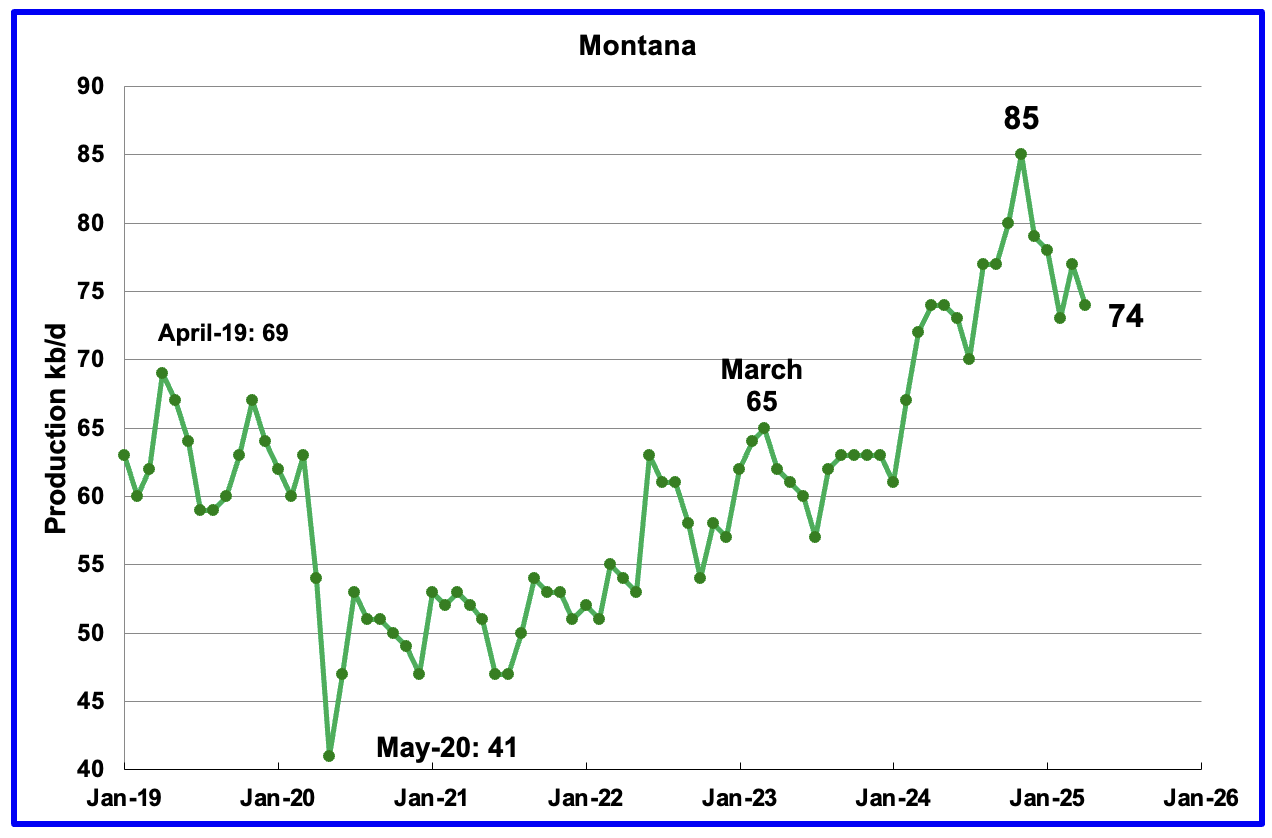
April’s oil production dropped by 3 kb/d to 74 kb/d. Montana had one oil rig operating from December 2024 through May 2025. Two rigs were operating at the end of June.
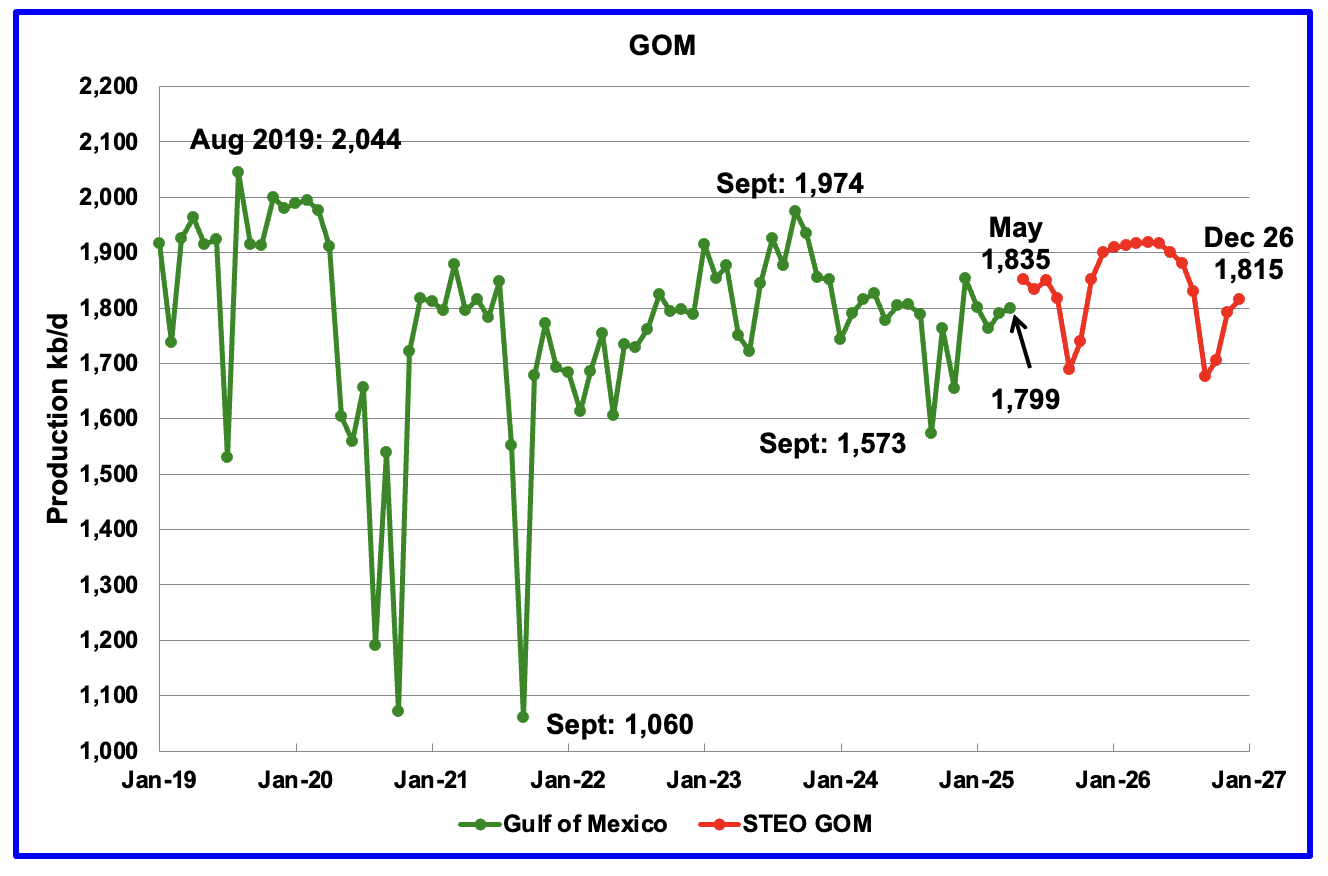
GOM production rose by 9 kb/d in April to 1,799 kb/d. May’s production is projected to rise to 1,835 kb/d.
The June 2025 STEO projection for the GOM output has been added to this chart. It projects production in December 2026 will be 20 kb/d lower than May 2025 at 1,815 kb/d.
A Different Perspective on US Oil Production
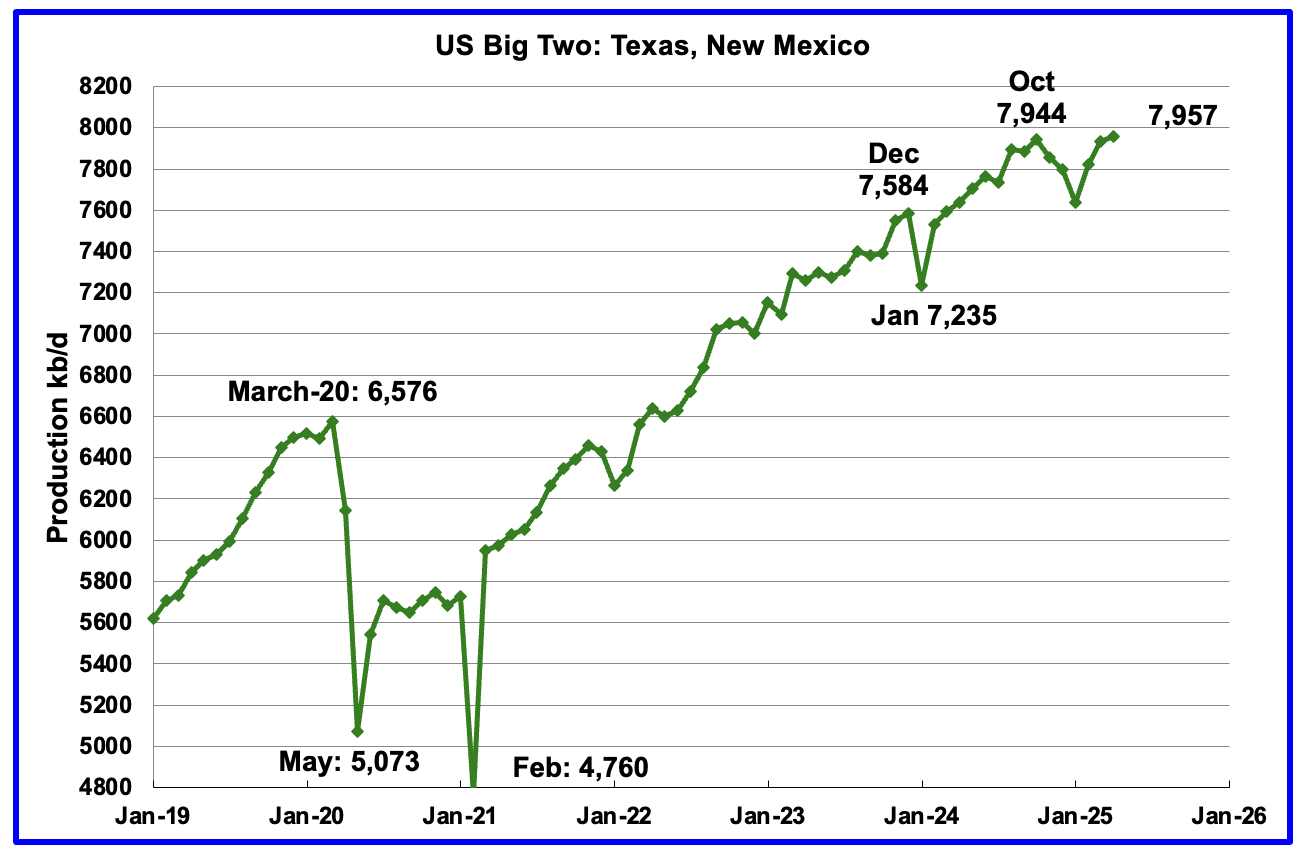
Combined oil output for the Big Two states Texas and New Mexico.
April’s production in the Big Two states increased by a combined 23 kb/d to 7,957 kb/d, a new high, and is 13 kb/d higher than October 2024. Clearly these two states were the drivers of US oil production growth up to October 2024. Will the rising trend slow in the next few months?
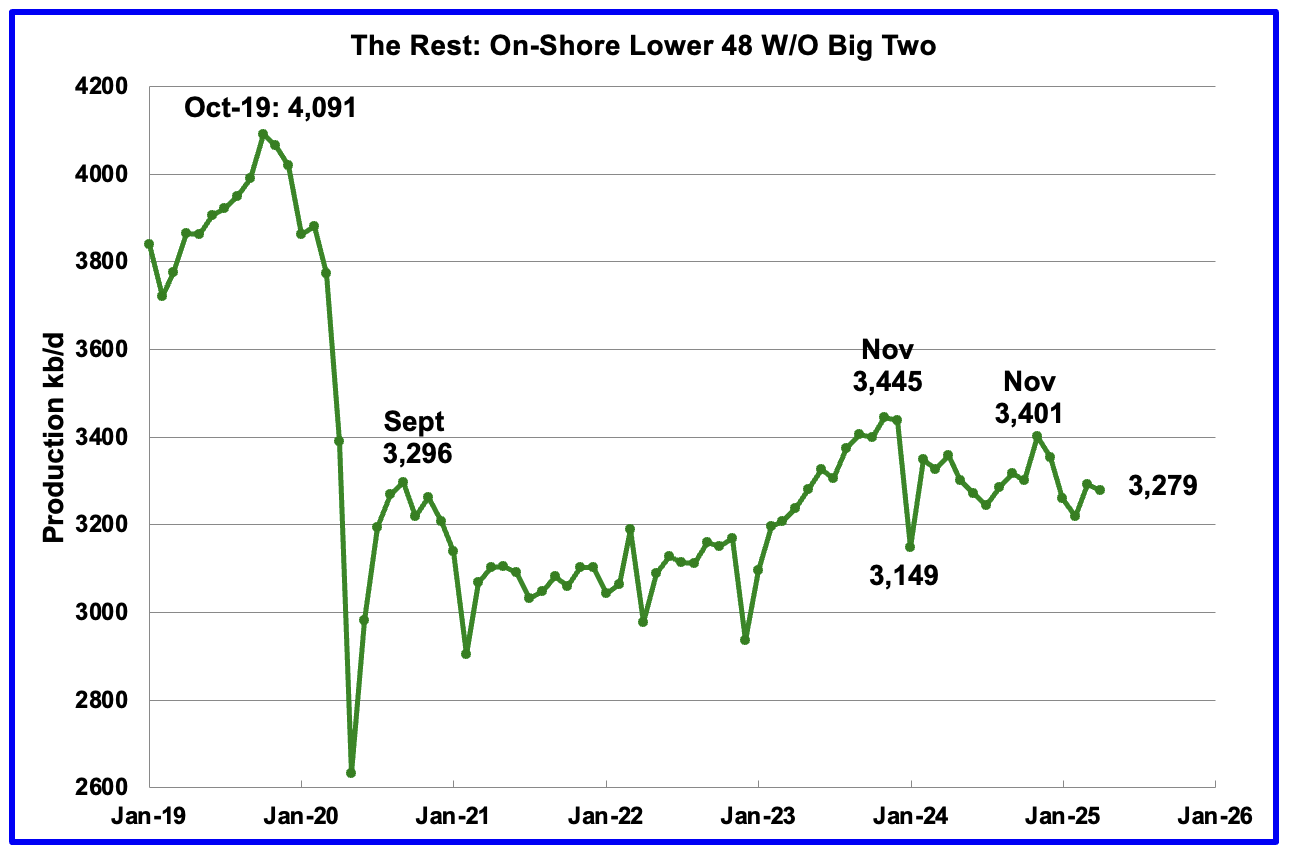
Oil Production by The Rest
April’s oil production by The Rest dropped by 13 kb/d to 3,278 kb/d and is 166 kb/d lower than November 2023.
Permian Basin Report for Main Counties and Districts
This special monthly Permian section was added to the US report because of a range of views on whether Permian production will continue to grow or will peak over the next year or two. The issue was brought into focus many months back by two Goehring and Rozencwajg Reports and Report2 which indicated that a few of the biggest Permian oil producing counties were close to peaking or past peak. Also comments by posters on this site have similar beliefs from hands on experience.
This section will focus on the four largest oil producing counties in the Permian, Lea, Eddy, Midland and Martin. It will track the oil and natural gas production and the associated Gas Oil Ratio (GOR) on a monthly basis. The data is taken from the state’s government agencies for Texas and New Mexico. Typically the data for the latest two or three months is not complete and is revised upward as companies submit their updated information. Note the natural gas production shown in the charts that is used to calculate the GOR is the gas coming from both the gas and oil wells.
Of particular interest will be the charts which plot oil production vs GOR for a county to see if a particular characteristic develops that indicates the field is close to entering or in the bubble point phase. While the GOR metric is best suited for characterizing individual wells, counties with closely spaced horizontal wells may display a behaviour similar to individual wells due to pressure cross talking . For further information on the bubble point and GOR, there are a few good thoughts on the intricacies of the GOR in an earlier POB comment and here. Also check this EIA topic on GOR.
New Mexico Permian
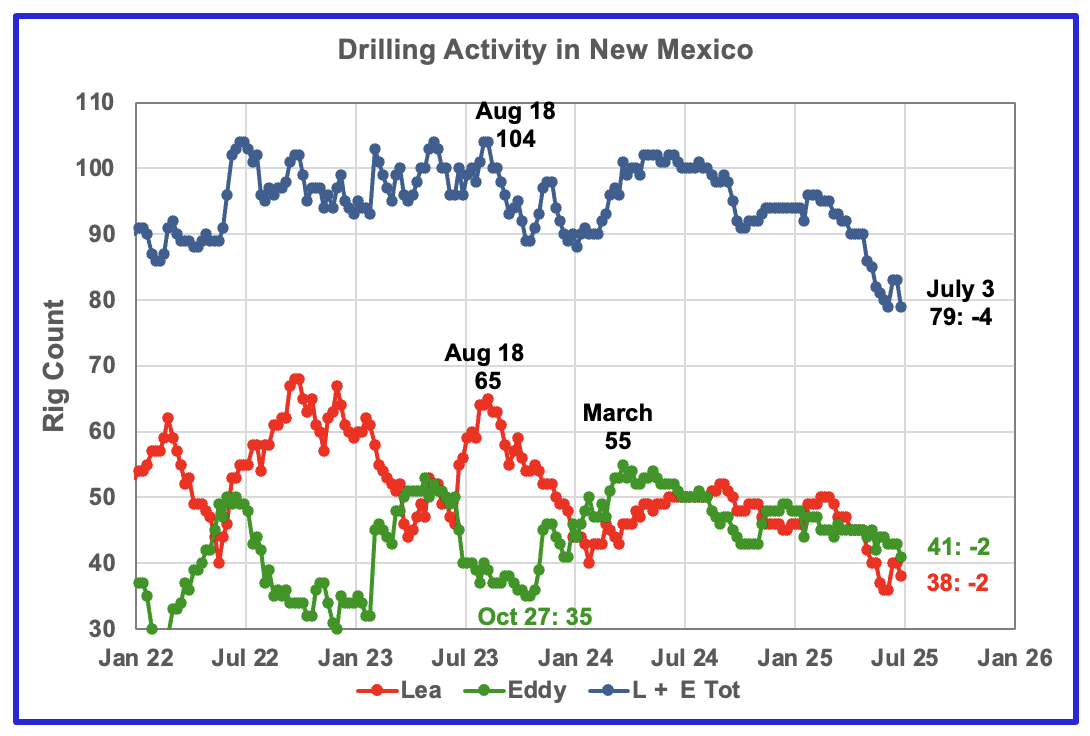
The total rig count in Lea and Eddy counties in the week ending July 3 was 79 down 15 from the January 2025 count of 94. The total rig count began to drop May and accelerated in June.
Eddy county rigs stabilized close to 45 in May but then began a slow drop and hit the current and recent low of 41 at the beginning of July. Lea has dropped from 50 at the beginning of March to 38 at the beginning of July.
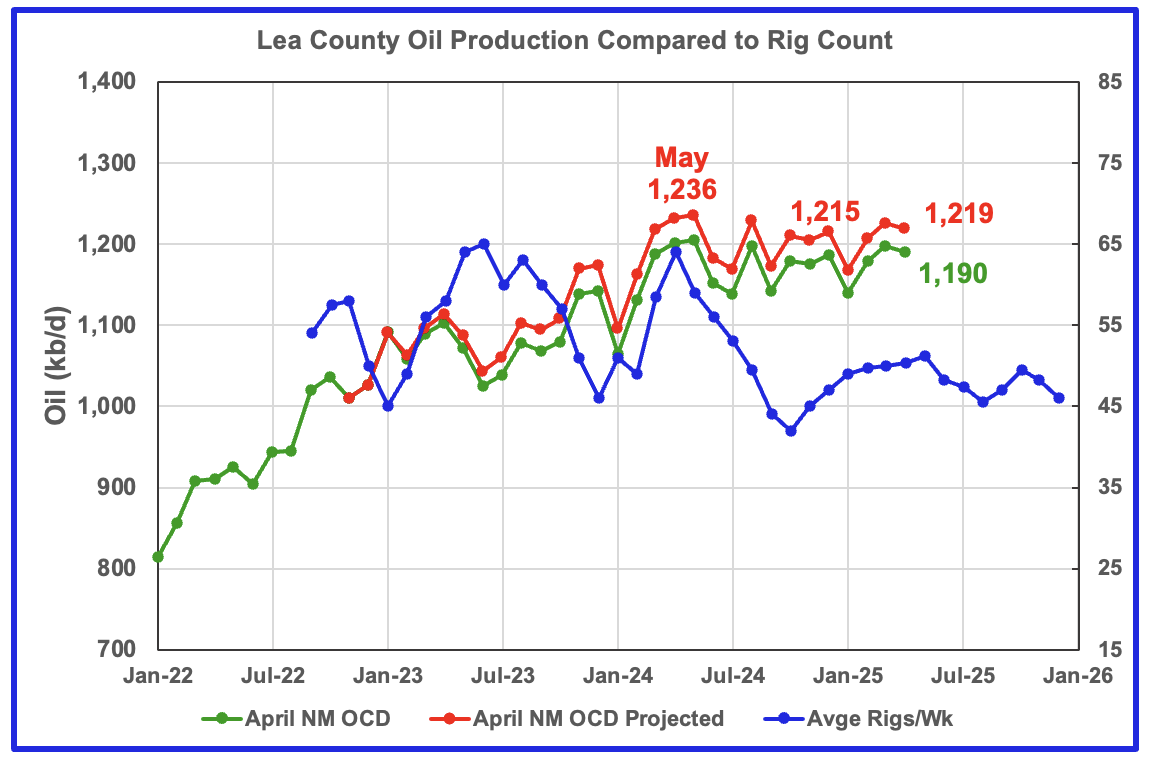
Lea County’s oil production entered a plateau phase in May 2024 at 1,236 kb/d and the plateau continues into April. April’s projected output dropped by 7 kb/d to 1,219 kb/d. Preliminary April data from New Mexico’s Oil Conservation Division (OCD) indicates Lea County’s oil production decreased by 7 kb/d to 1,190 kb/d.
Production has been essentially flat to slightly down since May 2024 as the rig count fell. April’s production fall is still a continuation of the slow declining plateau phase that started in May 2024 and is another indication that Lea County production has peaked or is very close to peaking.
The rising rig count starting in January 2025 may be contributing to the slowing decline in this plateau phase. The writing on the wall is saying that Lea County is very close to peak production.
The blue graph shows the average number of weekly rigs operating during a given month as taken from the weekly rig chart. The rig graph has been shifted forward by 8 months. So the 64 Rigs/wk operating in August 2023 have been time shifted forward to April 2024 to show the possible correlation and time delay between rig count, completion and oil production.
Note that rig counts are being used to project production as opposed to completions because very few extra DUCs are being completed at this time.
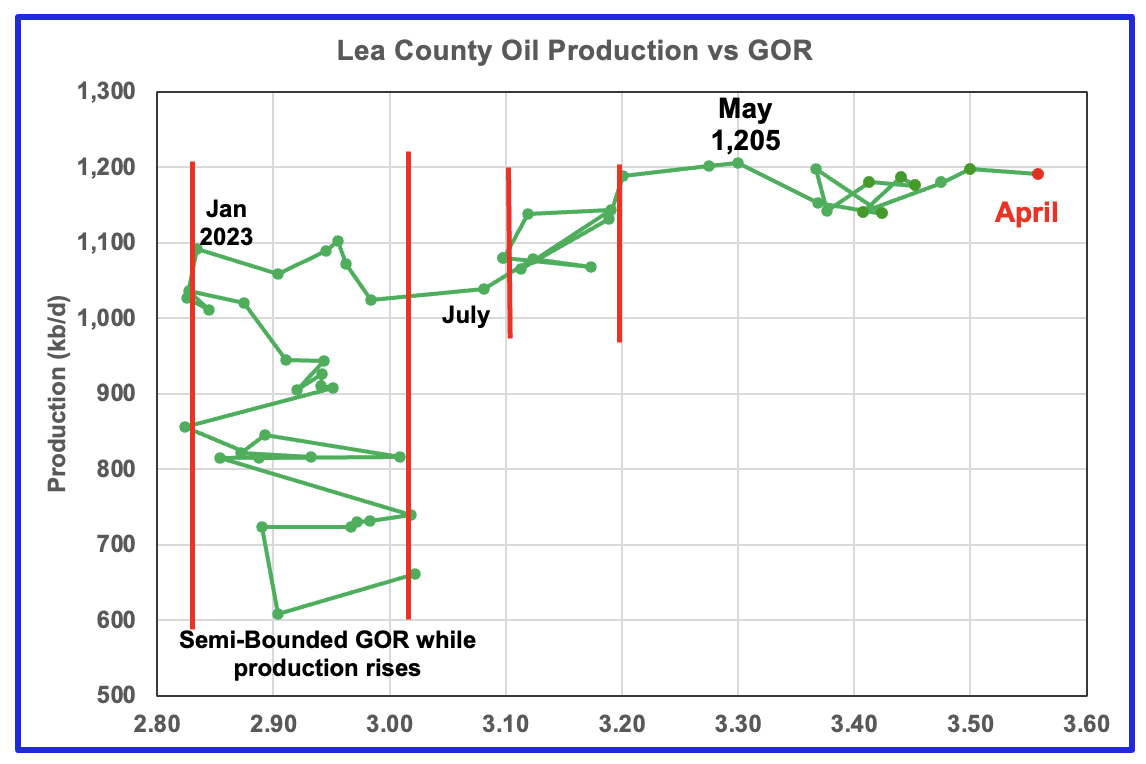
After much zigging and zagging, oil production in Lea county stabilized just below 1,100 kb/d in early 2023. Once production reached a new high in January 2023, production appeared to be on a plateau while the GOR started to increase rapidly to the right and entered the bubble point phase in July 2023.
Since July 2023 Lea County’s production continued to increase as the GOR remained within a second semi-bounded region. This may indicate that additional production was coming from a new field/area since the GOR’s behaviour since August 2023 to March 2024 time frame appears once again to be in a semi bounded GOR phase accompanied with rising production.
The GOR moved out of the second semi-bounded GOR region in April 2024 and production hit a new high of 1,205 kb/d in May 2024. Since July 2024 the GOR has been range bound between 3.35 and 3.45 but April saw the GOR increase to a new high of 3.56 while the production dropped slightly.
This zigging and zagging GOR pattern within a semi-bounded GOR while oil production increases to some stable level and then moves out to a higher GOR to the right has shown up in a number of counties. See a few additional cases below.
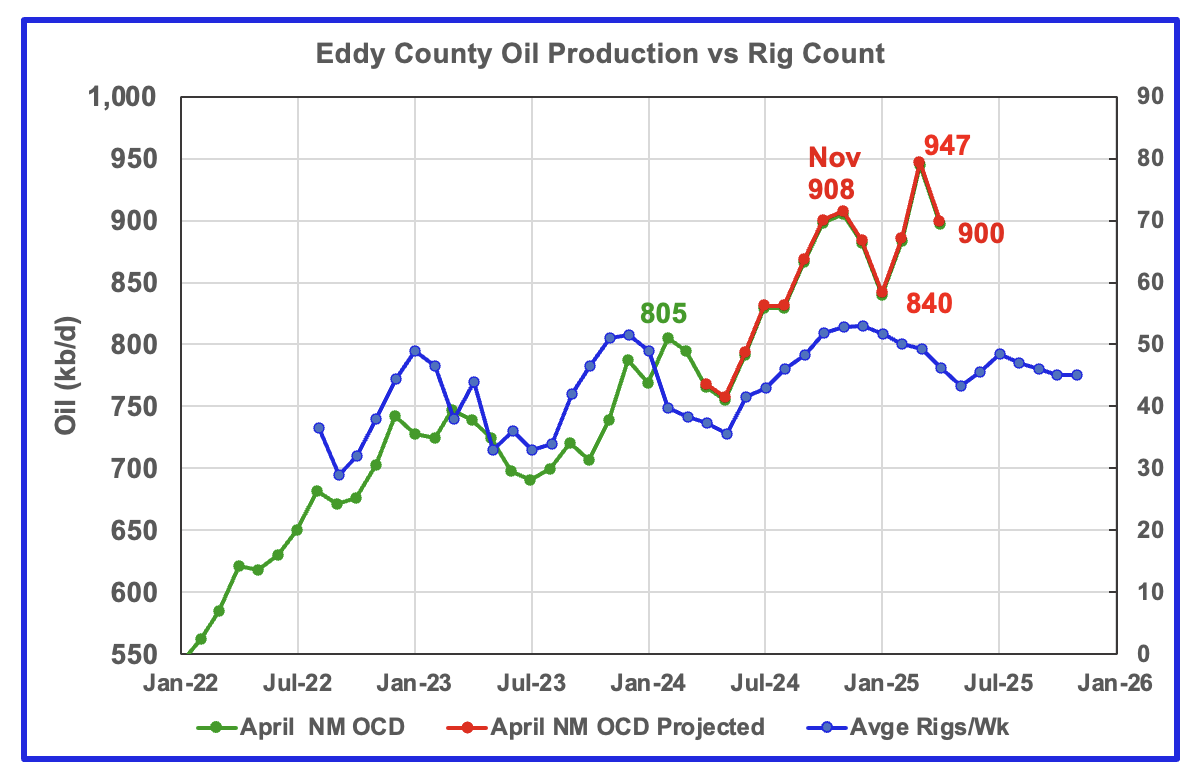
April’s projected oil production decreased by 47 kb/d to 900 kb/d. Also preliminary production from the NM OCD decreased 48 kb/d to 897 kb/d. Eddy county’s month over month production updates are very few and small and primarily occur in the last two months which indicates their preliminary production is very close to final. This is indicated by the red graph covering the green graph, i.e, there is no separation between the two graphs whereas there is separation in the Lea county production chart.
Eddy County’s recent oil production rise and fall is related to the rise and fall in the rig count. From May 2024 to November 2024, production rose from 757 kb/d to 908 kb/d, an increase of 150 kb/d, while essentially paralleling the increasing rig count. Over that same time shifted rig period, 14 to 15 rigs were added to Eddy County as production rose. Was a new Tier 1 region/area discovered to attract such a large increase in the rig count?
The blue graph shows the average number of weekly rigs operating during a given month as taken from the above weekly drilling chart. The rig graph has been shifted forward by 7 months to roughly coincide with the increase in the production graph starting in November 2023.
Clearly the production rise up to November 2024 is closely associated with the rise in the rig count and associated well completions delayed by roughly seven months. The rising production starting in February 2025 does not correlate with the dropping rig count. However that rising trend reversed for April as the projected production fell by 47 kb/d.
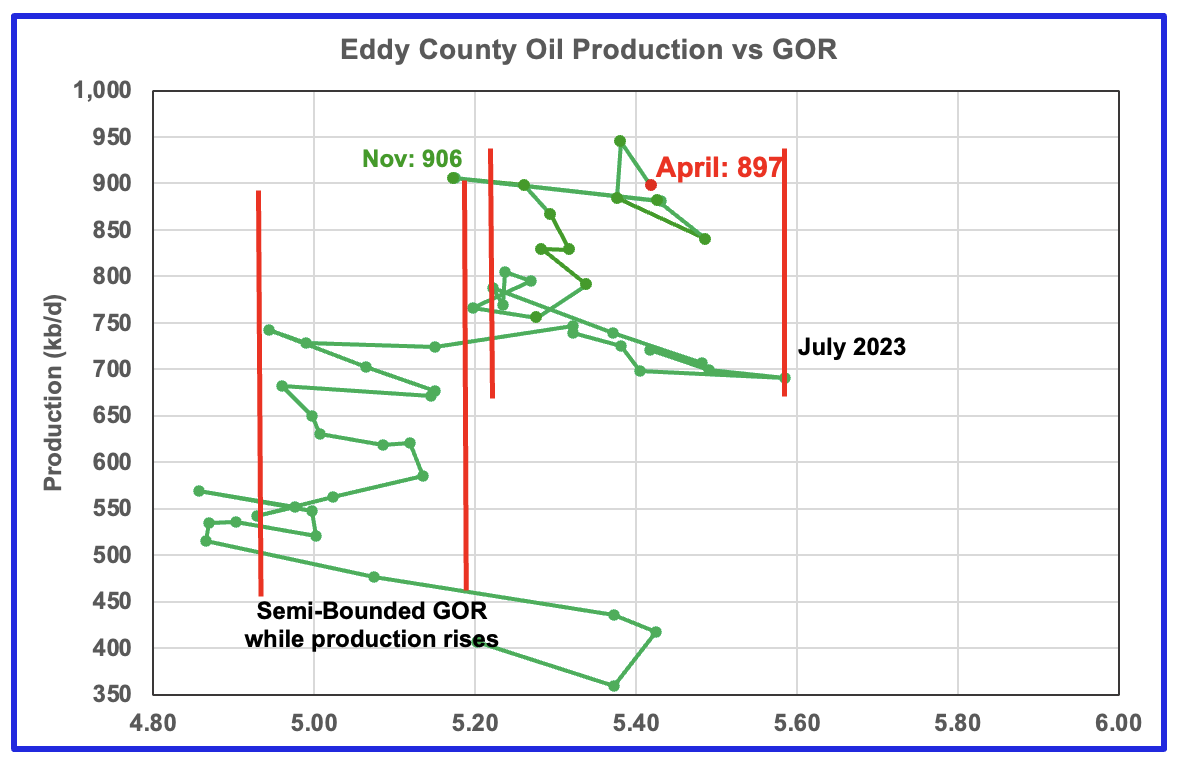
The Eddy county GOR pattern is similar to Lea county except that Eddy broke out from the semi bounded range earlier and for a longer time and then added a second semi bounded GOR phase. For April New Mexico’s Oil Conservation Division (OCD) reported oil production decreased by 48 kb/d to 897 kb/d and stayed within the second semi-bounded region.
Texas Permian
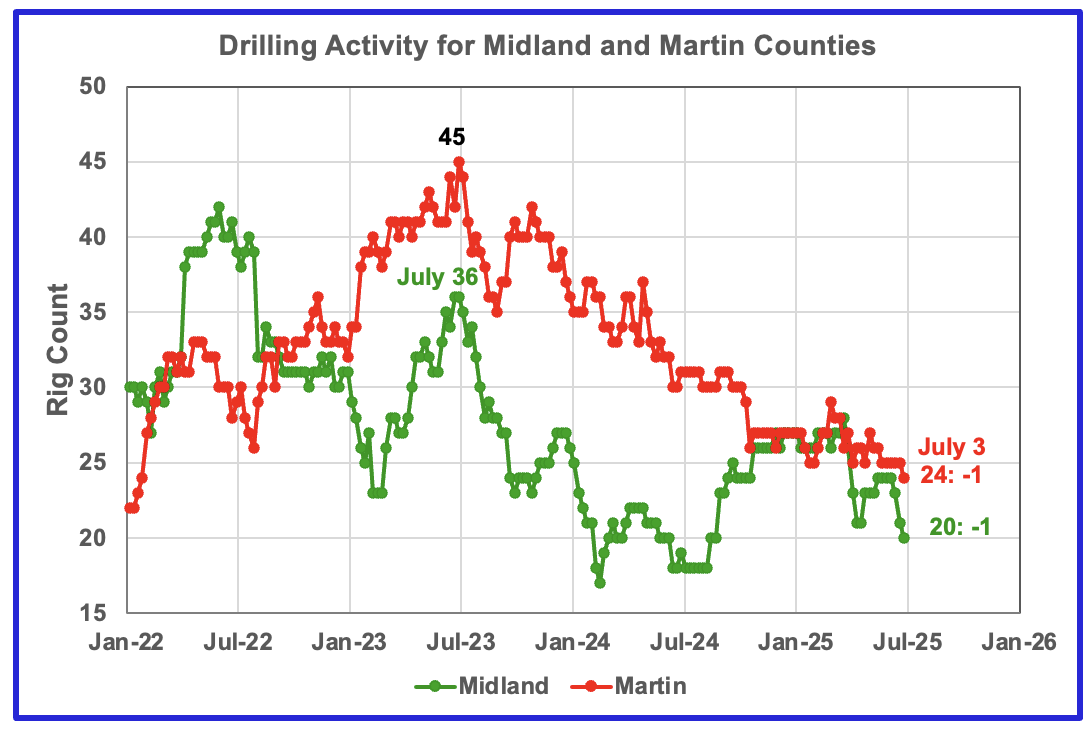
The Midland county rig count dropped to 20 rigs in the first week of July.
Martin county had a steadier trend in June. Martin county had 25 rigs operating from the last week in May to the last week in June but dropped another rig to a new recent low of 24 at the beginning of July.
Oil Production in Texas Counties
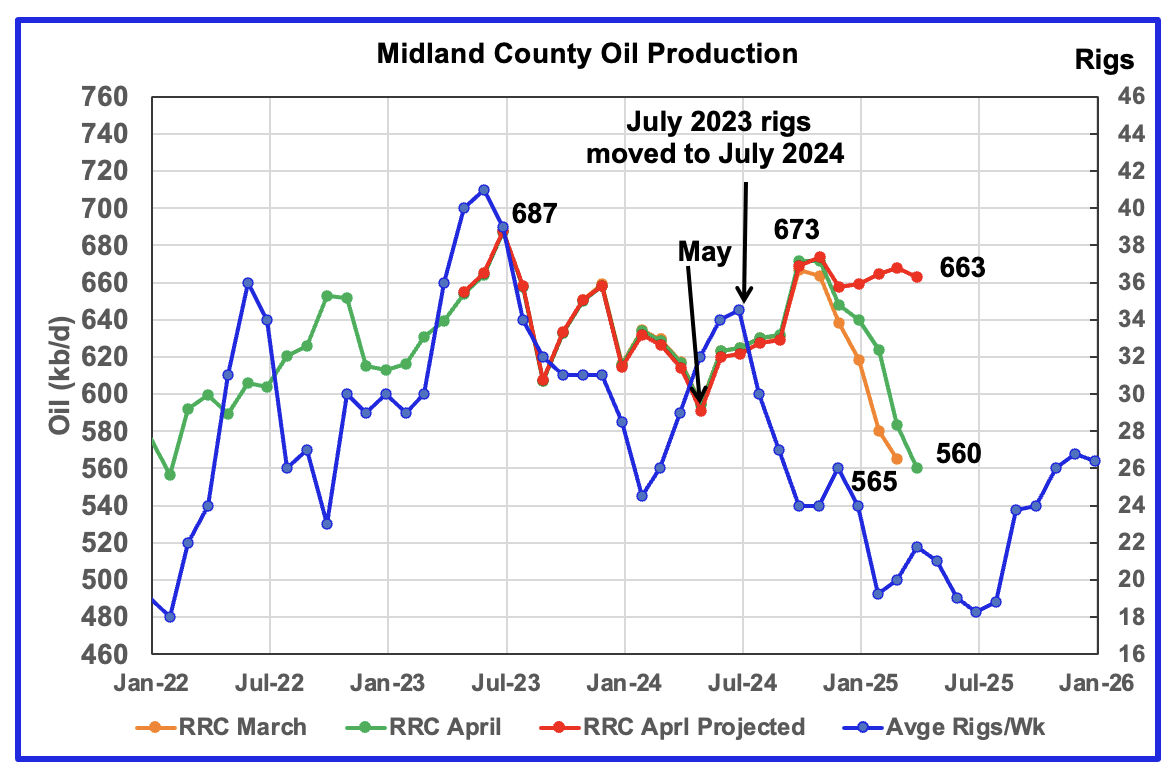
April’s projected production dropped 5 kb/d to 663 kb/d. However the large production revisions to March’s production has changed the previous months’s falling production trend to a plateau. I think the January to April projection is too optimistic.
The orange and green graphs show the oil production for Midland County as reported by the Texas RRC for March and April. The red graph uses the March and April data to project production as it would look after being updated over many months.
The blue graph shows the average number of weekly rigs operating during a given month as taken from the weekly drilling chart. The rig graph has been shifted forward by twelve months to better align with production. So the average 34.5 Rigs/wk operating in July 2023 have been moved forward to July 2024 to show the possible correlation and time delay between rig count, completions and oil production. This shift is much larger than the typical six to eight months used in other counties. Not clear why there should be such a difference.
If the twelve month shift in the rig count is approximately correct in that oil production can be tied to the rig count, oil production in Midland county should increase slightly starting in August for about six months before resuming its decline.
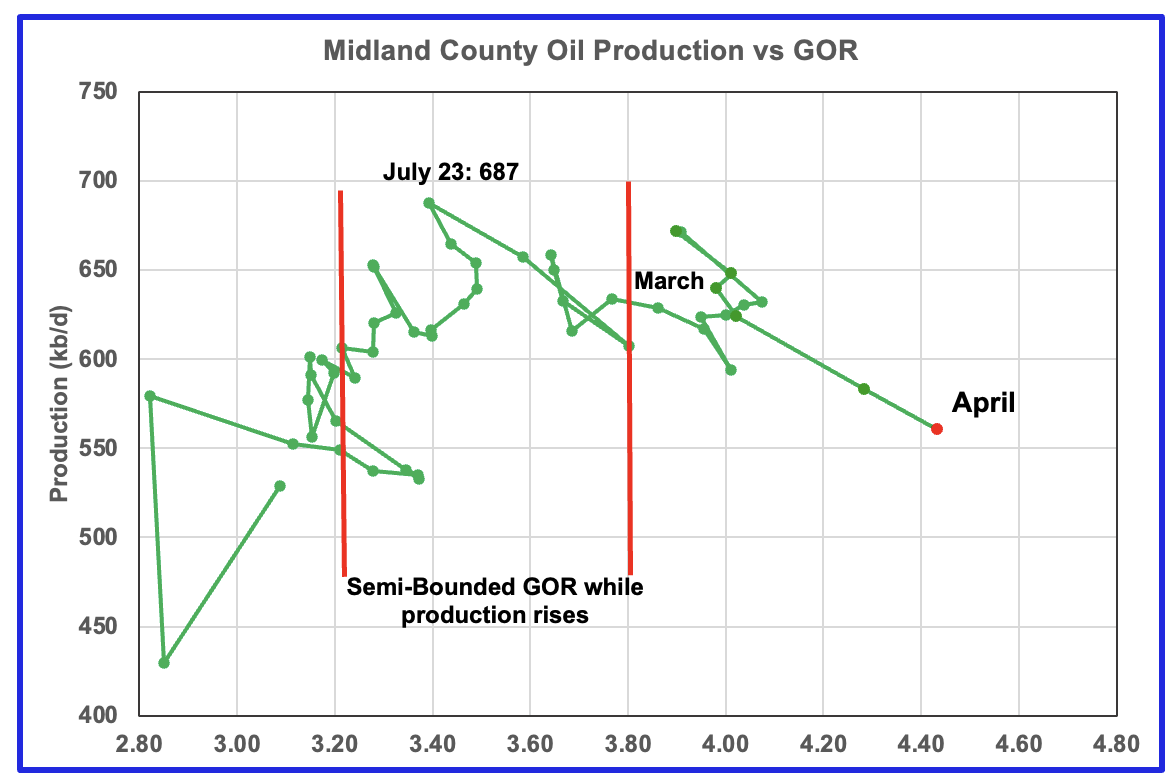
For April the GOR ratio increased to 4.43 from March’s 4.28 while reported preliminary oil production dropped 23 kb/d.
With Midland county into the bubble point phase, oil production and the GOR have stayed within a narrow range outside of the initial Semi-Bounded GOR region since March 2024 to February 2025. However the March and April 2025 GORs have broken out to new highs.
The oil production and GOR shown in this chart are based on the RRC’s April production report. Note that while the last few months are subject to revisions, the July 2023 to August 2024 production data has been steady for a number of months.
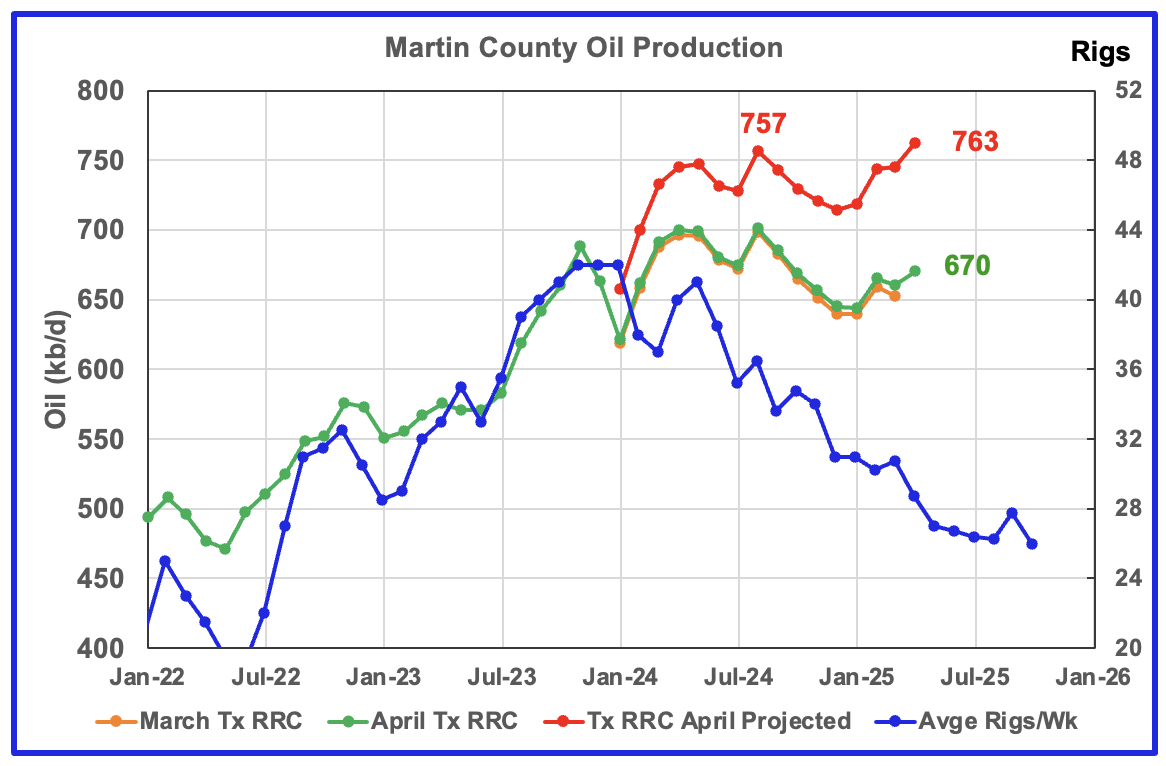
Martin county’s projected April oil production rose by 18 kb/d to 763 kb/d. The April projection is over corrected because revisions to March’s production start in October 2022 which is atypical. Typically revisions only go back by 1 to 1 1/2 years.
I think the increase is real but the production of 763 kb/d is too high by close to 60 kb/d.
The orange and green graphs show the production for Martin County as reported by the Texas RRC for March and April. The blue chart shifts the rig count ahead by 6 months.
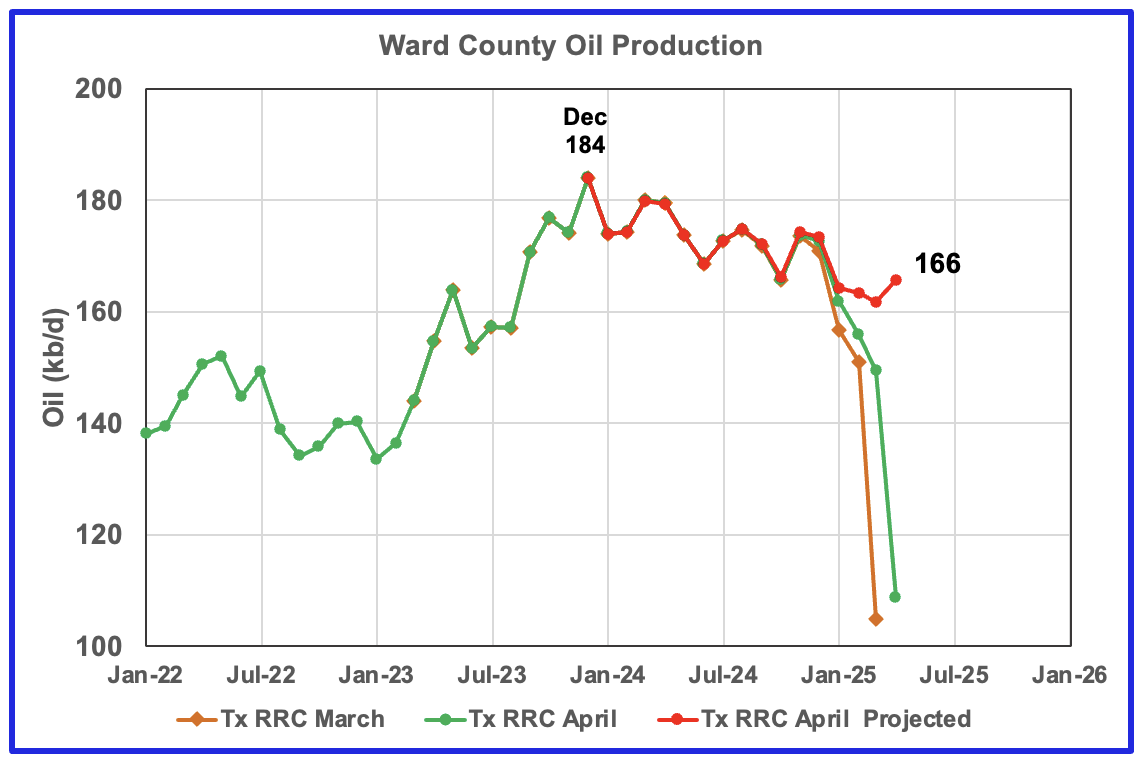
The red graph is a projection for oil production as it would look after being updated over many months. This projection is based on a methodology that uses preliminary March and April production data. The green graph shows oil production reported by the Texas RRC for April and is 10 kb/d higher than March’s. Note how production has dropped from September 2024 to January 2025, green graph. The March projected increase could be the beginning of a short term plateau before production begins to fall again.
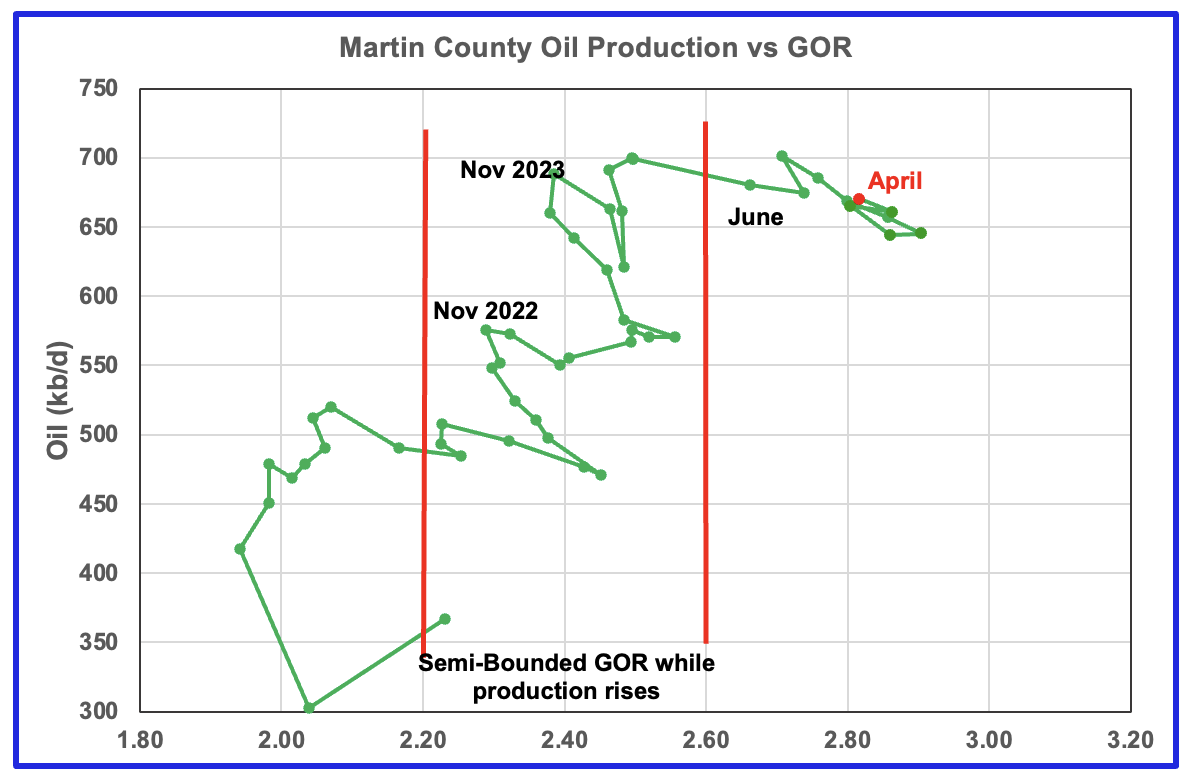
Martin county’s oil production after November 2022 increased and at the same time drifted to slightly higher GORs within the semi bounded range. However the June 2024 GOR saw its first move out of the semi bounded region. The preliminary Texas RRC’s April production for Martin county shows an increase in production of 10 kb/d accompanied by a drop in the GOR to 2.82
Martin county has the lowest semi-bounded GOR boundary of the four counties at a GOR of close to 2.60. The GOR is clearly out of the semi-bounded region. Martin County has now entered the bubble point phase that should result in oil production possibly entering a slowly dropping plateau phase.
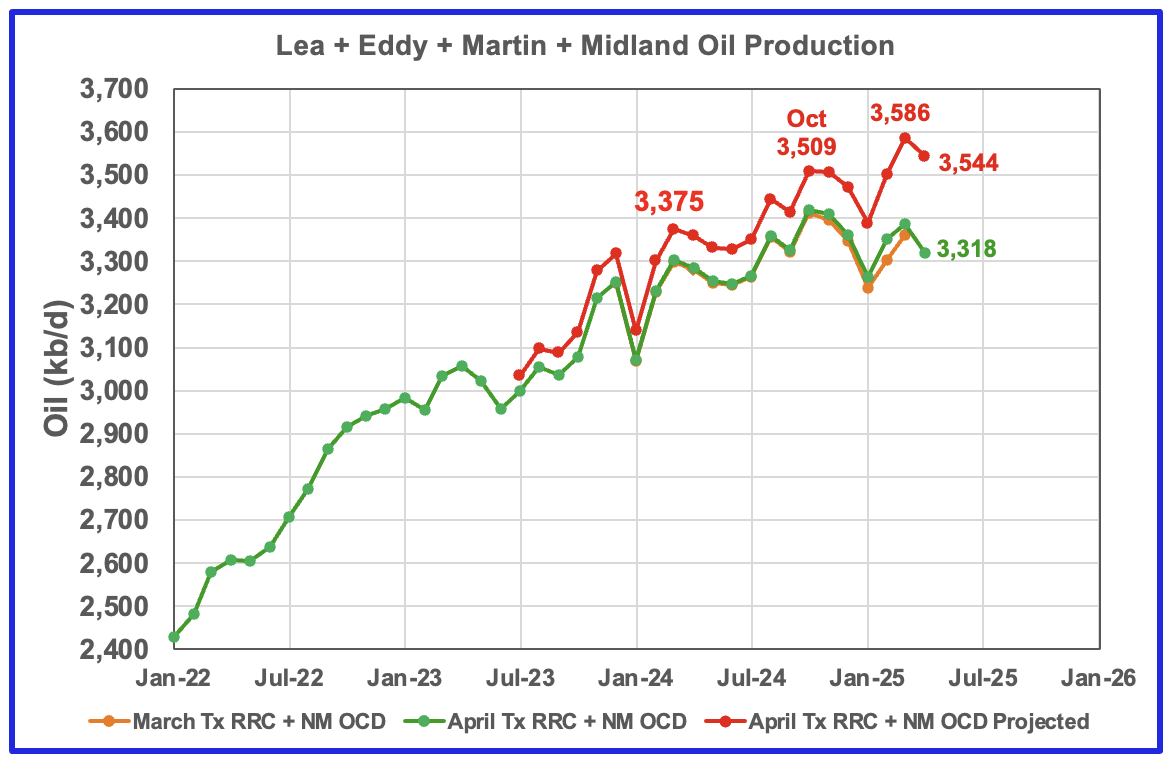
This chart shows the total oil production from the four largest Permian counties. Assuming that current Permian production is close to 6,400 kb/d, these four counties account for 55% of the total. The large April revisions to the previous months for Martin, Midland and Eddy have resulted in a slight increase over October 2024. April’s projected production decreased by 42 kb/d to 3,544 kb/d.
The March and April initial production data is shown in the orange and green graphs respectively. The red graph uses the March and April data to project an estimate for the final March production. The April decrease is related to the production drop primarily in Eddy County.
Findings
– The April preliminary production data for New Mexico was good. However the Texas data was bad for one county which affected the overall Texas production along with District 8. The four largest Permian county production charts appear to be are in different phases of their production life. Of the four, three are in a plateau phase and the fourth may be starting. However due to the April revisions of the previous months, one of the plateaus could be incorrect. Taking into consideration that the price of WTI is stuck close to $65/b, the rig and frac spread counts are dropping, taken all together, they all point to peak production occurring in the onshore lower 48 within the next three to six months.
– Lea county entered a plateau phase in May 2024. While oil production is not following the rig count graph directly, the dropping rig count is resulting in Lea production currently being in a slowly declining plateau phase.
– Eddy county’s production hit a new high in March but had a big drop in April, possibly signalling the beginning of its plateau phase.
– Midland county first peaked in July 2023 and has roughly followed the declining rig count graph up to May 2024. Midland county peaked a second time in November 2024. While the current projection is showing Midland to be in a plateau, it is due to large production revisions to previous months. The dropping preliminary production starting in November through April is a signal that Midland production is in decline. The May update may clarify the production status of Midland county.
– Martin county projected production has been affected by large revisions to previous months. However the increasing production over the last few months, I believe, are real.
Texas District 8

For Comparison: March report District 8.
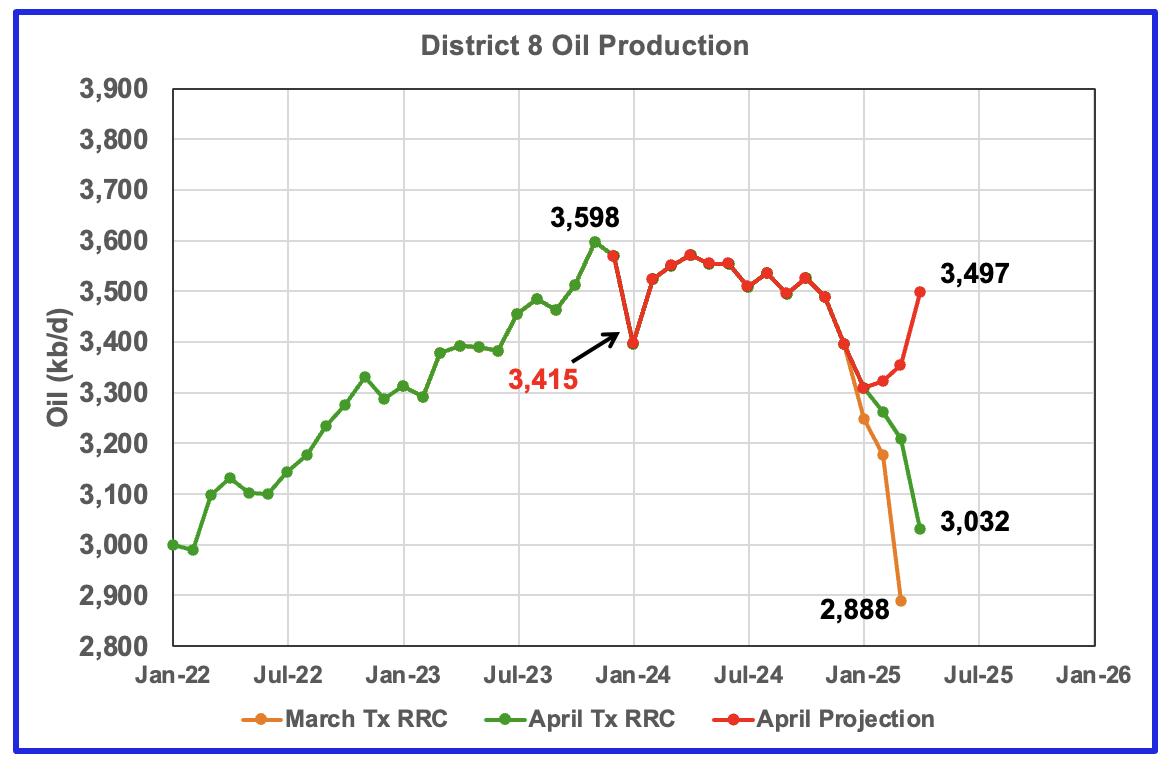
In the previous chart, District 8’s oil projected production peaked in November 2024 at 3,704 kb/d. March’s projected production dropped by 125 kb/d to 3,433 kb/d and is 271 kb/d lower than November 2024.
Due to an error in Reeves’ County April 2025 production report, only the revised 2025 production data was used to generate this chart. This April chart just indicates that production could have increased in April.
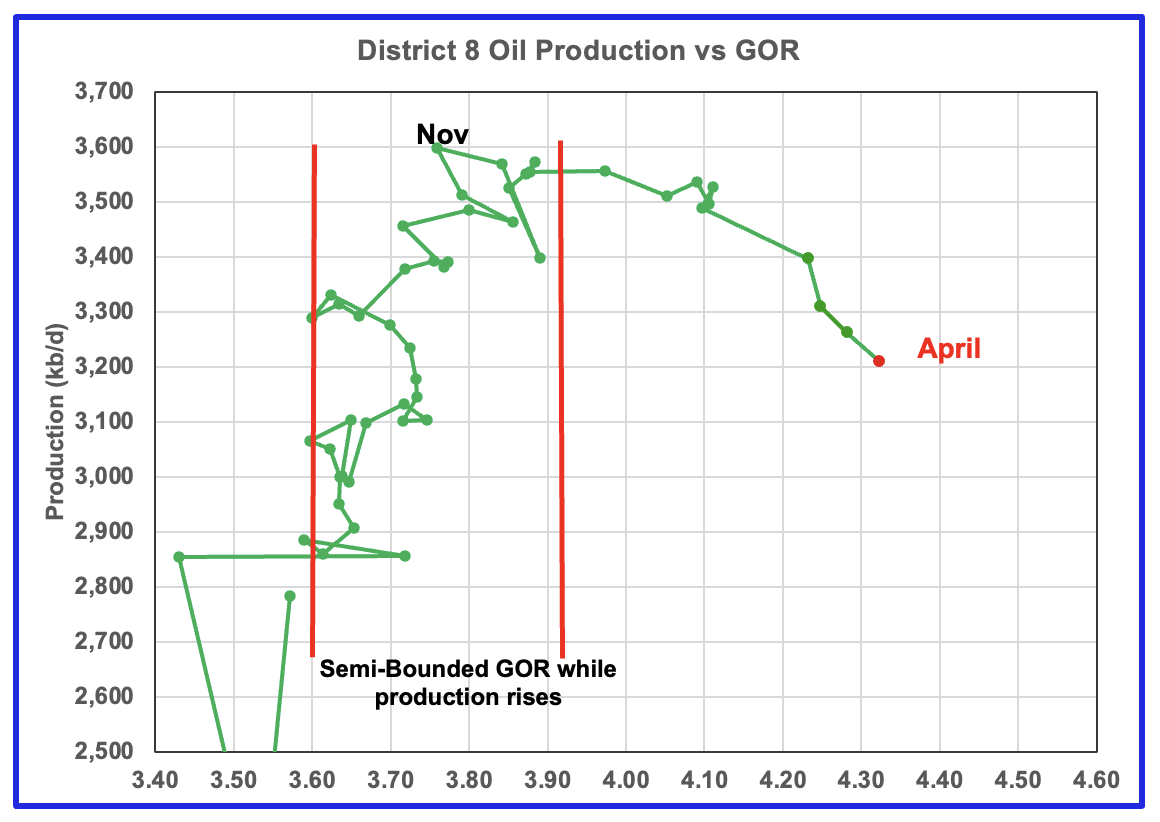
While revisions in the production chart affect the projection, it does not affect the GOR. Again only the revised 2025 data was used for this chart.
Plotting an oil production vs GOR graph for a district may be a bit of a stretch. Regardless here it is and it seems to indicate many District 8 counties may well be into the bubble point phase. The GOR continued to increase in April to 4.32. This is another indicator that implies District 8 may be on a production plateau.
Oil Production and GOR Charts for a number of Larger Texas Oil Producing Counties
Below are charts for the next seven top oil producing counties in Texas. The Texas April data appears to be inconsistent and anomalous in a few cases and raises questions for some of the following projected county production charts.
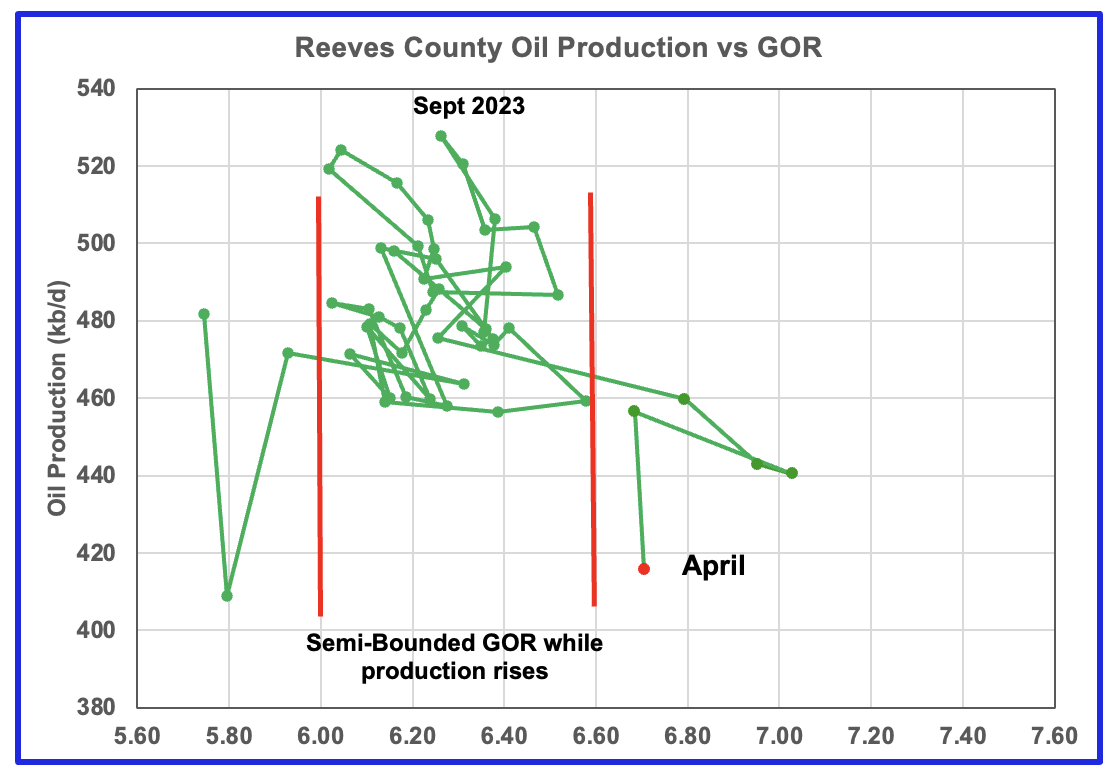
April’s projected oil production for Reeves county rose 4 kb/d to 478 kb/d. Reeves county peaked in May 2024 at 522 kb/d. The GOR chart indicates that Reeves County entered the bubble point phase in December 2024 and production is in a declining phase. Note that only the updated 2025 production was used for these two charts.
Reeves county GOR is high because it is the number 1 Texas county ranked by gas production. The current C + C production is equally split between crude and condensate.
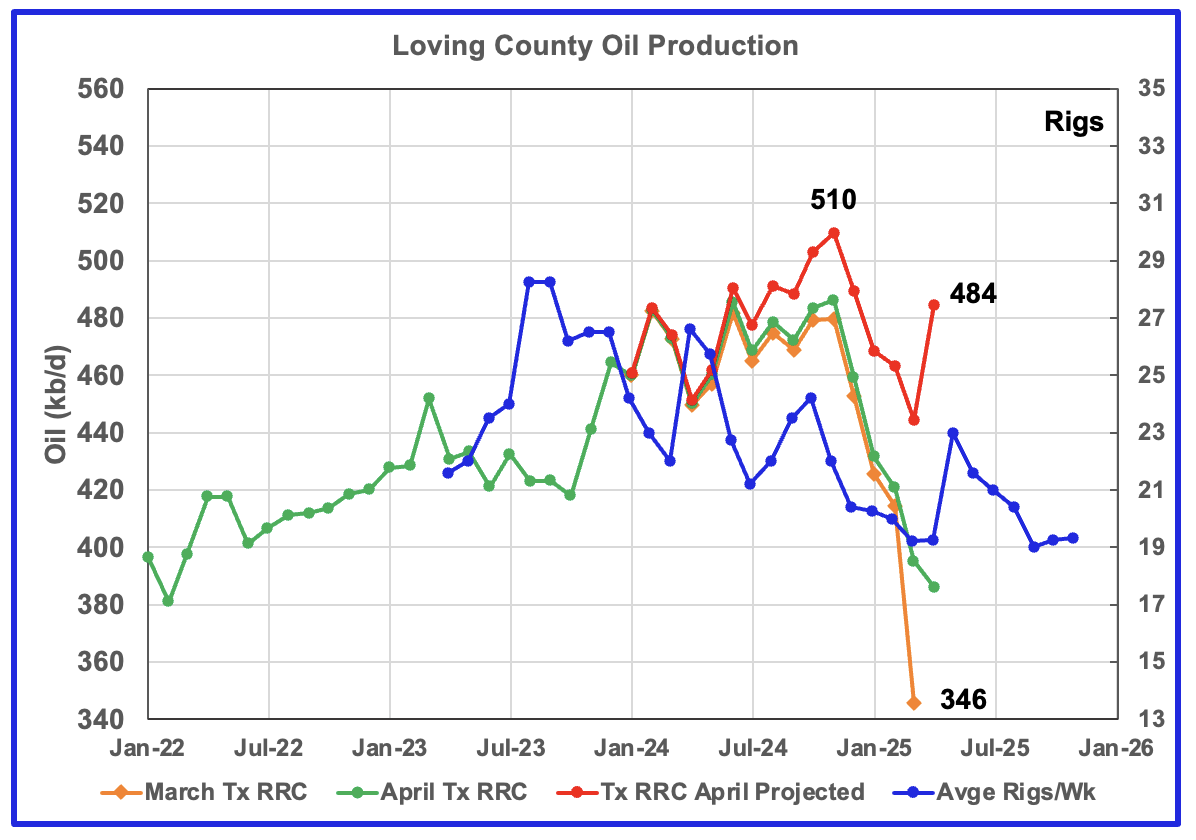
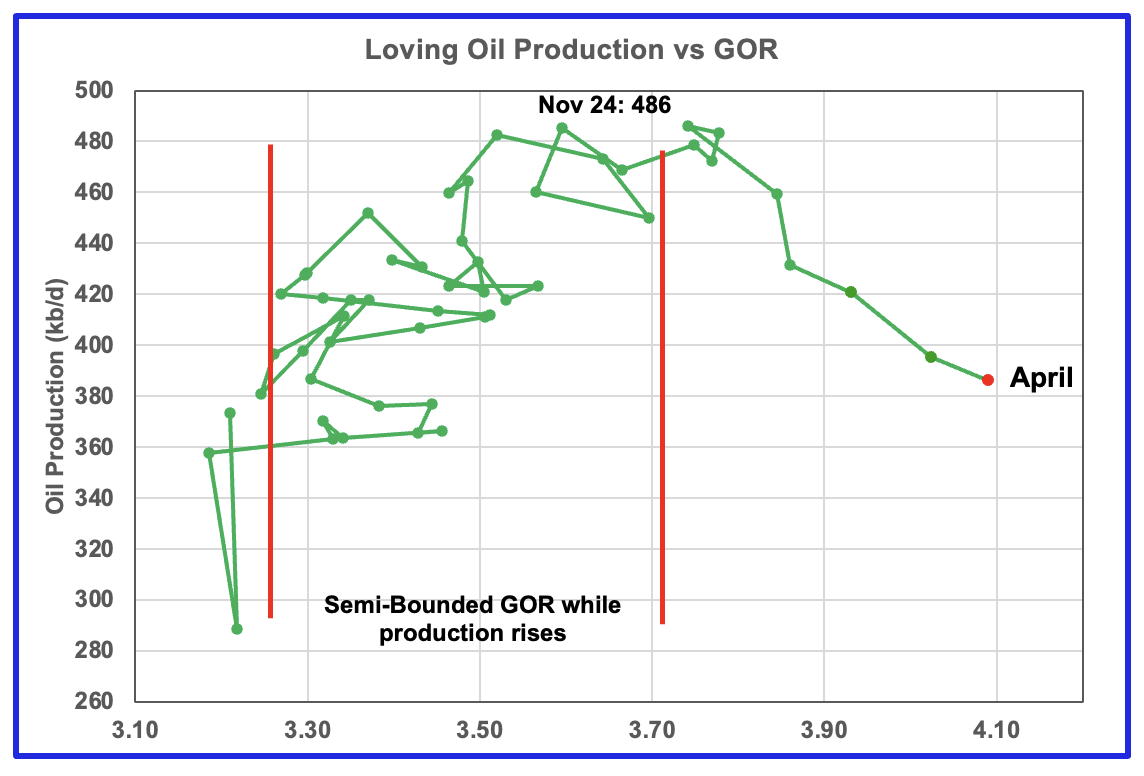
Loving county had a large projected production rise of 40 kb/d to 484 kb/d in April. Loving production peaked at 510 kb/d in November 2024.
For April, the GOR increased to 4.09, a new high.
While Loving had 19 operational rigs in June, they jumped to 22 in the first week of July. Has new area been discovered?
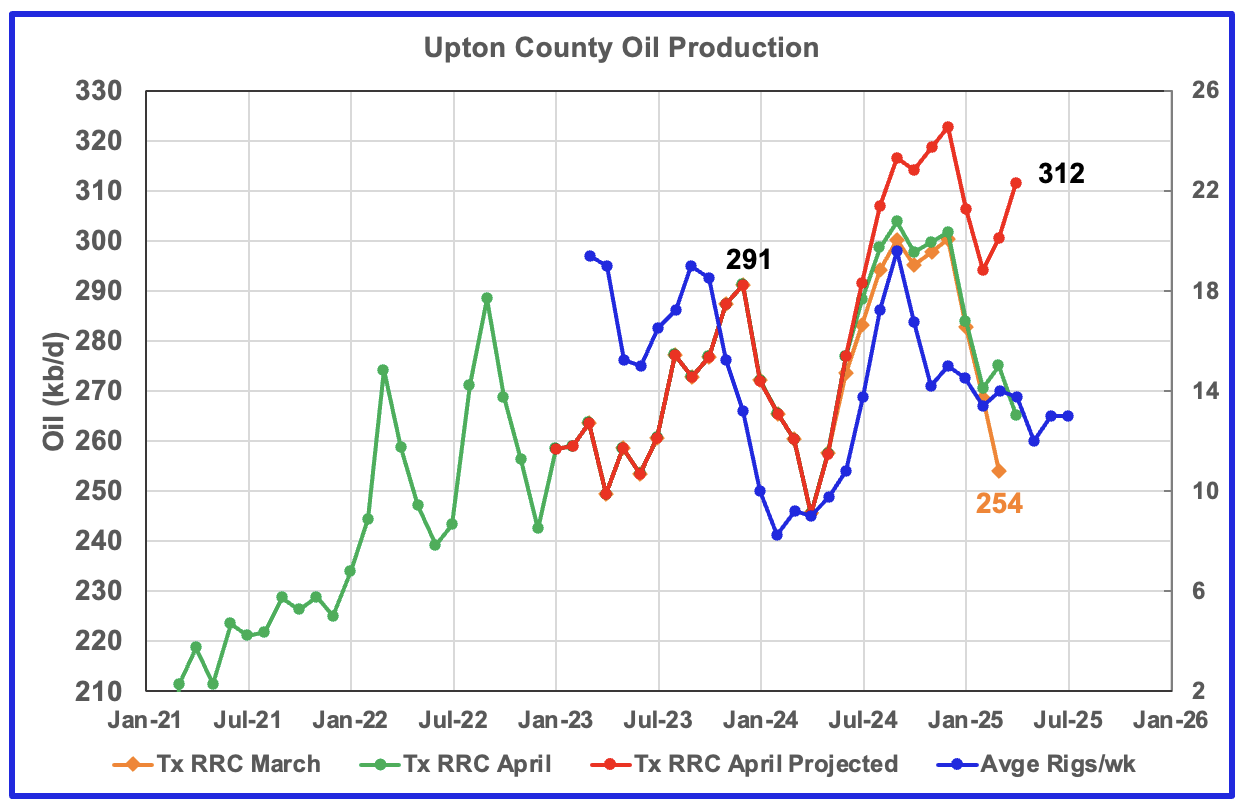
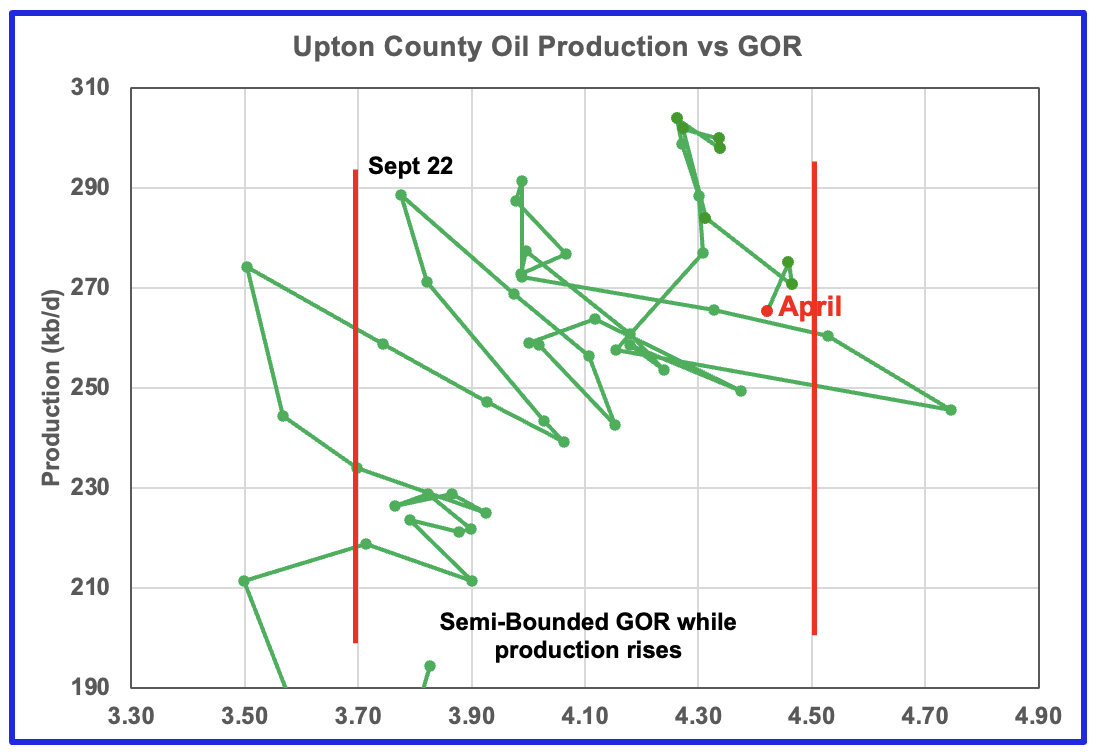
Upton’s production has followed the rig count graph since January 2024 and peaked in December 2024. March and April saw a projected production rise, which broke away from the rig graph. April’s production rose by 11 kb/d to 312 kb/d. The GOR may be on the verge of moving out of the semi-bounded region.
The rig graph in the oil production chart has been shifted forward by six months.
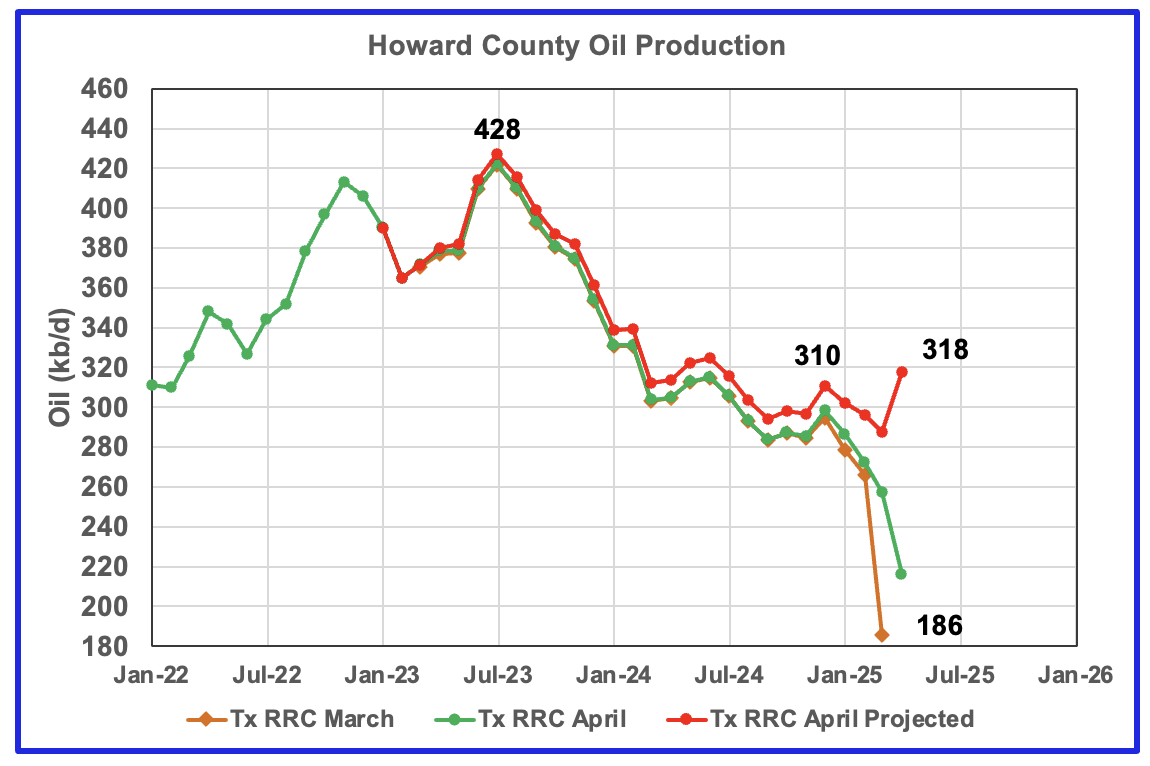
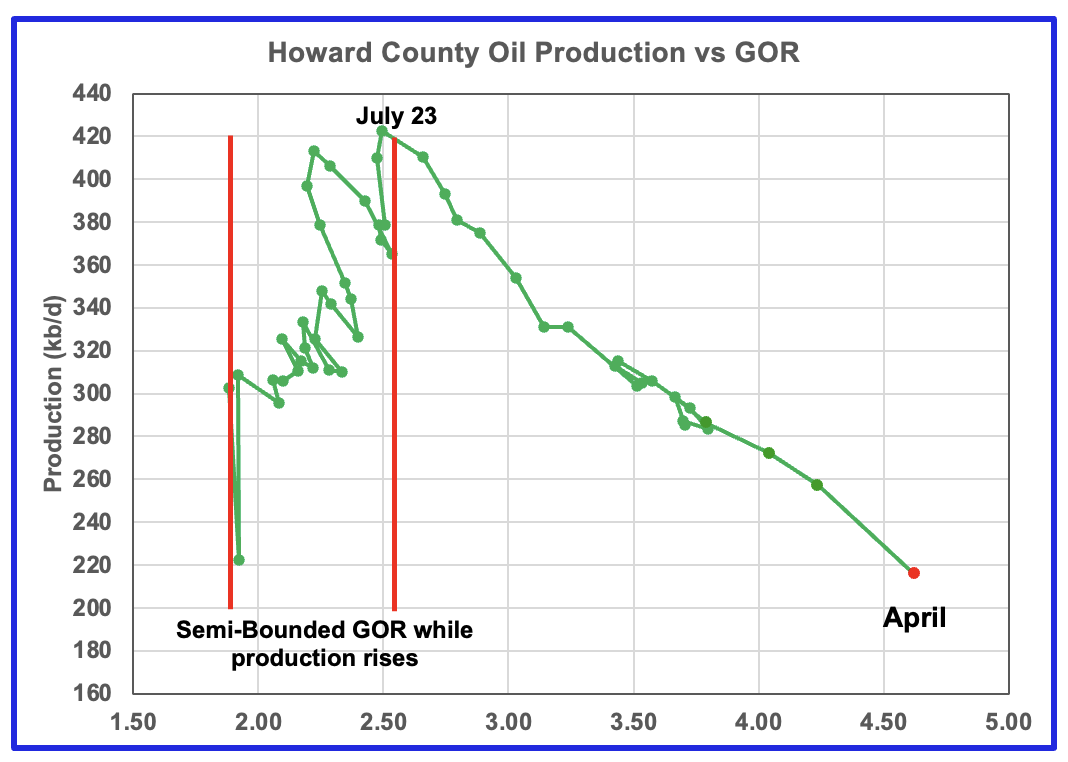
Howard county production peaked in July 2023 at 428 kb/d.
Note the rapid movement of the GOR to higher ratios once it broke out of the Semi-Bounded GOR range. While the GOR has risen to new highs, preliminary production has kept on falling. However the projected production rise shown after July 2024 may be an indication that production has moved into new and lower plateau zone.
April’s projected production rose by 31 kb/d to 318 kb/d.
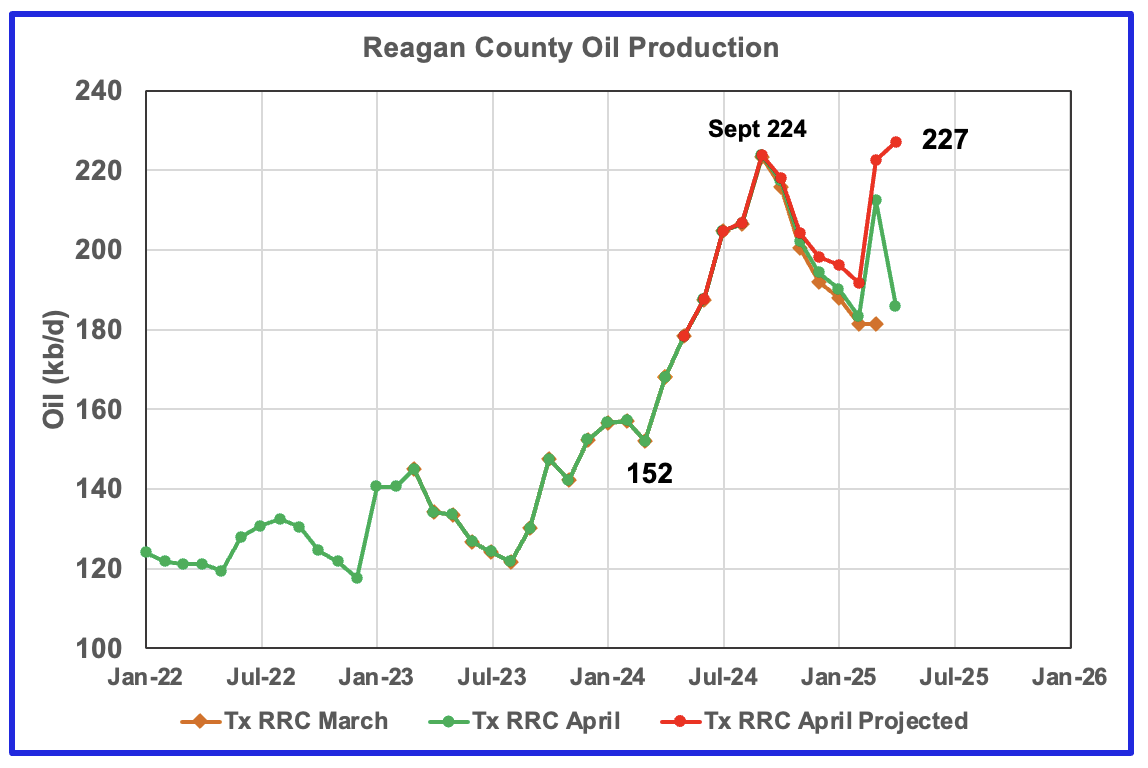
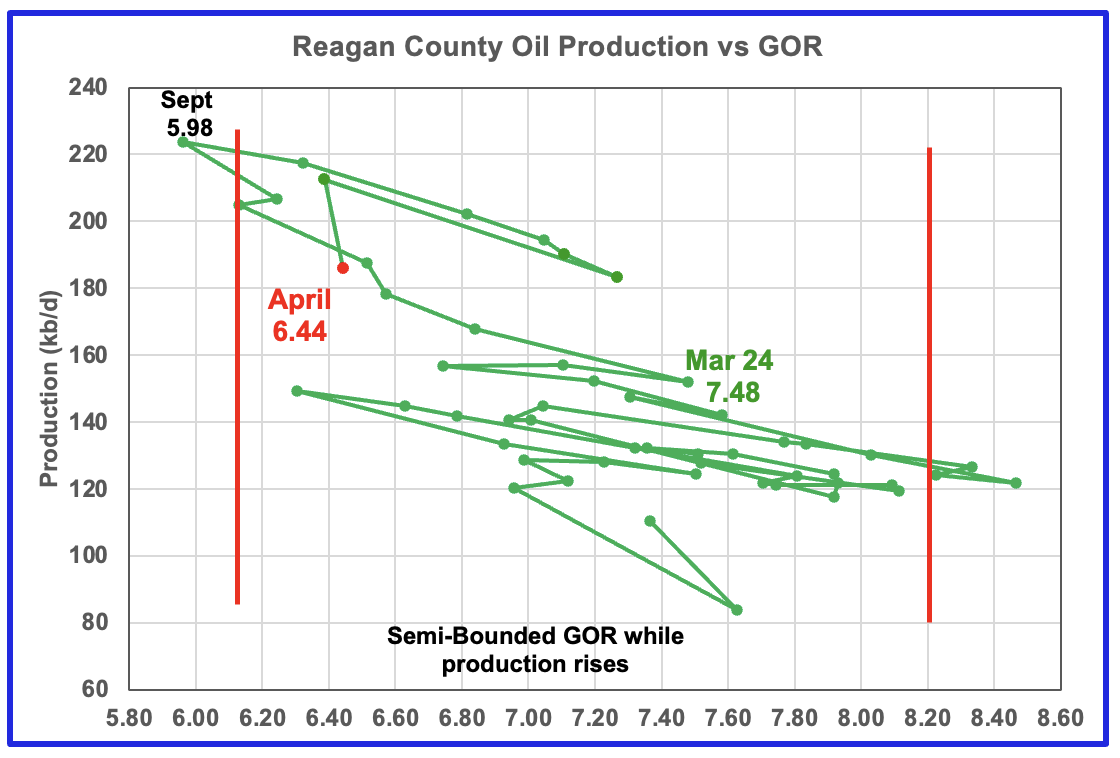
Reagan county oil wells have a very high GOR and passed peak production in September 2024. While April’s projected production is showing new high, I think it is due to the large error in March’s production.
April’s projected production increased by 4 kb/d to 227 kb/d while the GOR rose to 6.44.
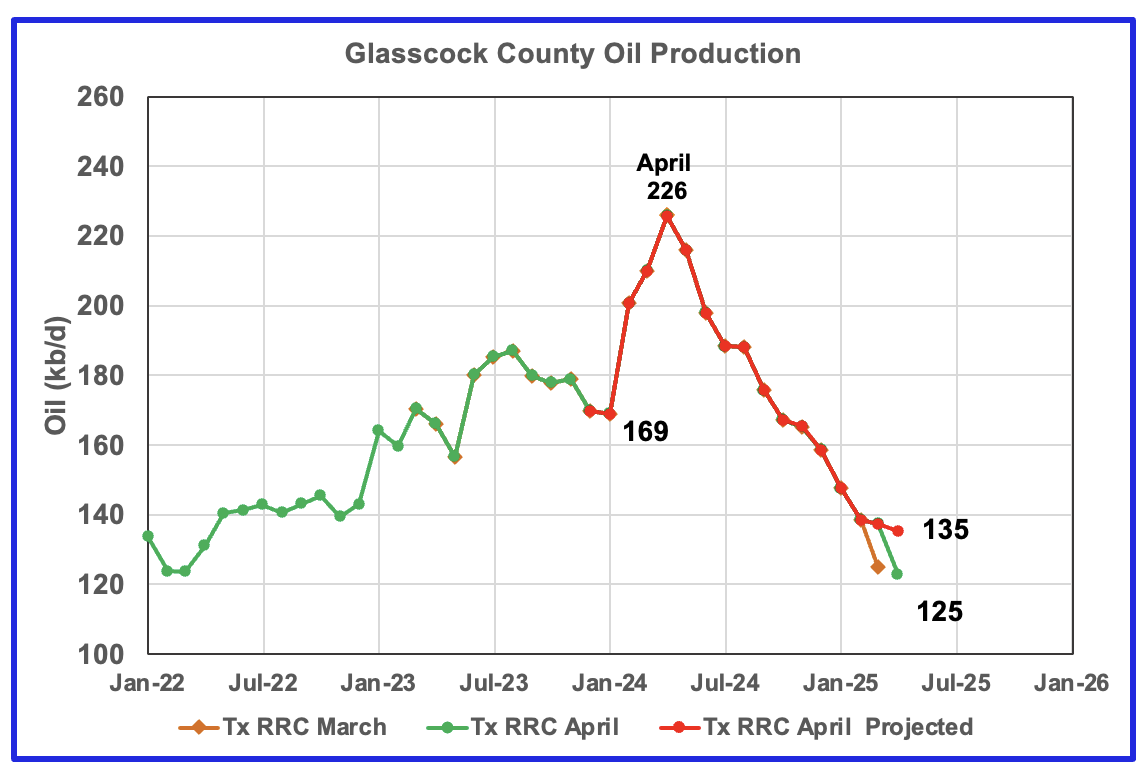
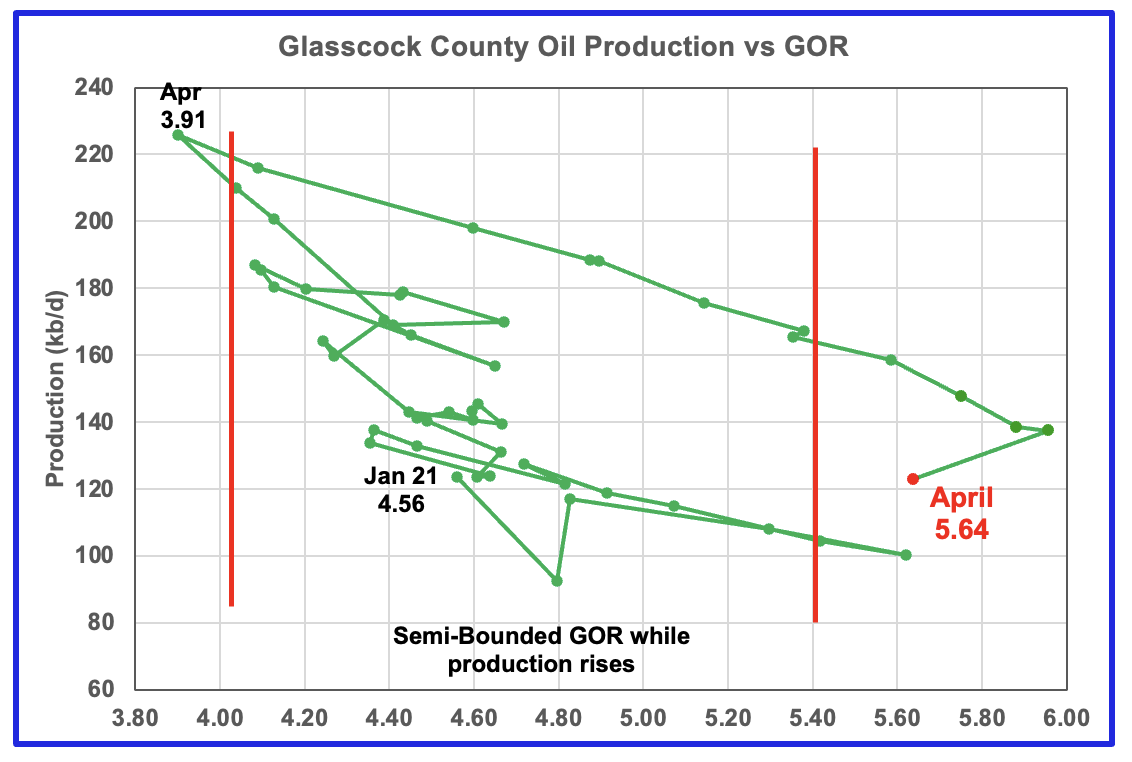
Glasscock’s production has been falling since April 2024 and does not show any sign of slowing while the GOR moved out of a very wide Semi-Bounded region. Note the rapid increase in the GOR starting from 3.91 in April 2024.
April’s projected production dropped 2 kb/d to 135 kb/d while the GOR dropped back to 5.64.
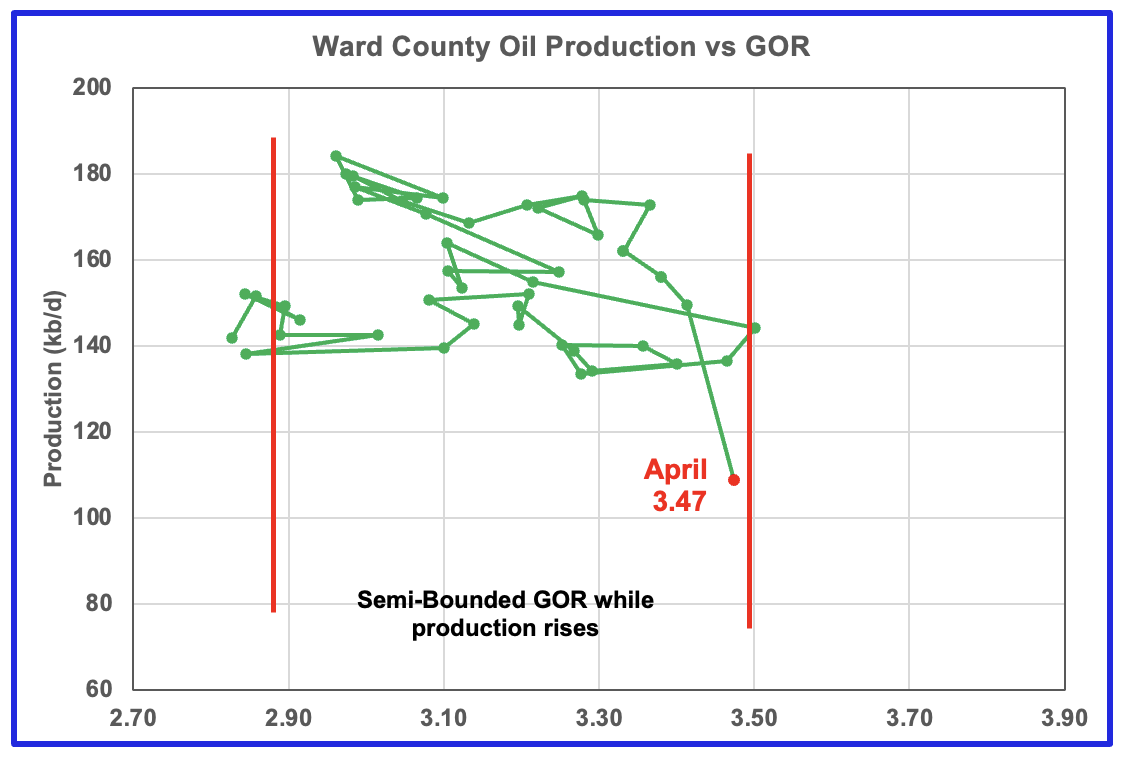
Ward’s projected oil production has been in a slow decline while the GOR has been slowly increasing within it semi-bounded region.
Drilling Productivity Report
The Drilling Productivity Report (DPR) uses recent data on the total number of drilling rigs in operation along with estimates of drilling productivity and estimated changes in production from existing oil wells to provide estimated changes in oil production for the principal tight oil regions. The new DPR report in the STEO provides production up to April 2025. The report also projects output to December 2026 for a number of basins. The DUC charts and Drilled Wells charts are also updated to April 2025.
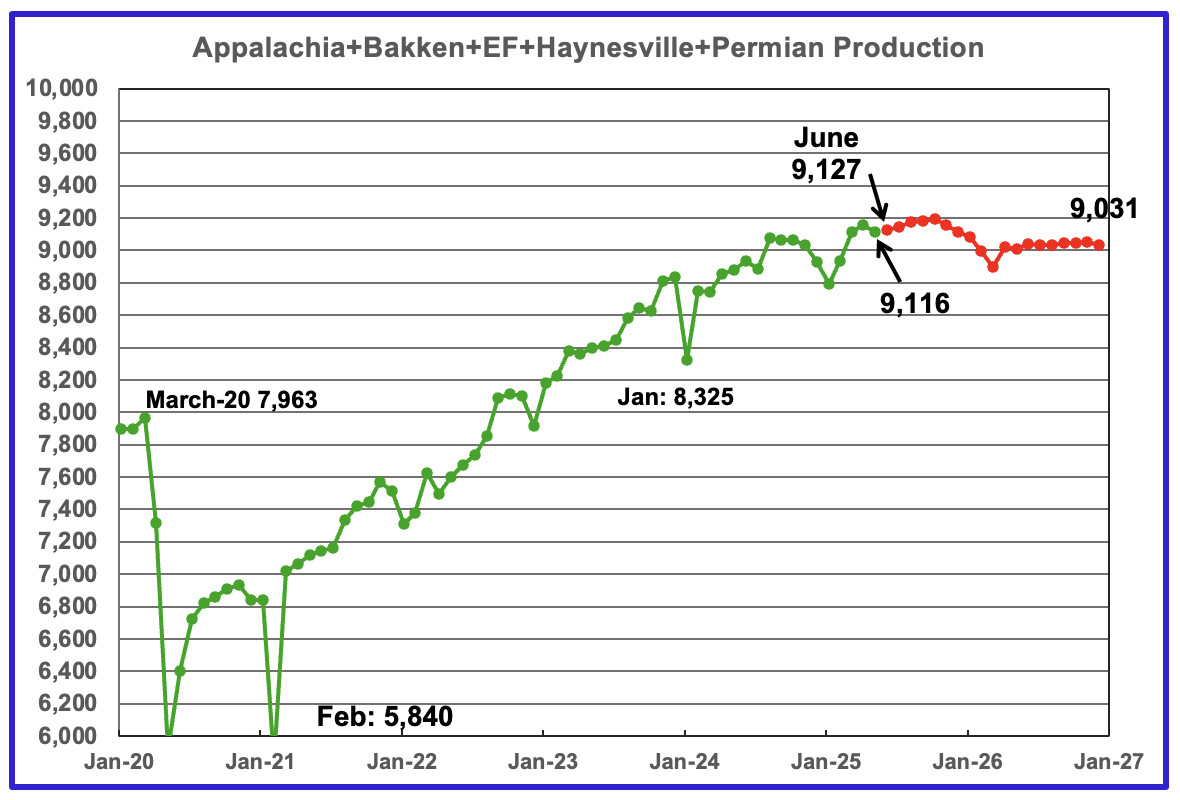
The oil production for the 5 DPR regions tracked by the EIA’s STEO is shown above up to May 2025. Also the June 2025 STEO projects production out to December 2026, red markers. Note DPR production includes both LTO oil and oil from conventional wells.
May’s oil output in the five DPR regions decreased by 40 kb/d to 9,116 kb/d. Production is expected to rise by 11 kb/d in June to 9,127 kb/d. Production rises slightly out to October and then begins to decline.
Production in December 2026 is forecast to be 9,031 kb/d a downward revision of 156 kb/d from last month.
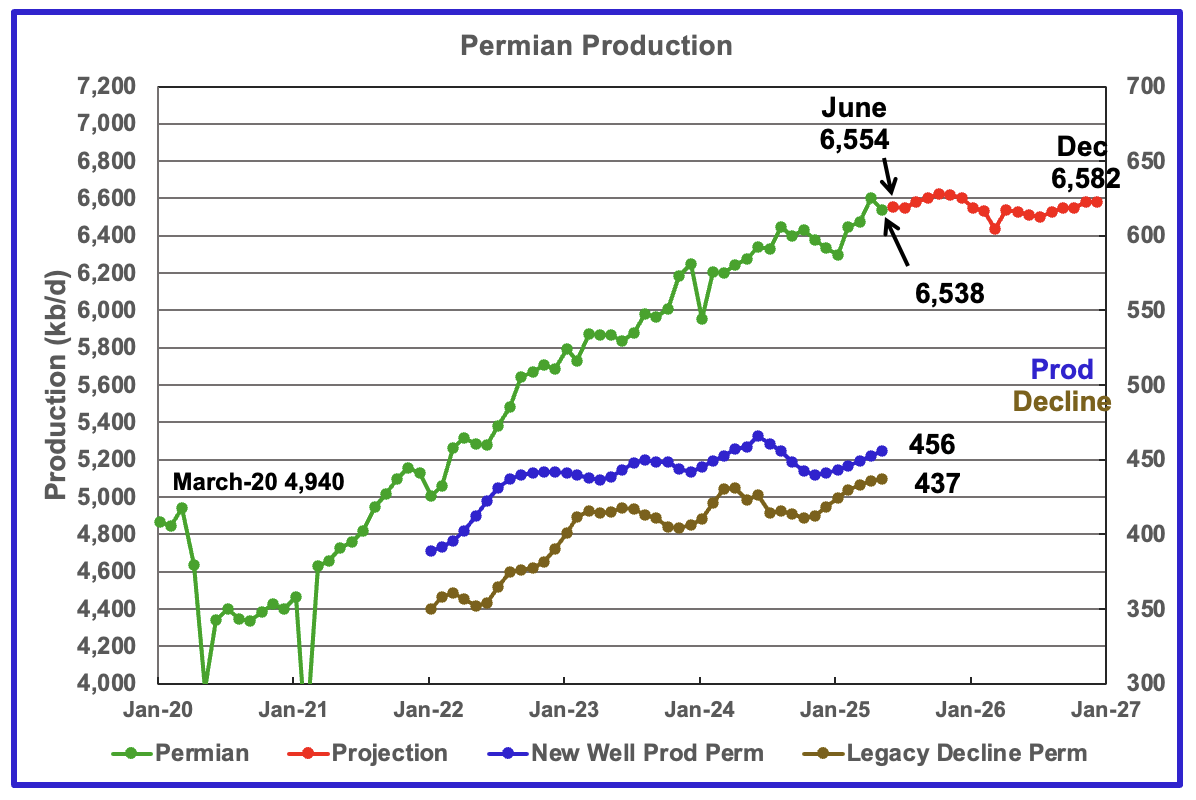
The EIA’s June STEO/DPR report shows Permian May output dropped by 64 kb/d to 6,538 kb/d an upward revision of 78 kb/d from 6,460 kb/d projected last month. From May 2025 to December 2026 output is expected to rise by 44 kb/d to 6,582 kb/d. Note that December 2026 production has been revised down by 142 kb/d from 6,724 kb/d to 6,582 kb/d.
Production from new wells and legacy decline, right scale, have been added to this chart to show the difference between new production and legacy decline.
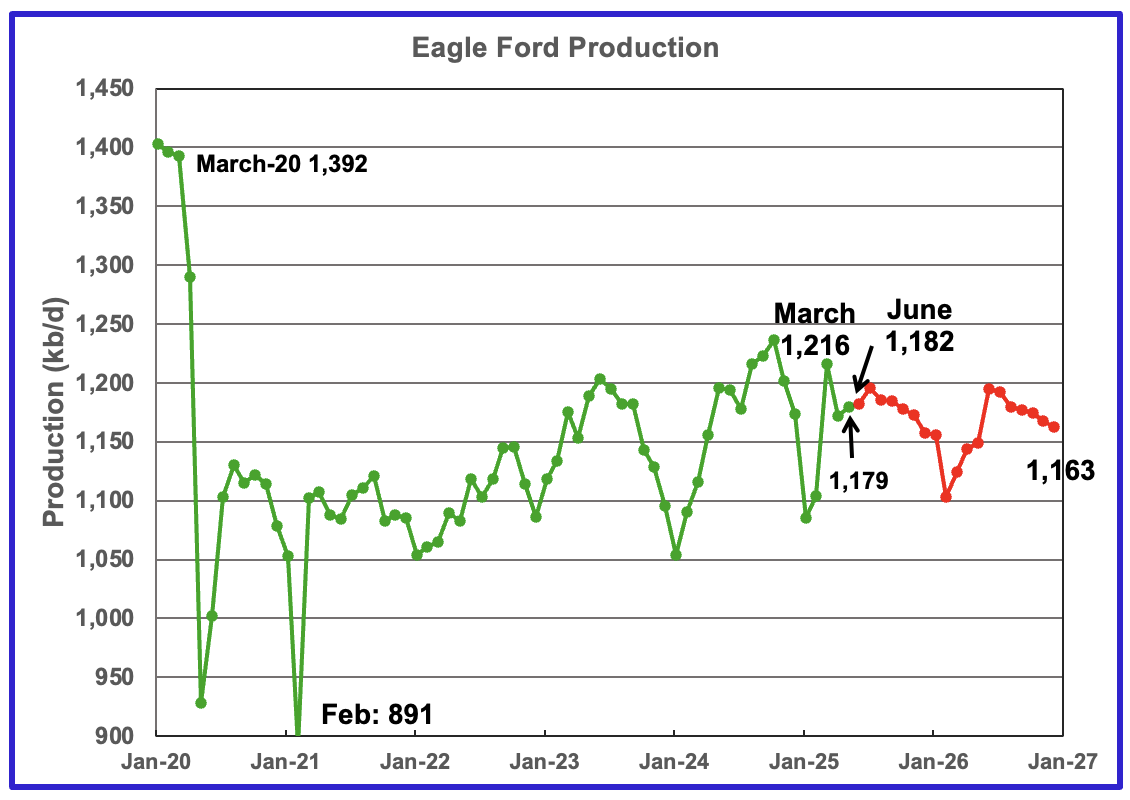
Output in the Eagle Ford basin started increasing in February 2025 but peaked again in March 2025 at 1,216 kb/d and then dropped. May production increased by 7 kb/d to 1,179 kb/d. June 2025 production is forecast to rise by 3 kb/d to 1,182 kb/d.
Output in December 2026 expected to be 1,163 kb/d, a decrease of 16 kb/d from May 2025.
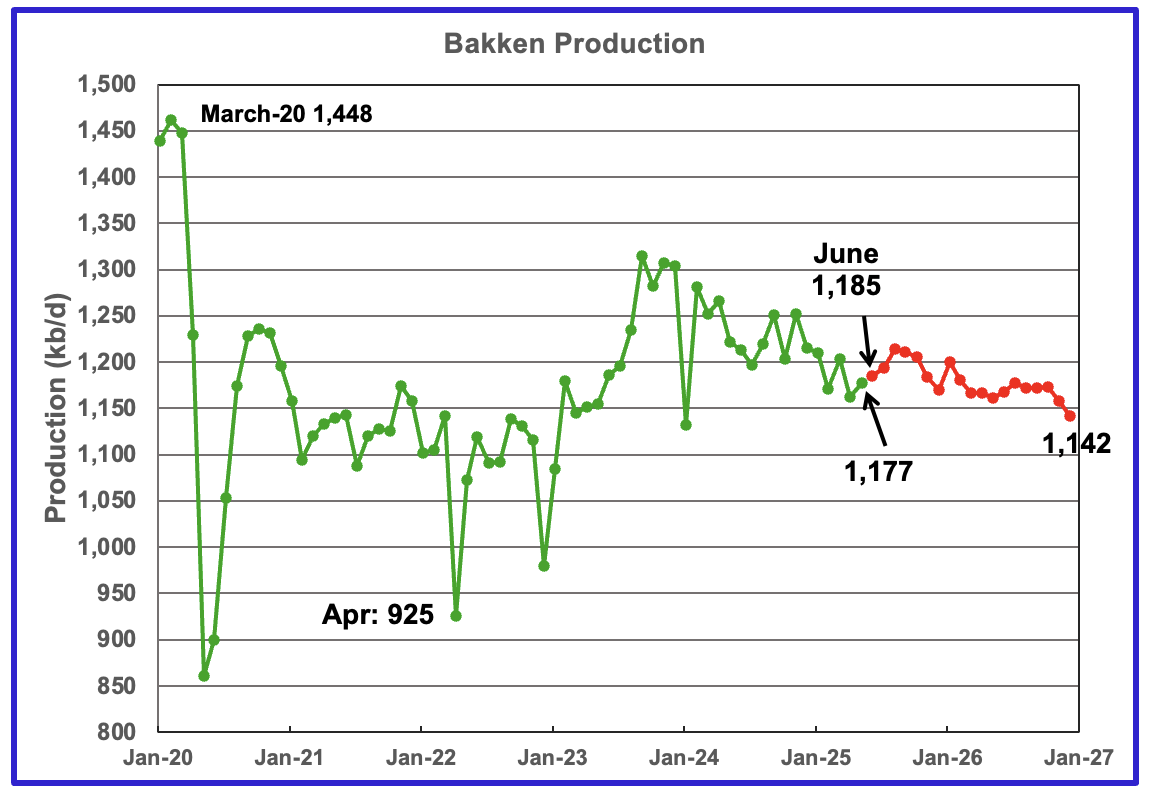
The DPR/STEO reported that Bakken output in May rose by 14 kb/d to 1,177 kb/d. The STEO/DPR projection, red markers, shows output to be essentially in decline after September 2025, dropping to 1,142 kb/d in December 2026.
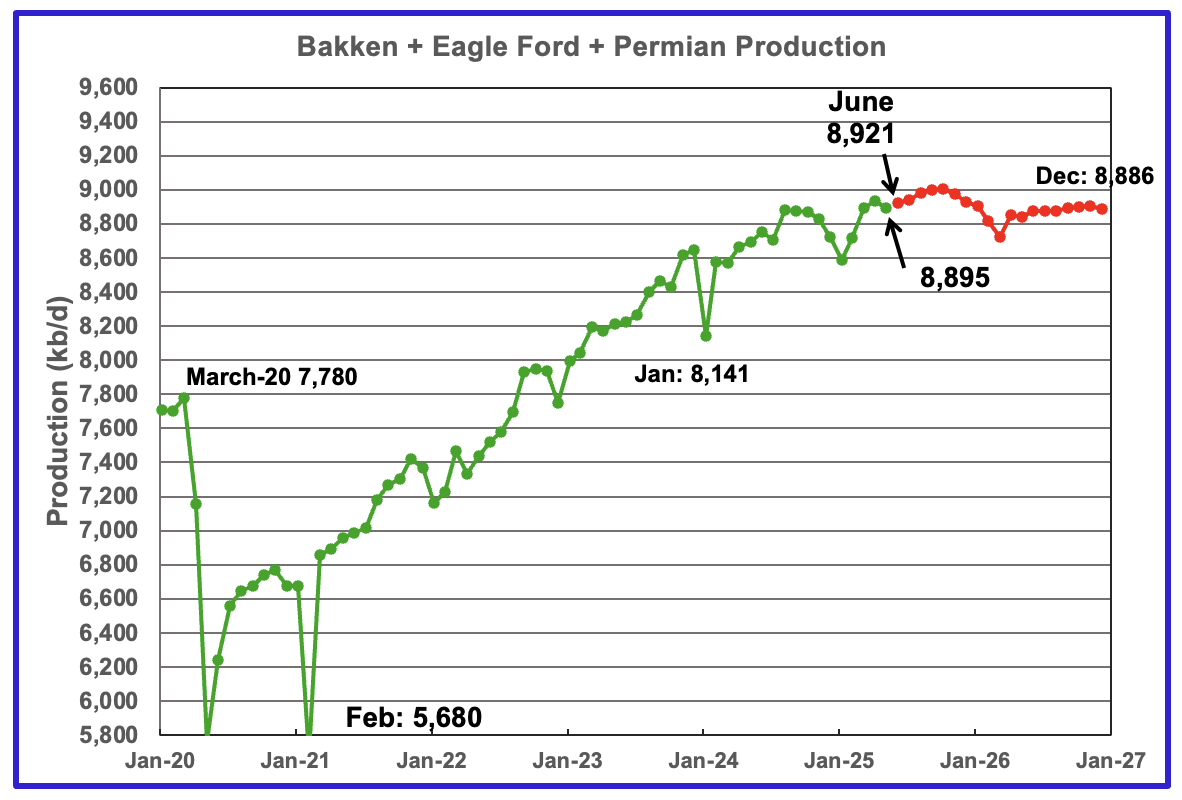
This chart plots the combined production from the three main LTO regions. For May output dropped by 41 kb/d to 8,895 kb/d. Production for December 2026 is forecast to be 8,886 kb/d, a downward revision of 159 kb/d from the previous report.
DUCs and Drilled Wells
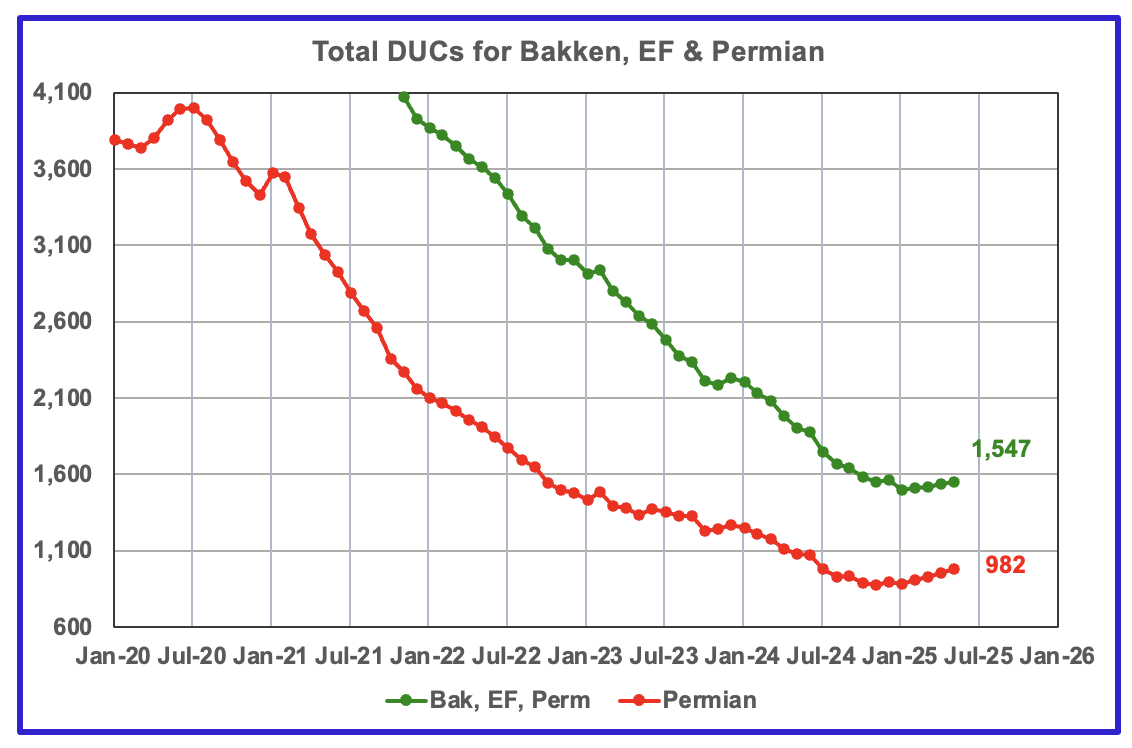
The number of DUCs available for completion in the Permian and the three major DPR regions has turned from a dropping trend to a rising one. May’s DUC count for the three basins rose by 12 to 1,547. In the Permian the DUC count increased by 26 to 982.
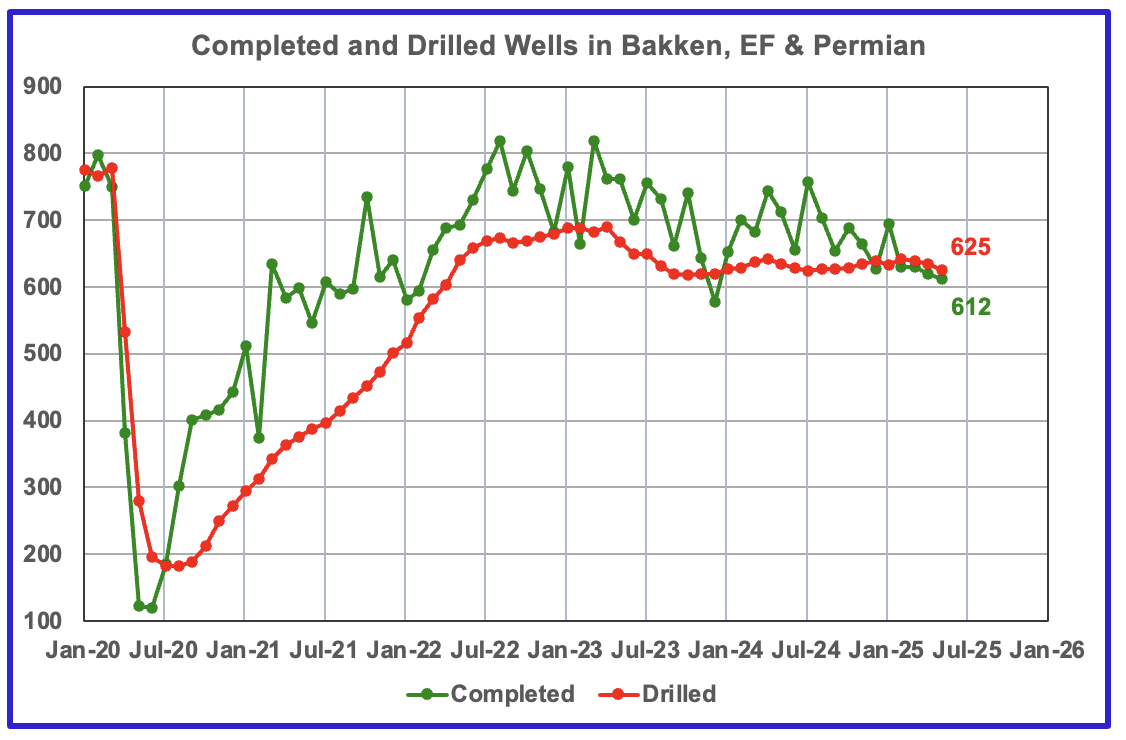
In the three primary regions, a total of 612 wells were completed and 625 were drilled. For comparison, In January 2023, 688 wells were drilled.
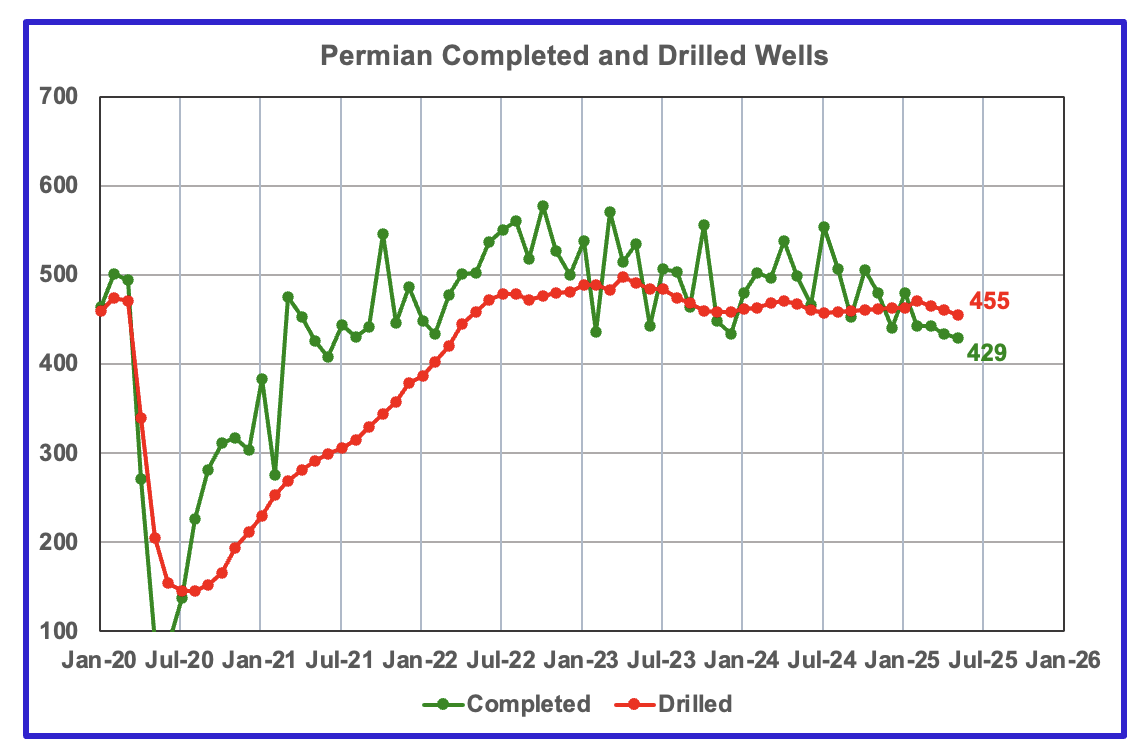
In the Permian, the monthly completion and drilling rates have begun to drop.
In May 2025, 429 wells were completed while 455 new wells were drilled. This is the fourth month in a row in which the number of wells drilled exceeded the number of completed wells.
66 responses to “US April Oil Production Hits New High”
T’s Copper Tariff
If copper is such a strategic metal for the US, isn’t it better to buy it offshore and at the same time develop a long term plan to slowly increase internal production.
““Copper is necessary for Semiconductors, Aircraft, Ships, Ammunition, Data Centers, Lithium-ion Batteries, Radar Systems, Missile Defense Systems, and even, Hypersonic Weapons, of which we are building many. Copper is the second most used material by the Department of Defense.”
I guess at some point the world will face peak Copper. The beauty of copper though is that a lot can be recycled.
https://www.cnbc.com/2025/07/09/trump-says-50percent-tariff-on-copper-will-begin-aug-1.html
Ovi, don’t you think it’s about time to get rid of the red lines from the Alaska chart?
That was a close shave when Iran attacked Qatar. This was not symbolic
as some of the media wanted to make us believe
30 June 2025
Australian jet fuel imports are 50% dependent on Middle East
https://crudeoilpeak.info/australian-jet-fuel-imports-are-50-per-cent-dependent-on-middle-east-oil
This post contains some details on the US Patriot batteries which
defended Qatar. 2-4 interceptors per missile
Moved just in time from South Korea and Japan, suggesting the US may be
unable to handle ME and Taiwan crises simultaneously
On 29 October 2024, the Army awarded Lockheed Martin a contract modification with a not-to-exceed value of $752.3 million and current obligations of $368.6 million to support the increased production capacity of the Patriot Advanced Capability-3 Missile Segment Enhancement missiles. This contracting action increases Lockheed Martin’s annual PAC-3 MSE missile maximum production rate from 550 to 650 annually.
https://www.army.mil/article/281669/us_army_awards_patriot_advanced_capability_3_contract_worth_up_to_368_6_million
14 Iranian missiles were fired at Qatar requiring 28 – 56 interceptors or up to 1/10 of annual manufacturing capacity
Tehran has rejected request for Rafael Grossi to visit nuclear
facilities bombed by Israel and US during conflict.
https://www.aljazeera.com/news/2025/6/30/iran-hardens-stance-against-iaea-and-its-chief-in-wake-of-us-israel-attacks
The IAEA has confirmed that they’ve deactivated and removed over 27
surveillance systems at key sites like Natanz, Fordow, and Isfahan.
https://thestatesalert.com/breaking-iran-removes-all-un-surveillance-cameras-from-nuclear-sites-bars-iaea-chief/
One wonders how these cameras have survived the attacks?
After U.S. Strikes, Iran May Be Determined to Build a Nuclear Weapon –
The New York Times
Iran will now be more motivated than ever to rebuild their capabilities
and pursue not just uranium enrichment but actual weaponization
https://www.nytimes.com/2025/06/22/us/politics/iran-nuclear-weapon.html
17 June 2025
Australian diesel import dependency on Middle East oil. Update April 2025
https://crudeoilpeak.info/australian-diesel-import-dependency-on-middle-east-oil-update-april-2025
In the meantime IAEA inspectors have left Iran unharmed.
Whether they will be allowed to ever come back is a big question.
Iran can still build nuclear weapons without further enrichment. Only diplomacy will stop it
https://thebulletin.org/2025/07/iran-can-still-build-nuclear-weapons-without-further-enrichment-only-diplomacy-will-stop-it/
Once Iran has a nuclear weapon, Iran will set the level of oil prices no matter what. Many scenarios. Closure of Hormuz is a last suicidal act when the regime goes down
We do seem to be in a chaotic state. Production still managing to claw higher, barely. But drilling rates drifting down and tension in critical parts of the world. Politicians playing with fire. My guess is that diplomats are working overtime trying to keep things under control. Thinking about “what if” makes my head spin.
Rig Report for the Week Ending July 3
The rig count drop that started in early April when 450 rigs were operating continues and hits another new recent low.
– US Hz oil rigs dropped by 14 to 384. Of the 14, 8 were from Texas.
– New Mexico rigs were down down 4 to 79 while Texas dropped 8 rigs to 210. Texas Permian dropped 7 to 171.
– In Texas both Midland and Martin were down 1 to 20 and 24 respectably. However Loving added 3 to 33 while Reagan dropped 4 to 9.
– In New Mexico both Eddy and Lea dropped 2 to 41 and 38 respectively. Lea is down 12 rigs from the end of February while Eddy is down 4.
– Eagle Ford is unchanged at 33.
– NG Hz rigs dropped 2 to 94.
Wow that is a big drop in horizontal oil rigs in the Permian Basin, 11 rigs (4.2% in a week or 11/261). For all of the US it was about 3.5% for the weekly drop in horizontal oil rigs
https://peakoilbarrel.com/wp-content/uploads/2025/06/US-Tot.png
Ovi how do you read this?
I read this that IEA through this STEO release admits that US peaked in May ??!
Correction I meant EIA, IEA is a typo my right hand is faster than my left one.
Svaya
Yes the EIA is admitting that US oil production has peaked or very close to peaking. The lower onshore 48 is more clear in that it is showing production has peaked and in decline. There may be some extra production coming from the GOM that will keep overall US production in a slowly declining plateau.
I am waiting to see if some commentator on Fox announces that US production has peaked and the King just happens to be watching.
Check the updated US chart later tonight when I post the World update.
Frac Spread Report for the Week Ending July 3
The frac spread count dropped by 3 to 176. It is also down 66 from one year ago and down by 39 spreads since March 28.
God Bless, America !
https://www.oilystuff.com/forumstuff/forum-stuff/happy-america-day
“Freedom isn’t free” is a slogan I have heard much of my adult life, almost always associated with praising our military and the sacrifice veterans have made. We are well educated about soldiers freeing us from British tyranny in the American Revolution and keeping us free from the Nazis and Japanese in the Second World War. The question of this moment is, what are the greatest threats to our freedom in the here and now, and what price will they demand from us? It is time to reconsider how we think about the price of freedom and who needs to pay it.
I see Congress in action at committee meetings and votes. Many of these legislators clamor incessantly for preparations for war with China, Russia, and Iran, while cheering on the undeclared and illegal wars in concert with Israel against Palestinians, Yemenis, Lebanese, and Syrians. That cheering makes war inevitable, as we see with this latest attack on Iran. Neither Iran nor any of these nations is a significant military threat to the U.S. but perhaps China is, which has not shown hostility to the U.S. except when we carry out war games and build dozens of military bases in their neighborhood. The only serious foreign threats to the U.S. that I see are the 12,000 nuclear weapons in nine different nations, which can annihilate civilization in the next few hours. That threat could be reduced or eliminated by reducing the number of nuclear weapons or eliminating them altogether. Instead, we are spending a fortune building new ones.
Less apocalyptic but more likely threats to freedom loom large in the rise of authoritarianism and the political divisions it thrives on, the flouting of the Constitution and the rule of law (both domestic and international), environmental degradation, potential pandemics, and increasing wealth inequality impoverishing millions. When ideologies make it hard to talk to neighbors and family, we lose trust in our common identity as Americans. When neighbors are kidnapped off the streets and sent to foreign prisons without due process and against court orders, our loss of trust in government becomes severe. Supporting genocide overseas diminishes our global reputation.
As I look at these threats, a strong military cannot protect us from any of them. In fact, huge expenditures on the military contribute directly to several of these threats through its monstrous environmental footprint and the way it stimulates potential enemies to arm themselves against us. It contributes indirectly by siphoning resources that could otherwise be used for tackling the many serious problems we face. Worst of all, the military can be co-opted by a tyrant, something that we saw being done in real-time with the ridiculous and costly parade on June 14. Soldiers who find identity in this kind of display will be the ones who enforce our loss of freedom, unless they ask themselves a question.
I urge every member of the armed forces, and police to consider, “what is your red line?” What order will you refuse to follow because it violates your oath to the constitution, your duty to protect the common good, or even defend basic human dignity? I think of the police officers who surround every demonstration I witness. They are usually polite, protect people from traffic, and sometimes intervene with counter protesters. Most of the time I appreciate their work. My question to them is, what will you do when they give you an order to arrest us for no more than we are doing today?
What will you do when they order you not just to arrest us but to intentionally harm us?
What will you do when they tell you to deport us to concentration camps?
Because they are either the prime enforcers of our freedom and safety, or instruments of violence and tyranny, each armed officer needs to know their red line ahead of time, so when the order comes they do not follow it blindly.
Since armed forces can’t protect us from most modern threats, each of us must define our own red line.
How long we will look the other way when our neighbors are abducted, our colleagues doing useful work in science and medicine are laid off, and protest is criminalized?
When will we stop cooperating with violations of the law and brutality toward our neighbors? By cooperation I mean keeping our heads down and not speaking out, and going about our business as though this is not our problem. We saw millions recognize their red line and demonstrate on June 14. Will enough of our neighbors join us, and will demonstrations be enough?
How can we invite others to join us in using tools more powerful than demonstrations? Proven tactics from the huge array of nonviolent action: things like blockading illegal deportations; blocking illegal shipments of weapons; or refusing to pay taxes until the rich pay their fair share, and the government obeys the law.
The single most powerful instrument for freedom is probably the general strike that can shut down the entire system or at least the worst parts of it. We need to learn about such things from our fellows in the unions, and begin to train intensively to become effective.
We will do well to stop thinking that the only thing between us and tyranny are the police and the military. The price of freedom needs to be paid by all of us. Let’s gather our neighbors and support one another in taking the bold and sometimes risky actions we need to preserve our freedom.
Thank you HB for speaking up in the face of all this.
Lol. You and I both know that America is a militaristic, corporate fascist state and all the people love and celebrate it while shouting “freedom” like some robotic zombie before going back to their cheetos, tv, porn and video games.
This thing cannot be turned around, it can only march forwards to collapse.
Imagine
Song by John Lennon
Imagine there’s no heaven
It’s easy if you try
No hell below us
Above us, only sky
Imagine all the people
Livin’ for today
Ah
Imagine there’s no countries
It isn’t hard to do
Nothing to kill or die for
And no religion, too
Imagine all the people
Livin’ life in peace
You
You may say I’m a dreamer
But I’m not the only one
I hope someday you’ll join us
And the world will be as one
Imagine no possessions
I wonder if you can
No need for greed or hunger
A brotherhood of man
Imagine all the people
Sharing all the world
You
You may say I’m a dreamer
But I’m not the only one
I hope someday you’ll join us
And the world will live as one
https://www.youtube.com/watch?v=iOs9Osz3UFQ&list=RDiOs9Osz3UFQ&start_radio=1
“I’m a Russian Journalist Living in Exile. This is What Americans Can’t Take for Granted.
They always come at 6 a.m.
During the first nine months of Russia’s invasion of Ukraine, I spent every morning waiting for the police to arrive.
Every Russian opposition leader, civil rights activist and independent journalist lives with that same daily fear that police will come to search their home and then most likely arrest them. Or that it will happen to their family members. I finally left Russia in December, even though I never wanted to live in another country.
And now in exile, I worry every day that my brave colleagues still in Russia face the same searches, the same fear, for simply trying to do their job.
Often, we don’t appreciate what we have until we’ve lost it. Independent journalism is necessary for the best version of your state, your country or your world. But it won’t exist without civil society, freedom of speech and support from its audience. Americans should be proud — they have everything, unlike Russia now. And you shouldn’t take it for granted.
How much can change in five years
The Russian government is afraid of independent journalism.”
https://www.icfj.org/news/im-russian-journalist-living-exile-what-americans-cant-take-granted
BTW, I would have put the original comment in the Non-oil comments
This fear is the same in Germany for everybody, that critizises the Government on social media or highlights and social problems; the authoritarian governments of the west are not an inch better than the authoritarian governments of and 2nd or 3rd world country.
Typical old fart neocon bullshit. Our current president is happily selling our oil and gas for cheap, when we should be saving it for future generations of Americans who will desperately need it. To quote a REAL American hero, George Carlin, the flag is just a symbol and symbols are for the symbol-minded.
Thank you Layman, an actual patriot.
Hole in Head, Hole in Head, Where fore art thou Hole in Head ( Seriously, hope you are in good health!! ).
I know you don’t post here anymore, but I suspect if you are on the internet you are still out there lurking.
You said the USA Navy was impotent and Iran controlled the Strait of Hormuz for YEARS!!!
Iran’s ability to shoot down a plane is gone and the USA Navy DROPPED THE HAMMER on them!!
care to comment?
The US spending billions to bomb some dirt on top of a mountain in an agreed retaliatory strike with Iran because they saw Israel getting pummelled by ballistics they couldn’t stop. There is nothing the US could do to stop Iran closing the strait or whacking KSA’s oil fields. The redirecting of interceptors from Ukraine to Israel tells you all you need to know about the total dearth in industrial capacity the US has for a major war. Twelve days and the IDF and US had gone through a significant chunk of their ABM defences. The video evidence is quite stark, if you can find it from the Israeli censorship.
And if Iran wasn’ defanged of their IADS, why was Israel lobbing stand-offs from Iraq into Iran or using sleeper cell car and drone bombs instead of flying in their newly acquired air supremacy zone? Weird that.
The USA Military has established complete air superiority over Iran.
Can fly whenever and wherever they want!
If the USA wanted to it could blow Iran off the map, but Americans aren’t sadistic.
Israel had to ask Donald Trump for permission to attack.
Iran may be able to cause disruption in the Strait of Hormuz and/or disrupt Saudi’s oil fields.
It will be the end of their regime. There will be no celebration. As things currently stand.
So… you’re letting Iran get a nuke now then since they absolutely will be doing this at this time? You do realise that, yes?
Remember how you guys kept saying you’d deal with the DPRK and then they, unbeknownst to your amazing intel services, got a nuke and now are untouchable? I remember. It’s very funny.
Americans not being sadistic… hmm. You did kinda end up killing over a million Iraqis and many Afghanis and destabilising the region when you decided to depose the dictator of the former, whom you gave chemical weapons to in the ’80s, so he could attack Iran in a war that killed many civilians. Care to think of another descriptor for Americans that isn’t deluded?
While we’re on the subject, how’s your war with Russia going? Have you “blown them off any maps” lately, or are you kinda losing badly in that one too I hear NATO is tapped out fighting what I am assured is a gas station with decrepit nukes, or something.
“Americans not being sadistic”
Americans are fallible no doubt and make mistakes and can be tribal, and wrongly kill people etc.
Imagine if Kim Jong Un had the US Military…we would all be mind slaves singing songs about how great Kim Jong is all day long while starving to death
America isn’t doing that, but it could. Instead the US Navy is providing a valuable service to the world, by policing the oceans.
This is the only reason globalisation is sustainable.
Have you ever considered, even for a moment, that maybe people actually don’t like America?
Wait, wait…you mean you people don’t like pizza and burgers and hollywood movies and guns and porn and nascar and the superbowl and wrestling and huge cars and huge houses and enslaving young people in debts that can never be repaid?
There’s something wrong with you! Love it or leave it! Don’t let the door hit you on your way out to your third world craphole village!
https://www.cia.gov/library/abbottabad-compound/13/130AEF1531746AAD6AC03EF59F91E1A1_Killing_Hope_Blum_William.pdf
Andre,
Within the context of global trade, I had always understood US surface fleet investments as primarily benefitting (i.e. subsidizing) middle east oil exports. East coast of China to West coast of US not particularly vulnerable to similar disruptions. Right?
If you remove the US Navy from policing the Oceans
You will get piracy and barbarism.
I know many people outside the USA don’t like Americans, again imagine Saudi Arabia with the US Navy. . Women would be forced to cover their faces and not be able to have an opinion all around the globe!!!
Would you want to live in that world?
If you benefit from globalisation you are benefitting in a very large part because of the USA Navy.
O beautiful for halcyon skies,
For amber waves of grain,
For purple mountain majesties
Above the enameled plain!
America! America!
God shed his grace on thee
Till souls wax fair as earth and air
And music-hearted sea! ……
https://youtu.be/2xcQIoh3FQQ
This was the spirit of the FDR’s Hundred Days . Action, and action now. Said Will Rogers: “The whole country is with him, just so he does something. If he burned down the Capitol, we would cheer and say, ‘Well, we at least got a fire started anyhow.’ “
Easy on the poor guy! You are right like 8x over. Every time you egg him on, and he responds his case looks worse and worse.
GOT2SURF,
If I remember you sell solar panels? Those are a product of globalization,.
The US Navy enforces “The Freedom of the Seas”, very biased in Americas favor but many many beneficiaries.
Take them away, and where are we at?
Piracy and Barbarism??
No more Solar Panels, EV Batteries, Microchips…etc
Great memory Andre! I’m impressed.
Solar panels, after a start from Bell Labs, are actually a product or ARCO and EXXON! Oil companies are solar’s first big promoters! Is that ‘globalization’??
I’m calling the big bad bill the ‘Make China Great Again’ Bill. In the history of the world there has never been a bigger giveaway to China!!
The USA has willingly ceded all weather, climate and ocean science to China, as well as all Solar and Wind technology! Never in the history of the world has an advanced power so bent over for an adversary.
We will be digging up our 1.2 trillion pounds of coal, while the rest of the world develops its clean green carbon free energy resources.
Hi , Andre . Tks for your concern about my health . As someone who is waiting to meet his ”maker ” all I can say is ” so far so good ” , I am in the ” shrinking the technosphere ” mode and also my focus has shifted from ” peak oil ” to ” Climate Change ” ( just like George Kaplan ) . So here goes . You have to understand the chronology and timeline of events .
1, Iranian parliament passes law to shutdown the Strait of Hormuz . This must be now approved by the Supreme Council / ala Supreme leader .
2. Oil has gone up from USD 65 to USD 77 in 10 days . Up 20% .
3 . Panic in the countries using the strait but on the top of the list is Qatar .
4 . Phones are ringing to DJT from everybody in the nations using the Strait . Help .
5, Phone is ringing from Benji to DJT . Help . We are FUBAR . Evidence censorship of all media and an exodus of dual citizenship individuals from Israel but forcebally enforced by ORDERING El Al the airline not to issue tickets to Israeli nationals .
6 There is a 36 hrs window before the markets open in NYMEX and oil goes thru the roof .
7 . That is when the Kabuki as outlined by Kleiber is sketched out .
The US / NATO is still fighting WW II , Sending the Nimitz to the Gulf was like sending a sitting duck / tincan . They should have learnt from the Red Sea experience . There is a solution for ignorance — it is education but there is no cure for stupidity . It will be scrapped next year as past life anyway . The days of the 5 eyes are over but they are not going to acknowledge that , Maybe after Ukraine ends .
In the meanwhile we have the alphabet soups like NATO , QUAD , AUKUS , EU etc farting away to glory and living in ” la la land ” . The leaders don’t understand the concept of ” nett surplus energy ” .
Just asking did the Aussies get the nuclear submarines promised for which USD 35 million was advanced to the US and what about those flying tin cans called F 35 . One ( Brit owned) is stranded in Kerala ( India ) and paying a parking fee of USD 1000 per day since three weeks . No mechanics to fix this SOB . It is now a tourist attraction .
Be well there down under . I only came back to respect your call .
https://www.youtube.com/watch?v=_nmOacGRN1E&ab_channel=WION
Glad you are well HIH.
I admire you for showing up to take your medicine /sarc
The USA Navy and air force easily handled Iran. Controls the water and air around them.
Please continue to post…I like hearing your opinions.
Thank you Ovi for this work. So, surprisingly, the US peak is in the past. And while the rig count keeps on falling, the world is lurking on an instable plateau. Instable in many senses, especially for the looming distribution battles. With every month passing it seems more obvious, that the second world peak won’t surpass the first one of November 2018. Gone is the world’s ability to adapt production to rising demand, and the first victim in the developed world, that cheerfully cut itself off from supply like a crazy coconut knight, is Europe. I see a lot of trouble ahead …
Westtexasfanclub,
OPEC plus has some spare capacity so there might be a new 12 month average peak in 2025 or 2026, but if so it may only be marginally higher than the 2018 centered 12 month average. The statistical review of world energy has the 2018 peak at 83.6 Mb/d and 2024 at 82.8 Mb/d, the OPEC Big 4 have about 2 Mb/d of spare capacity, so potentially World output could rise as high as 84.8 Mb/d, there is also potential increases from Argentina, Brazil, Canada, and Guyana that could more than offset decreases elsewhere in the World. A new peak somewhere in the 2027-2029 time frame seems likely in my opinion.
Dennis
I am beginning to wonder how much spare capacity OPEC really has. For June they were to increase production by 411 kb/d. According to Reuters, June production was 270 kb/d. For May OPEC 9 had a target of 21.64 Mb/d but only produced 21.51 Mb/d, short by 0.13 kb/d.
Also we need to make some allowance for a yearly World decline rate, which I think is somewhere between 250 kb/d/yr and 500 kb/d/yr. Recall that Saudi Arabia admits to a 2% decline rate in Ghawar, which translates to a decline rate of close to 70 kb/d/yr.
https://www.reuters.com/business/energy/opec-oil-output-rises-june-saudi-uae-hikes-reuters-survey-finds-2025-07-04/
Ovi,
There are 5 non-OPEC plus nations that have been increasing output by more than the rest of the non-OPEC plus nations are declining (roughly 400-500 kb/d as I recall). The OPEC Big 4 probably have 2000 kb/d of spare capacity, most of this (around 70%) is Saudi Arabia. Note that Ghawar is not the only Saudi field, other fields make up for the decline there. In any case we will see how much they choose to bring online. We will see how it goes.
Following not behind paywall
https://oilprice.com/Latest-Energy-News/World-News/OPEC-Nudges-Output-Higher-But-Markets-Are-Awaiting-the-Real-Barrels.html
Saudi Arabia and UAE increased output by 300 kb/d with some decrease from Iraq offsetting (due to earlier overproduction above quota) OPEC up 270 kb/d in June. At that rate they would be up to 2160 kb/d after 8 months.
Non-OPEC C plus C output 2021 to 2025
Yes, Dennis, a 12 month average will be closer than the November 2018 spike. You see the glass half full and I see it half empty. In the end we are nitpicking and what really counts is the big picture: As Ovi wrote, OPEC alone has a yearly depletion between 250 and 500 thousand barrels/day. So the world will lose each year somewhere between half a Million and one Million barrels/day, right? Taking this in account, I can’t see any peak later in 2028 or 2029. My best case is an extended plateau (maybe even beyond 2030) which might give the world some time to adapt.
West Texas Fan Club,
I think we will see OPEC crude output return to near the 2022 post pandemic peak, particularly for the Big 4 producers (Saudi Arabia, UAE, Iraq, and Kuwait).
Dennis
In the article you reference it states:
“Meanwhile, investors remain skeptical. Between compensation cuts, under-compliance, and the political need to appear unified, the 411,000 bpd headline number rarely translates into reality. Traders are watching flows, not pledges.”
So the 270 kb/d increase is short by 140 kb/d.
There could be a surprise coming in OPEC production.
Ovi,
I don’t expect we will see 411 kb/d increases per month from OPEC, but we might continue to see 250 kb/d for a few months. Just Saudi Arabia and UAE have about 1507 kb/d of spare capacity as of May 2025.
Spare Capacity
Saudi Arabia – 1403 kb/d
UAE – 116 kb/d
Iraq – 533 kb/d
Kuwait – 298 kb/d
Iraq has been producing above its quota and is holding back output to pay back for producing excess in past months.
When I see what the Iraq oil production looks like, I see a second peak of production in Nov 2022 after the first in March 2019. I don’t know from where are coming the diffculties (above ground? Under ground?) but I would not count on a spectacular rebound of Iraq production. The oil reserves untapped during the UN sanctions may not have been that significant.
Westtexasfanclub
Thanks
What is not clear now for US production is whether it will be in a plateau for a while or whether it will manifest itself as a slow decline. Clearly the price of WTI will have a say in how production going forward develops.
As for the instability and trouble ahead, the new king on the street has just added a bit more.
The global economy hardly grows in the current price band. Raise the price of oil and growth will end or even contract which obviously is negative for the price of oil. The mantra of “Price too low for producers and too high for consumers” is getting more and more realistic.
We’re effectively in that Goldilocks zone where nothing is priced well for either consumer or producer, and it’s only going to get worse as time goes on without more users dropping out of the game of musical chairs.
Yes Kleiber and Florian. In my humble opinion this is Gramsci’s time of the monsters. Factor in PO and many absurdities happening on the world stage right now suddenly make “sense”.
Oil prices aren’t anywhere near high enough to reduce flagrant waste. Wake me up when people stop driving 3 ton trucks for miles to buy a bottle of milk at a shopping mall.
True story: My father was nearly killed in WWI. Not in the war, he was a chemist at a munitions factory. He almost got killed by being run over by a taxi while riding his bike to work.
Fuel rationing was in effect at the time. The stars did not fall from the sky. The dead did not rise from their graves and walk the earth. It did not cause earthquakes or the sun to turn black. It just meant people wasted a lot less fuel.
City structures were way different back then.
Er WWII, not WWI!
Thanks for pointing that out.
In 1914, there were 1,7 billions people in the world and life expectancy (in France) was 52 years or so. Around Paris, there were still fields and farms providing food to Paris when now there are buildings and houses. So having no oil was not a problem. Now, it would be a big problem.
Yeah that was a typo, I met WWII. My father was 6 years old in 1917. He remembered his parents had a map of Europe on a table in the living room when he was almost to little to see the table top. They put pins in it marking the positions of the front lines based on news reports. He wasn’t designing shaped charges in a munitions factory.
Interesting 6 minute interview and comment on Texas/Permian production.
https://www.youtube.com/watch?v=Y2_nv0n6NwA
Thanks Ovi.
I agree a good interview.
https://oilprice.com/Energy/Natural-Gas/Canada-Warms-Up-to-Fossil-Fuels-With-New-LNG-Export-Terminal.html
Indepence Day for Canadian LNG?
The well-head price for Canadian natural gas is only $0.71/MCF average 50~70% lower than Marcellus and just 1/5th of HH price.
Similar thing happened to oil, US ripped huge profit by routing all oil and gas imports to US, and then export its own oil and gas at much higher price.
Sheng Wu
Hopefully Cdn NG prices should improve going forward.
CALGARY – A new report from advisory firm Deloitte is forecasting a big jump in Alberta natural gas prices next year, with the country’s first West Coast export facility now up and running.
The Alberta benchmark AECO price is expected to average $2.20 per mmBTU in the second half of this year and then rise to an average of $3.50 per mmBTU in 2026.
It averaged $1.36 per mmBTU last year.
By the end of the forecast in 2032, the average AECO price is expected to hit $4 per mmBTU.
https://boereport.com/2025/07/07/alberta-natural-gas-expected-to-see-a-bump-next-year-thanks-to-lng-exports-deloitte/
make Canada great again!
Sounds like Canada will get rich as fast as Iran after the oil embargo.
Article on the move to dual-fuel (natural gas/diesel) and e-frack fleets.
https://www.enverus.com/blog/pumpers-retire-or-write-down-diesel-fleets-amid-e-frac-demand/
Also have seen articles suggesting the average frack fleet horsepower has doubled from about 2750 to 5500 HorsePower in the past 5 years or so. So 150 frack fleets today may have the capability of 300 frack fleets from 5 years ago. It may also be the case that rigs are becoming more sophisticated over time so that a rig may be able to drill more feet per day today than the average rig from 5 years ago.
yes, the well-bore diameter also shrank a lot from >8″ to just over 4″, this really speed up drilling.
In China, similar things happened after introducing the small bore drilling, and number of rig dropped ~50% in the past 5 years.
T’s Copper Tariff
Since copper is such a strategic metal for the US, isn’t it better to buy it offshore and at the same time develop a long term plan to slowly increase internal production.
“Copper is necessary for Semiconductors, Aircraft, Ships, Ammunition, Data Centers, Lithium-ion Batteries, Radar Systems, Missile Defense Systems, and even, Hypersonic Weapons, of which we are building many. Copper is the second most used material by the Department of Defense.”
I guess at some point the world will face peak Copper. The beauty of copper though is that a lot can be recycled.
https://www.cnbc.com/2025/07/09/trump-says-50percent-tariff-on-copper-will-begin-aug-1.html
Well, if we put a tariff on copper, then that will make it more economical to strip the last deposits of copper from any deposits that may be left in the USA. Hey, that’s it: Drain America First!
I am probably wrong, but: huge deposit in MN up near the iron range that they will not permit, even though iron mining for 150 years; huge reserve in AZ that they will not permit – sacred ground lawsuit, even though Indians never lived on it – mountain; one of the largest deposits ever found in the world in AK, but it will “threaten” a salmon; deposits in NV desert that will be an environmental hazard. No chance of draining America first since no new mine permitted in what – over 70 years??
An update to World and Non-OPEC production has been posted.
https://peakoilbarrel.com/march-world-and-non-opec-oil-production-rises/
A new Open Thread Non-Petroleum has been posted.
https://peakoilbarrel.com/open-thread-non-petroleum-july-10-2025/