BRAZIL SUMMARY

A guest post by George Kaplan

Leasing

The creaming curve for lease sales in Brazil looks like it is turning towards the asymptote overall. Unfortunately there is insufficient data provided to allow land and marine leasing to be separated but I expect that the curve for land is close to the limit but that for marine areas is barely half way. The average take up of offers has remained high, which suggests APB, the Brazilian authority in charge, is discerning about what it offers.

Read More

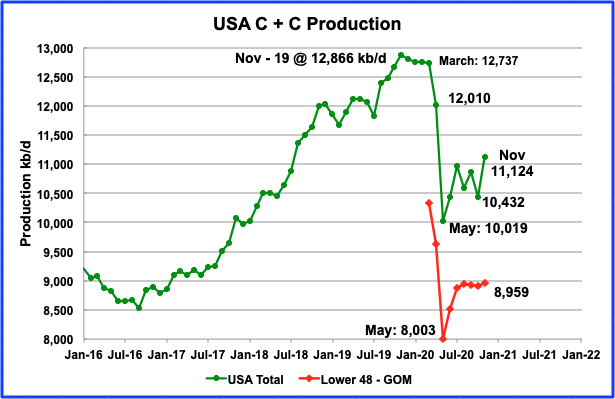
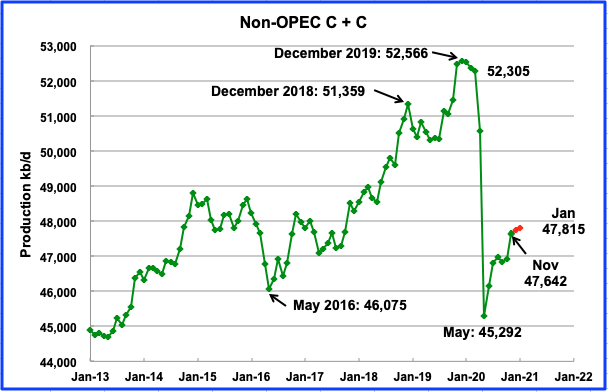
November Non-OPEC Oil Production Jumps

A post by Ovi at peakoilbarrel

Below are a number of oil (C + C ) production charts for Non-OPEC countries created from data provided by the EIAʼs International Energy Statistics and updated to November 2020. Information from other sources such as OPEC, the STEO and country specific sites such as Russia and Norway is used to provide a short term outlook for future output and direction for a few countries and the world.

This November post will primarily update the charts from the October report that was posted late on Saturday, February 20. The comments in the October post were up to date as of February 19 and so will be largely copied over to this post and updated where appropriate.

Read More

Non-OPEC September Oil Production Flat

A post by Ovi at peakoilbarrel

Below are a number of oil (C + C ) production charts for Non-OPEC countries created from data provided by the EIAʼs International Energy Statistics and updated to September 2020. Information from other sources such as OPEC, the STEO and country specific sites such as Russia and Norway is used to provide a short term outlook for future output and direction for a few countries.

Read More

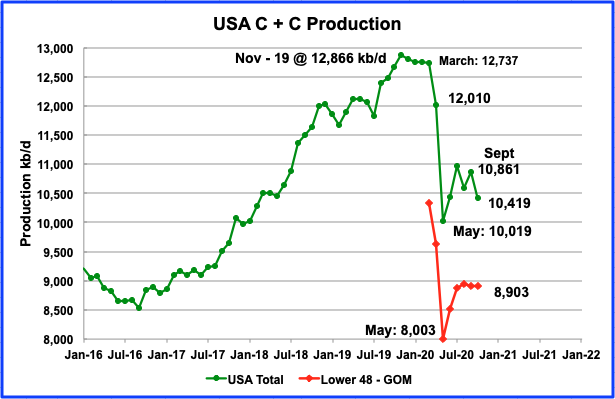
US October Oil Production Declines

A post by Ovi at peakoilbarrel

To all of our participants, I wish you a Happy, Healthy and Prosperous New Year.

All of the oil (C + C) production data for the US state charts comes from the EIAʼs Petroleum Supply monthly PSM. After the production charts, an analysis of three EIA monthly reports that project future US production is provided. The charts below are updated to October 2020 for the 10 largest US oil producing states.

Read More