OPEC Update, November 17, 2022

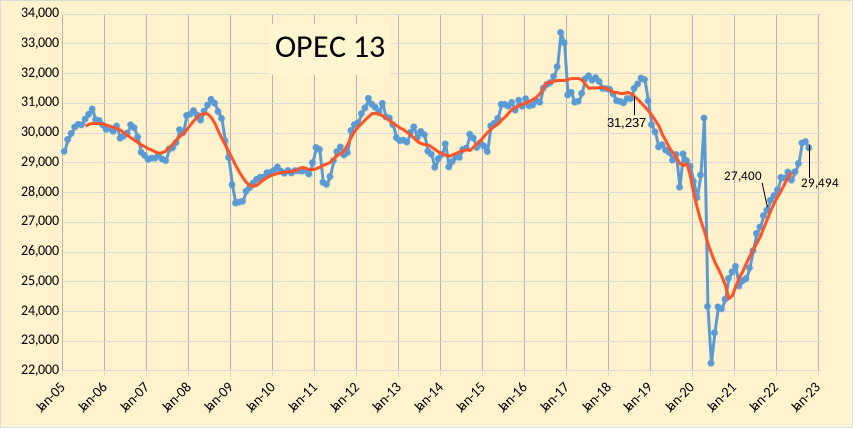
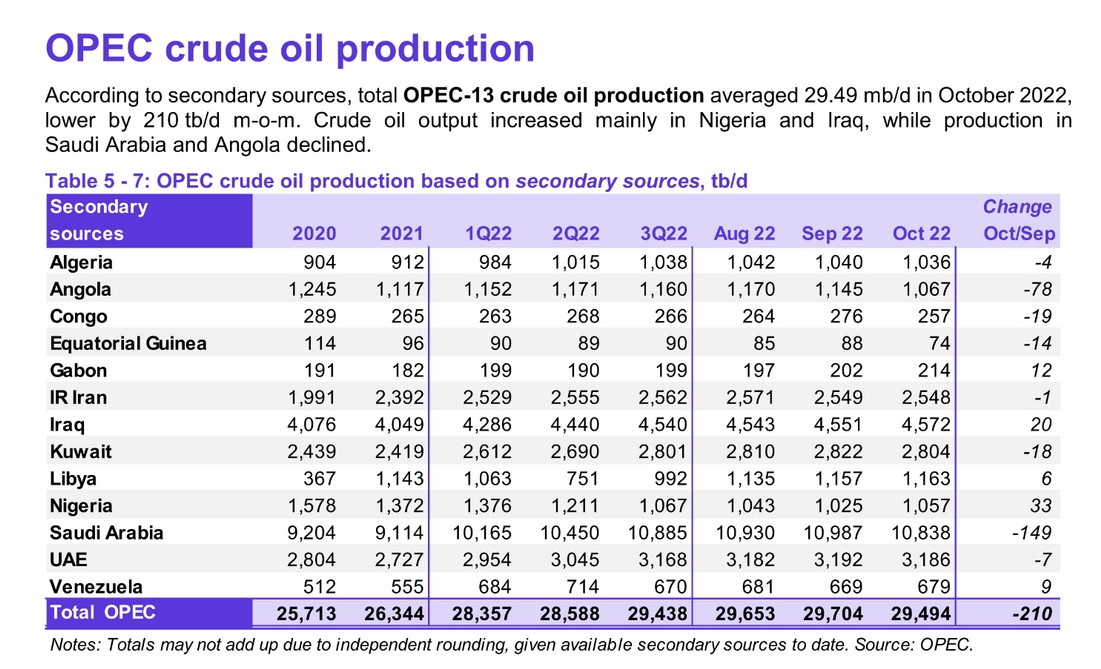
The OPEC Monthly Oil Market Report (MOMR) for November 2022 was published recently. The last month reported in most of the OPEC charts that follow is October 2022 and output reported for OPEC nations is crude oil output in thousands of barrels per day (kb/d). In most of the OPEC charts that follow the blue line is monthly output and the red line is the centered twelve month average (CTMA) output.  I also show a number of charts from the recent World Energy Outlook 2022, published by the IEA in October. I focus on a selection of charts from Chapter 7 of that report which covers oil.

Figure 1
Figure 2
Read More

Russia Oil Drop Collapses April Non-OPEC Production

A guest post by Ovi

Below are a number of Crude oil plus Condensate (C + C ) production charts for Non-OPEC countries created from data provided by the EIA’s International Energy Statistics and updated to April 2022. This is the latest and most detailed world oil production information available. Information from other sources such as OPEC, the STEO and country specific sites such as Russia, Brazil, Norway and China is used to provide a short term outlook for future output and direction for a few countries and the world.

April Non-OPEC production decreased by 1,294 kb/d to 48,925 kb/d. Of the 1,294 kb/d decrease, the biggest decreases came from Russia, 965 kb/d, Kazakhstan, 175 kb/d, Canada, 95 kb/d and Norway, 78 kb/d. There were no significant offsetting increases. The April 2022 output of 48,925 kb/d is 3,295 kb/d lower than the March pre-covid rate of 52,220 kb/d.

Read More

March Non-OPEC Oil Production at Post Pandemic high

A guest post by Ovi

Below are a number of crude oil plus condensate (C + C ) production charts for Non-OPEC countries created from data provided by the EIA’s International Energy Statistics and updated to March 2022. This is the latest and most detailed world oil production information available. Information from other sources such as OPEC, the STEO and country specific sites such as Russia, Brazil, Norway and China is used to provide a short term outlook for future output and direction for a few countries and the world.

March Non-OPEC production increased by 264 kb/d to 50,243 kb/d. Of the 264 kb/d increase, the biggest increases came from the U.S., 349 kb/d and China, 78 kb/d. Offsetting the increases were decreases from Kazakhstan, Russia and Norway. The March 2022 output of 50,243 kb/d is 1,975 kb/d lower than the March pre-covid rate of 52,218 kb/d.

Read More

February Non-OPEC Oil Production Climbs

A guest post by Ovi

Below are a number of crude oil plus condensate (C + C ) production charts for Non-OPEC countries created from data provided by the EIA’s International Energy Statistics and updated to February 2022. This is the latest and most detailed world oil production information available. Information from other sources such as OPEC, the STEO and country specific sites such as Russia, Brazil, Norway and China is used to provide a short term outlook for future output and direction for a few countries and the world.

February Non-OPEC production increased by 303 kb/d to 49,926 kb/d. Of the 303 kb/d increase, the biggest increase came from Canada 225 kb/d. Offsetting the increase were decreases from Brazil 116 kb/d and China 92 kb/d. The Febuary 2022 output of 49,926 kb/d is 2,274 kb/d lower than the March pre-covid rate of 52,200 kb/d.

Read More