U.S. November Oil Production Drops to Year Ago Level

By Ovi

All of the Crude plus Condensate (C + C) production data, oil, for the US state charts comes from the EIAʼs Petroleum Supply monthly PSM which provides updated information up to November 2024.

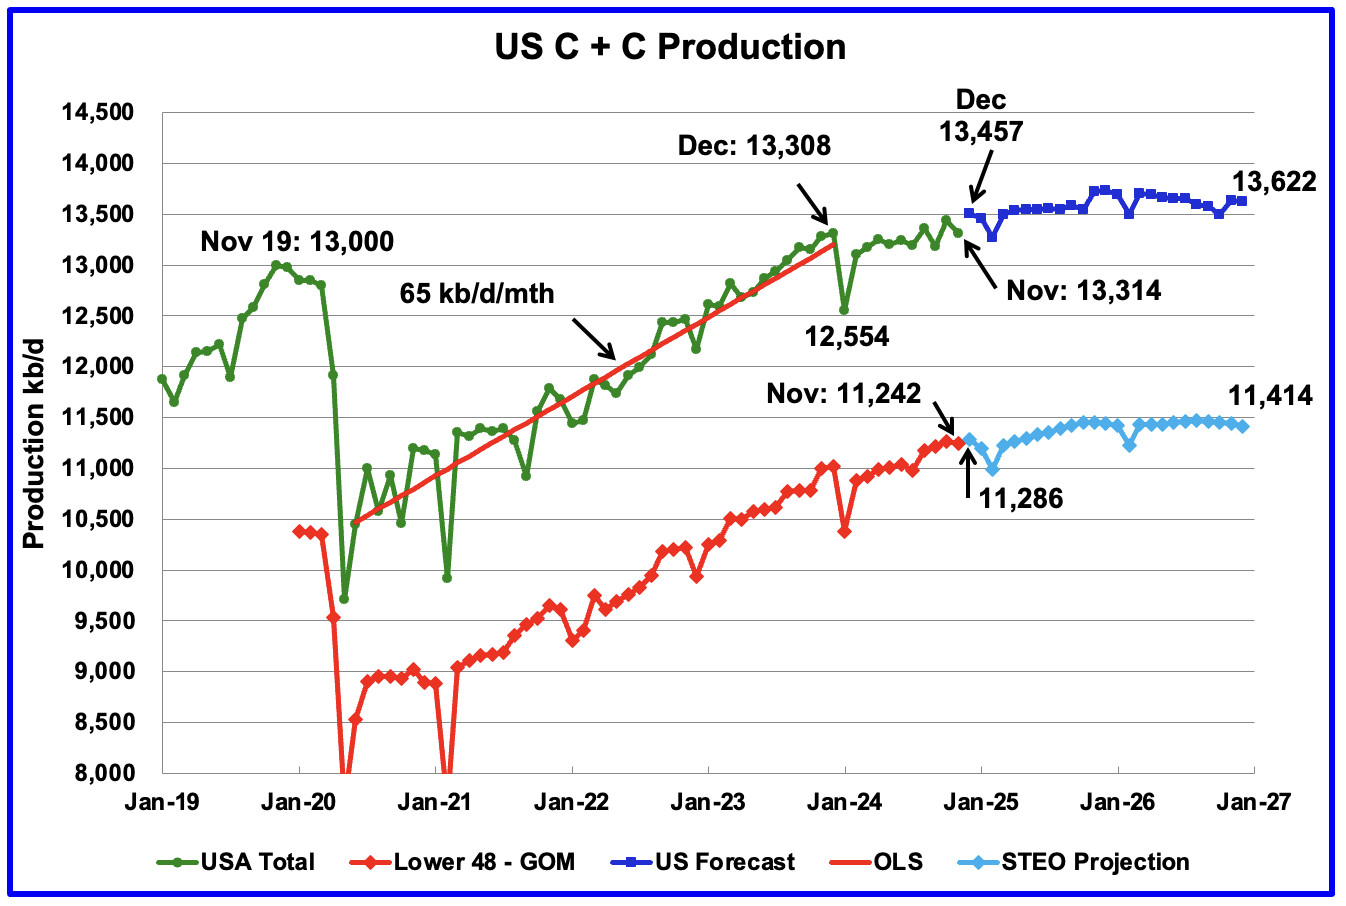
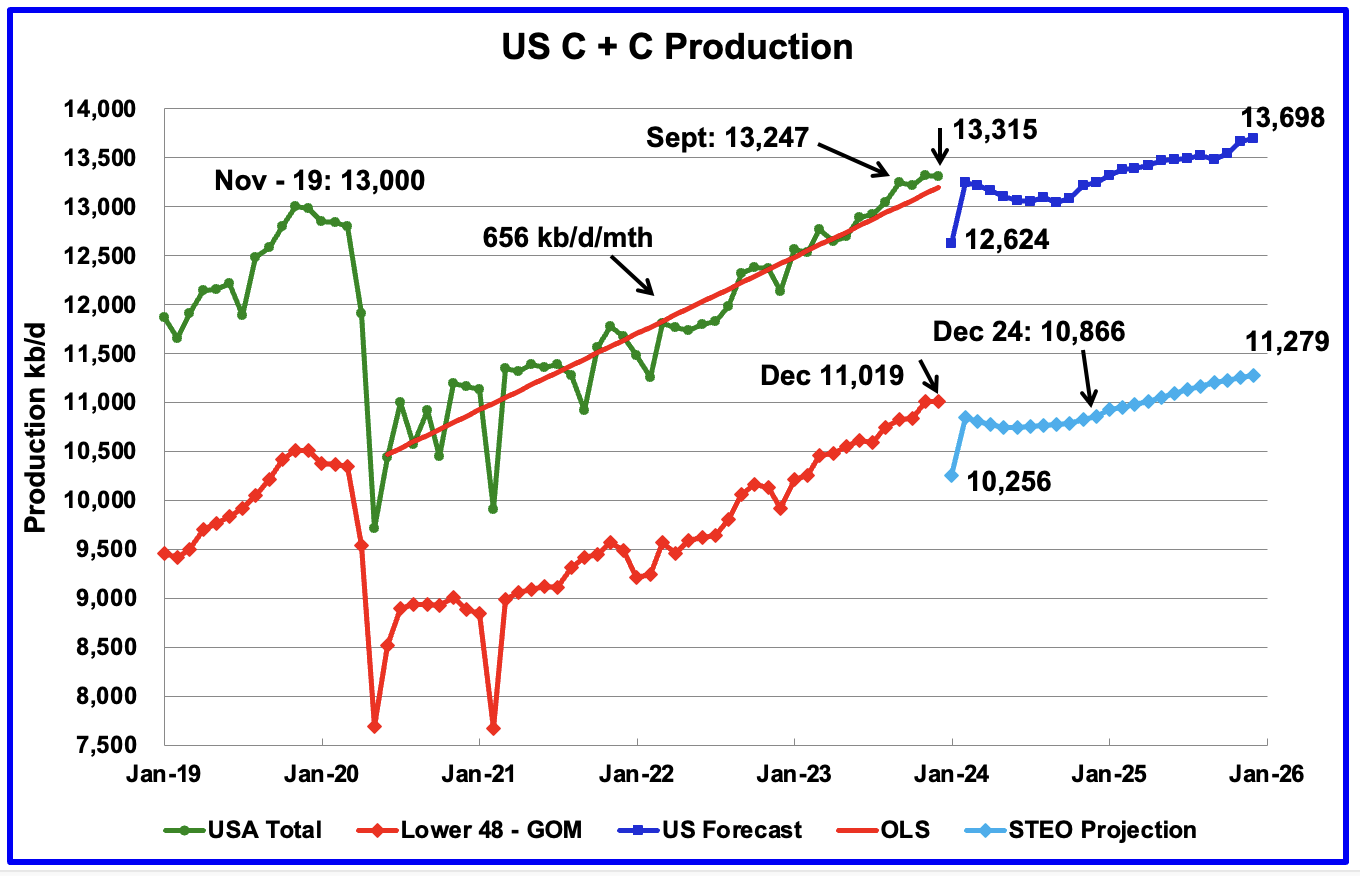
U.S. November oil production decreased by 122 kb/d to 13,314 kb/d, only 6 kb/d higher than December 2024. The largest decreases came from Texas, 70 kb/d, New Mexico 38 kb/d and the GOM 108 kb/d.

Read More

US December Oil Production Flat

By Ovi

All of the Crude plus Condensate (C + C) production data for the US state charts comes from the EIAʼs Petroleum Supply monthly PSM which provides updated information up to December 2023.

U.S. December oil production decreased by 4 kb/d to 13,315 kb/d. The small decrease was a mix of increases and decreases that netted out to a negligible decrease. The largest decrease came from Texas, 20 kb/d, offset by a New Mexico increase of 23 kb/d.

Read More

US October Oil Production Held Steady

By Ovi

All of the Crude plus Condensate (C + C) production data for the US state charts comes from the EIAʼs Petroleum Supply monthly PSM which provides updated information up to October 2023.

U.S. October oil production decreased by 4 kb/d to 13,248 kb/d. The decrease was primarily due to decreases in the GOM and North Dakota being partially offset by increases in Texas and New Mexico. Note that September production was revised up from 13,236 kb/d to 13,252 kb/d.

Read More

US May Oil Production Little Changed

By Ovi

All of the Crude plus Condensate (C + C) production data for the US state charts comes from the EIAʼs Petroleum Supply monthly PSM which provides updated information up to May 2023.

U.S. May oil production decreased by 15 kb/d to 12,662 kb/d, an atypical small change. The small change is primarily due to the upward revision of April output from 12,615 kb/d to 12,677 kb/d, an increase of 62 kb/d.

Read More

Winter Storm Drops US December Oil Production

A guest post by Ovi

All of the Crude plus Condensate (C + C) production data for the US state charts comes from the EIAʼs February Petroleum Supply monthly PSM which provides updated information up to December 2022.

U.S. December production decreased by 276 kb/d to 12,101 kb/d. For December, the state with the largest decrease was North Dakota with 135 kb/d followed by Texas with 65 kb/d while New Mexico had the largest increase, 46 kb/d. The December production decline was caused by bad weather in many states.

Read More