US July Oil Production Continues to Rise

A post by Ovi at peakoilbarrel

All of the oil (C + C) production data for the US state charts comes from the EIAʼs Petroleum Supply monthly PSM. After the production charts, an analysis of three EIA monthly reports projecting future production is provided. The charts below are updated to July 2020 for the 10 largest US oil producing states.

July’s US production continued to rebound from May’s low by adding 538 kb/d to June’s output. Since May, the US has added 965 kb/d, almost 1.0 Mb/d. May’s output was revised up by 3 kb/d from the EIA’s June report.

Read More

US May Production Plunges 2Mb/d

A post by Ovi at peakoilbarrel

All of the oil (C + C) production data for the US states comes from the EIAʼs Petroleum Supply monthly PSM. At the end of the production charts, an analysis of three different EIA monthly reports projecting future production is provided. The charts below are updated to May 2020 for the 10 largest US oil producing states.

May’s production drop is just short of 2 Mb/d by 11 kb/d. Awesome. US oil fields began a slow and steady decline from November 2019 to March 2020. March brought the combination of CV-19 and oil price drop that led to the sharp production plunges in April and May. Since the current EIA data is two months delayed, May is the second month that shows the combined effects of the pandemic and low oil prices. Will June drop below 10,000 kb/d?

Read More

US GoM 2019 Summary: Part III – Production

A Guest Post by George Kaplan

Overall Annual Production

US Gulf of Mexico C&C production has had a series of peaks; firstly two from shallow oil, the middle acceleration probably caused by the mid seventies oil shock; followed by deep oil development and finally by ultra deep oil, with a dip in the middle from the Deep Horizon drilling hiatus. Most production has come from eastern and central (i.e. mainly Louisiana) with some, and falling, from the western section (Texas).

Read More

US January Production Drops Again

A post by Ovi at peakoilbarrel

Preparing this March post has been a surrealistic exercise. Here I am providing a January US production update when at a time, January, the world had no clue that it was going to be hit with a double Black Swan event in early March . There was a hint in January on the coming pandemic for those who were listening. However, there was no clue of the Shock and Awe attack that would be launched by SA after Putin and his Oily Oligarch friend Sechin made the wrong move in the world’s Oil Chess Game. Russia thought that they had SA in Check, instead Russia and the rest of world were End Played. Now, a way must be found out of this mess. Reports are circulating that Trump and Putin have been talking and that an OPEC + meeting will be convened shortly. Let’s hope adult’s come to the table.

The silver lining, if there is one, is that the world will need lower oil prices to come out of the current economic slowdown. The question is, if an agreement can be brokered between US, Russia and OPEC, “What will be the right price for oil for both the producers and the economy?

The irony here is that Trump will be holding meetings with oil company executives shortly to see how the US can help. In the meantime the NOPEC (No Oil Producing and Exporting Cartels Act) bill keeps circulating within Congress. Interesting how the world, US positions and thinking, can be flipped upside down over night.

Read More

Gulf of Mexico Crude Oil and Gas Production

This is a guest post by Jean Laherrere

BOEM and BSEE have published in 2014 the GOM oil & gas reserves at end 2010 few months ago and at end 2011 lately.

The big change is that they now report proved and probable reserves = 2P (in contrary to SEC rules for operators reporting at the US Stock Exchange, forbidding to report probable reserves), when before they reported only proved reserves = 1P

They argue:

In order to more closely align BOEM GOM reserves definitions with the Petroleum Resources Management System definitions (SPE/AAPG/WPC/SPEE 2007), this report clarifies that Proved Reserves in this and previous reports are Proved plus Probable (2P) estimates.

The difference between original reserves estimates from previous year found little difference for discoveries before 1995

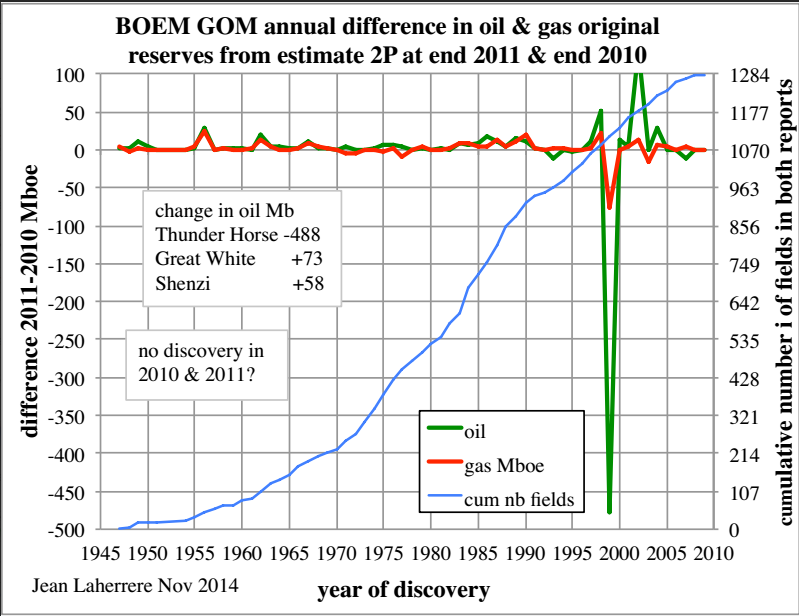
The difference between 2P 2011 and 2P 2010 is a very large decrease for Thunder Horse (-488 Mb or 573 Mboe) and the largest increase is Great White +73 Mb

Jean 1

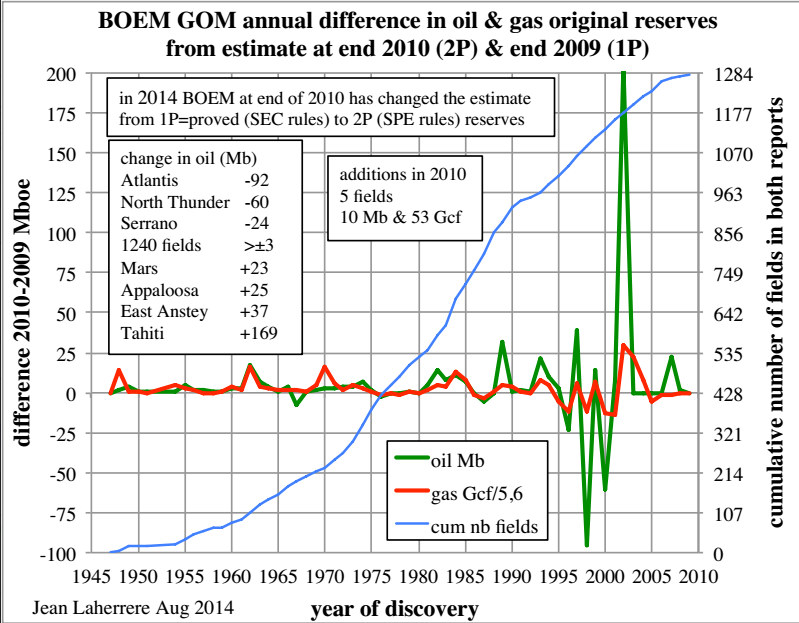
The difference between 2P 2010 and 1P 2009 displays a large increase in Tahiti +169 Gb and large decrease with Atlantis -92 Mb (already in decrease in 2009)

Jean 2

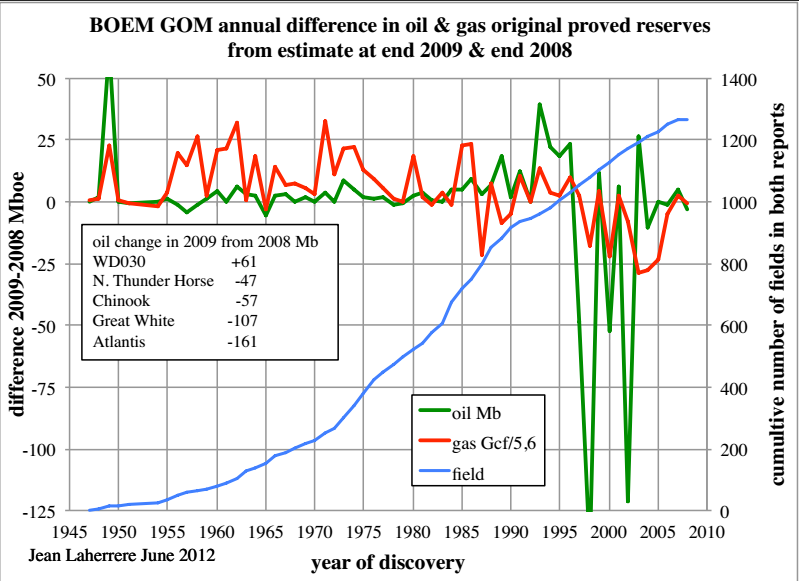
The difference between 1P 2009 and 1P 2008 is as important as the difference between 2P and 1P: large increase with WD 030 +61 Mb and large decrease for Atalntis -161 Mb

Jean 3

The change in reserves with time  and definitions does not change the estimate on GOM ultimates: 24 Gb and 210 Tcf
Read More