May Non-OPEC Oil Production drops to 2013 levels

A post by Ovi on peakoilbarrel

Below are a number of oil (C + C ) production charts for Non-OPEC countries created from data provided by the EIA’s International Energy Statistics and updated to May 2020.  Information from other sources such as the OPEC and country specific sites is used to provide a short term outlook for future output and direction.

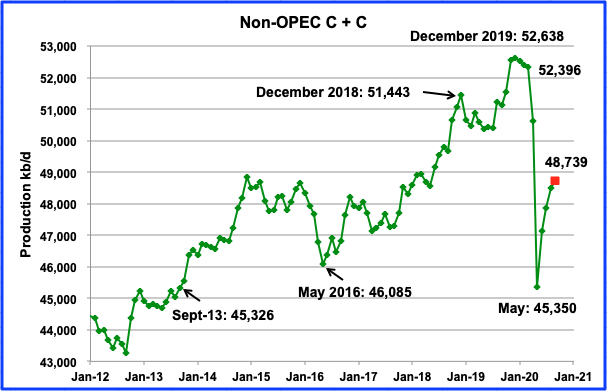
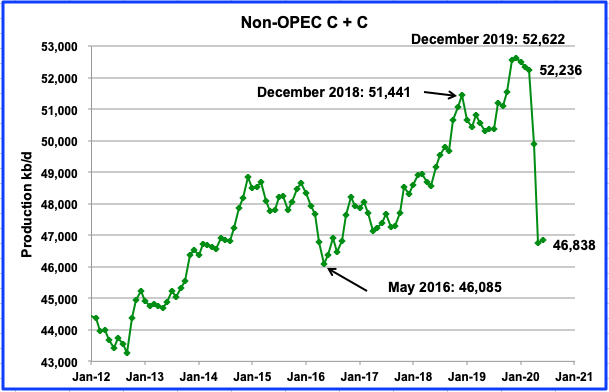
Non-OPEC production dropped slowly from a high of 52,638 kb/d in December 2019 to 52,396 kb/d in March 2020. In April that changed when we saw the first big drop in output from the Non-OPEC countries associated with Covid and with the drop in world oil prices. May output collapsed to 45,340 kb/d, which is close to the production level in September 2013.

Read More

March Non-OPEC Production Slides

A post by Ovi at peakoilbarrel

Below are a number of oil (C + C ) production charts for Non-OPEC countries created from data provided by the EIA’s International Energy Statistics and updated to March 2020.  Information from other sources such as the OPEC and country specific sites is used to provide a short term outlook for future output and direction.

Near the end, there is a section comparing World oil production with World oil production W/O the US. Interestingly, World oil W/O the US peaked two years before World oil production. The last section provides a short summary of The Shift Report, where it shows the increasing difficulty oil producing countries will have in offsetting decline in old oil fields and the difficulty in getting back to pre-pandemic supply levels.

It would be appreciated if we could have some further comments on these two sections before the Covid comments start. Does the fact that world oil production W/O the US peaked two years before World oil production make it more likely that November 2018 will continue to be the date for Peak Oil? Are there any weaknesses or missing or newer information that could shift the Shift Report time frame for meeting world demand post 2025?

Read More

Non-OPEC W/O U.S. On Production Plateau

A post by Ovi at peakoilbarrel.

This post updates Non-OPEC production to February 2020. However we are now in late June 2020 and the effects of the plunge in the price of WTI which began on January 6 and ended in the negative low of $-37.63/bbl on April 20 is showing up in plunging production numbers in US and other oil producing countries that post more recent output numbers. However WTI has now recovered to close to $40/b and weekly US production numbers are indicating that output may have bottomed.

Read More

Non-OPEC Oil Production Punches New High

A post by Ovi at peakoilbarrel

As I wrote in my previous post, preparing these last two has been a surrealistic exercise. The oil market environment for this post has been even more surrealistic than the previous one and the associated futures contract prices have been extremely volatile this week. The May WTI front month contract went negative on April 20 for the first time ever and closed at negative $37.63/bbl while the June contract closed at $20.43. Today’s settled price, April 24, for the June contract is $16.94.

On April 7th, OPEC + finalized a record oil production cut of 9.7 Mb/d after days of discussion. The 9.7 million bpd cut will begin on May 1 and will extend through the end of June.  The cuts will then taper to 7.7 million bpd from July through the end of 2020, and 5.8 million bpd from January 2021 through April 2022. The 23-nation group will meet again on June 10 to determine if further action is needed.

The lone hold out to the deal was Mexico which was expected to cut 400 kb/d but would only agree to 100 kb/d. This was a real Mexican standoff and Mexico won because they had hedged their oil output and the more the price dropped, the more they made on their hedges. According to this report, they hedged their oil at $49/bbl in January. It was unclear how many barrels were hedged or how much was spent.

Read More

World Oil Output Last 3 Years

The EIA publishes every possible energy stat for the USA and hardly anything for the rest of the world. Well, anything current for the rest of the world anyway. Their International Energy Statistics is already five full months behind and working on six. December 2014 is the last international oil production data we have.

Anyway during this lull in other data I decided to look at the last three years of international data, from December 2011 to December 2014. All data is in thousand barrels per day.Post 1

World C+C production was flat for most of 2012 and 2013 but in late 2013 production took off and has increased by about 3 million barrels per day above the average for 2012 and 2013. December C+C production was 79,300,000 BPD.

Read More