OPEC’s 2015 World Oil Outlook

The OPEC 2015 World Oil Outlook came out a few days ago. They basically produce two outlooks, a medium term outlook to 2020 and a long term outlook to 2040. I found their medium term outlook pessimistic in some cases to optimistic in others. But I found their long term outlook to be wildly optimistic… in most cases.

In all cases below I chart crude when it is available and “liquids” only when no other option is available. The data is in million barrels per day.

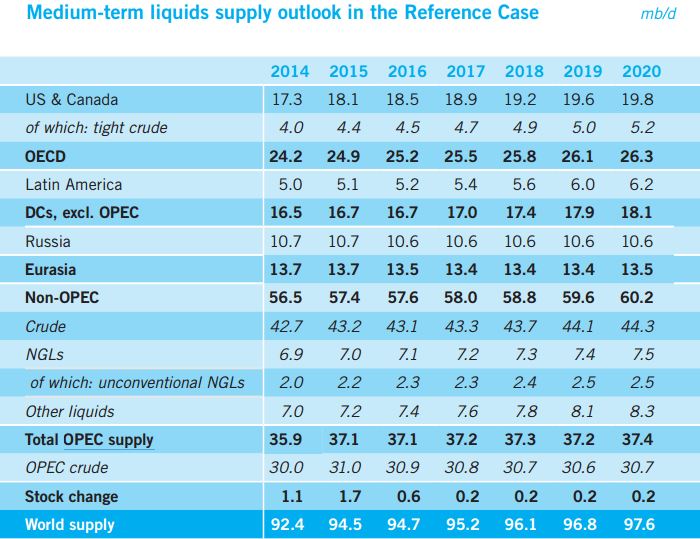
OPEC Med. Term Outlook

Here is their medium term outlook chart. Notice they expect both OPEC and Non-OPEC crude to decline in 2016 but Non-OPEC crude starts a slow recovery in 2017. They say OPEC crude will not start their recovery until 2019.
Read More

The Case For Peak Oil

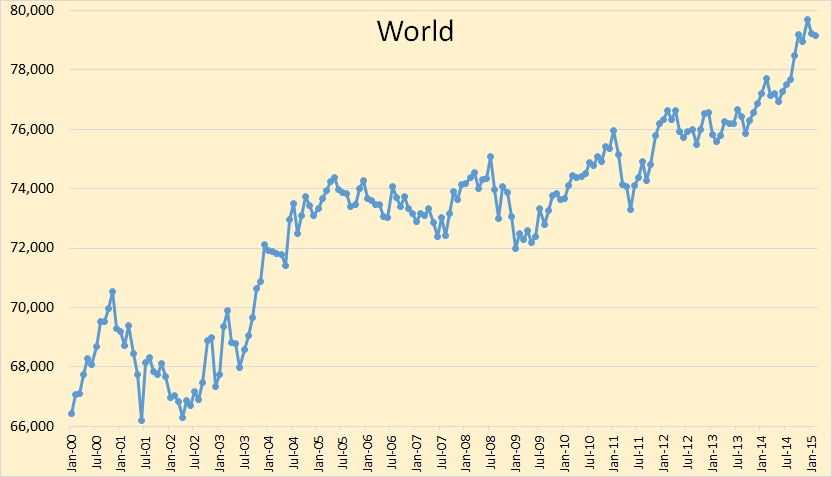
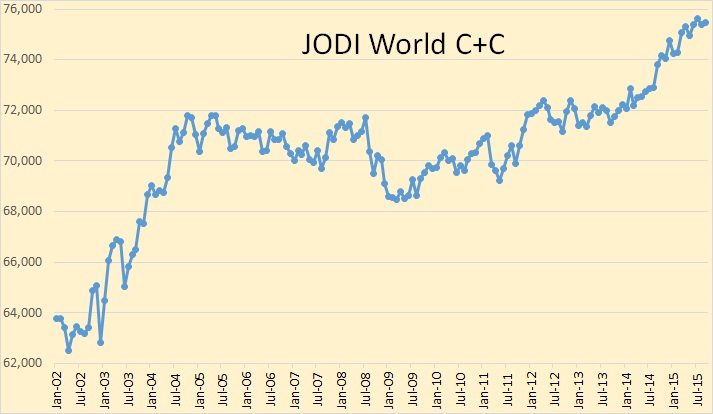
All charts below were created with data from JODI, the EIA and OPEC MOMR. It is in thousand barrels per day and the last data point is September 2015.

JODI World C+C

World crude oil production has taken off during the last two years due primarily to US shale oil production and higher output from OPEC. However very high oil prices has enabled many other countries to increase drilling rigs and production.

Read More

International Rig Count Still Falling

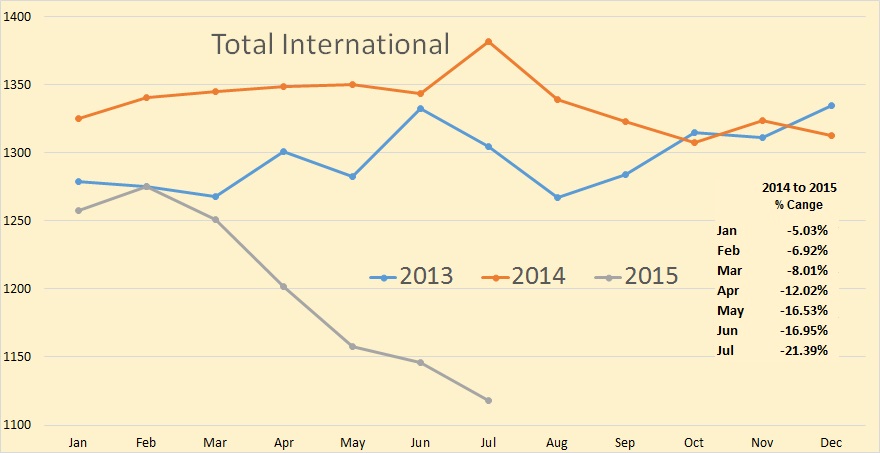
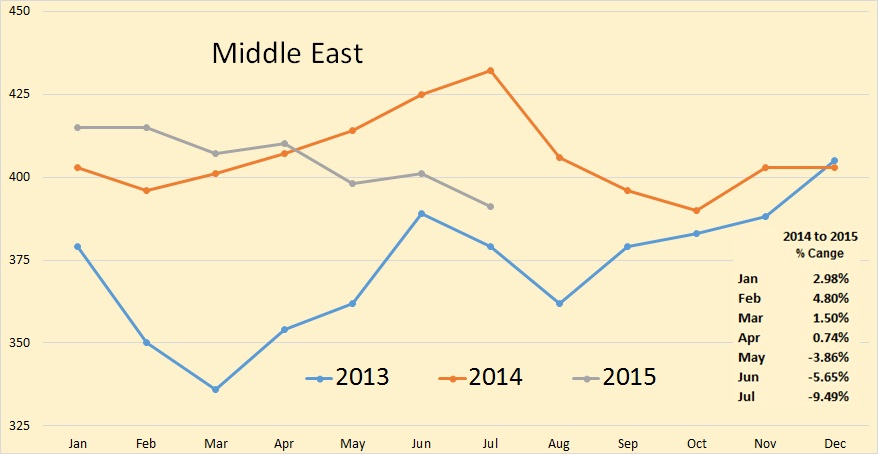
The Baker Hughes International Rig Count is out. I have decided to try something new with the charts. That is to compare the current year’s rig count with the previous two years count and to insert, within the charts, the percent change for this year as compared to last year. Also, this is the total rig count, Oil and Gas. Also the charts are not zero based. I do this in order to better emphasize the monthly change.

July usually sees a big jump in rig counts. This year there was a very tiny July increase, only a fraction of the increase we usually see for July.

Rig Count Total International

*The Total International rig counts does not include the USA, Canada or the FSU. The Total International rig count was down 28 in July to 1118. Last July it was up3 to 1344.


Rig Count Middle East
Read More