Why we are at Peak Oil Right Now

In this life nothing is certain. Therefore I am not declaring, absolutely, that we are at peak oil, only that it is a near certainty. But I am putting my reputation on the line in making the claim that the period, September 2014 through August 2015 will be the year of Peak Oil. Below are my reasons for making this claim.

First of all, Peak Oil is not a theory. The claim that Peak Oil is a theory is more than a little absurd. Fossil hydrocarbons were created from buried alga millions of years ago and they are finite in quantity. And as long as we keep extracting them in the millions of barrels per day, it is only common sense that one day we will reach a point where their extraction starts to decline. In fact most countries where oil is extracted are already in decline. So obviously if individual countries can experience peak oil then the world as a whole can also experience peak oil.

All charts below are in thousand barrels per day of Crude + Condensate with the last data point September 2014.
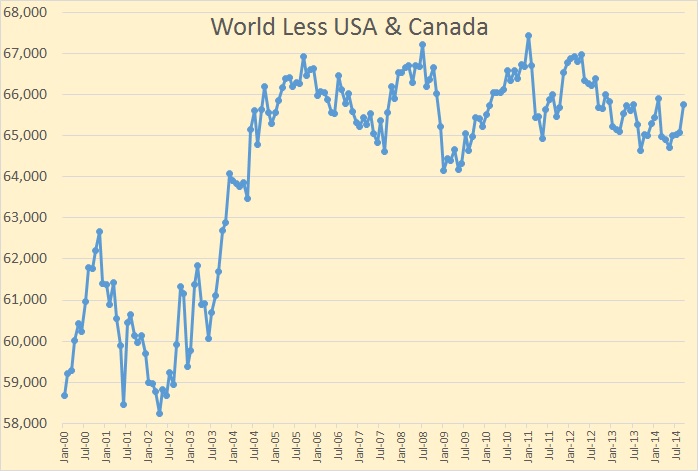
World Less USA & Canada

First I want to deal with the portion of the world that reached peak oil about four years ago, in January 2011. That is everywhere else in the world except the US and Canada. I am not saying that every country outside the US and Canada has reached peak oil, but combined they have reached peak oil

The world outside the United States and Canada has been on a bumpy plateau for ten years now and now, even with that last September 2014 surge, is still 1,670,000 barrels below the peak of January 2011. However only a few countries is responsible for this plateau.

The bumpy plateau actually began back in 2005 where the peak was in July. Since them, outside the USA and Canada, there have been 15 countries with production increases and 21 countries with production declines. Here is a look at the 15 winners outside the US and Canada.

Winners

Dealing with the winners one at a time:

Read More
Worldwide Drilling Productivity Report

The EIA publishes what they call a Drilling Productivity Report in which they claim that each rig is getting more productive, that is each rig produces just a little more oil each month than it did the previous month. But over the long haul, I find that the exact opposite is true. In every place in the world, each rig produces a little less oil every year.

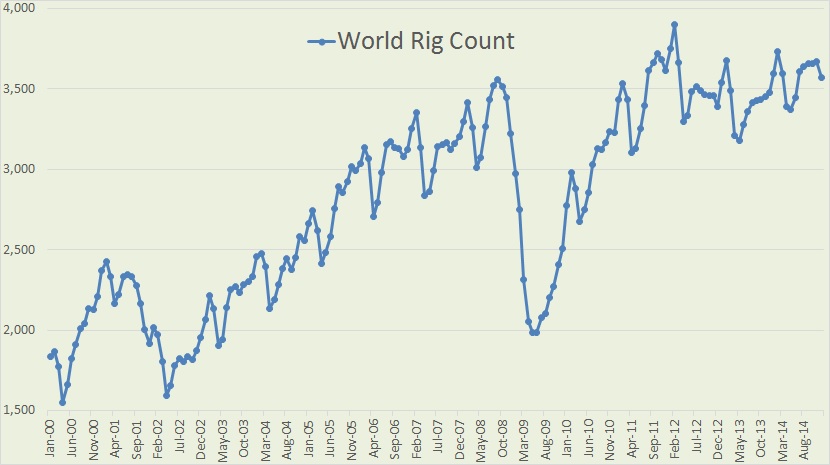
Baker Hughes publishes monthly their International Rig Count where we can find the world rig count back to 1975. However I only looked at the last 15 years and found some surprising results.

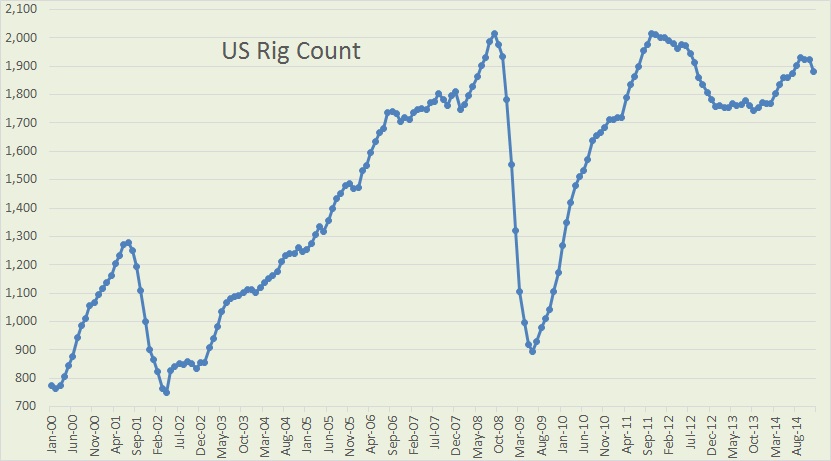
The last “Rig Count” data point on all charts below is December 2014. Also, very important, the rig count includes rigs drilling for gas as well as oil since Baker Hughes does not break down international rigs down to either gas or oil. They just give us the total rig count.World Rig Count

The last price collapse we had, in late 2008, the rig count dropped by over 1,570 between September 2008 and May 2009.US Rig Count

1,114 of that 1,570 rig count decline in 2008 and 2009 came from the US alone. That was the number of rigs dropped by the us between September 2008 and June 2009. Read More

The EIA’s World Oil Production Numbers

The EIA has recently published their International Energy Statistics. Their stats include all liquids such as NGLs, biofuels and even refinery process gain. But I only track actual oil. The EIA does not track “Crude Only” so we are forced to track what they do track which is Crude + Condensate.

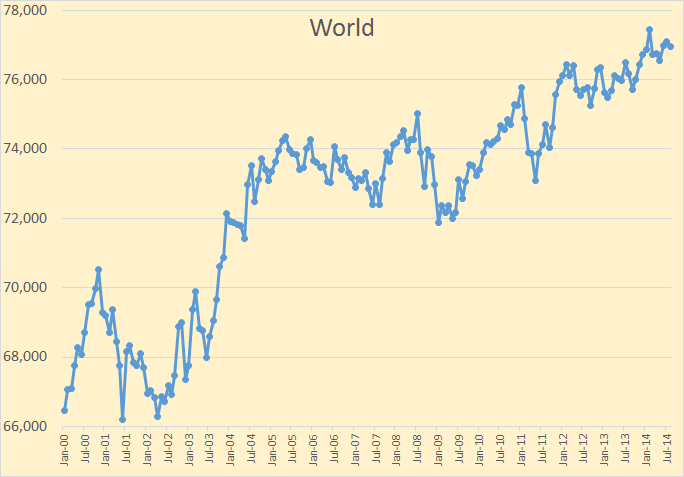
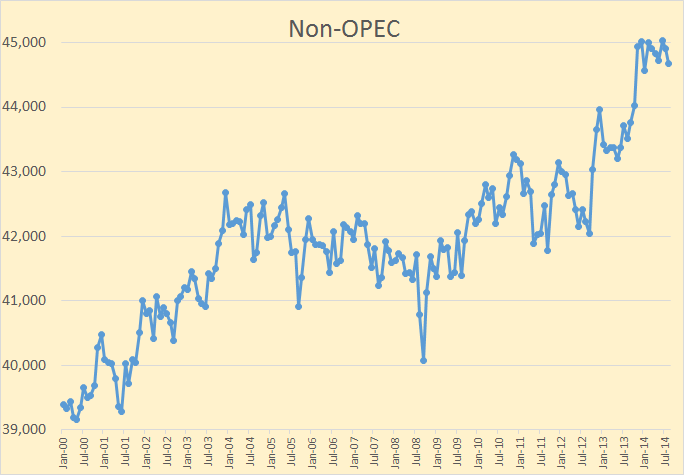
The EIA is about four months behind with their world petroleum data. All data in this report has data through August, 2014 and is in thousand barrels per day.

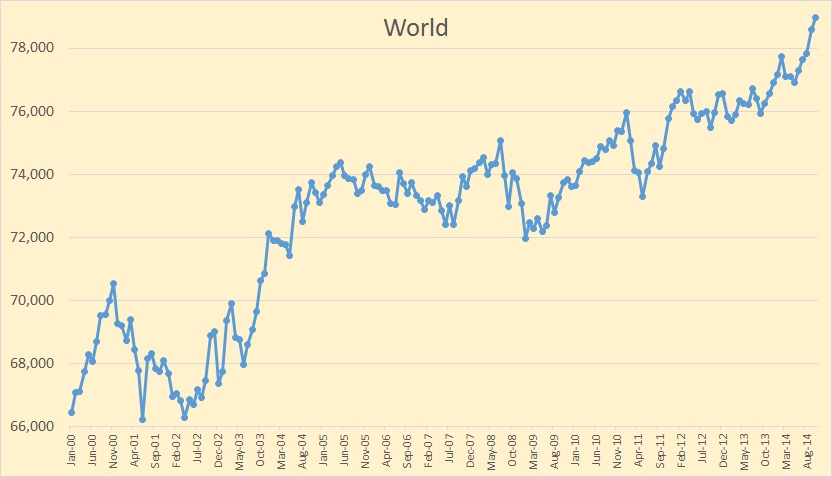
World

World C+C production was down 124,000 barrels per day in August. But according to the IEA it will be up considerably more in September.

Non-OPEC

Non OPEC production shot up in November, 2013 but has made no progress since. Though US production has continued to climb, declines in the rest of the world have kept it from increasing.
Read More

JODI, the EIA and Their Data

There has been very little new data to report lately. The JODI, Joint Organizations Data Initiative, data for March came out a few days ago. JODI is very good as far as the data it reports goes. The problem is there is a lot of data they just don’t report. If a country does not report their production for a given month then JODI just leaves it blank. And some countries they can’t seem to get any data from, so JODI just gives them zero for every month. For those countries I just substitute EIA numbers.

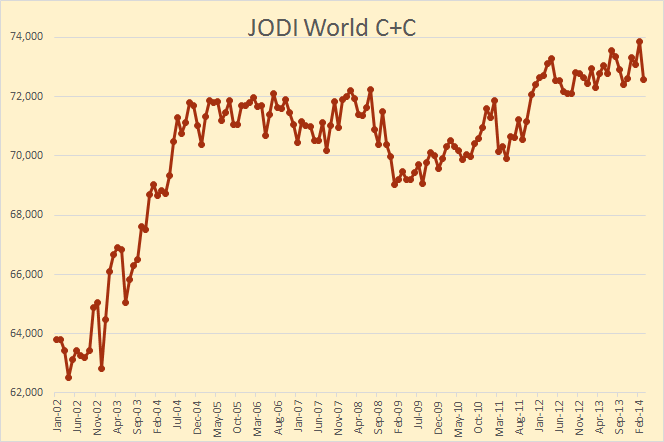
As far as OPEC goes JODI is very political, reporting the inflated numbers that Iran and Venezuela report. I use instead the EIA data for those two countries.  Anyway here is what I have from JODI. The Data is in kb/d, last data point March 2014:

JODI World Total

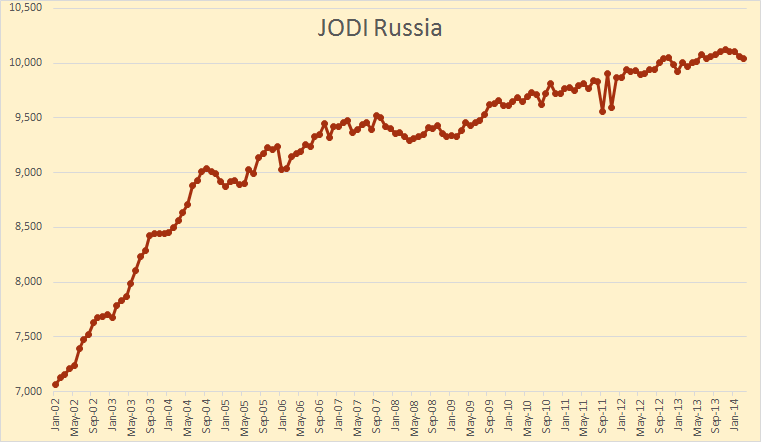
But for a few countries JODI is a pretty good data source. Russia is a good example.

JODI Russia

JODI has Russia peaking, so far, in November at 10,127 kb/d and now about 100 kb/d below that point. Analysis have, for years, been expecting Russian production to decline but new fields in Siberia have kept inching up a little bit each year. But with over 60% of their production still coming from Western Siberia’s giant, largely depleted, fields it looks like that long overdue decline may have finally arrived.
Read More