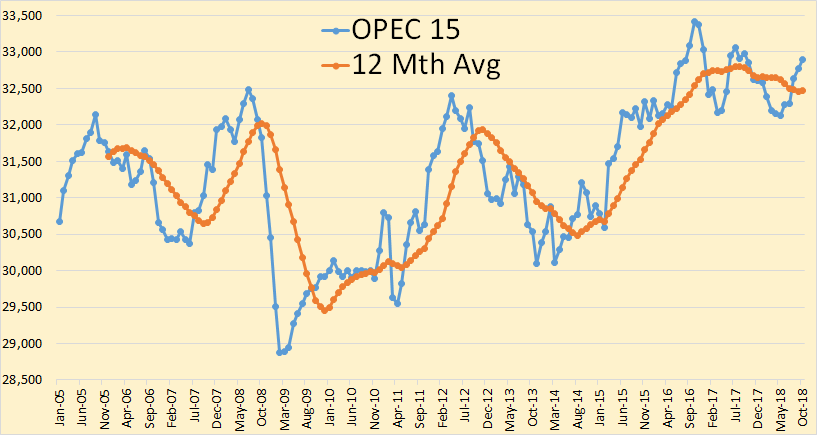
The following OPEC charts were created with data from the OPEC Monthly Oil Market Report. All OPEC charts are through February 2019 and is in thousand barrels per day.
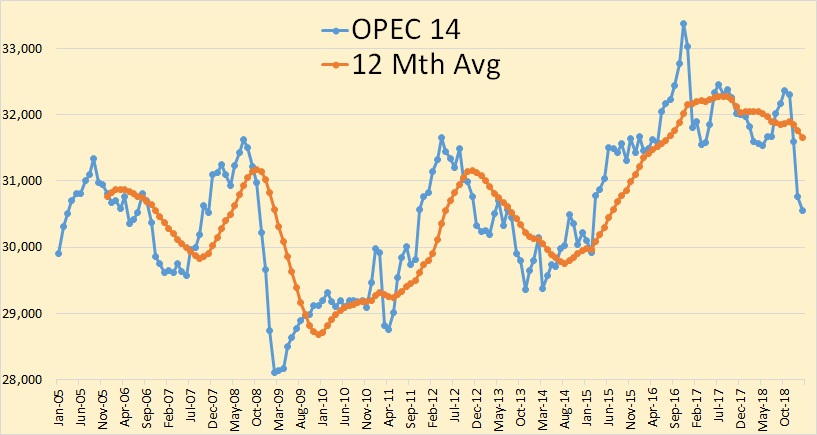
OPEC crude oil production was down 221,000 barrels per day in February. That was after December production had been revised downward by 13,000 bpd and January production revised down by 40,000 bpd.
OPEC 14 crude oil production now stands at 30,549,000 barrels per day. That is the lowest since February 2015. The peak was November 2016 at 33,347,000 bpd. So OPEC production is down 2,798,000 bpd from that point.
There is little doubt that if Libya, Iran and Venezuela had no political problems then OPEC production would exceed that 2016 peak. Iran’s problems will likely be settled in the next couple of years. They will likely recover quite quickly. Libya will take a bit longer to recover to full production if and when their problems are settled. However it will likely take Venezuela a decade or more when and if their problems are ever settled. But it is likely they will collapse even further, closer to zero production, before their situation even starts to turn around.
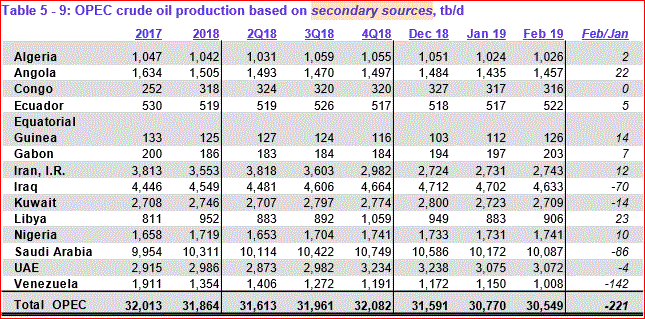
Major decliners in February were Iraq, Kuwait, Saudi Arabia and Venezuela. Everyone else was either relatively flat or up slightly.
